Orchard Floor Management Affects Tree Functionality, Productivity and Water Consumption of a Late Ripening Peach Orchard under Semi-Arid Conditions


Abstract
:1. Introduction
2. Materials and Methods
2.1. Experimental Set-Up and Pedo-Climatic Conditions
2.2. Water Supply and Soil Water Content
2.3. Leaf Functionality and Tree Water Relations
2.4. Fruit Growth and Productivity
2.5. Statystical Analysis
3. Results
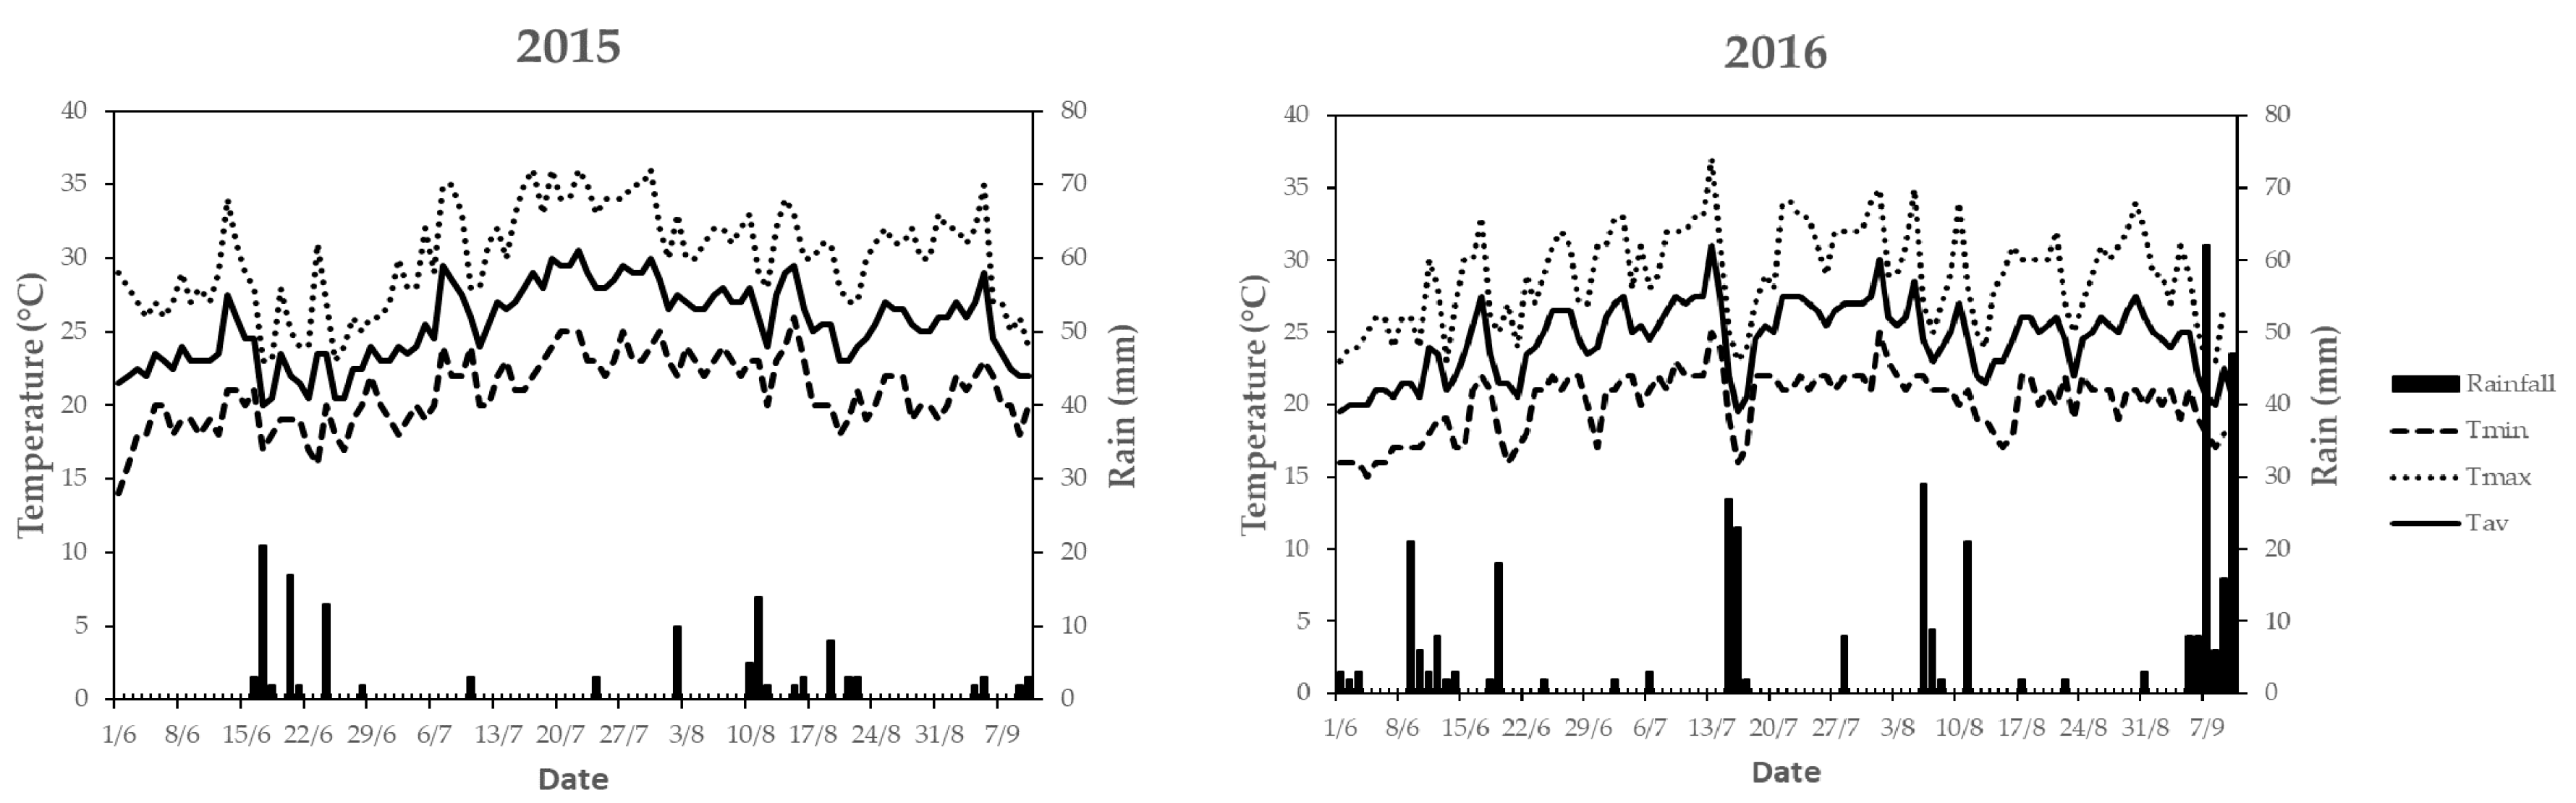
3.1. Pedo-Climatic Conditions
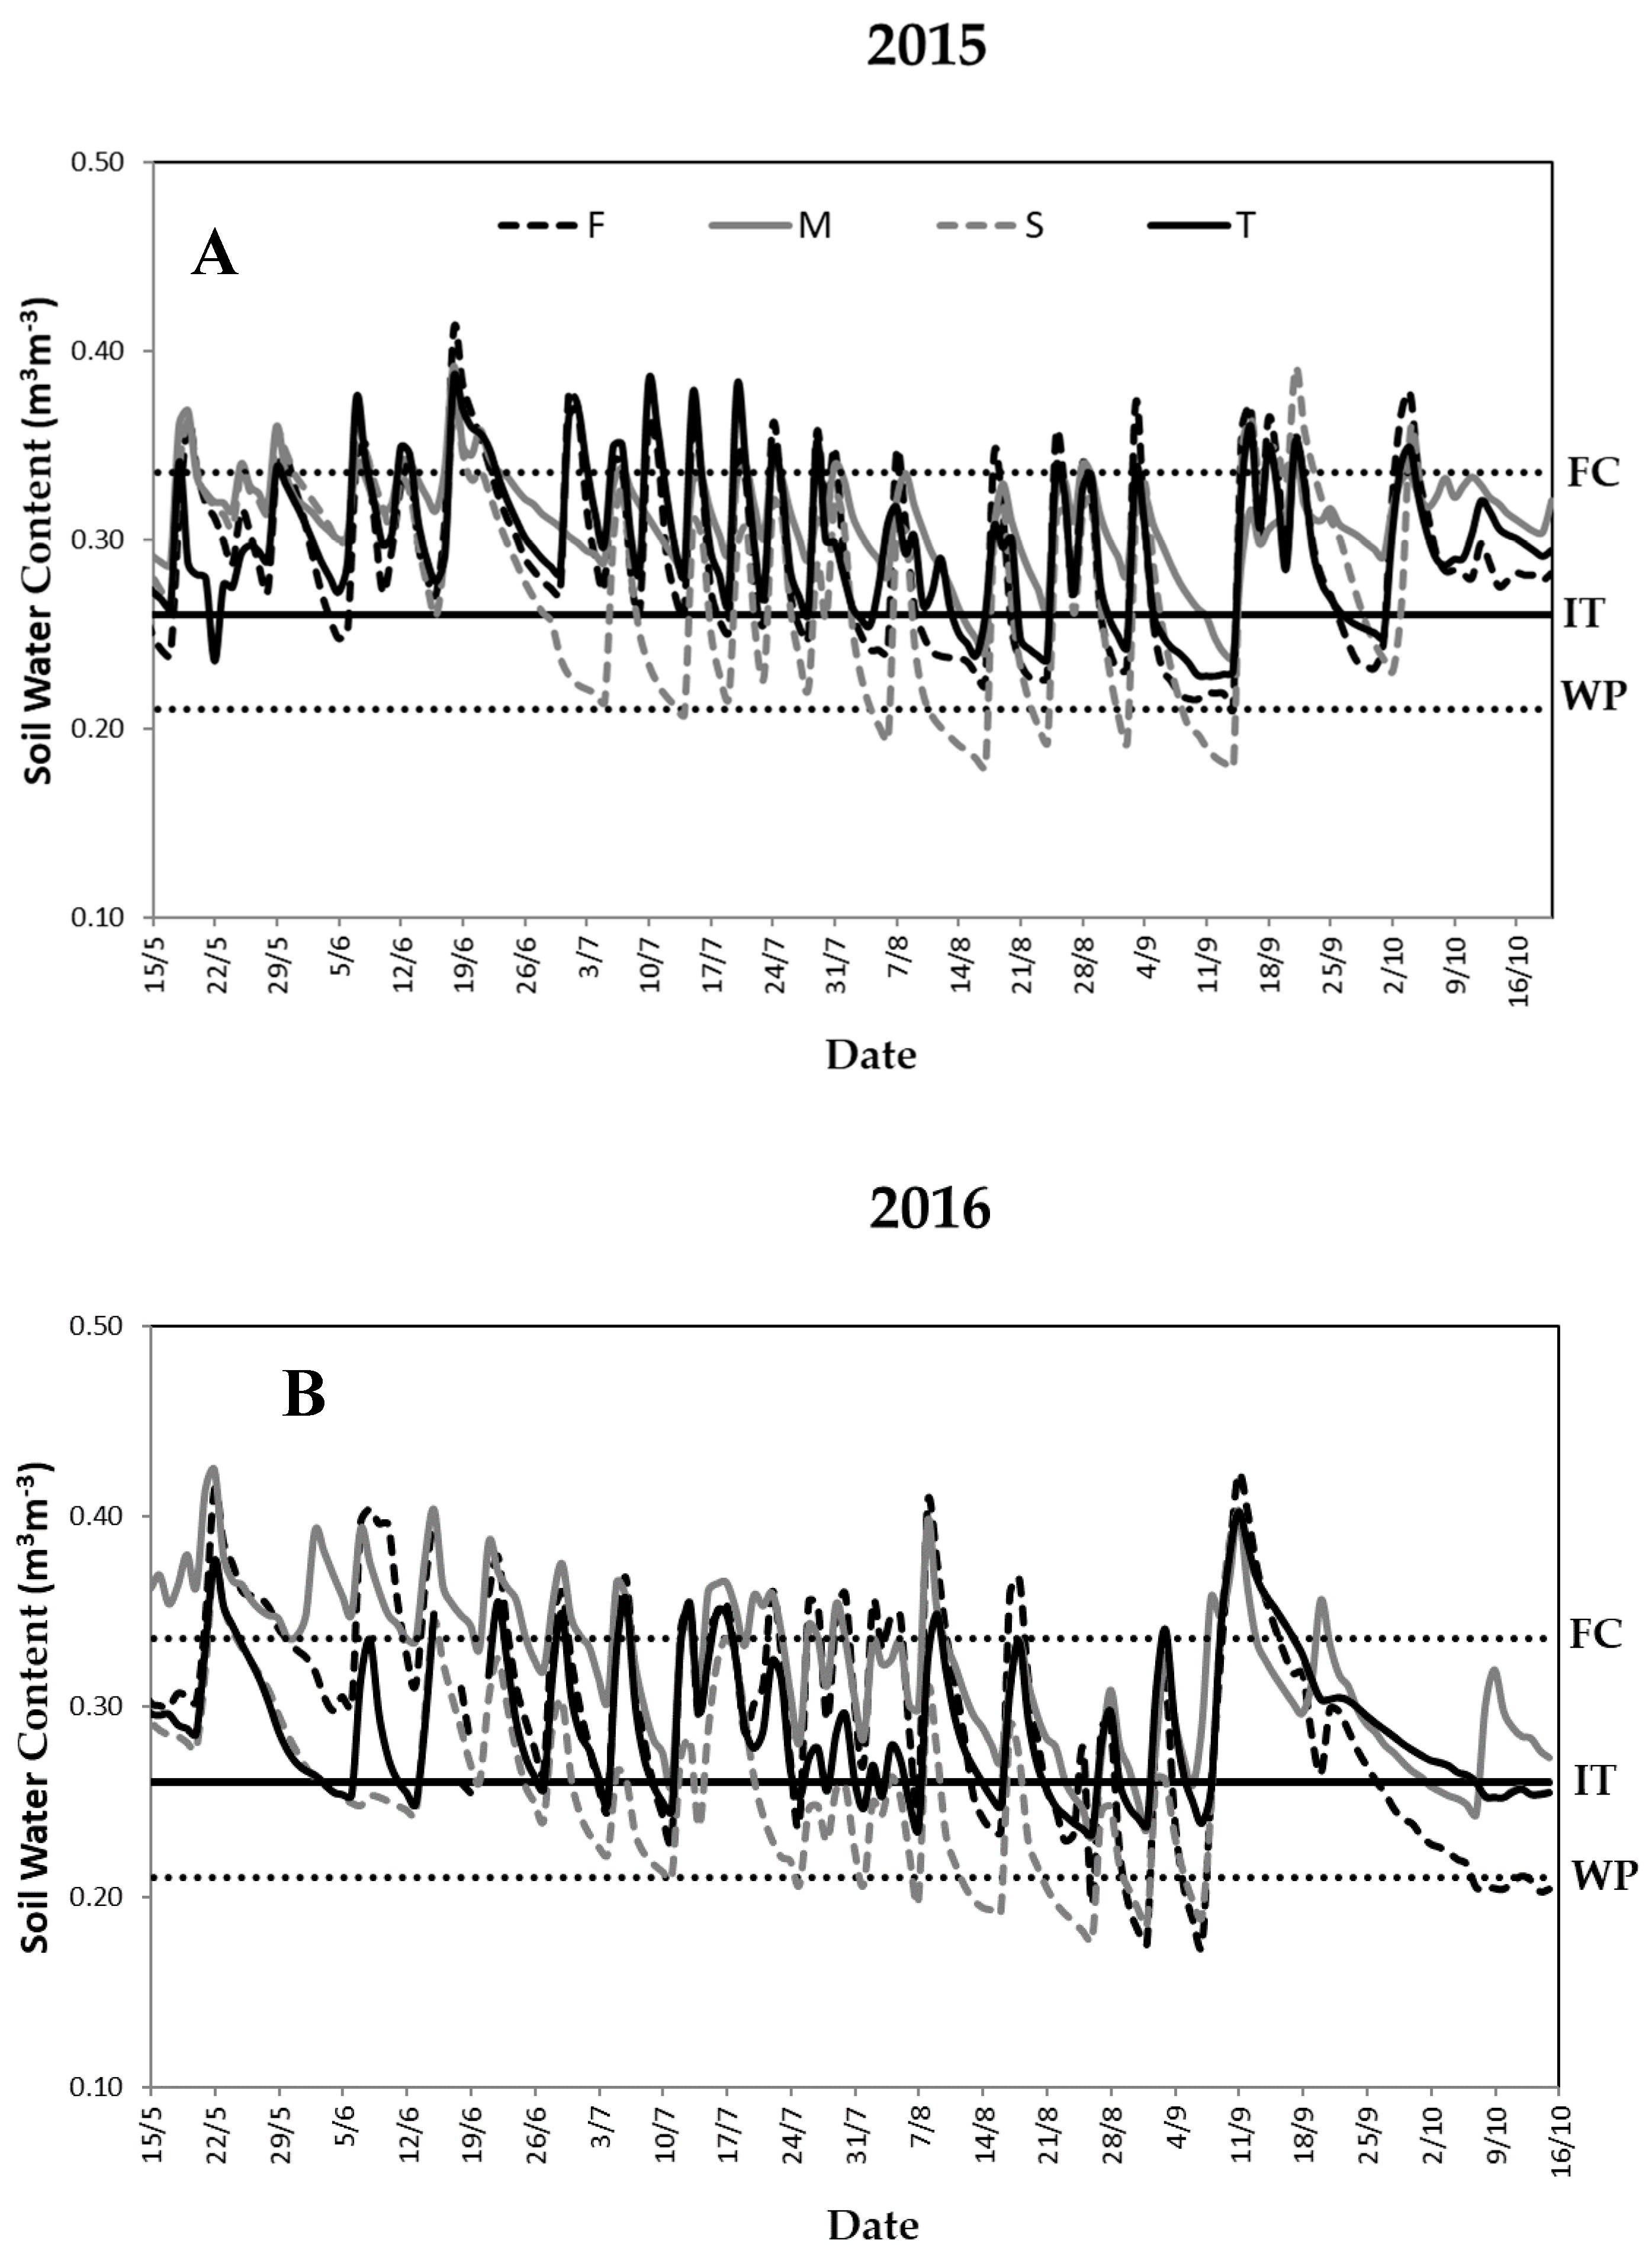
3.2. Water Supply and Soil Water Content
3.3. Leaf Functionality and Tree Water Relations
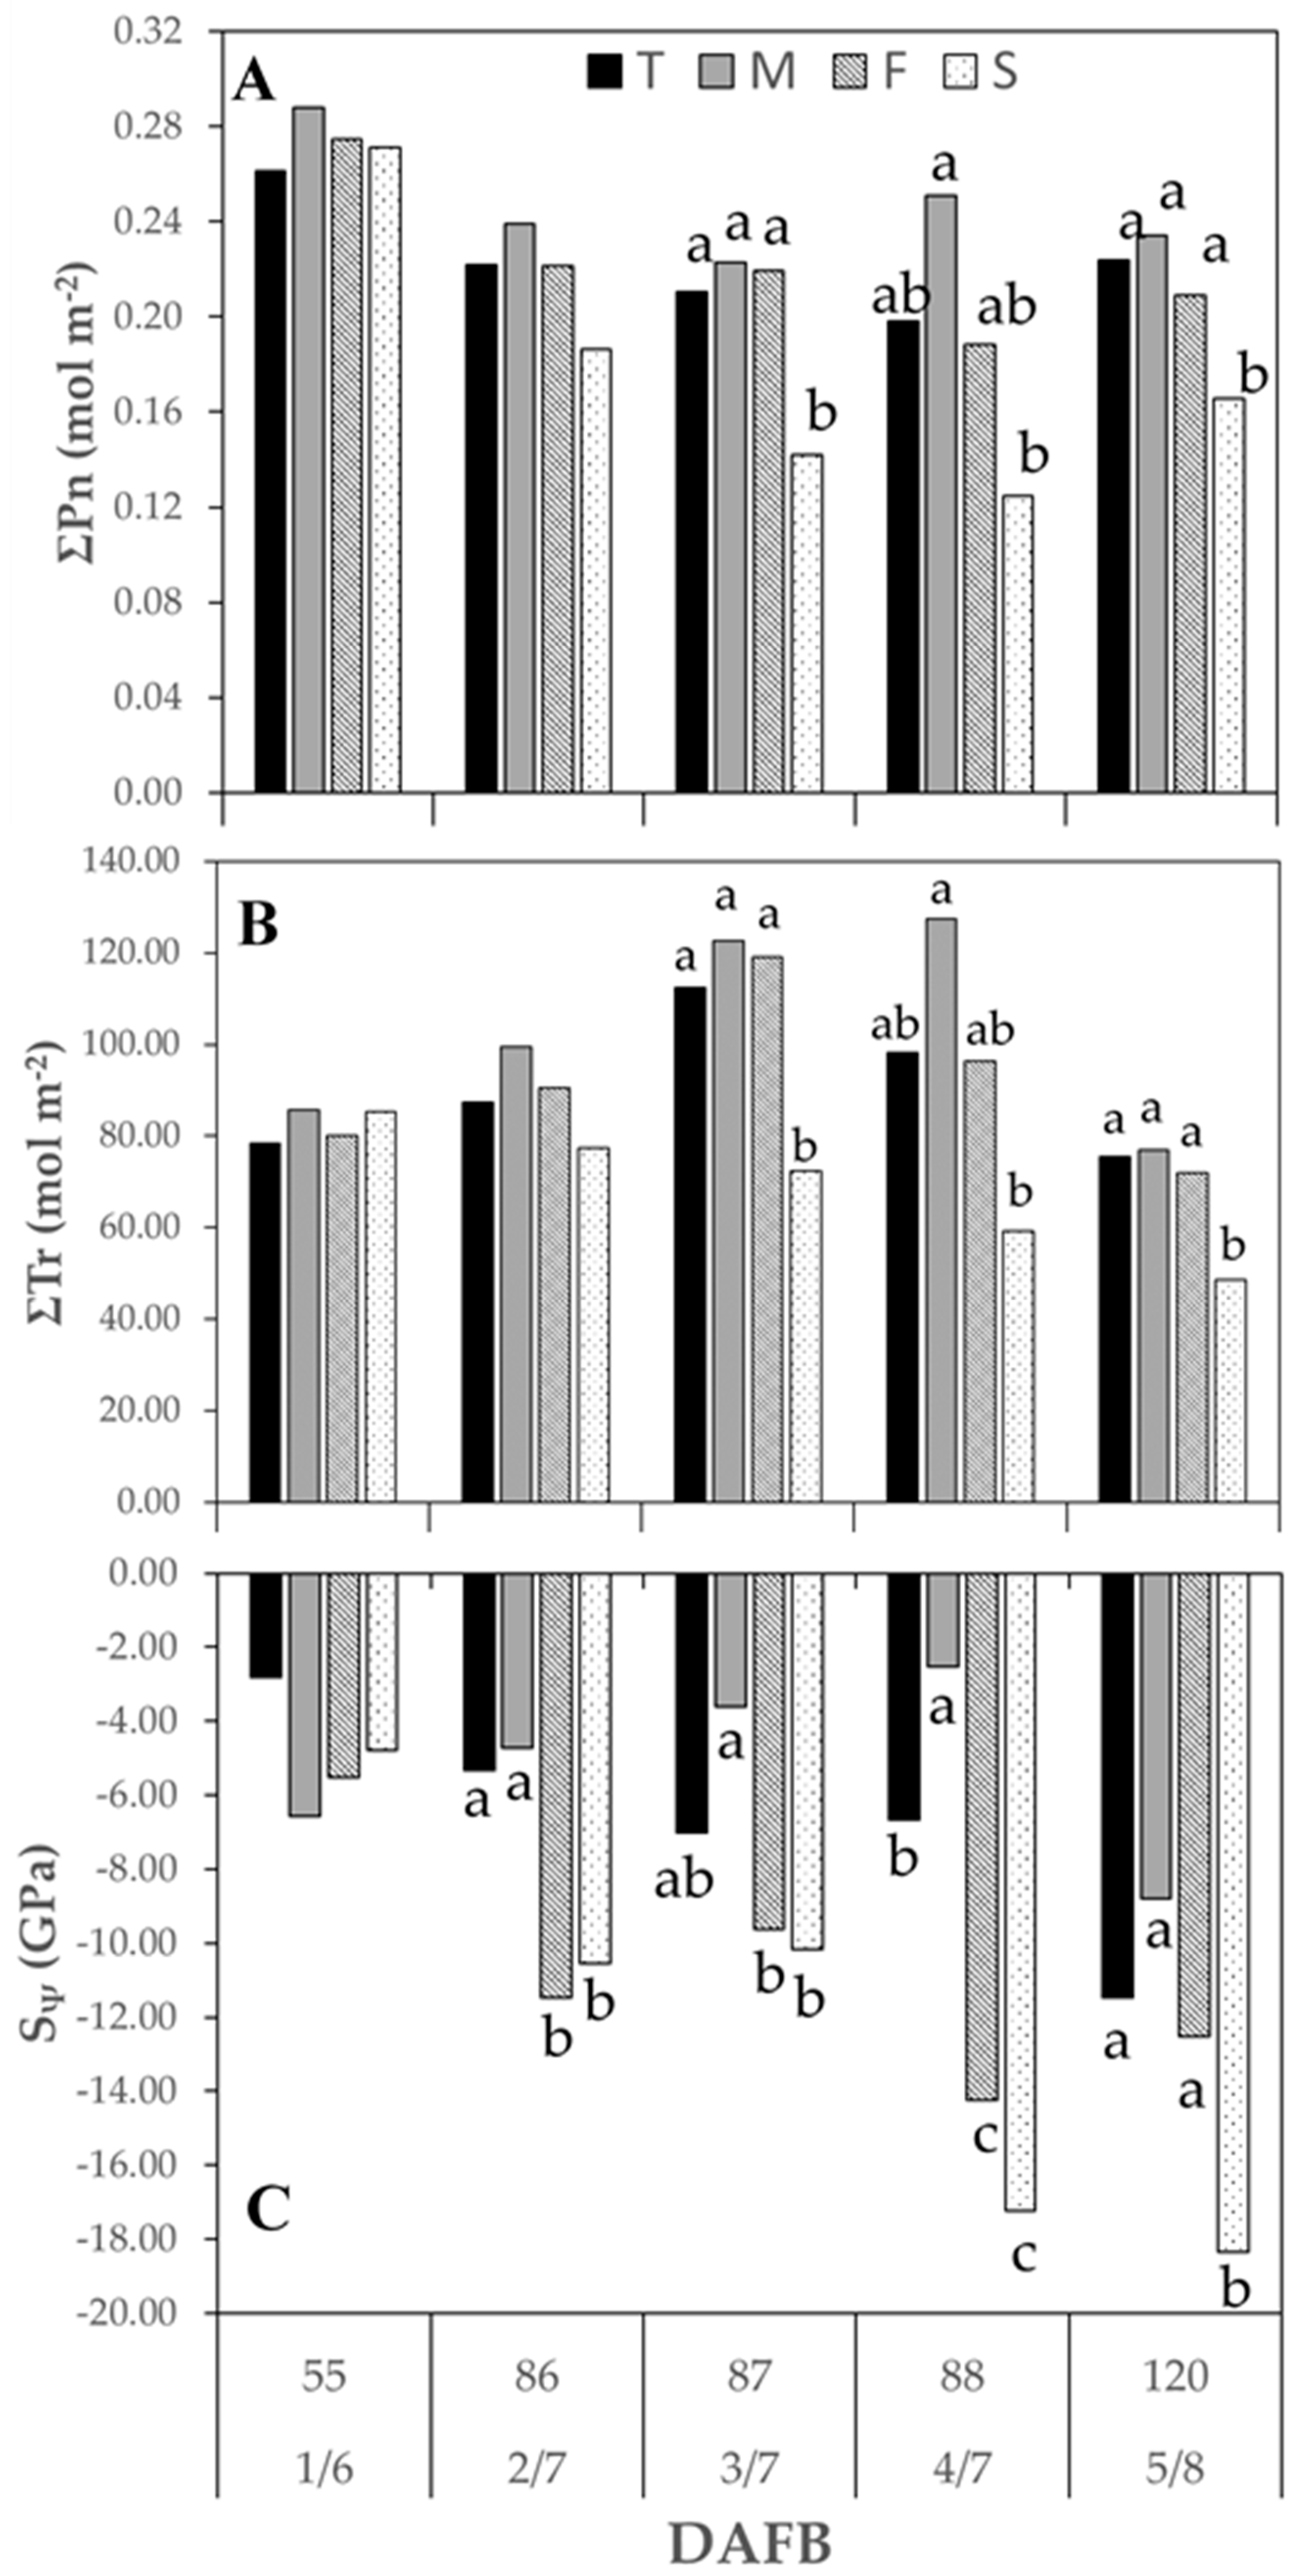
3.3.1. Season 2015
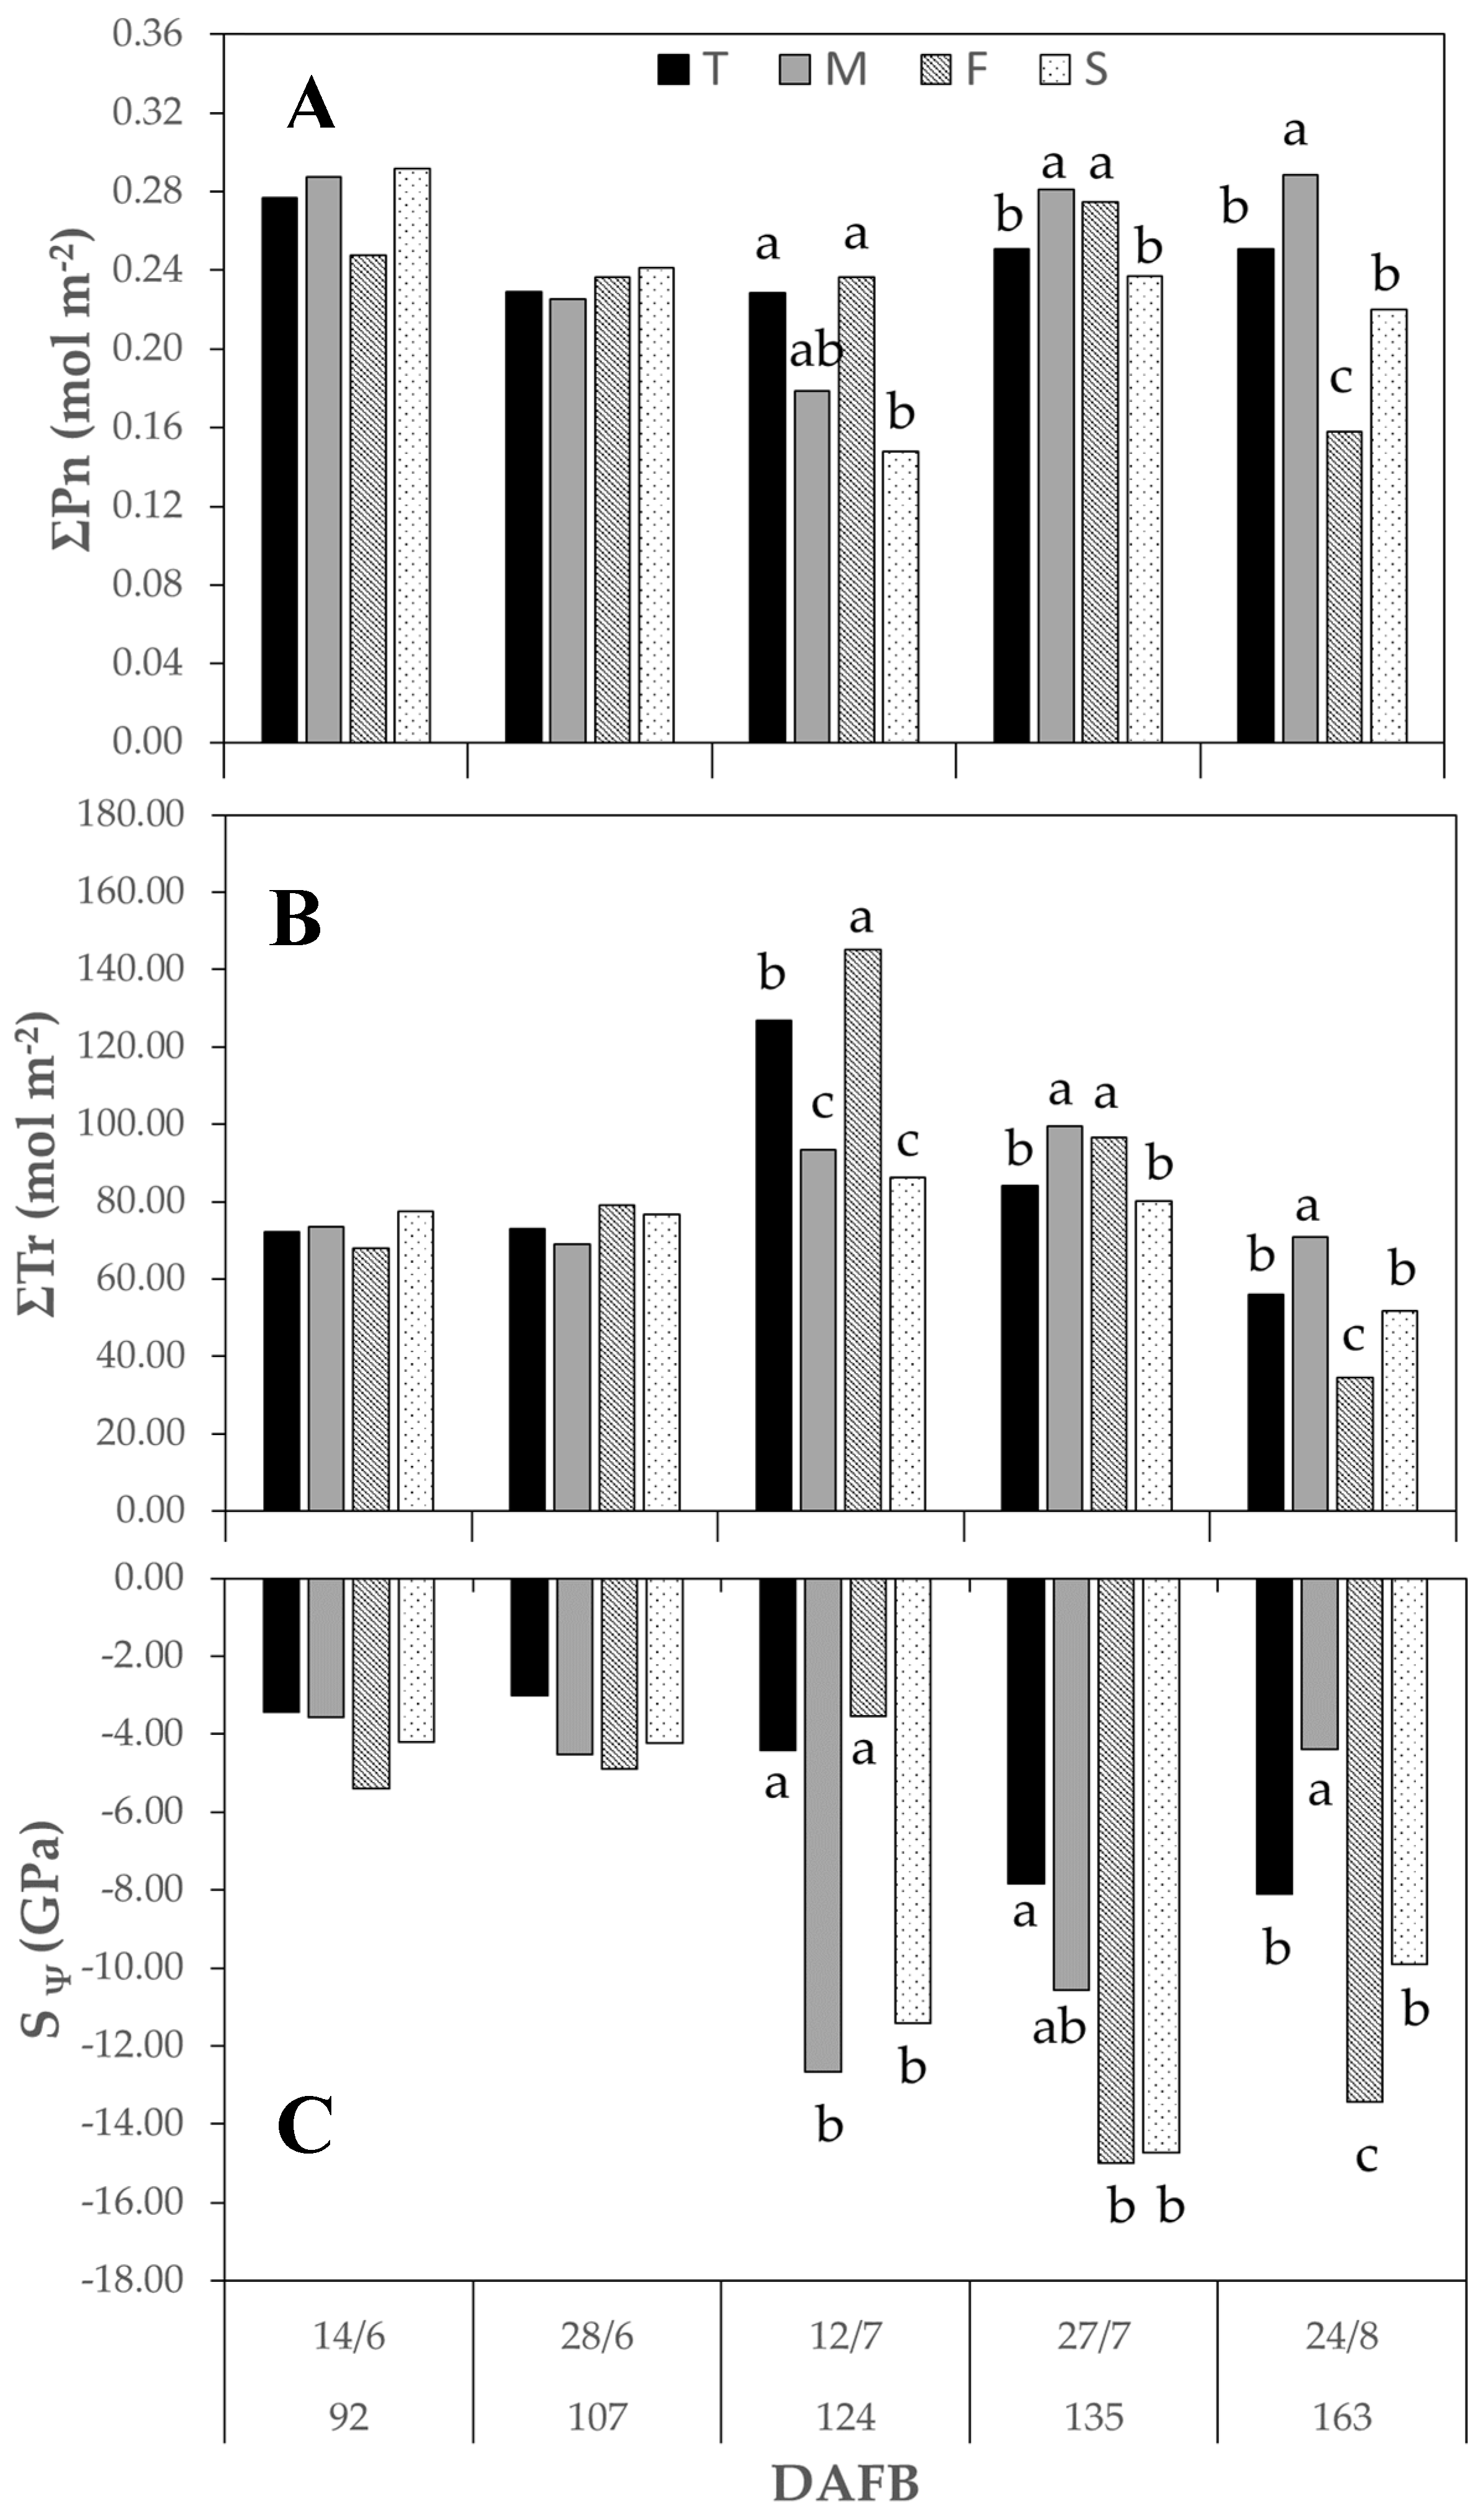
3.3.2. Season 2016
3.4. Fruit Growth and Productivity
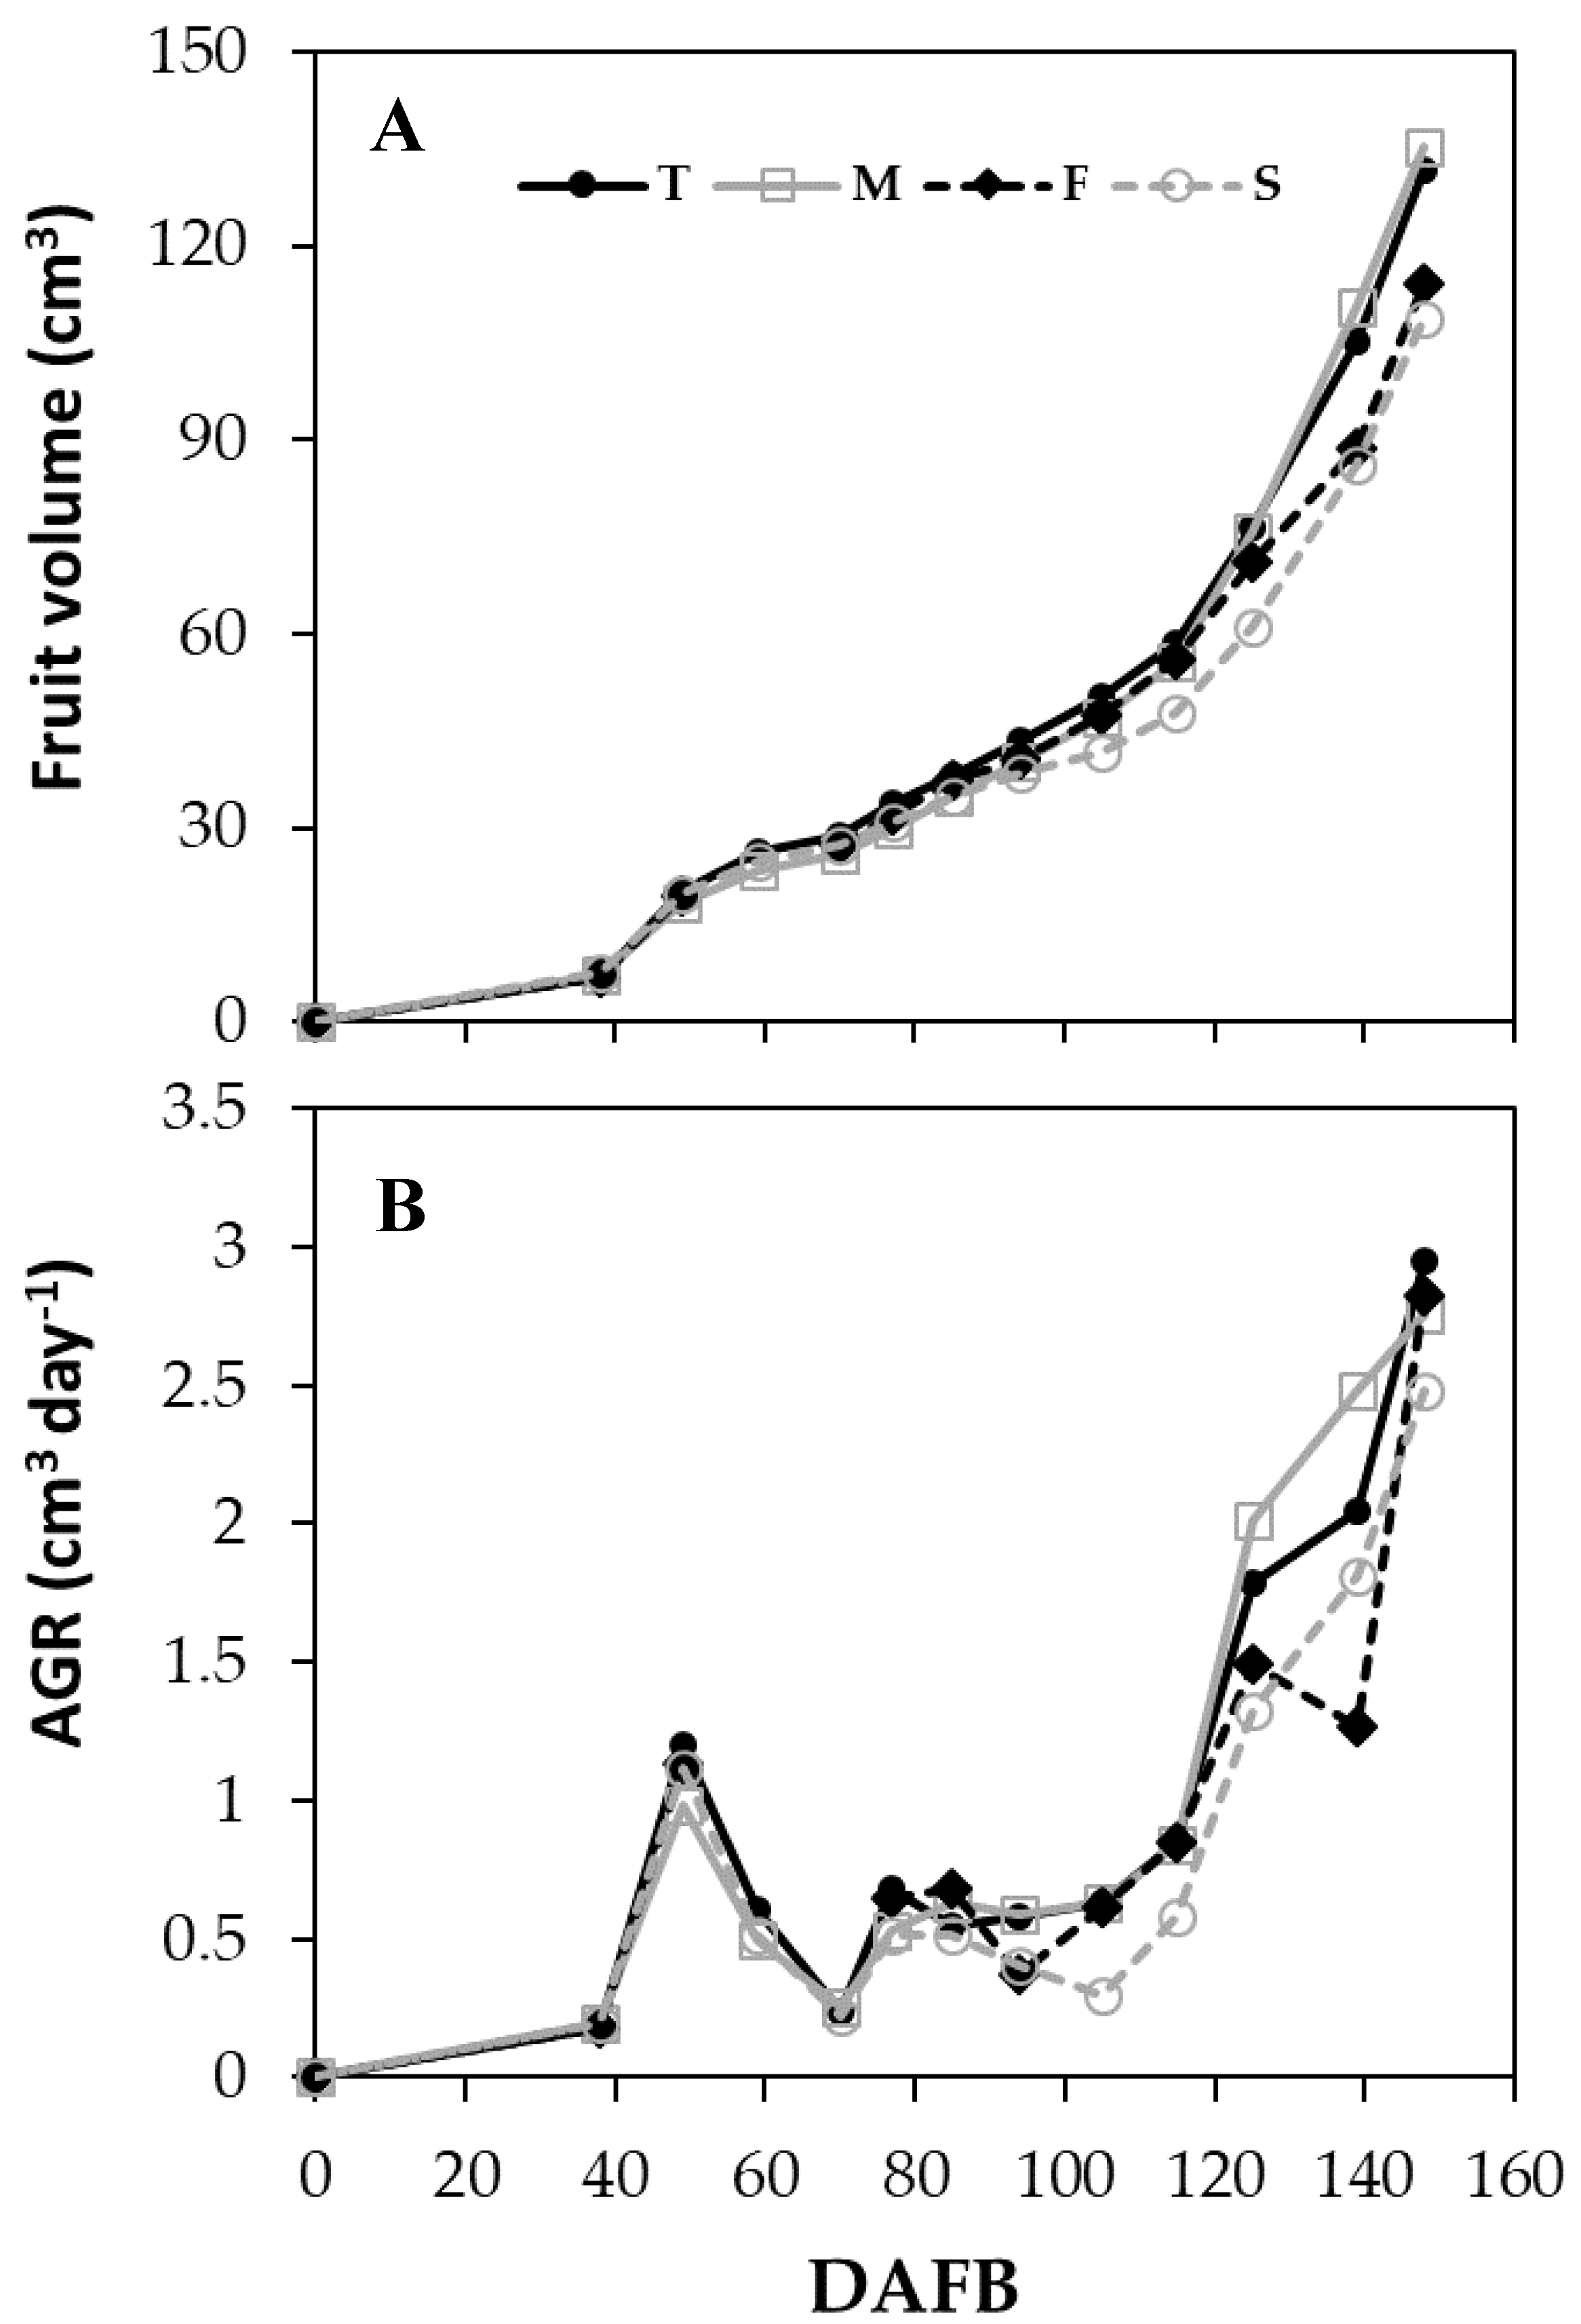
3.4.1. Season 2015
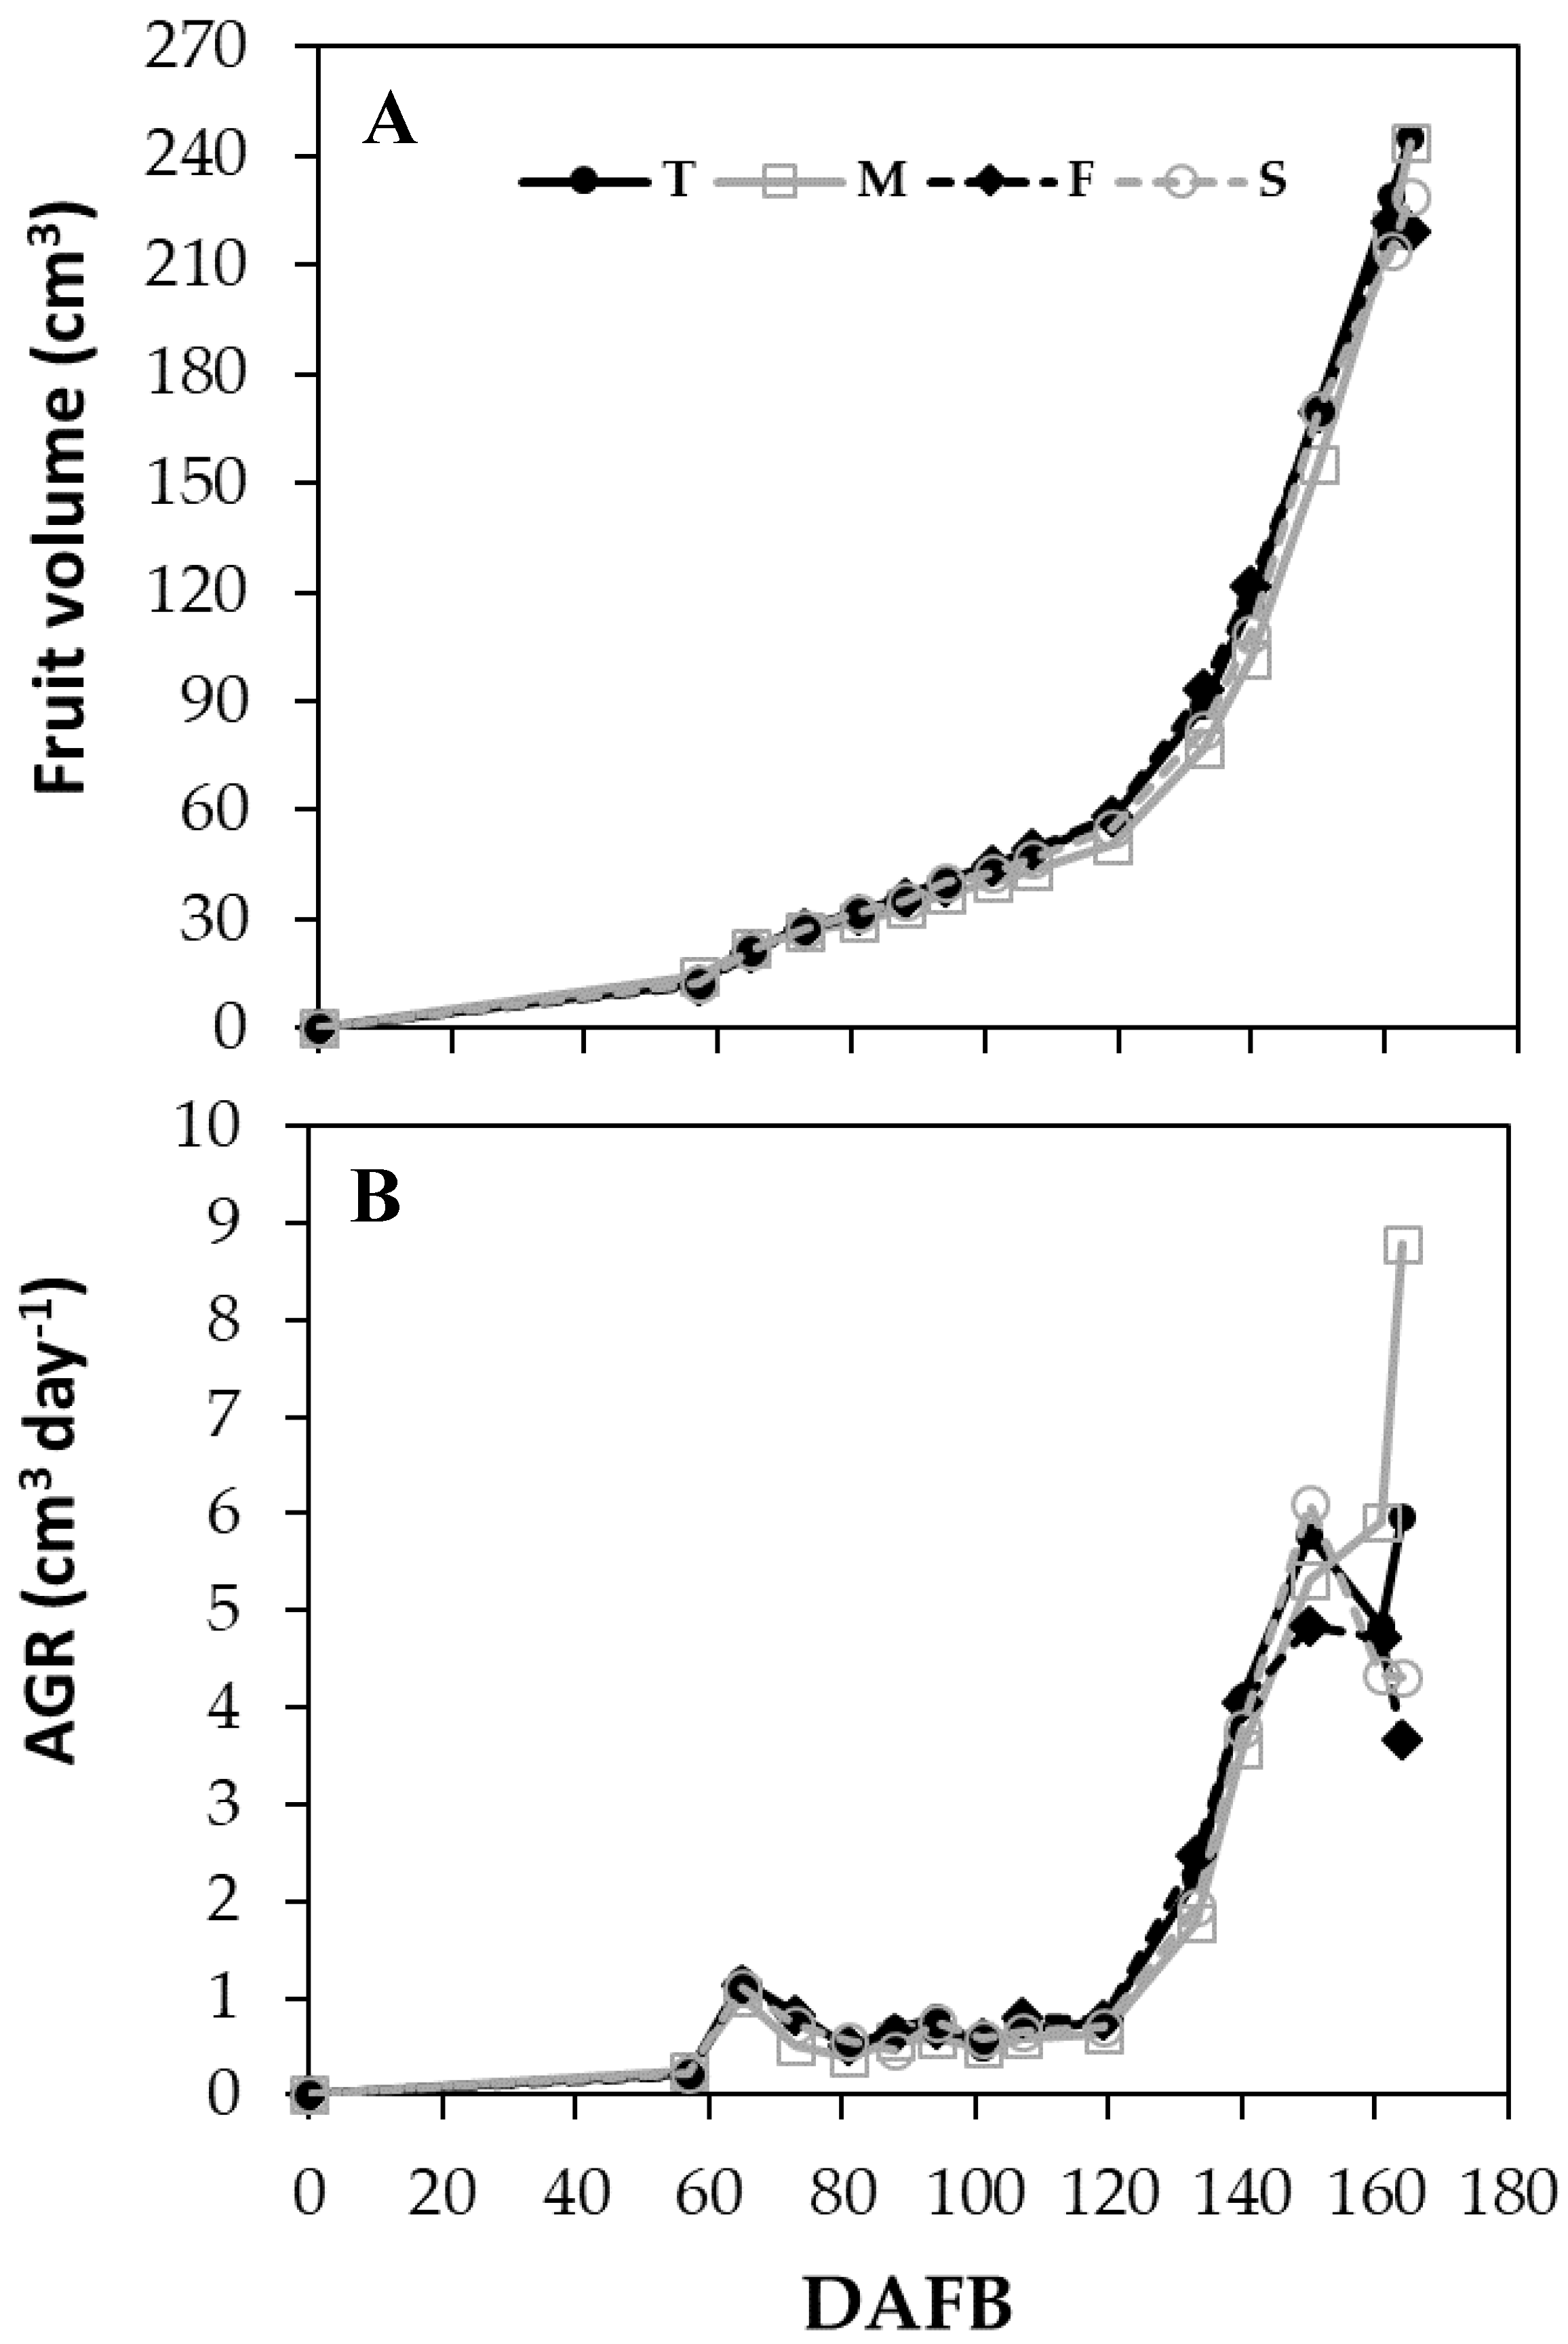
3.4.2. Season 2016
4. Discussion
5. Conclusions
Supplementary Materials
Author Contributions
Funding
Acknowledgments
Conflicts of Interest
References
- Morandi, B.; Manfrini, L.; Zibordi, M.; Corelli-Grappadelli, L.; Losciale, P. From fruit anatomical features to fruit growth strategy: Is there a relationship? Acta Hortic. 2016, 1130, 185–191. [Google Scholar] [CrossRef]
- Tous, J.; Ferguson, L. Mediterranean fruits. In Progress in New Crops; Janick, J., Ed.; ASHS Press: Arlington, VA, USA, 1996; pp. 416–430. [Google Scholar]
- Charles, M.; Corollaro, M.L.; Manfrini, L.; Endrizzi, I.; Aprea, E.; Zanella, A.; Corelli Grappadelli, L.; Gasperi, F. Application of a sensory-instrumental tool to study apple texture characteristics shaped by altitude and time of harvest. J. Sci. Food Agric. 2018, 98, 1095–1104. [Google Scholar] [CrossRef] [PubMed]
- Corollaro, M.L.; Manfrini, L.; Endrizzi, I.; Aprea, E.; Demattè, M.L.; Charles, M.; Bergamaschi, M.; Biasioli, F.; Zibordi, M.; Corelli Grappadelli, L.; et al. The effect of two orchard light management practices on the sensory quality of apple: Fruit thinning by shading or photo-selective nets. J. Hort. Sci. Biotech. 2015, 90, 99–107. [Google Scholar] [CrossRef]
- Demestihas, C.; Plénet, D.; Génard, M.; Raynal, C.; Lescourret, F. Ecosystem services in orchards. A review. Agron. Sustain. Dev. 2017. [Google Scholar] [CrossRef]
- Morandi, B.; Manfrini, L.; Losciale, P.; Zibordi, M.; Corelli Grappadelli, L. The positive effect of skin transpiration in peach fruit growth. J. Plant. Phys. 2010, 167, 1033–1037. [Google Scholar] [CrossRef]
- Lopez, G.; Boini, A.; Manfrini, L.; Torres-Ruiz, J.M.; Pierpaoli, E.; Zibordi, M.; Losciale, P.; Morandi, B.; Corelli-Grappadelli, L. Effect of shading and water stress on light interception, physiology and yield of apple trees. Agr. Water Manag. 2018, 210, 140–148. [Google Scholar] [CrossRef]
- Perulli, G.D.; Bresilla, K.; Manfrini, L.; Boini, A.; Sorrenti, G.; Corelli Grappadelli, L.; Morandi, B. Beneficial effect of secondary treated wastewater irrigation on nectarine tree physiology. Agr. Water Manag. 2019, 221, 120–130. [Google Scholar] [CrossRef]
- González-Hidalgo, J.C.; Pena-Monné, J.L.; de Luis, M. A review of daily soil erosion in Western Mediterranean areas. Catena 2007, 71, 193–199. [Google Scholar] [CrossRef]
- Ventrella, D.; Stellacci, A.M.; Castrignanò, A.; Charfeddine, M.; Castellini, M. Effects of crop residue management on winter durum wheat productivity in a long term experiment in Southern Italy. Eur. J. Agron. 2016, 77, 188–198. [Google Scholar] [CrossRef]
- Vinyes, E.; Asin, L.; Alegre, S.; Muñoz, P.; Boschmonart, J.; Gasol, C.M. Life Cycle Assessment of apple and peach production, distribution and consumption in Mediterranean fruit sector. J. Clean. Prod. 2017, 149, 313–320. [Google Scholar] [CrossRef]
- Water for Sustainable Food and Agriculture FAO Report 2017. Available online: http://www.fao.org/3/a-i7959e.pdf (accessed on 6 November 2020).
- Yaghi, T.; Arslan, A.; Naoum, F. Cucumber (Cucumis sativus L.) water use efficiency (WUE) under plastic mulch and drip irrigation. Agric. Water Manag. 2013, 128, 149–157. [Google Scholar] [CrossRef] [Green Version]
- Wang, C.; Wang, H.; Zhao, X.; Chen, B.; Wang, F. Mulching affects photosynthetic and chlorophyll a fluorescence characteristics during stage III of peach fruit growth on the rain-fed semiarid Loess Plateau of China. Sci. Hortic. 2015, 194, 246–254. [Google Scholar] [CrossRef]
- Campi, P.; Gaeta, L.; Mastrorilli, M.; Losciale, P. Innovative Soil Management and Micro-Climate Modulation for Saving Water in Peach Orchards. Front. Plant Sci. 2020, 11. [Google Scholar] [CrossRef] [PubMed]
- Fan, J.; Gao, Y.; Wang, Q.; Sukhdev, S.M.; Li, Y. Mulching effects on water storage in soil and its depletion by alfalfa in the Loess Plateau of northwestern China. Agric. Water Manag. 2014, 138, 10–16. [Google Scholar]
- Diacono, M.; Fiore, A.; Farina, R.; Canali, S.; Di Bene, C.; Testani, E.; Montemurro, F. Combined Agro-ecological Strategies for Adaptation of Organic Horticultural Systems to Climate Change in Mediterranean Environment. Ital. J. Agron. 2016, 11, 85–91. [Google Scholar] [CrossRef]
- Antichi, D.; Sbrana, M.; Martelloni, L.; Abou Chehade, L.; Fontanelli, M.; Raffaelli, M.; Mazzoncini, M.; Peruzzi, A.; Frasconi, C. Agronomic Performances of Organic Field Vegetables Managed with Conservation Agriculture Techniques: A Study from Central Italy. Agronomy 2019, 9, 810. [Google Scholar] [CrossRef] [Green Version]
- Tosti, G.; Benincasa, P.; Farneselli, M.; Guiducci, M.; Onofri, A.; Tei, F. Processing Tomato–Durum Wheat Rotation under Integrated, Organic and Mulch-Based No-Tillage Organic Systems: Yield, N Balance and N Loss. Agronomy 2019, 9, 718. [Google Scholar] [CrossRef] [Green Version]
- Salomé, C.; Coll, P.; Lardo, E.; Metay, A.; Villenave, C.; Marsden, C.; Blanchart, E.; Hinsinger, P.; Le Cadre, E. The soil quality concept as a framework to assess management practices in vulnerable agroecosystems: A case study in Mediterranean vineyards. Ecol. Indic. 2016, 61, 456–465. [Google Scholar] [CrossRef]
- Tarricone, L.; Debiase, G.; Masi, G.; Gentilesco, G.; Montemurro, F. Cover Crops Affect Performance of Organic Scarlotta Seedless Table Grapes Under Plastic Film Covering in Southern Italy. Agronomy 2020, 10, 550. [Google Scholar] [CrossRef] [Green Version]
- Almagro, M.; Garcia-Franco, N.; Martínez-Mena, M. The potential of reducing tillage frequency and incorporating plant residues as a strategy for climate change mitigation in semiarid Mediterranean agroecosystems. Agric. Ecosyst. Environ. 2017, 246, 210–220. [Google Scholar] [CrossRef]
- Montanaro, G.; Dichio, B.; Briccoli Bati, C.; Xiloyannis, C. Soil management affects carbon dynamics and yield in a Mediterranean peach orchard. Agric. Ecosyst. Environ. 2012, 161, 46–54. [Google Scholar] [CrossRef]
- Losciale, P.; Manfrini, L.; Morandi, B.; Pierpaoli, E.; Zibordi, M.; Stellacci, A.M.; Salvati, L.; Corelli Grappadelli, L. A multivariate approach for assessing leaf photoassimilation performance using the IPL index. Physiol. Plant. 2015, 154, 609–620. [Google Scholar] [CrossRef] [PubMed]
- Manfrini, L.; Pierpaoli, E.; Zibordi, M.; Morandi, B.; Muzzi, E.; Losciale, P.; Corelli Grappadelli, L. Monitoring strategies for precise production of high-quality fruit and yield in apple in Emilia-Romagna. Chem. Eng. Trans. 2015, 44, 301–306. [Google Scholar]
- Manfrini, L.; Corelli Grappadelli, L.; Morandi, B.; Losciale, P.; Taylor, J.A. Innovative approaches to orchard management: Assessing the variability in yield and maturity in a ‘Gala’ apple orchard using a simple management unit modeling approach. Eur. J. Hortic. Sci. 2020, 84, 1–8. [Google Scholar] [CrossRef]
- Jordan, M.O.; Vercambre, G.; Gomez, L.; Pagès, L. The early spring N uptake of young peach trees (Prunus persica) is affected by past and current fertilizations and levels of C and N stores. Tree Physiol. 2014, 34, 61–72. [Google Scholar] [CrossRef] [Green Version]
- Morandi, B.; Boselli, F.; Boini, A.; Manfrini, L.; Corelli Grappadelli, L. The fruit as a potential indicator of plant water status in apple. Acta Hortic. 2017, 1150, 83–90. [Google Scholar] [CrossRef]
- Tozzi, F.; van Hooijdonk, B.M.; Tustin, D.S.; Corelli Grappadelli, L.; Morandi, B.; Losciale, P.; Manfrini, L. Photosynthetic Performance and Vegetative Growth in a New Red Leaf Pear: Comparison of Scion Genotypes Using a Complex, Grafted-Plant System. Front. Plant Sci. 2018. [Google Scholar] [CrossRef] [Green Version]
- Ham, J.M.; Kluitenberg, G.J.; Lamont, W.J. Optical properties of plastic mulches affect the field temperature regime. J. Amer. Soc. Hort. Sci. 1993, 118, 188–193. [Google Scholar] [CrossRef] [Green Version]
- Zheng, W.; Wen, M.; Zhao, Z.; Liu, J.; Wang, Z.; Zhai, B.; Li, Z. Black plastic mulch combined with summer cover crop increases the yield and water use efficiency of apple tree on the rainfed Loess Plateau. PLoS ONE 2017, 12. [Google Scholar] [CrossRef]
- Okie, W.R. Handbook of Peach and Nectarine Varieties—Agriculture Handbook number 714; U.S. Department of Agriculture; Agricultural Research Service: Washington, DC, USA, 1998; p. 42.
- Campi, P.; Palumbo, A.D.; Mastrorilli, M. Evapotranspiration estimation of crops protected by windbreak in a Mediterranean region. Agr. Water Manag. 2012, 104, 153–162. [Google Scholar] [CrossRef]
- U.S. Department of Agriculture; Soil Conservation Service. Soil Taxonomy: A Basic System of Soil Classification for Making and Interpreting Soil Surveys; Soil Survey Staff, 1975 Department of Agriculture Handbook 436; U.S. Government Printing Office: Washington, DC, USA, 1975.
- Allen, R.G.; Pereira, L.S.; Raes, D.; Smith, M. Crop Evapotranspiration. Guide-Lines for Computing Crop Water Requirements. FAO Irrigation and Drainage Paper No. 56; FAO—Food and Agriculture Organization of the United Nations: Rome, Italy, 1998. [Google Scholar]
- Campi, P.; Navarro, A.; Palumbo, A.D.; Modugno, F.; Vitti, C.; Mastrorilli, M. Energy of biomass sorghum irrigated with reclaimed wastewaters. Eur. J. Agron. 2016, 76, 176–185. [Google Scholar] [CrossRef]
- Naor, A.; Klein, I.; Doron, I. Stem water potential and apple size. J. Am. Soc. Hortic. Sci. 1995, 120, 577–582. [Google Scholar] [CrossRef] [Green Version]
- Losciale, P.; Chow, W.S.; Corelli Grappadelli, L. Modulating the light environment with the peach “asymmetric orchard”: Effects on gas exchange performances, photoprotection, and photoinhibition. J. Exp. Bot. 2010, 61, 1177–1192. [Google Scholar] [CrossRef] [PubMed] [Green Version]
- Myers, B.J. Water stress integral. A link between short-term stress and long-term growth. Tree Physiol. 1988, 4, 315–323. [Google Scholar] [CrossRef]
- Fernández, M.D.; Hueso, J.J.; Cuevas, J. Water stress integral for successful modification of flowering dates in ‘Algerie’ loquat. Irrig. Sci. 2010, 28, 127–134. [Google Scholar] [CrossRef]
- Fernández, J.E.; Alcon, F.; Diaz-Espejo, A.; Hernandez-Santana, V.; Cuevas, M.V. Water use indicators and economic analysis for on-farm irrigation decision: A case study of a super high density olive tree orchard. Agr. Water Manag. 2020, 237. [Google Scholar] [CrossRef]
- Davidson, E.A.; Janssens, I.A. Temperature sensitivity of soil carbon decomposition and feedbacks to climate change. Nature 2006, 440, 165–173. [Google Scholar] [CrossRef]
- Abdelhafez, A.A.; Abbas, M.H.H.; Attia, T.M.S.; El Bably, W.; Mahrous, S.E. Mineralization of organic carbon and nitrogen in semi-arid soils under organic and inorganic fertilization. Environ. Technol. Innov. 2018, 9, 243–253. [Google Scholar] [CrossRef]
- Cramer, M.D.; Hawkins, H.J.; Verboom, G.A. The importance of nutritional regulation of plant water flux. Oecologia 2009, 161, 15–24. [Google Scholar] [CrossRef]
- Sardans, J.; Peñuelas, J. Increasing drought decreases phosphorus availability in an evergreen Mediterranean forest. Plant. Soil 2004, 267, 367–377. [Google Scholar] [CrossRef]
- Eberbach, P.L.; Humphreys, E.; Kukal, S.S. The effect of rice straw mulch on evapotranspiration, transpiration and soil evaporation of irrigated wheat in Punjab, India. Agric. Water Manag. 2011, 98, 1847–1855. [Google Scholar]
- Ritchie, J.T.; Adams, J.E. Field measurement of evaporation from soil shrinkage cracks. Soil Sci. Soc. Am. Proc. 1974, 38, 131–134. [Google Scholar] [CrossRef]
- Flexas, J.; Bota, J.; Escalona, J.M.; Sampol, B.; Medrano, H. Effects of drought on photosynthesis in grapevines under field conditions: An evaluation of stomatal and mesophyll limitations. Funct. Plant. Biol. 2002, 29, 461–471. [Google Scholar] [CrossRef] [Green Version]
- Losciale, P.; Zibordi, M.; Manfrini, L.; Morandi, B.; Bastias, R.M.; Corelli Grappadelli, L. Light management and photoinactivation under drought stress in peach. Acta Hortic. 2011, 922, 341–347. [Google Scholar] [CrossRef]
- Losciale, P.; Manfrini, L.; Morandi, B.; Novak, B.; Pierpaoli, E.; Zibordi, M.; Corelli Grappadelli, L.; Anconelli, S.; Galli, F. Water restriction effect on pear rootstocks: Photoprotective processes and the possible role of photorespiration in limiting carbon assimilation. Acta Hortic. 2014, 1058, 237–244. [Google Scholar] [CrossRef]
- Galmés, J.; Abadia, A.; Cifre, J.; Medrano, H.; Flexas, J. Photoprotection processes under water stress and recovery in Mediterranean plants with different growth forms and leaf habits. Physiol. Plant. 2007, 130, 495–510. [Google Scholar] [CrossRef] [Green Version]
- Foyer, C.H.; Harbinson, J. Oxygen metabolism and the regulation of photosynthetic electron transport. In Causes of Photooxidative Stress and Amelioration of Defence Systems in Plants; Foyer, C.H., Mullineaux, P.M., Eds.; CRC Press: Boca Raton, FL, USA, 1994; pp. 1–42. [Google Scholar]
- Osmond, C.B. Photorespiration and photoinhibition: Some implication for the energetics of photosynthesis. Biochim. Et Biophys. Acta 1981, 639, 77–98. [Google Scholar] [CrossRef]
- Canali, S.; Campanelli, G.; Ciaccia, C.; Leteo, F.; Testani, E.; Montemurro, F. Conservation tillage strategy based on the roller crimpertechnology for weed control in Mediterranean vegetable organic cropping systems. Eur. J. Agron. 2013, 50, 11–18. [Google Scholar] [CrossRef]
- Ciaccia, C.; Testani, E.; Campanelli, G.; Sestili, S.; Leteo, F.; Tittarelli, F.; Riva, F.; Canali, S.; Trinchera, A. Ecological service providing crops effect on melon-weed competition and allelopathic interactions. Org. Agr. 2015, 5, 199–207. [Google Scholar] [CrossRef]
- Jarvis, P.G. The interpretation of the variations in leaf water potential and stomatal conductance found in canopies in the field. Philos. Trans. R. Soc. Lond. B 1976, 273, 593–610. [Google Scholar]
- Lauri, P.É.; Barigah, T.S.; Lopez, G.; Martinez, S.; Losciale, P.; Zibordi, M.; Manfrini, L.; Corelli Grappadelli, L.; Costes, E.; Regnard, J.L. Genetic variability and phenotypic plasticity of apple morphological responses to soil water restriction in relation with leaf functions and stem xylem conductivity. Trees 2016, 30, 1893–1908. [Google Scholar] [CrossRef]
- Tardieu, F.; Simonneau, T. Variability among species of stomatal control under fluctuating soil water status and evaporative demand: Modelling isohydric and anisohydric behaviours. J. Exp. Bot. 1998, 49, 419–432. [Google Scholar] [CrossRef] [Green Version]
- Gollan, T.; Turner, N.C.; Schulze, E.D. The responses of stomata and leaf gas exchange to vapour pressure deficits and soil water content. Oecologia 1985, 65, 356–362. [Google Scholar] [CrossRef] [PubMed]
- Socías, X.; Correia, M.J.; Chaves, M.; Medrano, H. The role of abscisic acid and water relations in drought responses of subterranean clover. J. Exp. Bot. 1997, 48, 1281–1288. [Google Scholar] [CrossRef] [Green Version]
- Xiloyannis, C.; Uriu, K.; Martin, G.C. Seasonal and diurnal variations in absicic acid, water potential, and diffusive resistance in leaves from irrigated and non-irrigated peach trees. J. Am. Soc. Hortic. Sci. 1980, 105, 412–415. [Google Scholar]
- Morandi, B.; Rieger, M.W.; Corelli Grappadelli, L. Vascular flows and transpiration affect peach (Prunus Persica Batsch.) fruit daily growth. J. Exp. Bot. 2007, 58, 3941–3947. [Google Scholar] [CrossRef] [Green Version]


| Date | Treatment | N | P | pH | EC | TOC | ||
|---|---|---|---|---|---|---|---|---|
| (g kg−1) | (mg kg−1) | (dS m−1) | (%) | |||||
| 14/04/2015 | T | 1.06 | 34.40 | 8.43 | 0.17 | 1.05 | a | |
| M | 1.00 | 28.32 | 8.38 | 0.17 | 0.98 | b | ||
| F | 0.98 | 44.70 | 8.42 | 0.17 | 1.03 | a | ||
| S | 1.20 | 41.48 | 8.40 | 0.14 | 1.05 | a | ||
| F-value | 3.08 | 1.45 | 0.47 | 4.12 | 10.72 | |||
| p-value | 0.129 | 0.334 | 0.715 | 0.081 | 0.013 | |||
| 24/09/2015 | T | 1.21 | 42.05 | 8.33 | 0.18 | 1.22 | ||
| M | 1.15 | 35.87 | 8.26 | 0.18 | 1.16 | |||
| F | 1.00 | 53.00 | 8.32 | 0.19 | 1.18 | |||
| S | 1.17 | 51.46 | 8.21 | 0.20 | 1.22 | |||
| F-value | 1.30 | 1.49 | 0.94 | 0.05 | 0.95 | |||
| p-value | 0.372 | 0.325 | 0.489 | 0.981 | 0.484 | |||
| 16/12/2016 | T | 0.68 | 37.97 | ab | 8.31 | 0.19 | 1.11 | a |
| M | 0.66 | 39.83 | ab | 8.38 | 0.12 | 1.20 | a | |
| F | 0.94 | 52.36 | a | 8.27 | 0.17 | 1.18 | a | |
| S | 0.75 | 27.14 | b | 8.33 | 0.13 | 0.99 | b | |
| F-value | 1.07 | 5.53 | 0.28 | 0.43 | 8.57 | |||
| p-value | 0.392 | 0.010 | 0.838 | 0.736 | 0.002 | |||
| DAFB Range | Treatment | V | AGR | ||
|---|---|---|---|---|---|
| (cm3) | (cm3 day−1) | ||||
| 38–77 | T | 23.18 | 0.58 | b | |
| M | 20.93 | 0.49 | c | ||
| F | 21.46 | 0.65 | a | ||
| S | 21.00 | 0.51 | c | ||
| F-value | 3.14 | 5.25 | |||
| p-value | 0.108 | 0.041 | |||
| 77–105 | T | 41.35 | 0.61 | a | |
| M | 37.95 | 0.60 | a | ||
| F | 39.42 | 0.58 | a | ||
| S | 36.56 | 0.43 | b | ||
| F-value | 3.56 | 5.83 | |||
| p-value | 0.088 | 0.033 | |||
| 105–125 | T | 61.77 | a | 1.09 | a |
| M | 59.42 | a | 1.16 | a | |
| F | 58.13 | a | 0.98 | a | |
| S | 50.13 | b | 0.73 | b | |
| F-value | 5.08 | 9.14 | |||
| p-value | 0.044 | 0.012 | |||
| 125–148 | T | 104.46 | a | 2.26 | a |
| M | 107.10 | a | 2.42 | a | |
| F | 91.26 | b | 1.86 | b | |
| S | 85.28 | b | 1.87 | b | |
| F-value | 5.30 | 5.06 | |||
| p-value | 0.040 | 0.044 | |||
| Treatment | Y | FW | WPi | TSS | FF | RC | ||||
|---|---|---|---|---|---|---|---|---|---|---|
| (t ha−1) | (g) | (kg m−3) | (°Brix) | (kg cm−2) | (%) | |||||
| T | 11.91 | 149.45 | a | 7.22 | b | 18.07 | 3.01 | ab | 58.33 | b |
| M | 10.82 | 166.94 | a | 12.23 | a | 17.34 | 2.18 | b | 92.31 | a |
| F | 10.96 | 112.91 | b | 6.64 | b | 18.73 | 3.70 | a | 55.00 | a |
| S | 10.44 | 93.61 | b | 11.79 | a | 18.37 | 2.85 | ab | 56.67 | a |
| F-value | 0.70 | 17.59 | 17.32 | 2.02 | 5.12 | 7.48 | ||||
| p-value | 0.571 | <0.001 | <0.002 | 0.169 | 0.019 | 0.005 | ||||
| DAFB Range | Treatment | V | AGR | |
|---|---|---|---|---|
| (cm3) | (cm3 day−1) | |||
| 57–107 | T | 35.99 | 0.73 | |
| M | 33.19 | 0.59 | ||
| F | 35.45 | 0.73 | ||
| S | 35.11 | 0.69 | ||
| F-value | 0.44 | 2.59 | ||
| p-value | 0.731 | 0.149 | ||
| 107–140 | T | 77.81 | 1.94 | |
| M | 73.17 | 1.64 | ||
| F | 80.54 | 2.02 | ||
| S | 73.17 | 1.77 | ||
| F-value | 1.85 | 1.67 | ||
| p-value | 0.239 | 0.271 | ||
| 140–164 | T | 190.61 | 5.16 | a |
| M | 180.13 | 5.89 | a | |
| F | 182.93 | 4.63 | b | |
| S | 180.27 | 4.31 | b | |
| F-value | 0.36 | 8.51 | ||
| p-value | 0.785 | 0.014 | ||
| Treatment | Y | FW | WPi | TSS | FF | RC | ||
|---|---|---|---|---|---|---|---|---|
| (t ha−1) | (g) | (kg m−3) | (°Brix) | (kg cm−2) | (%) | |||
| T | 15.25 | 234.46 | ab | 8.39 | b | 14.16 | 4.58 | 84.07 |
| M | 16.78 | 256.65 | a | 16.22 | a | 13.75 | 4.96 | 93.89 |
| F | 13.56 | 211.65 | b | 7.45 | b | 14.13 | 4.26 | 93.33 |
| S | 14.35 | 216.92 | b | 14.03 | a | 13.78 | 3.58 | 84.63 |
| F-value | 0.19 | 3.49 | 4.56 | 0.73 | 0.76 | 2.38 | ||
| p-value | 0.899 | 0.052 | 0.026 | 0.553 | 0.539 | 0.125 | ||
Publisher’s Note: MDPI stays neutral with regard to jurisdictional claims in published maps and institutional affiliations. |
© 2020 by the authors. Licensee MDPI, Basel, Switzerland. This article is an open access article distributed under the terms and conditions of the Creative Commons Attribution (CC BY) license (http://creativecommons.org/licenses/by/4.0/).
Share and Cite
Losciale, P.; Gaeta, L.; Manfrini, L.; Tarricone, L.; Campi, P. Orchard Floor Management Affects Tree Functionality, Productivity and Water Consumption of a Late Ripening Peach Orchard under Semi-Arid Conditions. Appl. Sci. 2020, 10, 8135. https://doi.org/10.3390/app10228135
Losciale P, Gaeta L, Manfrini L, Tarricone L, Campi P. Orchard Floor Management Affects Tree Functionality, Productivity and Water Consumption of a Late Ripening Peach Orchard under Semi-Arid Conditions. Applied Sciences. 2020; 10(22):8135. https://doi.org/10.3390/app10228135
Chicago/Turabian StyleLosciale, Pasquale, Liliana Gaeta, Luigi Manfrini, Luigi Tarricone, and Pasquale Campi. 2020. "Orchard Floor Management Affects Tree Functionality, Productivity and Water Consumption of a Late Ripening Peach Orchard under Semi-Arid Conditions" Applied Sciences 10, no. 22: 8135. https://doi.org/10.3390/app10228135