Glacial Erosion Liberates Lithologic Energy Sources for Microbes and Acidity for Chemical Weathering Beneath Glaciers and Ice Sheets
 Moya L. Macdonald
 Jemma L. Wadham1
  Jon Telling
 Mark L. Skidmore
- 1Bristol Glaciology Centre, School of Geographical Sciences, University of Bristol, Bristol, United Kingdom
- 2School of Natural and Environmental Sciences, Newcastle University, Newcastle upon Tyne, United Kingdom
- 3Department of Earth Sciences, Montana State University, Bozeman, MT, United States
Wet-based regions of glaciers and ice sheets are now recognized to host unique and diverse microbial communities capable of influencing global biogeochemical cycles. However, the isolated nature of subglacial environments poses limitations upon the supply of protons for chemical weathering and energy sources (electron donors/acceptors) to support in situ microbial communities. A less well recognized source of these substrates is the release of gases from mineral structures, pore spaces or fluid inclusions and the generation of gases from the breakage of mineral bonds during the mechanical breakdown of rocks by moving ice. Here, we investigate the potential release of H2, CO2, CO, and short chain hydrocarbons, particularly CH4, by glacial erosion at rates relevant to chemical weathering and microbial activity beneath glaciers. A wide range of magmatic, metamorphic, and sedimentary rocks, and subglacial sediments from glaciated catchments in Greenland, Norway and Canada were ground in the laboratory to varying grain sizes and the release of gases was measured. The volume of gas released increased as the grain size of the ground sediments decreased. The results of these laboratory experiments were used to estimate rates of catchment-scale gas release based upon estimates of long term abrasion rates at each glacier. H2 generation was calculated to be sufficient to potentially support previously estimated rates of methanogenesis in the upper centimeters of subglacial sediment at a gneissic catchment in Greenland and a sedimentary catchment in Canada. Sufficient CO2 could be released by grinding to drive as much as 20% of subglacial chemical weathering at a metamorphic catchment in Svalbard, with potential implications for the inferred quantity of CO2 drawn-down from the atmosphere by glacial weathering. Rates of CH4 generation from grinding bedrock has the potential to be greater than subglacial microbial generation in a sedimentary catchment in Canada with carbon rich bedrock, suggesting a potentially important source of CH4 for methanotrophic microorganisms. We conclude that mechanical erosion beneath a range of glaciers generates significant quantities of gases which have the potential to enhance chemical weathering and/or support subglacial microbial communities in the deep icy biosphere.
Introduction
Subglacial environments have become of increasing interest for understanding how microbial life survives in cold, dark, environments, and for investigating the impact of glaciation upon global biogeochemical cycles (e.g., Skidmore et al., 2000; Christner et al., 2012; Wadham et al., 2013). Despite darkness, high pressures, low temperatures, and assumed low nutrient input, the subglacial environment hosts active microbial ecosystems (e.g., Sharp et al., 1999; Christner et al., 2014; Dieser et al., 2014). The ubiquitous presence of geochemically reactive rock flour, coupled with isolation from surface inputs of organic matter and complete darkness, suggests that chemolithotrophic communities are important primary producers in subglacial systems (Sharp et al., 1999; Tranter et al., 2002; Boyd et al., 2014; Christner et al., 2014). Chemolithotrophic microbes exploit chemical disequilibria to derive their energy, often utilizing dissolved gases as electron acceptors or donors (Lovley and Goodwin, 1990; Sharp et al., 1999). For example, hydrogenotrophic methanogens can subsist upon dissolved gases (i.e., H2/CO2) as their sole energy source (Lovley and Goodwin, 1990). However, due to the isolation of areas of the subglacial environment from surface processes and the atmosphere, there is a limited supply of energy sources resulting in their depletion over time, particularly during long periods of glaciation (Wadham et al., 2004).
Similarly, the proton pool available to fuel chemical weathering reactions can become limited during long periods of isolation from the atmosphere and surface processes (Hallet et al., 1996). Important proton sources in subglacial environments include carbonic acid generated from the dissolution of atmospheric and microbially-respired CO2 and the oxidation of sulfide minerals under both oxic and anoxic conditions (Tranter et al., 1996, 2002; Sharp et al., 1999; Montross et al., 2013). However, vast areas beneath ice sheets are isolated from the influx of surface waters carrying atmospheric CO2. Varying rates of basal melt across the bed impacts the volume of palaeo-atmospheric CO2 released from bubbles trapped in the ice, limiting this source in low melt areas. Proton supply via sulfide oxidation is only significant where there are sulfide-bearing rocks being physically eroded to comminuted rock flour. This source may become, at least locally, limited. Microbially-respired CO2 has been shown to enhance chemical weathering rates (Montross et al., 2013), but would be limited in areas where there are limited growth substrates (e.g., low organic carbon) and subsequently lower rates of respiration.
We postulate that a previously unrecognized abiogenic source of protons (through the generation of carbonic acid) and microbial energy is the bedrock, which is eroded at rates of 0.01–100 mm yr−1 by moving ice in wet-based areas via fracturing, plucking and abrasion (Hallet et al., 1996; Lee and Rutter, 2004; Cowton et al., 2012). Tentative evidence from the literature supports this notion. Gases trapped within rocks can be released by mechanical grinding (Zhang et al., 2014; Deeds et al., 2015; Wang et al., 2015). For example, crystalline rocks, such as granitoids, which constitute the major basement rocks beneath the Greenland Ice Sheet, contain gases (e.g., hydrocarbons) trapped within their minerals' crystal structure or within fluid inclusions (Potter and Konnerup-Madsen, 2003). Sedimentary rocks can retain even larger volumes of hydrocarbons and CO2 within their pore spaces and mineral structures (e.g., Martinelli and Plescia, 2005; Osborn and McIntosh, 2010; Wang et al., 2015). In addition, gases such as H2 can be generated from mechanical grinding of rocks and minerals through fault action (e.g., Ito et al., 1999; Kameda et al., 2004). Despite the potential for glacial erosion to generate these gases, there has been only one experimental investigation, focusing solely on H2 generation, using field-collected samples from glacial catchments to date (Telling et al., 2015).
This study aims to investigate the potential of subglacial mechanical erosion as an abiotic source of gases, at generation rates that are relevant to chemical weathering and microbial activity. Rock and sediment samples from a range of lithologically contrasting (igneous, metamorphic, and sedimentary rock types) glaciated catchments across the Northern hemisphere were ground in a ball-mill to simulate the process of glacial abrasion. The release of H2, CO2, CO, and several short-chained hydrocarbons was quantified to determine their significance for providing protons for chemical weathering via carbonic acid generation and as electron acceptors and donors for microbial energy.
Materials and Methods
Rock and Sediment Sample Selection
Rock samples were collected from a diverse range of glaciated catchments in the Northern hemisphere. These glaciers were Mittivakkat (MG) and Leverett (LG) in Greenland, Engabreen (EG) and Midtre Lovenbreen (ML) in Norway, and Robertson (RG) in Canada. The details of the catchment location, general lithology and rock sample type(s) are shown in Table 1. Glacial sediment samples were also obtained at two catchments (LG and ML). The LG sediment was melted out of a basal ice sample. The ML sediment was collected immediately in front of the glacier terminus and had thus been recently exposed. Approximate percentage areal composition of five major minerals (quartz, feldspar, biotite, muscovite, and pyroxene) was determined for the crystalline rock samples (Table 1). Identification was conducted using established physical properties of minerals that were visible with the naked-eye or with a hand-lens (x10 magnification). Mineral quantification was not conducted for the sediment samples or the RG rock samples because they were too fine-grained to identify by this method.
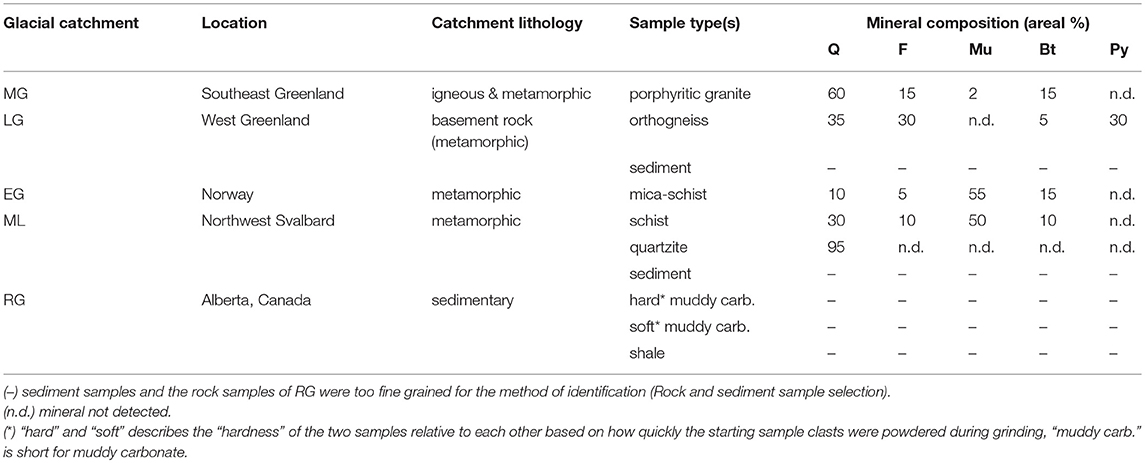
Table 1. Characteristics of the rock and sediment samples and their source glacial catchments, with estimates for the crystalline rock samples of the areal percentage of major rock forming minerals, quartz (Q), feldspar (F), muscovite mica (Mu), biotite mica (Bt) and pyroxene (Py) (NB totals may not be 100 % where other minerals were present).
Experiments to Simulate Gas Release Via Glacial Erosion
A sledgehammer on a metal plate was used to reduce the rock samples in size. To minimize contamination, samples were wrapped in durable polyethylene bags and the plate and hammer were cleaned between samples with ethanol (100%). The 250 μm−2 mm fraction was collected and dried at 105°C for 48 h to remove moisture prior to milling. The rock and sediment samples were ground to finer powders in a zirconium oxide ball-mill sealed with a PTFE O-ring. We advocate that this process is analogous to glacial abrasion where clasts frozen into the glacier's base grind the bedrock beneath, producing large quantities of fine-grained sediment (e.g., Hallet et al., 1996). The ball-mill was modified with two valves so it could be flushed with 5.0 grade Argon, which was dried with an in-line moisture trap (Agilent), prior to grinding. Approximately 10 g of sample was ground in triplicate for 1, 3, 5, 10, and 30 min using a ball mill (Fritsch Planetary Mono Mill Pulverisette 6) at 500 rpm. The same length of grinding produced different mean grain sizes, depending upon the rock type, and thus comparison between the samples was standardized to mean grain size measured by Mastersizer. Grinding beyond 30 min did not produce smaller grain sizes. Immediately after grinding, 5 mL of 5.0 grade argon was injected into the ball-mill (to maintain ambient pressure) using a gas-tight syringe and mixed with the headspace before removing 5 mL of sample for analysis. Quartz mineral specimens (purchased from thegeologysuperstore.com) were used as a procedural blank to ensure that no gases were generated by the ball-mill during grinding. The quartz minerals were pre-crushed and sieved, by the same method as the samples, before being furnaced at 1000°C for 2 h, in order to dissociate gases from the mineral surface and release gases trapped within fluid inclusions. Grinding of the prepared quartz was conducted in duplicate for 1, 10, and 30 min. Methane was the only gas detected in the blank runs and averaged at 0.01 nmol CH4 g−1 (standard deviation of 0.002 nmol g−1) across all the blank runs. Minor (0.3 nmol g−1) carbon dioxide was present in the Argon gas used to flush the headspace. No other gases were detected in the procedural blank.
Analysis of Gases Released During Grinding
Gas samples were injected into an Agilent 7890 A gas chromatograph (GC) fitted with a methaniser (at 395°C) and two detectors: an FID (flame ionizing detector, at 300°C) and a TCD (thermal conductivity detector, at 250°C). Separation of methane (CH4), carbon dioxide (CO2), ethane (C2H6), ethylene (C2H4), and propane (C3H8) was achieved using a molecular sieve 5a, 60–80 mesh, 8ft × 1/8-inch column. Separation of hydrogen (H2) was achieved using a Haysep D 80–100 mesh, 2m × 1/8-inch SS column. The columns were held at 25°C for 4 min, before being ramped at 50°C per min to 200°C.
Gas samples obtained from grinding rock samples from two catchments with contrasting geologies (sedimentary RG and granitic MG) were also analyzed for carbon monoxide (CO) on an SRI 8610C GC fitted with a molecular sieve 5A column at 30°C and a reduction gas detector (mercuric oxide with UV lamp) held at 295°C.
Calibration standards were run twice daily on both GCs, apart from ethylene, which was calibrated with a standard obtained later in the experimental period as the peak was initially unidentified. The percentage variance, limit of quantification and detection for the standards are displayed in Table 2. Concentrations of the samples were calculated from a linear regression line of manual dilutions of certified (+/- 5 %) standards with 5.0 grade Argon. Gas concentrations were converted to moles using the Ideal Gas Law, corrected for dilution, and normalized to the mass of dry sediment.
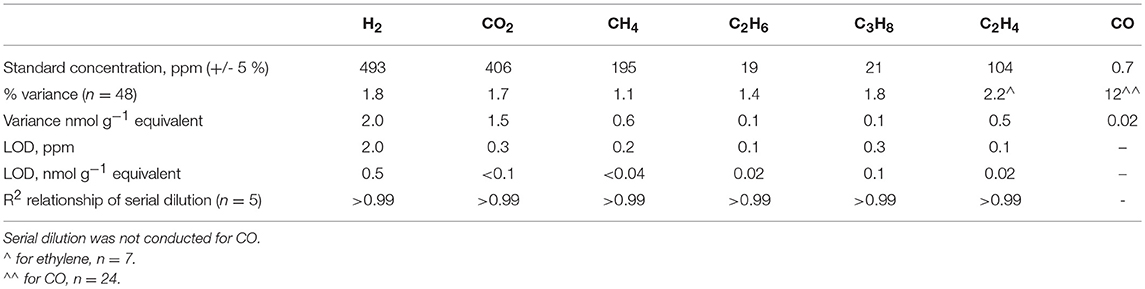
Table 2. The limit of quantification (variance) and detection (LOD) for each gas analyzed.
Grain Size and Total Carbon Analysis
The grain size after grinding was measured to standardize comparison of the samples. Mean grain size was measured using a Malvern Mastersizer 3000 which utilizes laser diffraction to estimate a mean grain size from 5 replicates per sample. The mean percentage variation for the 5 replicates was 3.5 % (n = 200). An Elemental Analyser (EA) 1110 was used to measure percentage weight of total carbon in an 8 to 19 mg, < 250 μm, well-mixed aliquot of each sample which was flash heated to 1000°C. The EA was calibrated with a certified Aspartic acid standard containing 36.14 % total carbon (n = 3, per 20 samples). Reproducibility of the total carbon content analyses was determined using a soil reference standard containing 2.36 % total carbon with the precision at 0.07 wt % total carbon (n = 4). The limit of detection was 0.01 wt % total carbon.
Suspended Sediment Flux and Discharge Analysis for ML (2016) and RG
To compare the potential gas generation by glacial erosion between catchments the rate of gas production was scaled up to a “catchment-rate”. To conduct this calculation, the flux of suspended sediment (SS) was used. We assumed that this is approximately equivalent to the rate of mechanical erosion; a common method used to calculate erosion rates (e.g., Hallet et al., 1996) and that which is likely to be representative of the average erosion rate over longer timescales despite the potential for errors on an annual basis. For the 2016 ML melt season and the 2014 RG melt season, this was calculated here using the product of the SS concentration and discharge measurements. The SS flux at ML was measured at the eastern subglacial upwelling (78.8956°N, 12.0730°E). There was no evidence of a western subglacial upwelling forming that year, as has occasionally been described previously (e.g., Wynn et al., 2006). SS concentration was measured (n = 16) every 3–4 days from the 24th June to the 21st July 2016. Water was collected in a rinsed 1 L Nalgene bottle and 100–500 mL (depending on the perceived turbidity) was filtered using a hand-pump with a Nalgene filtration tower onto a 0.45 μm cellulose nitrate filter paper. The paper was dried at 50°C for approximately 24 h and the dry weight of sediment per liter of water calculated and averaged (Table 3). The average grain size of the SS samples was 18.4 μm (n = 7; section Grain size and total carbon analysis). The discharge (m3 s−1) was calculated for 9 days over the melt season from water velocity (m s−1) and water depth (m) measured at 5–7 points across the width (m) of the river (number of measurements varied with river width). This was extrapolated across the estimated number of days the subglacial upwelling was flowing (47 days) to give a total melt season discharge of approximately 6.1 × 10⁶ m3. The product of the SS concentration and discharge provided an estimated SS flux of 95 × 108 g during the summer melt season, the same order of magnitude as that reported by Hodson et al.'s (2000) study.
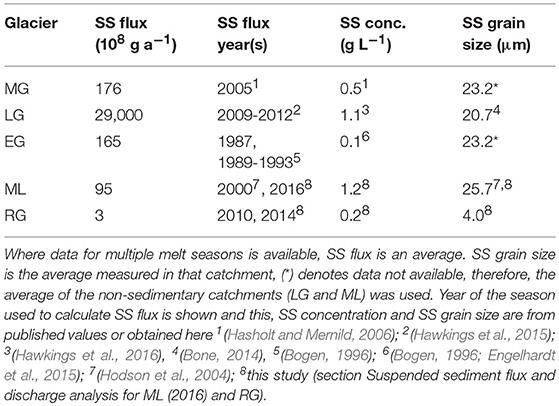
Table 3. Suspended sediment (SS) flux, average concentration and average grain size in meltwater for each glacier catchment.
Here, we present the first data for SS flux and bulk meltwater discharge for RG. An average SS concentration for RG of 0.19 g L−1 was obtained by the same method as described for ML from measurements taken on 3 days (n = 5/day), spread over the 2014 melt season. The average SS grain size was measured as 4.0 μm (n = 7; section Grain size and total carbon analysis; Table 3). The SS concentration was multiplied by an estimated average discharge of 0.3 m3 s−1 over a 62-day melt season. This discharge is the average for July during the 2010 RG melt season, and the assumed average for August as both had similar numbers of positive degree days (PDD; 310 cf. 320) (Doxsey-Whitfield, 2012; Scanlon, 2017). We assumed that the average discharges in 2010 and 2014 were comparable, as the July and August 2010 PDD values were close to the 2006–2012 average for July (350) and August (340), and thus appear to be broadly representative (Scanlon, 2017).
Calculation of Catchment-Scale Gas Generation From Grinding Experiments
To compare potential gas generation by glacial erosion for catchments of contrasting size and erosion rates, the rate of gas production per m2 of the catchment per day was calculated using Equation 1, after Telling et al. (2015):
where, G (catchment) is the catchment-wide rate of gas production (H2, CH4, or CO2) generated by mechanical grinding (nmol m−2 d−1); G is the amount of gas generated per gram of sample (nmol g−1); E is the flux of suspended sediment (SS) exported from the catchment per year (g a−1); A is the area of the catchment (m2) and 365 converts the rate from yearly to daily. Note that G is the amount of gas generated per gram of sample when ground to the average grain size of SS measured in glacial runoff from the catchment (Table 3). G is calculated using the regression line equation of gas production against grain size (Figure 1). Values used for E and the average grain size of SS in each catchment are shown in Table 3. Where G(catchment) was calculated for H2 generation by silica-water reactions at LG (section Hydrogen), the value for G was 11.4 nmol H2 g−1 as calculated by Telling et al. (2015).
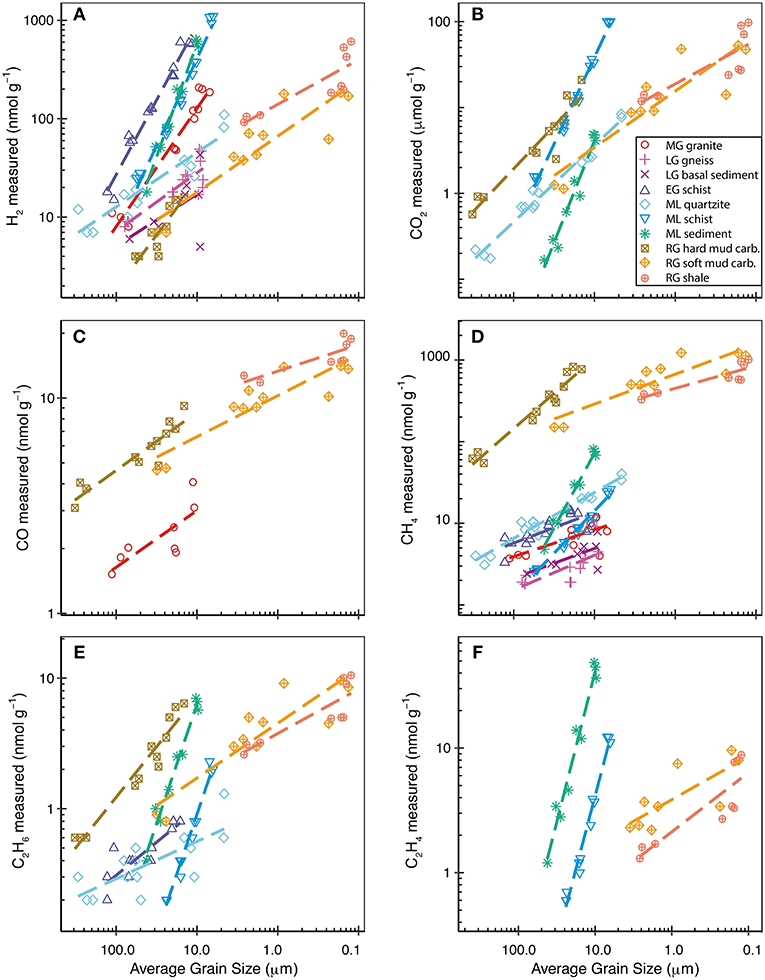
Figure 1. H2 (A), CO (C), CH4 (D), C2H6 (E), C2H4 (F) produced in nmol g−1, and CO2 (B) produced in μmol g−1 when grinding the rock and sediment samples to different average grain sizes. Grain size decreases and grinding time increases from left to right. Dashed lines are the power relationship between grain size and the respective gas for each sample (which is linear in log-log space).
These calculations assume that the measured suspended sediment flux in runoff from each catchment is in equilibrium with the rate of mechanical erosion. This is likely to be true over decadal and longer timescales, as otherwise sediment beneath glaciers would either run out or would accumulate. However, there is the potential for the erosion rate to be out of equilibrium with the suspended sediment flux in individual years, particularly at small, slowly eroding glaciers which are underlain by subglacial till (e.g., RG and ML). Here, in the absence of other data we have made the assumption that the present day rate is equivalent to a longer term abrasion rate measured over a number of years. These calculations also assume that the average suspended sediment grain size has been achieved from grinding an original grain size of between 250 μm and 2 mm. This is unlikely to be true, therefore, G (catchment) is likely a lower estimate as the reduction of bedrock to 2 mm sized particles will likely generate additional gas. Where multiple rock types were present in the catchment, we selected the dominant rock type to calculate values of G. The only exception to this was for CO2 at LG which was calculated from experiments in which basal sediment was ground, rather than the bedrock (gneiss) which did not produce quantifiable CO2. Previous studies have shown that basal ice sediment at LG has an organic carbon content of 0.44 % (dry weight) (Lawson et al., 2014) which was presumably the origin of the CO2 released during grinding of the basal sediment.
Calculation of Supported Rates of Hydrogenotrophic Methanogenesis
To determine the significance of the H2 generated by glacial erosion to subglacial microbial processes, the degree of hydrogenotrophic methanogenesis that could be sustained by grinding-generated H2 and CO2 was determined for two catchments with contrasting geologies; gneissic LG and sedimentary RG. To calculate the depth of sediment throughout which hydrogenotrophic methanogenesis could be sustained by H2 generated from grinding, we used Equation 2:
Where, D is the depth of sediment (m) throughout which methanogenesis could be supported by grinding-generated H2, H2 (catchment) is the H2 generated by mechanical grinding from Equation 1 (nmol m−2 d−1), CH4 (methanogenesis) is the measured rate of CH4 production by methanogenesis at the catchment derived from incubation studies (nmol g−1 d−1), 4 is the stoichiometric relationship between H2 and CH4 during methanogenesis (Equation 3), S is the grams of sediment per meter cubed where the wet sediment has a density of 2 × 10⁶ g m−3 (as measured by Stibal et al., 2012) and therefore converts the rate of methanogenesis from nmol CH4 g−1 d−1 to nmol CH4 m−2 d−1. For RG, values used for CH4 (methanogenesis) were 0.0002–0.0012 nmol CH4 g−1 d−1, as measured during incubations at 4°C of basal sediment from RG (Boyd et al., 2010). For LG, 0.00018 nmol CH4 g−1 d−1 was used for CH4 (methanogenesis) (Stibal et al., 2012). This rate was measured during incubation at 1°C of sediment from Russell Glacier, which is adjacent to, and has the same bedrock geology as LG (Stibal et al., 2012).
Since the H2/CO2 pathway for methanogenesis requires a source of CO2 in addition to H2, we also calculated whether sufficient CO2 is generated by grinding to allow microbes to utilize mechanically generated H2. This was calculated from the stoichiometric relationship of H2 and CO2 in the hydrogenotrophic methanogenesis pathway:
Calculation of Theoretical Total Flux of CO2 and CH4 in Subglacial Discharge
For ML and LG, it was necessary to calculate an estimated flux of gas from grinding per year to allow direct comparison with fluxes in the literature. At ML, CO2 fluxes can be compared with estimates of CO2 “used” in a chemical weathering study at the catchment (Hodson et al., 2000). CH4 fluxes can be compared with measured CH4 export at LG. The latter has been inferred to be microbial in origin (Lamarche-Gagnon et al., accepted), thus providing a comparison between grinding-generated abiogenic CH4 and suspected subglacial microbial generation rates. The theoretical flux of CH4 and CO2 was calculated as shown:
where, G (flux) is the grinding-generated CH4 exported from the catchment per year (t); G (generated) is the gas generated per gram of sample (t [g sample]−1); E is the flux of suspended sediment exported from the catchment per year (g a−1). Values used for E are shown in Table 3 for LG. For ML, we used only data for the year closest (2000) to when the comparison study was conducted, where E was 113 × 108 g a−1 and the mean SS grain size used to determine G(generated) was 33.1 μm (Hodson et al., 2004). G (generated) is calculated the same way as G (catchment) in Equation 1 but converted to tons of gas per gram of sediment using the molecular weight of the gas.
Results
Variations in rock hardness of the samples analyzed resulted in widely differing grain sizes when ground for the same time. Therefore, we used the average grain size of the ground sample rather than the grinding time to compare the amount of gas produced by grinding different samples. Decreasing average grain size equated to an increase in the amount of H2, CO2, CO, CH4, C2H6, C3H8, and C2H4 emitted during grinding (Figure 1). The only exception to this pattern was a decrease in the CO2 emitted with decreasing average grain size for LG basal sediment. It is likely that the amount of gas emitted would continue to increase with further reduction in grain size, however, using this method we were not able to further decrease the grain size by grinding for longer than 30 minutes.
The amount of H2 measured during the grinding of rock and sediment samples varied by two orders of magnitude depending on the rock type investigated (Figure 1A). Mica-rich samples, EG schist, ML schist, and ML sediment, produced up to one order of magnitude more H2 than the non-mica-rich samples when ground to 17 μm (the average grain size of suspended sediment exported from LG, RG and ML, for which this data was available; Table 3).
CO2 was detected during the grinding of all rock and sediment samples but was below the limit of quantification (< 1.5 nmol g−1) for the MG granite, LG gneiss, and EG schist. However, large amounts of CO2 (μmol g−1) were produced during grinding of RG and ML rock samples (Figure 1B). Correlations between the amounts of gases measured were investigated in order to identify potential release mechanisms. For example, the correlation between CO2 and CH4 was highly linear within individual rock samples (R2 > 0.8), but not within the entire population of rock samples (R2 0.32) due to the higher CO2:CH4 ratios of the ML samples than of the RG rocks (Figure 2A).
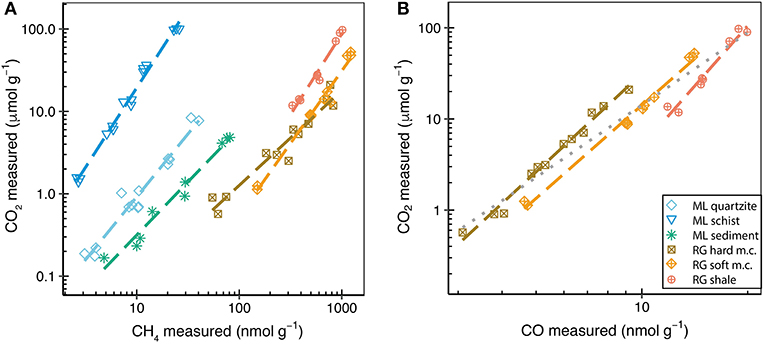
Figure 2. Amounts of CO2 (μmol g−1) against (A) CH4 (nmol g−1) released during grinding of RG and ML rocks and against (B) CO (nmol g−1) released during grinding of RG rocks. Colored dashed lines show the linear correlations between the respective gases. The gray dotted line is the linear regression of all samples in (B).
CO was analyzed during grinding of rocks from catchments with contrasting geologies; RG sedimentary rocks and MG granite. Small amounts of CO (1–4 nmol g−1) were measured during grinding of MG granite. The three RG rocks produced similar amounts of CO (2-20 nmol g−1) as each other when ground to the same average grain size (Figure 1C). There was a significant linear correlation between CO2 and CO produced during grinding of the RG rocks (R2 of 0.93). The strength of these correlations increased when considering only single rock types (R2 of 0.96 to 0.99) (Figure 2B).
A wide range of hydrocarbon species were produced during grinding, including CH4, C2H6, C2H4, C2H2, and C3H8 (Table 4). CH4 and C2H6 were produced during grinding of all rock and sediment samples, except for LG granite, where C2H6 was not detected. CH4 (Figure 1D) production was notably higher for the sedimentary RG samples than for the crystalline samples of EG, MG, and LG. LG sediment samples produced similar amounts of CH4 at all grain sizes as LG gneiss, whereas ML sediment produced three times more CH4 than the crushed ML schist, one of the dominant rock types in the catchment. This suggests that ML schist is not the dominant composition of the basal till. ML sediment behaved as an outlier in several correlations with elevated C2H6:CH4 (Figure 3A) and H2:CO2 (Figure 3B) ratios compared with the wider population of rocks. The H2/CO2 and C2H6/CH4 relationships were highly linearly correlated for all other rocks (R2 of 0.86 and 0.93, respectively) when ML sediment was not included.
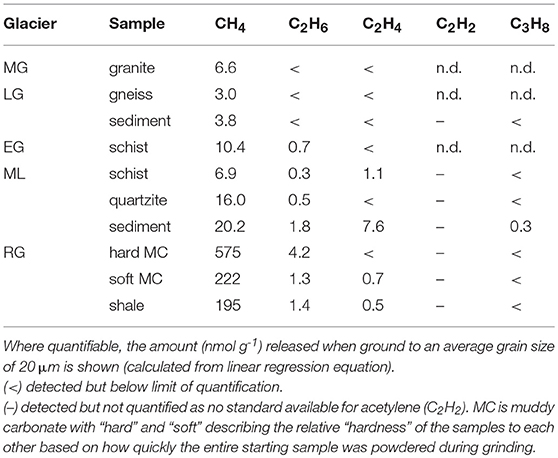
Table 4. The hydrocarbons detected during grinding.
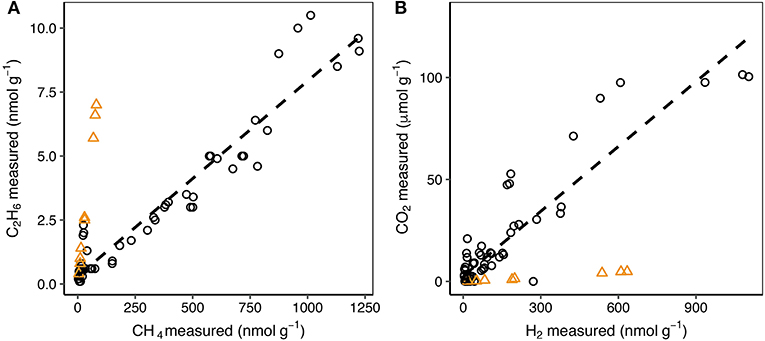
Figure 3. The relationship between the amount of C2H6 and CH4 (A) and between CO2 and H2 (B) produced per gram of sample during grinding. Orange triangles represent analyses of ML sediment. The dashed line shows the correlation between the respective gas concentrations for all samples except ML sediment. When ML sediment is included in the highly linear relationship between C2H6 and CH4, the R2 drops from 0.93 to 0.79. When ML sediment is included in the linear relationship between CO2 and H2, the R2 drops from 0.86 to 0.66.
Discussion
Sources and Generation Mechanisms for Gases During Glacial Grinding
The potential sources of the different gases measured during grinding of rock and glacial sediment samples in this study likely reflect release from two primary mechanisms. First, gases may be released from pore spaces, fluid inclusions or crystal structures. Second, they may be formed as a consequence of bond breakages during grinding of the rock. The dominant source for each sample will be dependent upon the gas species and the rock type (i.e., sedimentary vs. crystalline). We use our experimental data to infer the most likely source of each gas for the different rock types in the following sections.
Hydrogen
H2 was measured during grinding of all of the samples. There is some evidence that H2, generated by thermal degradation of organic matter during a rock's formation, can be trapped within the pore spaces of sedimentary rocks (Suzuki et al., 2017). The breaking open of pore spaces during grinding may be an important source of H2 for the sedimentary RG rocks. For the crystalline samples (LG, MG, EG and ML) release of free H2 trapped within the rock is a less likely source because, although H2 can be contained within fluid inclusions, this is rare (Burke, 2001). We therefore propose that the majority of H2 emitted by the grinding of the crystalline samples and at least some of the H2 emitted by the sedimentary samples is likely formed during the grinding process, rather than released. There are two likely formation mechanisms for H2, both of which involve reactions with surface radicals which form on the fractured surfaces of minerals where bonds have broken. The first generation mechanism results from the reaction of water with silica radicals (Si·) and is the most commonly attributed source of H2 released from the grinding of rocks, e.g., in fault zones (e.g., Sugisaki et al., 1983; Ito et al., 1999):
The second potential H2 generation mechanism involves the reaction of hydroxyl functional groups (–OH) from within the crystal structure with Si· radicals which form on the surface of a fracture plane (Kameda et al., 2004; Hirose et al., 2011):
This mechanism has been used to explain why the grinding of –OH rich minerals, such as phyllosilicates (e.g., muscovite and biotite mica) and the clays, generate more H2 than grinding other silicate minerals to similar surface areas, and therefore, producing similar amounts of silica radicals (Kameda et al., 2003).
It seems unlikely that the first mechanism (Equation 5) was the primary production mechanism in our experiments, given the significant quantities of H2 released under dry conditions. Although it is possible that some H2O, either as liquid or vapor, was released from fluid inclusions in our samples during grinding, we propose that an additional mechanism was required for the high amounts of H2 emitted during grinding of, in particular, EG schist, ML schist, ML sediment, and MG granite (Figure 1A). Therefore, to further investigate if the reaction of –OH groups with Si· (Equation 6) better explains the high production of H2 measured, we compared the estimated content of the micas, biotite and muscovite, in hand specimen with the H2 generated when the sample was ground to 17 μm (the average grain size of suspended sediment exported from LG, RG, and ML, for which this data was available; Table 3). Of the samples here, excluding the RG rocks which were too fine-grained for hand-specimen mineral quantification, ML and EG schist had the most muscovite and biotite at an estimated 60 and 70 % area, respectively, (Table 1) and generated the most H2 when ground to 17 μm at 164 and 407 nmol g−1, respectively. Comparatively, ML quartzite, which had no detectable mica by this method, and LG granite, which had approximately 5 % mica, produced the lowest amounts of H2 when ground to 17 μm at 31 and 21 nmol g−1, respectively. The three sedimentary rocks from RG were too fine-grained for mica identification in hand-specimen. However, based upon known characteristics of the rock types (shale and muddy-carbonates), we can broadly infer that they contained high quantities of “mud,” i.e., clay minerals (hydrous aluminum phyllosilicates). Reaction of Si· with –OH groups present in clays could supply H2 in addition to that released from pore spaces, thus helping to explain the high amounts of H2 released when grinding the RG rocks (Figure 1A). Our results broadly support that increased mica or clay content and, therefore, increased presence of –OH groups stimulates greater H2 generation during grinding. However, more detailed analysis of mineralogical composition would be required to definitively test this hypothesis.
Several experiments have shown that the loss of –OH groups from a phyllosilicate mineral (e.g., by Equation 6) leads to an amorphous structure (e.g., Takahashi, 1959; Kristof et al., 1993; Martinelli and Plescia, 2005). Interestingly, a recent study by Hawkings et al. (2017) described significant quantities of amorphous material, particularly silica, on suspended sediments in LG's subglacial meltwaters. The authors hypothesized one potential source of this amorphous material as the mechanical grinding of bedrock beneath the ice sheet. The amorphous material on the suspended sediment grains was largely found on the edges of platy minerals (e.g., micas or clays) and contained varying amounts of auxiliary elements, including, aluminum (Hawkings et al., 2017). This tentatively supports the reaction of Si· with –OH groups in phyllosilicates (Equation 6) being an important driver of H2 generation by mechanical erosion.
We propose that the main mechanism for generation of H2 by grinding of crystalline rocks was by reaction of Si· with –OH due to the presence of phyllosilicate minerals in all rocks, the occurrence of higher estimated mica contents with higher H2 generation, and the presence of amorphous material containing Al on platy minerals. Even for rocks containing minor quantities of –OH-rich minerals (e.g., LG gneiss and ML quartzite), studies have shown that more than half the H2 generated from grinding can arise from the fracturing of minor minerals (Kameda et al., 2003). This, in combination with the possible release of H2O from fluid inclusions allowing some formation by Equation 5, explains the production of H2 from samples that are poor in phyllosilicates.
A recent study by Telling et al. (2015) measured H2 generated by rock-water reactions (Equation 5) during incubation of crushed rocks from glaciated catchments with water at subglacially-relevant temperatures (0°C). At LG, data was available to directly compare estimated long-term catchment-scaled rates of H2 generation by rock-water reactions from the Telling et al. (2015) study with H2 generation by dry grinding from this study. Generation of H2 by dry grinding at LG (244 nmol m−2 d−1; Table 5) was the same order of magnitude as the generation previously inferred by rock-water reactions (151 nmol m−2 d−1).
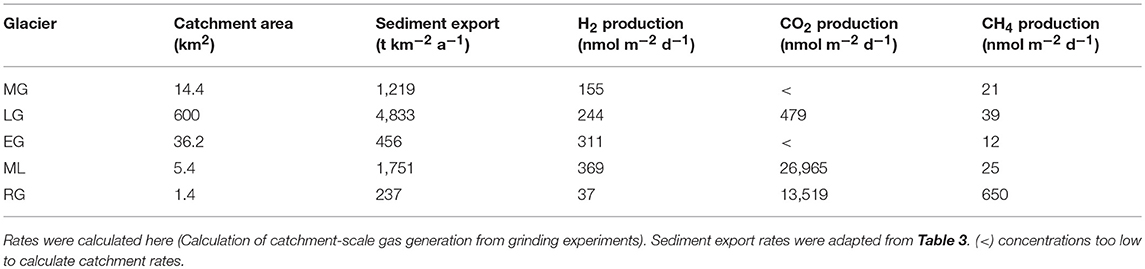
Table 5. Comparison of estimated long-term catchment production rates of H2, CO2, and CH4 (nmol gas m−2 day−1) by subglacial grinding.
Carbon Dioxide and Carbon Monoxide
Significant generation of CO2 was measured during grinding of sedimentary rocks from RG and metamorphic rock and sediment from ML. Possible sources include release from fluid inclusions, release from pore spaces, dissociation from calcite/dolomite minerals and oxidation of the released CH4. The latter process seems unlikely to be occurring in these experiments because grinding occurred in an oxygen free atmosphere, temperatures were unlikely to be high enough for CH4 combustion (the mill was never hot to the touch), and 1–4 orders of magnitude more CO2 was measured than CH4. Therefore, the remaining possible sources of CO2 (fluid inclusions, pore spaces, and crystal dissociation) are more likely and vary by rock type. For ML samples, CO2 was probably released from CO2-rich fluid inclusions which are common in many minerals and can form during or post-metamorphism (Burke, 2001; Diamond, 2001). For RG shale, the majority of CO2 (as with the hydrocarbons, section Hydrocarbons) was likely released from pore spaces between the particles of clays and other minerals which were broken open upon grinding (Wang et al., 2015). For the RG muddy carbonates, we speculate that CO2 was both released from pore spaces and released from the breakdown of calcite (CaCO3) and/or dolomite (CaMg(CO3)2) crystals that make up the carbonate component of the rock. The latter process has been suggested to occur during the mechanical breakdown of marly carbonates, a similar rock type to the RG muddy carbonates, by the following mechanisms (Martinelli and Plescia, 2005):
Emission of CO during grinding was analyzed for rocks from two catchments with contrasting geologies; high total carbon sedimentary RG and low total carbon igneous MG (Figure 1C). There is little in the literature about the release or production of CO during the mechanical breakdown of rocks/minerals. CO can be found in fluid inclusions in crystalline rocks (Burke, 2001) making this the likely source of CO from grinding MG granite. The Martinelli and Plescia (2005) study on the mechanical breakdown of marly-carbonaceous rocks (broadly similar in composition to the RG muddy carbonates) notes that CO is produced in “measurable quantities”. However, this was not quantified and no mechanism for release was described. The amount of CO and CO2 released was highly linearly correlated for the RG rocks (R2 > 0.92) (Figure 2B). We therefore tentatively suggest that the source of CO was similar to CO2 for RG rocks, i.e., primarily pore spaces for the shale and both pore spaces and release from the breakdown of calcite and dolomite crystals for the muddy carbonates.
Hydrocarbons
A range of short chain hydrocarbon species were detected during grinding: CH4 (methane), C2H6 (ethane), C2H4 (ethylene), C2H2 (acetylene), and C3H8 (propane). Most significantly, CH4 was produced during grinding of all samples, with significantly higher amounts produced by grinding sedimentary rocks from RG than the other samples (Figure 1D). Three possible sources of hydrocarbons are fluid inclusions in the crystalline samples, pore spaces in the sedimentary samples and breakdown of carbon compounds in all samples. Fluid inclusions in igneous and metamorphic rocks commonly contain CH4 with C2H6 as a more minor component and the higher hydrocarbons comparatively rare (Burke, 2001). This follows with the results found here: CH4 was the most abundant hydrocarbon measured; C2H6, where quantifiable, was roughly 1–2 orders of magnitude lower; and lower or trace quantities of C2H4, C2H2, and C3H8 were found, if detected at all (Table 4). The higher CH4 (1–2 orders of magnitude greater) and C2H6 (up to 1 order of magnitude greater) released when grinding the sedimentary RG rocks compared to all others (Figures 1D,E) is likely related to the presence of pore spaces which can trap gaseous hydrocarbons. These hydrocarbons were likely generated from the breakdown of organic matter during the rock's formation (Zhang et al., 2014; Wang et al., 2015).
The generation of hydrocarbons from the mechanical breakdown of carbon compounds within the rock samples during grinding is a possible source for all samples. To investigate this, the total carbon content (weight percent) of the rock was measured and compared to the amount of hydrocarbons, and other carbon-based gases, measured during grinding. Increasing total carbon content broadly correlated with higher emission of CH4 (R2 of 0.72, p < 0.001; Figure 4). There was a weaker correlation with C2H6 (R2 of 0.46, p < 0.001) perhaps because C2H6 was a comparatively minor component of gas released. CO2 was poorly correlated (R2 of 0.28, p < 0.001), possibly because of the different suggested primary generation mechanism (dissociation from the crystal structure of calcite and dolomite; section Carbon dioxide and carbon monoxide). CH4 and C2H6 were correlated across all samples (Figure 3A) which could indicate that the hydrocarbons trapped within the rocks (in fluid inclusions or pore spaces) originally formed in similar proportions. However, the formation mechanisms are vastly different, i.e., post-magmatic processes influencing fluid inclusion composition in igneous rocks (Potter and Konnerup-Madsen, 2003), such as those from LG and MG, or biogenic and/or thermogenic processes influencing pore space composition during the formation of shale (Wang et al., 2015). It is therefore possible that the linear relationship between CH4 and C2H6 could be explained by a common generation mechanism during grinding, i.e., from the mechanical breakdown of carbon compounds. Accurately distinguishing between the discussed sources of the measured hydrocarbons (fluid inclusions, pore spaces, and generation by breakdown of carbon compounds) would require in situ detection of gases in fluid inclusions, e.g., by raman microscopy. Interestingly, ML sediment was an outlier to the high collinearity of CH4 and C2H6 between all samples. If ML sediment was included within the analysis the R2 of the correlation was reduced from 0.93 to 0.79. A similar pattern was seen for H2/CO2 ratios (Figure 3B) which were elevated for ML sediment. This sample was collected from in front of the glacier terminus and consequently was exposed to the atmosphere. We therefore suggest that the elevated ratios for ML sediment reflected post-depositional processes, such as oxidation of CH4 and dissolution, causing loss of CO2 trapped within the minerals.
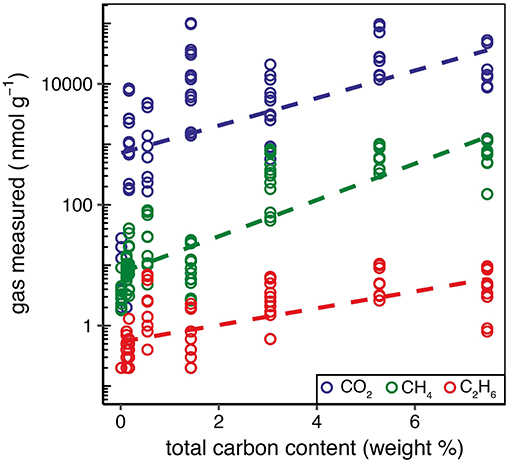
Figure 4. The amount of CO2, CH4, and C2H6 produced (nmol g−1) compared to the percentage weight of total carbon present in the sample.
Glacial Erosion Liberates Potential Energy Sources for Subglacial Microbes
The generation of gases by mechanical grinding beneath glaciers and ice sheets could be significant for various microbiological processes in subglacial environments. A wide variety of microbes use different gases as their energy and/or carbon source (Conrad, 1996). Of the gases measured after grinding in these experiments, H2, CO2, CH4, and CO are the most relevant to microbial processes. In the subglacial environment, an abiogenic source of these gases from bedrock grinding has the potential to sustain microbial populations during long periods of isolation from the atmosphere and surface processes or where other sources are scarce, e.g., where subglacial sediments are carbon-poor. Notably, H2 is utilized by many methanogens as a growth substrate, with CO2 as the preferred electron acceptor (Equation 3). These hydrogenotrophic methanogens are an important species in isolated environments due to their ability to subsist upon abiogenic H2 and CO2 as their sole energy source (Sleep and Zoback, 2007; Hirose et al., 2011). Several studies have identified the presence of methanogens, including hydrogenotrophic methanogens, in subglacial sediments and waters, and long-term incubations of subglacial sediments have shown active CH4 generation (Boyd et al., 2010; Stibal et al., 2012).
In order for grinding-generated H2 to be a source of energy for subglacial microbes, generation rates would need to be comparable with microbial rates of consumption. Therefore, catchment-scaled rates of H2 generation by subglacial rock grinding were calculated. These rates were calculated using suspended sediment (SS) export as a proxy for decadal and longer term abrasion rates. Varying rates were obtained depending upon bedrock type and erosion rate. For example, rates of H2 generation at ML and EG were the same order of magnitude as for LG (Table 5) despite the order of magnitude more H2 released per gram of the former samples (Figure 1A). This is because LG has a considerably higher sediment export and erosion rate. Similarly, grinding of porphyritic granite from MG produced more H2 per gram of sample than LG gneiss (Figure 1A), but MG had a lower production rate due to the slower erosion rate at this much smaller glacier (Table 5). Therefore, although the magnitude of H2 generation per gram is dependent on the bedrock type, the erosion rate is an important influence upon the significance of H2 generation in a catchment.
To determine if rates of grinding-generated H2 are sufficient to act as an energy source for subglacial methanogens, we calculated the depth of sediment throughout which measured rates of methanogenesis could be supported, assuming the sediments are anoxic. Rates of methanogenesis were available for two lithologically contrasting catchments: gneissic LG and sedimentary RG. At LG, we calculate that hydrogenotrophic methanogenesis could be supported throughout 17 cm of sediment depth beneath the entire LG catchment. It is important to note that the grinding of basal sediment at LG produces similar quantities of H2 per gram as grinding bedrock (Figure 1A), indicating that reworking of basal sediment would sustain similar rates of methanogenesis as erosion of bedrock itself. The sediment depth throughout which methanogenesis could be supported by grinding-generated H2 at RG was much lower (2 cm) due to the significantly lower rate of erosion at RG (~0.1 mm yr−1) than at LG (4.8 mm yr−1; Cowton et al., 2012). The sediment depths calculated here are within estimated sediment depths present at each catchment. At RG estimated depths are on the decimetre or sub-decimetre scale based upon observations that RG sits partly upon till and partly upon bare bedrock (Boyd et al., 2010). At LG, subglacial sediments could be present on the decimetre scale up to the multi-meter scale as indicated by 0 to decimetre thick sediments found at nearby Isunnguata Sermia and spatially-limited seismic evidence of sedimentary basins 10s of meters deep at LG (Dow et al., 2013; Harper et al., 2017; Kulessa et al., 2017).
Telling et al. (2015) calculated that water-Si· reactions (Equation 5) generated enough H2 to support methanogenesis in the top 1 cm of sediment throughout the LG catchment. However, the authors calculated that the rate of CO2 released from bubbles trapped in the ice (10% of ice volume, CO2 pre-industrial fraction of 0.0003) by basal melting (assumed rate of 6 mm/yr) was insufficient to act as the sole acceptor for their calculated rates of rock-water H2 generation. Here, we show that grinding basal sediment at LG generates 8 times the CO2 required as an electron donor for utilizing grinding-generated-H2 as an abiogenic energy source in hydrogenotrophic methanogenesis (Table 5; section Calculation of supported rates of hydrogenotrophic methanogenesis). At RG, grinding CO2-rich carbonates and shale generates more than 90 times the CO2 required for methanogens utilizing grinding-generated-H2 for the same process. Therefore, hydrogenotrophic methanogenesis could be sustained entirely by the process of glacial grinding throughout LG and RG catchments at sediment depths of 17 cm and 2 cm, respectively. RG is a small glacier with a low erosion rate (~0.1 mm a−1). Glaciers with faster erosion rates and similar bedrock to RG would generate more gases per m−2 d−1 by grinding and, therefore, could sustain hydrogenotrophic methanogenesis throughout greater depths of sediment, assuming a constant microbial metabolic rate. Further, the orthogneiss sample from LG is broadly representative of much of the basement rock that underlies the Greenland Ice Sheet. We therefore suggest that mechanical glacial erosion could provide an abiogenic source of energy, in the form of H2 and CO2, for subglacial microbial metabolism beneath the Greenland Ice Sheet and especially in marginal areas with higher ice flow and bedrock erosion rates.
Like H2 and CO2, CO was another gas emitted in our grinding experiments that may have similar potential to provide carbon and energy to subglacial microbes where other sources are limited. Several groups of bacteria and archaea can utilize CO as a source of carbon and/or energy. However, CO-utilizing microbes have been little explored in the subglacial or sub-ice-sheet literature to date. Groups of microbes that can utilize CO include anaerobic sulfate reducers, hydrogenogens, methanogens and acetogens (Oelgeschläger and Rother, 2008). Given the wide range of anaerobic metabolisms that have been reported in subglacial systems (e.g. see Skidmore, 2011 for review) it is plausible that CO-metabolizing species are present in subglacial environments. CO was measured after grinding rocks from two glaciated catchments with contrasting geologies: sedimentary RG, and igneous MG. The estimated long-term catchment-scaled rates of CO production at RG and MG were similar at 6 and 8 nmol m−2 d−1, respectively. At both catchments, CO generation rates are an order of magnitude lower than H2 generation rates (Table 5). However, it is still plausible that grinding-generated CO could be metabolized beneath glaciers. Further work would be needed to establish the production of CO by subglacial erosion at additional catchments and to establish the existence and utilization of CO by subglacial microbes to determine if this finding is significant.
Glacial Erosion Liberates a Source of Acidity for Chemical Weathering
The generation of CO2 by subglacial erosion has the potential to influence glacial chemical weathering rates because CO2 dissolves in water to form carbonic acid which dissociates to generate protons. This drives the chemical dissolution of carbonate (9) and silicate (10) minerals.
Proton sources in the subglacial environment can become depleted due to isolation during glaciation, and the supply of protons can limit chemical weathering rates (Tranter et al., 1996). CO2 is supplied to the subglacial environment by: periodic inputs of supraglacial meltwaters carrying atmospheric gases (isolated to small areas of the ice base where surface waters reach these depths); the release of palaeo-CO2 from gas bubbles in the ice during basal melting (which occurs at a rate determined by basal melt rates which varies across the bed); and from microbial respiration (Sharp et al., 1999; Montross et al., 2013). The production of CO2 from glacial crushing is therefore an additional source that can provide acidity to drive chemical weathering.
At ML, we calculated gas generation rates using suspended sediment fluxes as an estimate for the long term abrasion rate. Assuming that the present day rates match the longer term abrasion rate, we calculate that 18–21% of CO2 required to sustain chemical weathering rates measured by Hodson et al. (2000) could be generated by grinding of the bedrock and sediment. Although this may be an overestimate if there are significant rates of sediment redistribution relative to abrasion beneath the glacier, the calculation shows the clear potential for CO2 released by grinding to have a significant impact upon CO2 weathering budgets beneath glaciers. The data was not available to calculate weathering rates at RG but given the similarly high magnitudes of CO2 production rates to ML, it is likely that grinding-generated CO2 would be a potential influence on weathering rates at that catchment as well. The trace CO2 generated by grinding igneous and some metamorphic rocks at LG, MG and EG is unlikely to significantly influence dissolution rates in comparison to other sources. However, for glaciers located on sedimentary and some metamorphic bedrock types, which can be found in the Rockies, the Alps, the Himalayas and Antarctica, grinding-generated CO2 has the potential to decrease the amount of CO2 that has previously been interpreted to have been drawn down from the atmosphere by glacial weathering (Hodson et al., 2000).
Glacial Erosion as an Abiogenic Source of Methane
It has been theorized that microbial breakdown of organic matter in overridden sediments has the potential to generate CH4 clathrate beneath ice sheets (Wadham et al., 2008, 2012). Evidence of subglacial CH4 oxidation has also been demonstrated indicating that methanotrophy can potentially remove large quantities of CH4 in areas of the subglacial environment that are oxic, such as subglacial lakes and upper sediment layers (Dieser et al., 2014; Michaud et al., 2017). CH4 has recently been reported in waters emerging from the Greenland Ice Sheet with some indication that net production is occurring in large areas beneath ice sheets (Dieser et al., 2014; Lamarche-Gagnon et al., accepted). These studies have inferred the source of this CH4 to be microbial. CH4 released by the mechanical subglacial erosion of bedrock has not previously been considered as a potential source. This abiogenic source could be significant in some catchments depending upon the catchment's bedrock type and erosion rate.
To investigate the significance of grinding as a source of CH4, we compared estimated generation rates at two geologically contrasting catchments; sedimentary RG and gneissic LG. Grinding at RG generated an order of magnitude more CH4 than at LG despite the considerably lower erosion rate (Table 5), likely due to the order of magnitude higher CH4 production per gram of sample (Figure 1D) from RG's comparatively carbon-rich bedrock. At LG, subglacial CH4 production has recently been estimated to be at least 6 tons per year, for the 600 km2 catchment (Lamarche-Gagnon et al., accepted). This flux was inferred to be from net microbial production of CH4 based on stable isotope analyses of the CH4 exported in subglacial meltwaters. We used catchment rates of CH4 generation by grinding to estimate abiogenic CH4 exported from the LG catchment. Our estimated theoretical CH4 flux from subglacial grinding amounted to 0.14 t y−1, an order of magnitude lower than the measured flux of 6 t y−1 at LG (Lamarche-Gagnon et al., accepted). Thus, rock grinding is less significant than microbial generation as a source of CH4 in catchments with carbon-poor bedrock.
There are no direct measurements of CH4 in subglacial meltwaters at RG. The estimated grinding-generated abiogenic CH4 export at RG was calculated to be 0.005 t y−1, an order of magnitude lower than at LG. However, if the size of the glaciers is taken into account, the export of grinding-generated CH4 per km2 per year is an order of magnitude higher at RG (0.004 t km−2 y−1) than at LG (0.0002 t km−2 y−1). Methanogenesis rates measured in incubated subglacial sediment from both catchments are similar at 0.0002–0.0012 nmol CH4 g−1 d−1 at RG (Boyd et al., 2010) and 0.00018 nmol CH4 g−1 d−1 at LG (Stibal et al., 2012). The similar methanogenesis rates combined with the order of magnitude more CH4 generated by grinding at RG than LG, both per gram of rock and per km2, could indicate that grinding would release more CH4 than methanogenesis at RG. Therefore, abiogenic grinding-generated CH4 release could be a more significant source of CH4 than methanogenesis in catchments with carbon-rich bedrock.
Our results show that abiotic CH4 formation from the subglacial grinding of bedrock likely represents a previously unaccounted CH4 source in subglacial catchments. Grinding of bedrock could even constitute the bulk of CH4 released from subglacial systems in regions with carbon-rich bedrock. As such, grinding-generated CH4 should be considered when analyzing CH4 export from regions experiencing high erosion rates or with bedrock with a high carbon content.
Conclusion
We demonstrate that mechanical erosion of rocks and minerals beneath glaciers generates a previously unappreciated source of gases relevant to subglacial microbial processes and chemical weathering. We present the first experimental evidence that the grinding of rock and sediment samples from glaciated catchments with widely varying geologies have the potential to generate significant quantities of CO2, CO, CH4, other short chain hydrocarbons and, consistent with previous work, H2 (Telling et al., 2015). The significance of grinding-generated gases for microbial and chemical dissolution processes depends on three primary factors. First, the amount of gas emitted during the mechanical breakdown of a rock will depend upon its mineral composition, the presence of pore spaces in the rock and the presence of fluid inclusions and their composition. Second, the erosion rate in the glaciated catchment will determine how rapidly rocks, sediment and minerals are mechanically broken down and thus, the rate at which gas is emitted. Third, the significance of gas generation via erosion will be determined in part by the comparative rates of supply from other sources in the catchment. Our experiments have shown that glacial erosion has the potential to release CO2 in sedimentary and some metamorphic catchments at rates that can influence the magnitude of the atmospheric CO2 budget required to drive weathering. Beneath glaciers of all bedrock types, we would expect to see generation of H2 and CH4 by glacial erosion. For catchments where CO2 is generated in addition to H2, such as catchments with sedimentary bedrock or basement bedrock as found in Greenland, some portion of hydrogenotrophic methanogenesis could be supported by grinding-generated gases beneath the ice. CH4 generation from glacial erosion was common to all bedrock types and was shown to be particularly important in sedimentary catchments where rates of grinding-generation could be greater than in situ microbial production. Future studies should determine whether the gases produced in this study are directly utilized by microbial processes or weathering reactions through laboratory incubations with grinding-generated gases. Our findings show that mechanically-generated H2, CO2, CO, and CH4 should be considered in future studies which investigate microbial or geochemical subglacial processes, particularly energy sources for microbes, CH4 cycling beneath ice, and chemical weathering processes.
Data Availability
Raw data supporting the conclusions of this manuscript are available at doi: 10.6084/m9.figshare.7350041.
Author Contributions
JT conceived the study; MM, JT, and MS collected samples and MS supplied data; MM conducted the experiments and analyzed the data. JT and JW assisted with data analysis. MM wrote the first draft of the manuscript with contributions from JW. All authors contributed to the final manuscript.
Funding
This research was primarily funded by a Natural Environment Research Council studentship [NE/L002434/1] awarded to MM. This research was further supported by SSF Arctic Field Grant 257104/E10 to MM and by NASA grants NNX10AT31G and NNX16AJ64G to MS. A Benjamin Meaker Fellowship to MS from the Institute of Advance Studies, University of Bristol fostered the development of aspects of this work.
Conflict of Interest Statement
The authors declare that the research was conducted in the absence of any commercial or financial relationships that could be construed as a potential conflict of interest.
Acknowledgments
We would like to thank Guillaume Lamarche-Gagnon for his assistance with collecting the rock samples and discharge data in Svalbard and Nick Cox for logistical support at the UK Arctic Research Station in Svalbard. The Biogeosciences Institute at University of Calgary's Kananaskis Field Station are thanked for use of their laboratory facilities. Mr. James Williams and Dr Fotis Sgouridis in LOWTEX Laboratories at the University of Bristol are thanked for laboratory support. We thank the reviewers for their constructive comments on the manuscript.
References
Bone, N. (2014). The Daily Grind: A Novel Source of Hydrogen Generated During Subglacial Bedrock Crushing. M.Sc. Thesis, University of Bristol, 47.
Boyd, E. S., Hamilton, T. L., Havig, J. R., Skidmore, M. L., and Shock, E. L. (2014). Chemolithotrophic primary production in a subglacial ecosystem. Appl. Environ. Microbiol. 80, 6146–6153. doi: 10.1128/AEM.01956-14
Boyd, E. S., Skidmore, M., Mitchell, A. C., Bakermans, C., and Peters, J. W. (2010). Methanogenesis in subglacial sediments. Environ. Microbiol. Rep. 2, 685–692. doi: 10.1111/j.1758-2229.2010.00162.x
Burke, E. A. J. (2001). Raman microspectrometry of fluid inclusions. Lithos 55, 139–158. doi: 10.1016/S0024-4937(00)00043-8
Christner, B. C., Montross, G. G., and Priscu, J. C. (2012). Dissolved gases in frozen basal water from the NGRIP borehole: implications for biogeochemical processes beneath the Greenland Ice Sheet. Polar Biol. 35, 1735–1741. doi: 10.1007/s00300-012-1198-z
Christner, B. C., Priscu, J. C., Achberger, A. M., Barbante, C., Carter, S. P., Christianson, K., et al. (2014). A microbial ecosystem beneath the West Antarctic ice sheet. Nature 512, 310–313. doi: 10.1038/nature13667
Conrad, R. (1996). Soil microorganisms as controllers of atmospheric trace gases (H2, CO, CH4, OCS, N2O, and NO). Microbiol. Rev. 60, 609–640.
Cowton, T., Nienow, P., Bartholomew, I., Sole, A., and Mair, D. (2012). Rapid erosion beneath the Greenland ice sheet. Geology 40, 343–346. doi: 10.1130/G32687.1
Deeds, D. A., Kulongoski, J. T., Mühle, J., and Weiss, R. F. (2015). Tectonic activity as a significant source of crustal tetrafluoromethane emissions to the atmosphere: observations in groundwaters along the San Andreas Fault. Earth Planet. Sci. Lett. 412, 163–172. doi: 10.1016/j.epsl.2014.12.016
Diamond, L. W. (2001). Review of the systematics of CO2-H2O fluid inclusions. Lithos 55, 69–99. doi: 10.1016/S0024-4937(00)00039-6
Dieser, M., Broemsen, E. L., Cameron, K. A., King, G. M., Achberger, A., Choquette, K., et al. (2014). Molecular and biogeochemical evidence for methane cycling beneath the western margin of the Greenland Ice Sheet. ISME J. 8, 2305–2316. doi: 10.1038/ismej.2014.59
Dow, C. F., Hubbard, A., Booth, A. D., Doyle, S. H., Gusmeroli, A., and Kulessa, B. (2013). Seismic evidence of mechanically weak sediments underlying Russell Glacier, West Greenland. Ann. Glaciol. 54, 135–141. doi: 10.3189/2013AoG64A032
Doxsey-Whitfield, E. (2012). Magnitude and Controls of Microbial Nitrate Production in the Streams and Till of A Glaciated Alpine Catchment. Canadian Rocky Mountains, Alberta. MSc thesis, Queen's University, 191.
Engelhardt, M., Schuler, T. V., and Andreassen, L. M. (2015). Sensitivities of glacier mass balance and runoff to climate perturbations in Norway. Ann. Glaciol. 56, 79–88. doi: 10.3189/2015AoG70A004
Hallet, B., Hunter, L., and Bogen, J. (1996). Sediment evacuation and glacial erosion rates at a small alpine glacier. Glob. Planet. Change 12, 213–235. doi: 10.1016/0921-8181(95)00021-6
Harper, J. T., Humphrey, N. F., Meierbachtol, T. W., Graly, J. A., and Fischer, U. H. (2017). Borehole measurements indicate hard bed conditions, Kangerlussuaq sector, western Greenland Ice Sheet. J. Geophys. Res. Earth Surf. 122, 1605–1618. doi: 10.1002/2017JF004201
Hasholt, B., and Mernild, S. H. (2006). “Glacial erosion and sediment transport in the Mittivakkat Glacier catchment, Ammassalik Island, southeast Greenland, 2005,” in Sediment Dynamics and the Hydromorphology of Fluvial System (Proceedings of a symposium held in Dundee, UK. July 2006), 306 (Dundee), 45–55.
Hawkings, J., Wadham, J., Tranter, M., Telling, J., Bagshaw, E., Beaton, A., et al. (2016). The Greenland Ice Sheet as a hot spot ofphosphorus weathering and export in the Arctic. Global Biogeochem. Cycles 30, 191–210. doi: 10.1002/2015GB005237
Hawkings, J. R., Wadham, J. L., Benning, L. G., Hendry, K. R., Tranter, M., Tedstone, A., et al. (2017). Ice sheets as a missing source of silica to the polar oceans. Nat. Commun. 8:14198. doi: 10.1038/ncomms14198
Hawkings, J. R., Wadham, J. L., Tranter, M., Lawson, E., Sole, A., Cowton, T., et al. (2015). The effect of warming climate on nutrient and solute export from the Greenland Ice Sheet. Geochem. Perspect. Lett. 1, 94–104. doi: 10.7185/geochemlet.1510
Hirose, T., Kawagucci, S., and Suzuki, K. (2011). Mechanoradical H2 generation during simulated faulting: implications for an earthquake-driven subsurface biosphere. Geophys. Res. Lett. 38, 1–5. doi: 10.1029/2011GL048850
Hodson, A., Mumford, P., and Lister, D. (2004). Suspended sediment and phosphorous in proglacial rivers: bioavailability and potential impacts upon the P status of ice-marginal receiving waters. Hydrol. Process. 18, 2409–2422. doi: 10.1002/hyp.1471
Hodson, A., Tranter, M., and Vatne, G. (2000). Contemporary rates of chemical denudation and atmospheric CO2 sequestration in glacier basins: an arctic perspective. Earth Surf. Process. Landforms 25, 1447–1471. doi: 10.1002/1096-9837(200012)25:13<1447::AID-ESP156>3.0.CO;2-9
Ito, T., Nagamine, K., Yamamoto, K., and Adachi, M. (1999). Preseismic hydrogen gas anomalies caused by stress-corrosion process preceding earthquakes. Geophys. Res. Lett. 26, 2009–2012.
Kameda, J., Saruwatari, K., and Tanaka, H. (2003). H2 generation in wet grinding of granite and single-crystal powders and implications for H2 concentration on active faults. Geophys. Res. Lett. 30, 3–7. doi: 10.1029/2003gl018252
Kameda, J., Saruwatari, K., Tanaka, H., and Tsunomori, F. (2004). Mechanisms of hydrogen generation during the mechanochemical treatment of biotite within D2O media. Earth Planets Space 56, 1241–1245. doi: 10.1186/BF03353346
Kristof, V. A., Juhasz, A., and Vassanyi, I. (1993). The effect of mechanical treatment on the crystal structure and thermal behavior of kaolinite. Clays Clay Miner. 41, 608–612. doi: 10.1346/CCMN.1993.0410511
Kulessa, B., Hubbard, A. L., Booth, A. D., Bougamont, M., Dow, C. F., Doyle, S. H., et al. (2017). Seismic evidence for complex sedimentary control of Greenland Ice Sheet flow. Sci. Adv. 3:e1603071. doi: 10.1126/sciadv.1603071
Lamarche-Gagnon, G., Wadham, J. L., Lollar, B. S., Arndt, S., Fietzek, P., Beaton, A. D., et al. (accepted). Greenland melt drives continuous export of methane from its bed. Nature.
Lawson, E. C., Wadham, J. L., Tranter, M., Stibal, M., Lis, G. P., Butler, C. E. H., et al. (2014). Greenland ice sheet exports labile organic carbon to the arctic oceans. Biogeosciences 11, 4015–4028. doi: 10.5194/bg-11-4015-2014
Lee, A. G. G., and Rutter, E. H. (2004). Experimental rock-on-rock frictional wear: application to subglacial abrasion. J. Geophys. Res. B Solid Earth 109, 1–11. doi: 10.1029/2004JB003059
Lovley, D. R., and Goodwin, S. (1990). Hydrogen concentrations as an indicator of the predominant terminal electron accepting reaction sin aquatic sediments. Geochim. Cosmochim. Acta 52, 2993–3003.
Martinelli, G., and Plescia, P. (2005). Carbon dioxide and methane emissions from calcareous-marly rock under stress: experimental tests results. Ann. Geophys. 48, 167–173. doi: 10.4401/ag-3191
Michaud, A. B., Dore, J. E., Achberger, A. M., Christner, B. C., Mitchell, A. C., Skidmore, M. L., et al. (2017). Microbial oxidation as a methane sink beneath the West Antarctic Ice Sheet. Nat. Geosci. 10, 582–586. doi: 10.1038/NGEO2992
Montross, S. N., Skidmore, M., Tranter, M., Kivimäki, A. L., and Parkes, R. J. (2013). A microbial driver of chemical weathering in glaciated systems. Geology 41, 215–218. doi: 10.1130/G33572.1.
Oelgeschläger, E., and Rother, M. (2008). Carbon monoxide-dependent energy metabolism in anaerobic bacteria and archaea. Arch. Microbiol. 190, 257–269. doi: 10.1007/s00203-008-0382-6
Osborn, S. G., and McIntosh, J. C. (2010). Chemical and isotopic tracers of the contribution of microbial gas in devonian organic-rich shales and reservoir sandstones, northern Appalachian Basin. Appl. Geochem. 25, 456–471. doi: 10.1016/j.apgeochem.2010.01.001
Potter, J., and Konnerup-Madsen, J. (2003). A review of the occurrence and origin of abiogenic hydrocarbons in igneous rocks. Geol. Soc. Lond. Spec. Publ. 214, 151–173. doi: 10.1144/GSL.SP.2003.214.01.10
Scanlon, R. (2017). Modeling Mass Balance at Robertson Glacier, Alberta, Canada 1912–2012. M.Sc. Thesis, Montana State University, 108.
Sharp, M., Parkes, J., Fairchild, I. J., Lamb, H., and Tranter, M. (1999). Widespread bacterial populations at glaciers beds and their relationship to rock weathering and carbon cycling. Geology 27, 107–110. doi: 10.1130/0091-7613(1999)027<0107:WBPAGB>2.3.CO
Skidmore, M. (2011). “Microbial communities in Antarctic subglacial aquatic environments,” in Antarctic Subglacial Aquatic Environments, eds Siegert, Bindschadler, and Kennicutt (Washington, DC: AGU Press), 61–81. doi: 10.1029/2010GM000995
Skidmore, M. L., Foght, J. M., and Sharp, M. J. (2000). Microbial Life beneath a High Arctic Glacier. Appl. Environ. Microbiol. 66, 3214–3220. doi: 10.1128/AEM.66.8.3214-3220.2000
Sleep, N. H., and Zoback, M. D. (2007). Did earthquakes keep the early crust habitable? Astrobiology 7, 1023–1032. doi: 10.1089/ast.2006.0091
Stibal, M., Wadham, J. L., Lis, G. P., Telling, J., Pancost, R. D., Dubnick, A., et al. (2012). Methanogenic potential of Arctic and Antarctic subglacial environments with contrasting organic carbon sources. Glob. Chang. Biol. 18, 3332–3345. doi: 10.1111/j.1365-2486.2012.02763.x
Sugisaki, R., Ido, M., Takeda, H., Isobe, Y., Hayashi, Y., Nakamura, N., et al. (1983). Origin of hydrogen and carbon dioxide in fault gases and its relation to fault activity. J. Geol. 91, 239–258. doi: 10.1086/628769
Suzuki, N., Saito, H., and Hoshino, T. (2017). Hydrogen gas of organic origin in shales and metapelites. Int. J. Coal Geol. 173, 227–236. doi: 10.1016/j.coal.2017.02.014.
Takahashi, H. (1959). Effects of dry grinding on kaolin minerals. I. Kaolinite. Bull. Chem. Soc. Jpn. 32, 235–245. doi: 10.1246/bcsj.32.374
Telling, J., Boyd, E. S., Bone, N., Jones, E. L., Tranter, M., Macfarlane, J. W., et al. (2015). Rock comminution as a source of hydrogen for subglacial ecosystems. Nat. Geosci. 8, 851–855. doi: 10.1038/ngeo2533
Tranter, M., Brown, G. H., Hodson, A., and Gurnell, A. M. (1996). Hydrochemistry as an indicator of subglacial drainage system structure: a comparison of alpine and sub-polar environments. Hydrol. Process. 10, 541–556. doi: 10.1002/(SICI)1099-1085(199604)10:4<541::AID-HYP391>3.3.CO;2-0
Tranter, M., Sharp, M. J., Lamb, H. R., Brown, G. H., Hubbard, B. P., and Willis, I. C. (2002). Geochemical weathering at the bed of Haut glacier d'Arolla, Switzerland - A new model. Hydrol. Process. 16, 959–993. doi: 10.1002/hyp.309
Wadham, J. L., Arndt, S., Tulaczyk, S., Stibal, M., Tranter, M., Telling, J., et al. (2012). Potential methane reservoirs beneath Antarctica. Nature 488, 633–637. doi: 10.1038/nature11374
Wadham, J. L., Bottrell, S., Tranter, M., and Raiswell, R. (2004). Stable isotope evidence for microbial sulphate reduction at the bed of a polythermal high Arctic glacier. Earth Planet. Sci. Lett. 219, 341–355. doi: 10.1016/S0012-821X(03)00683-6
Wadham, J. L., De'Ath, R., Monteiro, F. M., Tranter, M., Ridgwell, A., Raiswell, R., et al. (2013). The potential role of the Antarctic Ice Sheet in global biogeochemical cycles. Earth Environ. Sci. Trans. R. Soc. Edinburgh 104, 55–67. doi: 10.1017/S1755691013000108
Wadham, J. L., Tranter, M., Tulaczyk, S., and Sharp, M. (2008). Subglacial methanogenesis: a potential climatic amplifier? Global Biogeochem. Cycles 22, 1–16. doi: 10.1029/2007GB002951
Wang, Q., Shen, C., Chen, Q., Zhang, L., and Lu, H. (2015). Pore characteristics and gas released by crush methods of Wufeng-Longmaxi Shale in the northwest of Hubei Province, China. Acta Geol. Sin. 89, 93–96. doi: 10.1111/1755-6724.12302_40
Wynn, P. M., Hodson, A., and Heaton, T. (2006). Chemical and isotopic switching within the subglacial environment of a High Arctic glacier. Biogeochemistry 78, 173–193. doi: 10.1007/s10533-005-3832-0
Keywords: subglacial environment, rock grinding, chemical weathering, CO2 drawdown, hydrogen, methane, microbial energy source, gas generation
Citation: Macdonald ML, Wadham JL, Telling J and Skidmore ML (2018) Glacial Erosion Liberates Lithologic Energy Sources for Microbes and Acidity for Chemical Weathering Beneath Glaciers and Ice Sheets. Front. Earth Sci. 6:212. doi: 10.3389/feart.2018.00212
Received: 29 July 2018; Accepted: 05 November 2018;
Published: 22 November 2018.
Edited by:
Julia Ribeiro, Rice University, United StatesReviewed by:
Peter Michael Wynn, Lancaster Environment Centre, Lancaster University, United KingdomFrancois L. L. Muller, National Sun Yat-sen University, Taiwan
Copyright © 2018 Macdonald, Wadham, Telling and Skidmore. This is an open-access article distributed under the terms of the Creative Commons Attribution License (CC BY). The use, distribution or reproduction in other forums is permitted, provided the original author(s) and the copyright owner(s) are credited and that the original publication in this journal is cited, in accordance with accepted academic practice. No use, distribution or reproduction is permitted which does not comply with these terms.
*Correspondence: Moya L. Macdonald, m.macdonald@bristol.ac.uk