Protein and Carbohydrate Exopolymer Particles in the Sea Surface Microlayer (SML)
 Daniel C. O. Thornton
 Sarah D. Brooks2
 - 1Department of Oceanography, Texas A & M University, College Station, TX, USA
- 2Department of Atmospheric Sciences, Texas A & M University, College Station, TX, USA
Exchanges of matter and energy between ocean and atmosphere occur through the sea surface microlayer (SML). The SML is the thin surface layer of the ocean at the ocean-atmosphere interface that has distinctive physical, chemical and biological properties compared with the underlying water. We measured the concentration of two types of exopolymer particles in the SML and underlying water in the Pacific Ocean off the coast of Oregon (United States) during July 2011. Transparent exopolymer particles (TEP) are defined by their acidic polysaccharide content, whereas Coomassie staining particles (CSP) are composed of protein. TEP and CSP were ubiquitous in the SML. TEP were not significantly enriched in the SML compared with the underlying water. CSP were significantly enriched in the SML, with an enrichment factor (EF) of 1.4–2.4. The distribution of exopolymer particles in the water and microscopic imaging indicated that TEP and CSP are distinct populations of particles rather than different chemical components of the same particles. Dissolved polysaccharides were not enriched in the SML, whereas monosaccharides had an EF of 1.2–1.8. Sampling occurred during the collapse of a diatom bloom, and diatoms were found both in the water column and SML. While there were living diatoms in the samples, most of the diatoms were dead and there were abundant empty frustules covered in layer of TEP. The collapsing diatom bloom was probably the source of exopolymer particles to both the SML and underlying water. Exopolymer particles are a component of the SML that may play a significant role in the marine carbon and nitrogen cycles, and the exchange of material between ocean and atmosphere.
Introduction
The sea surface microlayer (SML) is the thin skin that covers the ocean, and therefore the majority (71%) of the Earth's surface. Hunter (1997) defined the SML as “that microscopic portion of the surface ocean which is in contact with the atmosphere and which may have physical, chemical or biological properties that are measurably different from those of adjacent sub-surface waters.” It is operationally defined as being 1–1000 μm thick (Liss and Duce, 1997). Many constituents of the SML occur at higher concentrations than in the underlying waters (Cunliffe et al., 2011). Enrichment factors (EF) are used to express the relative concentration of an analyte in the SML relative to the underlying water and are simply the quotient of the concentration in the SML and bulk water. For example, the SML is frequently enriched (EF > 1) with dissolved organic carbon (DOC) (Sieburth et al., 1976; Hunter, 1997; Reinthaler et al., 2008). The SML is dynamic, and its composition and the enrichment in particular chemicals or organisms varies considerably in time and space (Karavoltsos et al., 2015).
Microorganisms are frequently more abundant in the SML compared with the underlying water. Aller et al. (2005) found that the EF for bacteria and virus abundances were 10 and 7, respectively. Protistan community composition in the SML is different from the underlying waters and is enriched in some taxa (Joux et al., 2006; Cunliffe and Murrell, 2010; Taylor and Cunliffe, 2014). Joux et al. (2006) proposed that buoyant particles and bubbles play a role in the enrichment of the SML with specific taxa. Research has shown differences in the bacterial community composition of the SML compared with the underlying water (Franklin et al., 2005; Cunliffe et al., 2009), whereas other work has shown no significant difference (Agogué et al., 2005; Obernosterer et al., 2008). While the SML is potentially enriched in substrates to support microbial growth, it is also a harsh environment due to exposure to high photon flux densities, including ultraviolet light. The burden of photoprotection may explain that while rates of bacterial respiration are high, growth efficiency is lower than the underlying water (Reinthaler et al., 2008).
The current model of the SML (Wurl and Holmes, 2008; Cunliffe and Murrell, 2009; Wurl et al., 2011) stems from the work of Sieburth (1983) who first proposed that the SML was a loose, hydrated gel of macromolecules and colloids. This “gelatinous film” is enriched with transparent exopolymer particles (TEP) compared with underlying waters (Wurl and Holmes, 2008; Cunliffe et al., 2011). TEP are rich in acid polysaccharides (Alldredge et al., 1993). Work over the last 20 years has shown that TEP are ubiquitous and play an important role in particle dynamics and carbon cycling in the ocean (see reviews by Passow, 2002a; Burd and Jackson, 2009; Verdugo, 2012). Ultraviolet light enhances TEP production by microorganisms (Ortega-Retuerta et al., 2009), indicating that the high concentrations of microorganisms in the SML may be a significant source of TEP. However, the effects of ultraviolet light are complex as it also causes TEP photolysis (Ortega-Retuerta et al., 2009). Another source of exopolymers to the SML is the accumulation of surface-active material on bubbles rising through the water column (Wurl and Holmes, 2008). TEP can be buoyant and rise up toward the ocean surface, particularly if there are relatively few solid particles embedded in it (Azetsu-Scott and Passow, 2004; Mari, 2008). Coomassie staining particles (CSP) are exopolymer particles that are detected based on their protein content (Long and Azam, 1996). Relatively few measurements of CSP have been made in the ocean. CSP deserve more attention, as they may be a significant pool of bioavailable nitrogen in aquatic systems, including in the SML.
The SML is biogeochemically important as all exchanges of material between ocean and atmosphere must occur through it. Several studies, using a variety of methods, have identified gel-like particles and exopolymers in aerosols collected over the Arctic Ocean (Bigg and Leck, 2008; Leck and Bigg, 2008; Orellana et al., 2011). Kuznetsova et al. (2005) measured both TEP and CSP in aerosols generated using Atlantic waters. There is a growing interest in the role of marine biogenic aerosol in atmospheric processes, including cloud formation and climate forcing (Russell et al., 2010; Orellana et al., 2011; Quinn et al., 2014; Wang et al., 2015; Wilson et al., 2015).
The primary objectives of this work were: (1) to determine if CSP and TEP are concentrated in the SML compared with underlying waters, and (2), to determine if there was a direct relationship between TEP and CSP concentrations in the SML and underlying waters. Our approach differs from recent work (Wurl and Holmes, 2008; Cunliffe et al., 2009; Wurl et al., 2009, 2011) as we measured TEP concentrations using microscopy and image analysis rather than the colorimetric technique. Because image analysis was used to enumerate both TEP and CSP particles, the data collected on these two types of exopolymer particle were directly comparable. CSP have been overlooked in the SML and have only been measured in two previous studies (Kuznetsova et al., 2005; Engel and Galgani, 2016). Image analysis also allowed us to qualitatively determine what other visible particles were associated with TEP and CSP in the SML and underlying water and thereby determine the associations between exopolymers (TEP and CSP) and other particles.
Methods
Study Stations and Sampling
Samples were collected during a cruise onboard the R/V Wecoma in coastal waters of the Pacific Ocean off the state of Oregon (United States) during July 2011. The vessel left Newport (OR) on the 8 July 2011 and returned on 14 July 2011. Samples were collected along a seaward transect out from the mouth of the Columbia River (stations A, B, and C) and at two stations further south in deeper waters beyond the shelf break (stations D and E). Figure 1 and Table 1 shows the location of the stations at which exopolymer (TEP and CSP) and carbohydrate samples were taken. Prior to sampling, glassware was acid washed (5% HCl) overnight, rinsed at least three times in reverse osmosis water and a further two times using ultra high purity (UHP) water. Items were then individually wrapped in aluminum foil and combusted for 2 h at 150°C followed by 4 h at 500°C. GF/F filters (Whatman, nominal pore size of 0.7 μm) were used to filter sea water for dissolved carbohydrate analysis. Each filter was individually wrapped in aluminum foil and combusted at 150°C for 2 h followed by 500°C for 7 h.
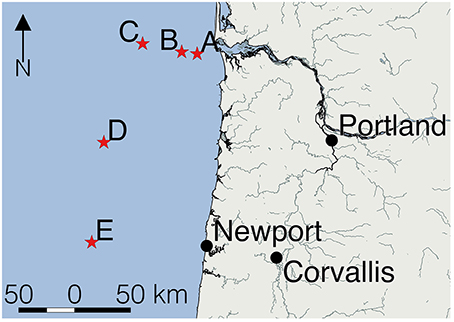
Figure 1. Location of the five sampling sites in the eastern Pacific Ocean. Sampling stations (red stars) were located off Oregon (United States). Station A was located closest to the mouth of the Columbia River.
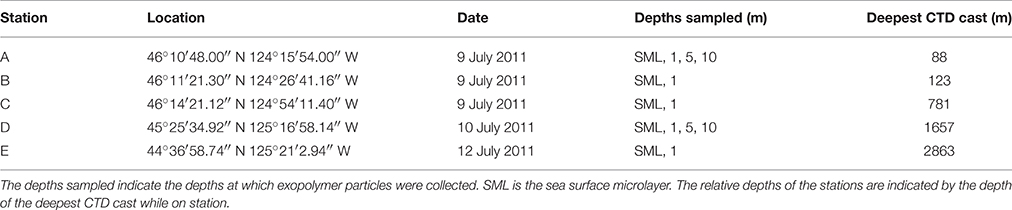
Table 1. Stations sampled in the eastern Pacific Ocean off the coast of Oregon (United States) in July 2011.
It is challenging to collect samples of the SML in the ocean as the platform from which the samples are taken disrupts the SML during the sampling process (Wurl, 2009). To reduce these effects, samples of the SML and underlying water were collected from a rigid hulled inflatable boat (RHIB) launched from the R/V Wecoma. Samples were taken by going ahead of the R/V Wecoma in the RHIB to reduce the effects of the ship's wake on sample integrity. The wake of the RHIB will also disturb the SML, therefore samples were collected when the RHIB was drifting through the water rather than under power. The SML was sampled by repeatedly dipping a glass plate vertically into the water over the side of the RHIB (Harvey and Burzell, 1972; Wurl, 2009). The glass plates were made from 0.2 cm thick window glass. An insulation foam handle was mounted onto the glass and the sampling area was 25 × 26 cm in size, which was a total area of 1300 cm2 (0.13 m2), including both sides of the plate. While larger plates would collect a larger sample of water with one dip, safety considerations limit the size of the plate to a size that can easily be handled at sea in the RHIB.
The plate was dipped into the water vertically and withdrawn at a rate of approximately 5 cm s−1. Excess water was allowed to drain off the plate for a few seconds and the SML was scraped into a polyethylene funnel placed in a 500 ml glass bottle (medium bottle, VWR Scientific). The scrapers were 8′ (203 mm) polystyrene taping knives (Wal-Board Tools, Home Depot). Plasticware was soaked in 5% HCl for 48 h and rinsed multiple times in UHP water before the cruise. To get sufficient sample for analysis, two operators dipped plates simultaneously, one on each side of the bow of the RHIB, while a third person ensured that splashes and other extraneous water did not enter the sample bottle. The dips were pooled into one bottle and each dip recovered 3–5 ml. The process was continued until 350–500 ml of sample was collected. The R/V Wecoma was stationary during RHIB operations and CTD casts were made during this time. The CTD rosette included instruments to measure temperature, salinity, oxygen concentrations, and chlorophyll fluorescence. The position of the RHIB relative to the R/V Wecoma was generally within 500 m.
In addition to sampling the SML, water was collected using a portable peristaltic pump (Alexis pump, Pegasus Pump Company, Bradenton, Florida) at depths of 1, 5, and 10 m from the RHIB (Table 1). The peristaltic pump was set up for collecting water samples for trace metal analysis (Aaron Beck, personal communication). The tubing running through the pump was Masterflex C-flex tubing (Cole-Parmer) connected to the fluorinated ethylene propylene (FEP) tubing that was lowered into the ocean. Prior to the cruise, the tubing was soaked in 6 M HCl for 6 months and rinsed in UHP water. The tubing was lowered over the side of the boat using a weighted line, ensuring that it descended vertically to ensure that the correct depth was sampled. The pump was flushed for 5 min to push five times the volume of the tubing through the pump before the water was collected. Samples were collected into 500 ml medium bottles, which were rinsed 3 times with site water from the correct depth before the sample was collected. One bottle was filled per sample depth. All water samples were placed in a cooler and returned to the R/V Wecoma, where they were processed immediately.
Preparation of TEP and CSP Samples
Both TEP and CSP were separated from the water sample by filtration onto 25 mm diameter 0.4 μm pore size polycarbonate filters (Nuclepore, Whatman). Low vacuum (<150 mm Hg) was used to ensure that the delicate exopolymer particles were retained on the filters (Alldredge et al., 1993; Passow and Alldredge, 1995). A glass fiber filter (GF/C, Whatman) was placed onto a drop of UHP water on top of the sintered glass filter bed. Another drop of UHP water was placed on top of the GF/C filter and the polycarbonate filter was floated on top of this drop and an extremely low vacuum was used to draw it down onto the GF/C filter, ensuring that no air bubbles were trapped between the filters. These steps were taken to ensure an even distribution of sample across the polycarbonate filter. The volume of water sampled was varied between sites (20–50 ml) with the objective of obtaining enough material to analyze without overloading the filter with sample. Once all the sample was drawn through the filter, then it was either stained for TEP using Alcian blue, or with Coomassie Brilliant Blue for CSP. Due to the similar blue color of the dyes it was not possible to stain for both TEP and CSP on the same filter.
TEP were stained with 1 ml of Alcian blue 8GX (Sigma-Aldrich) solution at pH 2.5 (0.02% (w/v) in 0.06% acetic acid (v/v); Passow and Alldredge, 1995). The dye was allowed to stain the TEP retained on the filter for 5 s and then it was drawn through the filter at low vacuum. Excess dye was rinsed through the filter with two 1 ml rinses of UHP water. The filter was placed in a drop of immersion oil on a Cyto-clear microscope slide (GE Water and Process Technologies; Logan et al., 1994). A second drop of oil was placed on top of the filter and it was covered with a glass coverslip. Prepared slides were stored frozen (−20°C) in the dark until analysis. CSP slides were prepared using the same protocol, except that the filters were stained with a solution of Coomassie Brilliant Blue G-250 (Sigma-Aldrich) (Long and Azam, 1996), a stain commonly used to quantify proteins in solutions (Bradford, 1976). Working Coomassie Brilliant Blue G-250 solutions were prepared each day by making a 1/25 dilution of the stock solution (1 g Coomassie Brilliant Blue G-250 in 100 ml of UHP water) with 0.2 μm filtered artificial seawater salts (Berges et al., 2001). This resulted in a 0.04 % (w/v) working solution with a pH of 7.4. Three TEP slides and three CSP slides were prepared per sample bottle.
Image Analysis of TEP and CSP
Microscope slides were photographed and analyzed on return to the laboratory at Texas A&M University. Images were captured using a AxioCam ERc 5 s color camera (Carl Zeiss MicroImaging) mounted on a Axioplan 2 microscope (Carl Zeiss MicroImaging) run from Axiovision 4.8 software (Carl Zeiss MicroImaging). To ensure that the images could be quantitatively analyzed it was important to standardize the imaging and therefore the setup of the microscope. Ten images were taken working across the diameter of the filtered area. Medium sized (1280 × 960 pixels) rather than large images (2560 × 1920) were taken to reduce vignetting.
Images were processed quantitatively in ImageJ (National Institutes of Health; Schneider et al., 2012) using a protocol based on Engel (2009). Images were analyzed from the JPEG format using a calibrated LCD monitor (MultiSync PA241W, NEC). Particles that did not stain blue were removed from the image for analysis. This was done using the brush and pencil tools in ImageJ to cover up the particles with the background color of that specific image. The image was then split into three color channels corresponding to the primary colors that make up the original color image (red, blue, and green). The blue and green images were discarded and further analysis was carried out on the grayscale representation of the red channel as this channel accentuated the exopolymer particles against the background. Quantitative analysis required a binary (black and white) image and therefore a threshold was selected along the 256 point grayscale to determine what were exopolymer particles (black pixels) and what was background (white). A constant threshold value could not be used as the filter itself absorbs dye and there is variation between filters. The triangle method (Zack et al., 1977) was used to determine the threshold within ImageJ and produce the final binary image.
The binary images were analyzed using protocols to determine the total area of exopolymer particles and the particle size distribution (PSD). Particles with an area <10 μm2 were not included in the analysis as many of these were noise caused by the uneven adsorption of dye to the filter giving it a slightly grainy appearance. The total area of exopolymer was determined automatically in ImageJ and included all particles ≥10 μm2. Other data extracted from the images were the total number of particles and the sizes of individual particles. Particles overlapping the edges of the image were included in the measure of total TEP area per image and in the particle counts. The final data were total exopolymer particle area per unit volume, particle number per unit volume, and particle size distributions.
In addition to TEP and CSP, the samples contained numerous other microscopic particles and amorphous aggregates of organic matter. Qualitative notes were kept as a description of these particles and their relative abundance in the different samples. Separate images of representative non-exopolymer particles were captured. These images were not used in the quantitative analysis as they were set up to capture the best quality image of the objects in question (for example, objects of interest were centered in the field of view) rather than using the standardized protocols described above.
Measurement of Dissolved Carbohydrates
Three aliquots from each bottle were filtered under low vacuum through combusted GF/F filters and the filtrate was placed in glass vials with Teflon lined caps and frozen in the dark at −20°C until analysis. Samples were analyzed for carbohydrates from the SML and 1 m water depths. Samples for carbohydrate were analyzed using the 2,4,6-tripyridyl-s-triazine (TPTZ) method of Myklestad et al. (1997) calibrated with D-glucose as a standard over the range 0–2 mg l−1 (0–66.7 μmol l−1 C). Results are expressed as glucose carbon equivalents. Measurements were made by absorbance (595 nm) in a 1 cm path cuvette against an UHP water blank using a spectrophotometer (UV-mini 1240, Shimadzu). Dissolved monosaccharides were measured directly using 1 ml of thawed sample. Total dissolved carbohydrate was measured after hydrolysis into monosaccharides. Hydrolysis was carried out in 10 ml glass ampoules (Wheaton, Milleville, New Jersey) into which 4 ml of sample was placed with 0.4 ml of 1 M HCl. The ampoules were sealed in a flame and heated to 85°C for 24 h in a drying oven. After acid hydrolysis, the vials were opened and the contents was neutralized with 1 M NaOH and analyzed as before using the TPTZ method. Preliminary experiments were conducted to optimize hydrolysis conditions (Chen, 2014). The mean recovery rate of starch hydrolyzed for 24 h at 85°C with 0.09 M HCl was 79%.
Data Analysis
Data were plotted and analyzed using SigmaPlot 12.0 (Systat Software Inc.). Analysis of variance (ANOVA) was conducted on data that met the assumptions of normality and equality of variance. Data that did not meet these assumptions were transformed before analysis. If the transformed data did not meet these assumptions, then a non-parametric statistical test was used. One-tailed t-tests to determine whether the SML was significantly enriched compared with the underlying water were calculated using a spreadsheet in Excel (Microsoft Corporation) following methods in Zar (1996).
Results
Hydrographic Profiles and Distribution of Exopolymers (TEP and CSP)
Table 1 shows the location of the five sampling stations off the coast of Oregon, including the depths of the deepest hydrographic casts at each station. Station D and E were south of the Columbia River mouth and west of the shelf break over deeper waters (Figure 1). As we were interested in the SML, the depth profiles presented in this paper are to a relatively shallow depth of 25 m (Figures 2, 3). Detailed depth profiles are presented for stations A and D, as these were the stations at which samples for exopolymer particles were taken at several depths (Table 1). Station A, which was over the continental shelf and closest to the mouth of the Columbia River (Figure 1), shows riverine influence (Figure 2). Surface waters were relatively warm, decreasing from 14.3°C at 1 m to 8.3°C at 25 m (Figure 2A). There was a distinct shallow halocline, with a salinity of 18.2 at 1 m and 30.8 at 5 m (Figure 2A). TEP and CSP concentrations were relatively constant with depth from 1 to 10 m, with TEP concentration higher than CSP concentration (Figure 2B). In the SML, CSP concentration was greater than TEP (Figure 2B). The chlorophyll maximum was located just below the halocline, with a peak chlorophyll concentration of 2.82 mg m−3 at 7 m (Figure 2C). Oxygen concentration peaked just below the chlorophyll maximum, with a concentration of 263 μmol O2 kg−1 at 11 m (Figure 2D).
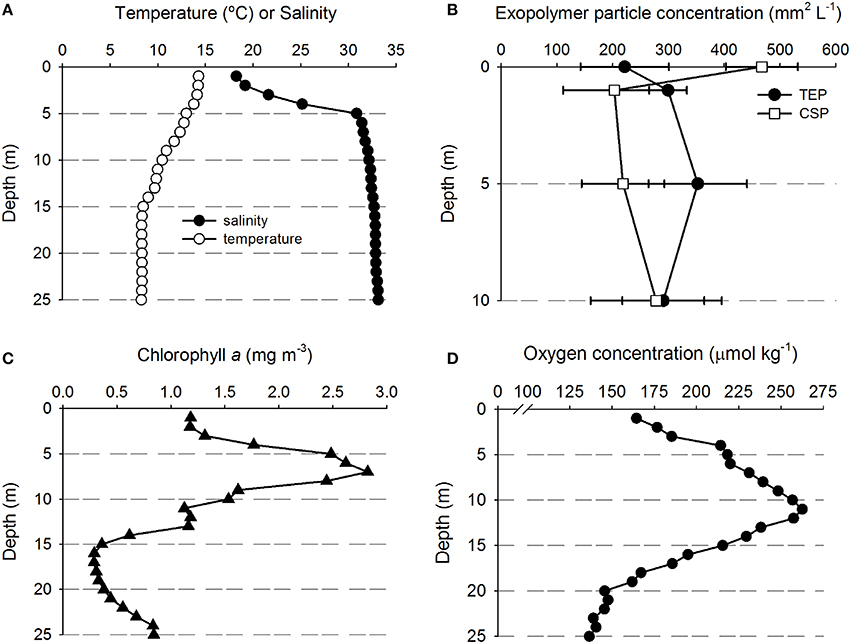
Figure 2. Depth profiles of water properties and exopolymer particles at station A. (A) Temperature and salinity. (B) Transparent exopolymer particles (TEP) and Coomassie staining particles (CSP); data points show mean ± standard deviation (n = 3). (C) Chlorophyll concentration. (D) Oxygen concentration.
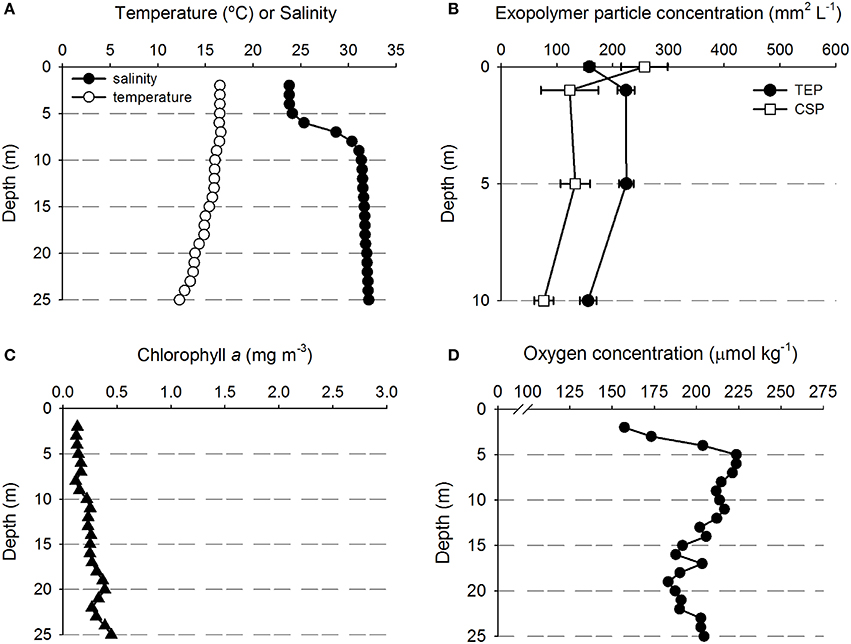
Figure 3. Depth profiles of water properties and exopolymer particles at station D. (A) Temperature and salinity. (B) Transparent exopolymer particles (TEP) and Coomassie staining particles (CSP); data points show mean ± standard deviation (n = 3). (C) Chlorophyll concentration. (D) Oxygen concentration.
Figure 3 shows that there was a clear riverine influence further off shore and south of the Columbia River mouth at station D (Figure 1). Comparing the two stations, the surface waters at Station D (Figure 3A) were approximately 2°C warmer than those of station A (Figure 2A). The halocline was distinct between 5 and 10 m at station D, with a salinity of approximately 24 from the surface to 5 m, and a salinity of >31 below 10 m (Figure 3A). Although, there was a large change in salinity between 5 and 10 m, there was no change in TEP or CSP concentrations between these depths (Figure 3B). TEP and CSP concentrations were generally lower than at station A, though they followed the same general pattern, TEP concentrations were greater than CSP, except in the SML. Chlorophyll concentrations were lower at station D (<0.5 mg m−3; Figure 3C) than at station A. Oxygen concentrations were relatively low above the pycnocline (Figure 3D) and increased to a maximum at the pycnocline of 224 μmol O2 kg−1 at 5 m.
Figure 4 shows the concentrations of both TEP and CSP in the SML and at 1 m at the remaining stations (Figures 4A,C,E). At all stations, the influence of the Columbia River was apparent by the low salinity water in the upper 5 m (Figures 4B,D,F). This was most pronounced at Station B (Figure 4B) and least pronounced at station at Station E (Figure 4F), reflecting the relative distance of the two stations from the mouth of the river. Pooling the data from all stations to compare exopolymer particle concentrations in the SML and at 1 m depth, there was a significant difference in CSP concentration (Mann-Whitney; U = 26.0, n = 30, P < 0.001), but no significant difference in TEP concentration.
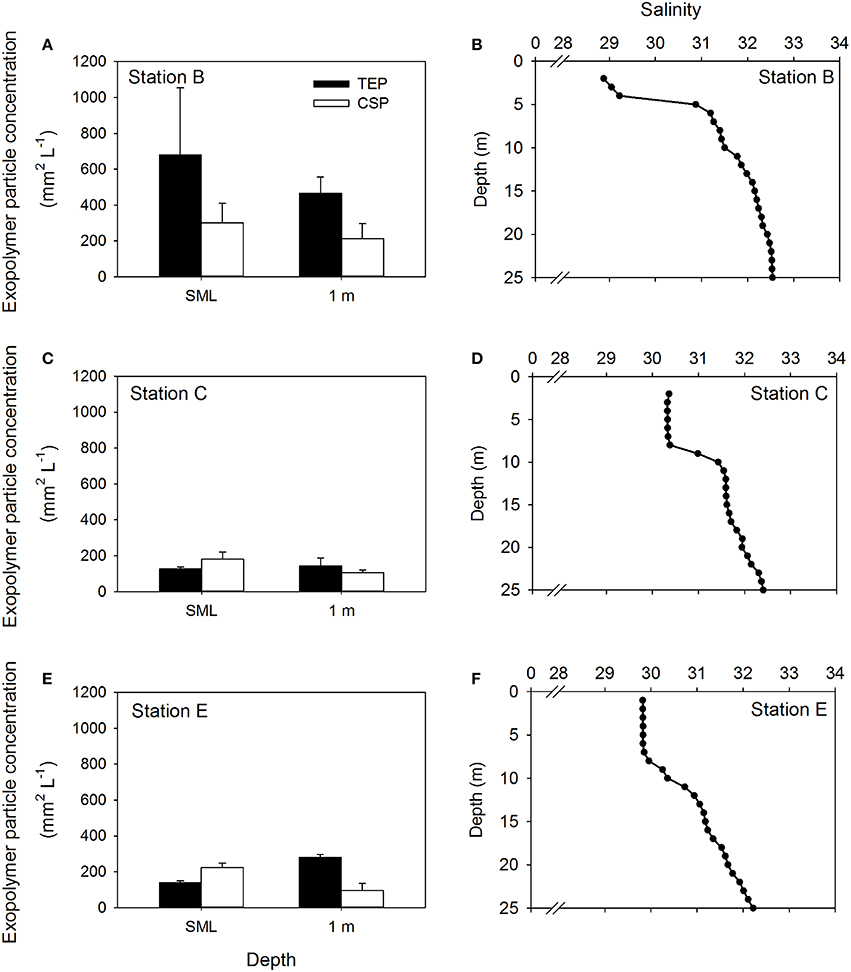
Figure 4. Depth distribution of exopolymer particles at three stations. Concentrations of transparent exopolymer particles (TEP) and Coomassie staining particles (CSP) in the sea surface microlayer (SML) and at 1 m depth in the water column (A,C,E). Bars show mean + standard deviation (n = 3). Profiles of salinity in the upper 25 m of the water column at each station are shown for reference (B,D,F).
There was a significant difference between the concentration of TEP and CSP when the data for all stations and depths were pooled (Mann-Whitney; U = 648, n = 42, P < 0.05), indicating that the two dyes used to distinguish CSP and TEP were not staining the same material. This is further illustrated by Figure 5, in which CSP was plotted against TEP concentration and there was no linear relationship between the two. In addition, Figure 5 shows that the SML was generally enriched in CSP relative to TEP, compared with the underlying water. There was no significant difference in particle concentrations of TEP and CSP, either in the SML or at 1 m depth.
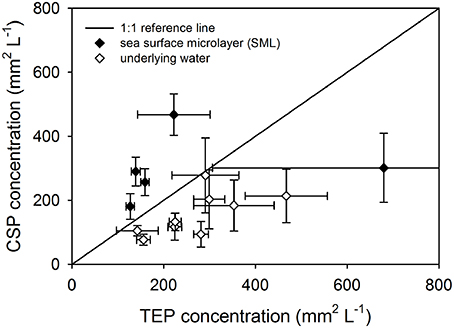
Figure 5. Comparing exopolymer particle concentrations in the sea surface microlayer (SML) and underlying water. Pooled data for all stations showing the relationship between transparent exopolymer particle (TEP) and Coomassie staining particle (CSP) concentrations in the SML and underlying water. The reference lines shows where TEP and CSP concentrations would be equal. Data points show mean ± standard deviation (n = 3).
Distribution of Dissolved Carbohydrates
Table 2 shows the distribution of dissolved carbohydrates in the SML and 1 m below the surface. In both the SML and at 1 m, the concentration of dissolved polysaccharides was generally higher than dissolved monosaccharides. Exceptions to this generalization were the two stations closest to the mouth of the Columbia River, where the monosaccharide concentration was approximately the same as polysaccharides. Two-way ANOVA showed that there was a significant difference in dissolved polysaccharides with depth [F(1, 20) = 8.173, p = 0.01] and station [F(4, 20) = 38.997, p < 0.001], and no significant interaction between depth and station [F(1, 20) = 2.734, p = 0.058]. There was a significant difference in dissolved polysaccharide concentrations between all stations (Holm-Sidak method, p < 0.05), with the exceptions of between A and B, and Stations E and C. Two-way ANOVA indicated significant differences between monosaccharide and total carbohydrates with both station and depth. However, in both analyses there was a significant interaction (p < 0.05) between the fixed factors, precluding a simple interpretation of the effects of depth and station.
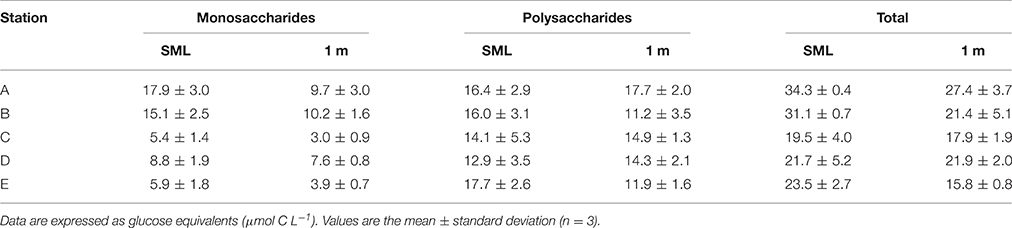
Table 2. Dissolved carbohydrate concentrations in the sea surface microlayer (SML) and underlying water (1 m depth).
Enrichment Factors (EF)
There was no significant enrichment of TEP in the SML (Table 3). CSP were significantly enriched in the SML, with EF > 1 at each station. While there was significant enrichment of monosaccharides, there was no significant enrichment of polysaccharides in the SML (Table 3).
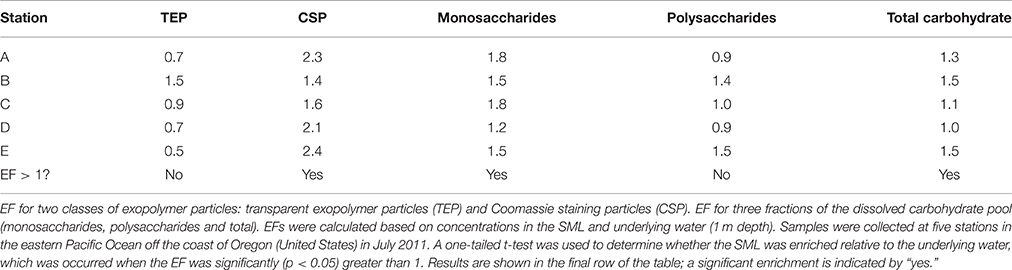
Table 3. Enrichment factors (EF) in the sea surface microlayer (SML).
Description of Non-exopolymer Particles in the SML and Underlying Waters
An advantage of the imaging method for the measurement of exopolymer particles is that the association of exopolymers with other particles can be observed. Representative material from the SML at Station A are shown in Figures 6A,B. In addition to the large amount of exopolymers (blue color in the images), there was evidence of biological and non-biological material in the SML. Figure 6A shows green material toward the upper left of the image, this was probably a fragment of terrestrial plant or green macroalga. In addition, Figure 6A shows a number of green algal cells which appear to be embedded in a matrix that has not stained with the Commassie brilliant blue dye (indicating that the matrix was not formed from protein). The abundant CSP (Figure 6A) are generally <50 μm across and are in the form of thin sheets of material, in contrast to TEP (Figure 6B), which appears more three-dimensional. Samples from the SML contained large numbers of small (<10 μm across) particles, which were black, brown, or red in color (Figures 6A,B). It is likely that these particles were from a range of origins (terrestrial, marine, and anthropogenic) and compositions such as mineral grains, biological particles, and microplastics. Figures 6C,D show examples of aggregates that occurred at all depths. Aggregates stained with alcian blue indicating that the components of the aggregates were embedded in a matrix of TEP (Figure 6C). CSP was less significant in the matrix of aggregates stained with Coomassie brilliant blue (Figure 6D).
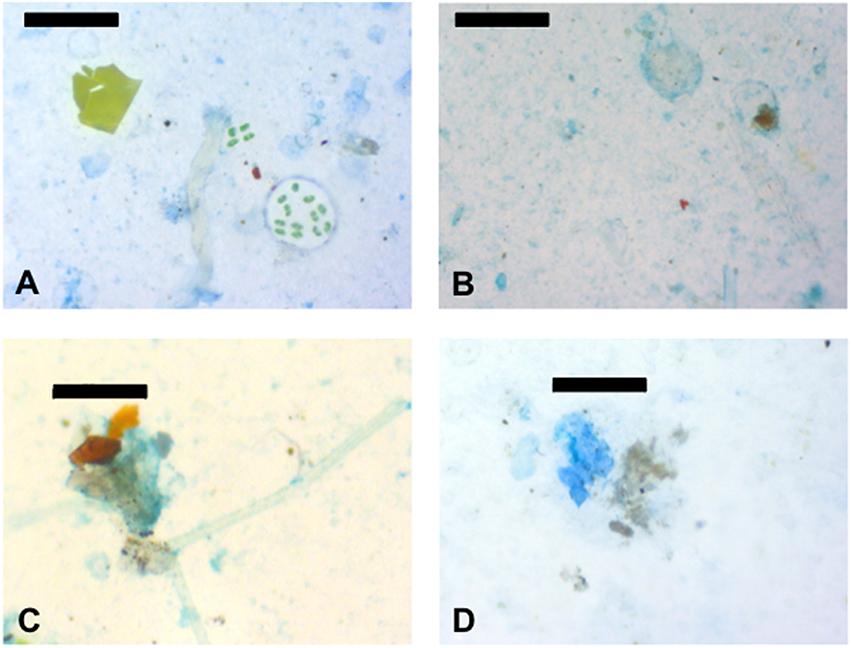
Figure 6. Images of representative particles in the samples. (A) Coomassie staining particles (CSP) dyed blue and associated particles from the sea surface microlayer (SML) at station A. (B) Transparent exopolymer particles (TEP) dyed blue and associated particles from the sea surface microlayer (SML) at station A. (C) Amorphous aggregate stuck together with TEP from the SML at station B. (D) CSP and an amorphous aggregate from 5 m depth at station A. Scale bars are 100 μm (images A,B,D) and 50 μm long (image C).
The large numbers of predominantly dead diatoms in the water column indicate that the samples were collected during the collapse of a diatom bloom (Figure 7). While empty diatom frustules are almost invisible under transmitted light, staining with alcian blue caused the dead diatoms to become visible as the exterior of the frustules were coated in TEP (Figures 7A–C). This may indicate that diatoms were directly producing TEP. However, cells that contained pigments, indicating that they were alive, were less stained, suggesting that a lot of the TEP material was sticking to frustules after death (Figure 7C). Diatom frustules coated in TEP and live diatoms were found in the SML (Figure 7C), as well as in the underlying water (Figures 7A,B). Figure 7D shows two live Pseudo-nitzschia sp. diatoms stained with Commassie brilliant blue, indicating that the surface of the cells were coated in proteins. Other diatom genera which were abundant in the samples included Rhizosolenia spp. (Figures 7A,B), Chaetoceros spp. (Figures 7A,B), Coscinodiscus sp., and Nitzschia spp. At stations close to the Columbia River mouth there was evidence of freshwater phytoplankton as can be seen by the green algal cells in Figure 6A. Identifiable freshwater taxa at stations A and B were the green colonial alga Pediastrum sp. and the diatom Asterionella sp.
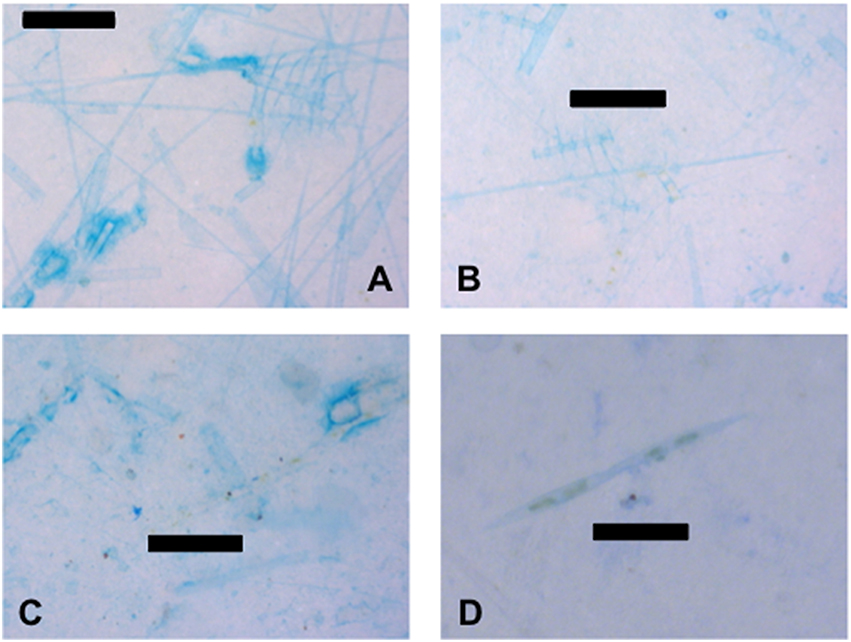
Figure 7. TEP and CSP associated with diatoms. (A) Empty diatom frustules coated with transparent exopolymer particles (TEP) from 5 m at station D. (B) Empty diatom frustules coated with TEP and live diatoms from 10 m at station D. (C) Empty diatom frustules coated with TEP, live diatoms, and unidentified particles from the SML at station D. (D) Live diatoms and associated Coomassie staining particles (CSP) from station C at 1 m. Scale bars are 100 μm (images A–C) and 50 μm long (image D).
Discussion
There are no standard methods for sampling the SML (Cunliffe et al., 2013). This presents a challenge in comparing data as the differences between studies may be as dependent on sampling methods as environmental factors. Zhang et al. (2003) found that properties of the SML (such as pH, nutrient concentrations, density, particle counts, and chlorophyll concentrations) change rapidly between 40 and 60 μm depth, leading them to conclude that the SML is 50 ± 10 μm deep. However, in practice the SML is operationally defined as between 1 and 1000 μm (Liss and Duce, 1997). We used the glass plate method (Harvey and Burzell, 1972), which is considered to sample the upper 20–150 μm (Cunliffe et al., 2013) and therefore captured the SML as defined by Zhang et al. (2003), without substantial dilution with underlying water that occurs with some methods, such as mesh screens. Based on the number of dips, area of the glass plate, and volume of sample recovered (Wurl, 2009), we estimated that our application of the glass plate method sampled a depth of 30–80 μm.
Wurl et al. (2011) found that 10 ± 4% of the TEP in bulk seawater stuck to the inside of the inside of glass bottles. Similarly, Ortega-Retuerta et al. (2009) found that 11 ± 3% of TEP model compounds (using (alginic acid and gum xanthan) stuck to the inside of borosilicate glass bottles. Wurl et al. (2011) noted that TEP also sticks to the glass plates used to collect SML samples, but that the plates became “conditioned” once they have been dipped in the water a few times and did not take up any more TEP. It is unknown if CSP concentrations were effected by sticking to glass. These observations indicate that TEP concentrations may have been underestimated in the SML and underlying water. However, as we rinsed both the plates and bottles in sample water prior to taking the samples, it is likely that this effect was negligible due to the conditioning effect.
Using image analysis, the amount of TEP and CSP can be presented as either concentrations (mm2 L−1) or particle abundance (particles L−1). We presented the amount of TEP and CSP in terms of concentration (mm2 L−1) as concentrations can be compared between the SML and underlying water, and concentration does not imply anything about the number and size of individual exopolymer particles. Exopolymer particles retained on 0.4 μm pore size polycarbonate filters from water underlying the SML are likely to be discreet particles, which is unlikely to be the case for the SML. Sampling methods for collecting the SML will fragment a gelatinous biofilm. It is these fragments that are collected and stained on 0.4 μm filters for exopolymer particle analysis and therefore the size, and size distribution, of exopolymer particles in the SML using these methods is of little value. Ideally, concentrations of exopolymer particles would be expressed in terms of carbon (or nitrogen), as this would allow direct comparison of exopolymer particle concentrations with other pools of organic matter in the ocean, and the incorporation of exoplymer particles in the SML into biogeochemical models. Estimation of the carbon concentration associated with TEP can be obtained from the size of TEP particles (Mari, 1999; Engel, 2009). However, the carbon content of TEP varies considerably depending on the source of the TEP precursors (Mari, 1999; Engel and Passow, 2001; Engel et al., 2005). We did not convert TEP particle concentration and size to a carbon concentration as there was no way of determining whether the conversion was representative.
Sieburth (1983) proposed the formation of organic matter aggregates in the SML and their subsequent sinking as “snow flakes.” The CSP in many of the samples appeared to be in the form of thin sheets, which suggests that these exopolymer particles formed on a surface or at an interface. A hypothetical mechanism for their formation is the transport and concentration of surface-active CSP precursors at the air-sea interface by rising bubbles (Wurl and Holmes, 2008). Aggregation of the concentrated CSP precursors at the air-sea interface would result in thin sheets of CSP forming. The hydrophobic properties of amino acids with aliphatic and aromatic side chains (Cunliffe et al., 2013) probably plays an important role in both the concentration of CSP precursors in the SML by rising bubbles and their subsequent aggregation into CSP. Subsequent sinking of the thin sheets of CSP would explain their observation in the underlying water column during our research and in other studies (Long and Azam, 1996).
TEP was a component of the SML, but unlike previous work (Wurl and Holmes, 2008; Cunliffe et al., 2009; Wurl et al., 2009, 2011), we did not find significant enrichment of the SML with TEP. The relatively low EF observed in our work could be explained if the stations sampled off the Oregon coast represent a different environment from those sampled previously. The Columbia River was a dominant feature as a thin layer of relatively low salinity water was found throughout the region. However, TEP (Wetz et al., 2009) and TEP precursors (Thornton, 2009) have been measured in estuaries. Wurl and Holmes (2008) found that TEP were enriched in the surface microlayer of the estuarine Johar Strait (Singapore). Therefore, the lack of TEP enhancement in the SML was unlikely to be a feature associated with relatively low salinity waters. Previous work used the spectrophotometric method to quantify TEP, contrasting to the image analysis method used in this work. There is generally a linear relationship between data from the two methods (Passow, 2002a). However, the microscopic method does not account for the smallest TEP particles, which are too small to be resolved by light microscopy (Passow, 2002a). This could also lead to an underestimation of TEP concentration in the SML. Engel and Galgani (2016) measured TEP concentrations in the SML off the coast of Peru, a location similar to waters off the coast of Oregon as both areas are upwelling regimes associated with an eastern boundary current in the Pacific Ocean. Engel and Galgani (2016) also used imaging to determine the concentration of TEP, therefore their results are directly comparable. They found that the EF for TEP ranged between 0.2 and 12, depending on wind speed and location. TEP concentrations in the SML off Peru were 100 ± 106 mm2 L−1 (mean ± SD), which were similar to our values of 265 ± 261 mm2 L−1 off Oregon.
We found CSP in the SML and all other depths surveyed. CSP were found in higher concentrations in the SML than TEP and their concentration was enriched (Table 3) relative to the underlying water. CSP have been under-sampled compared with TEP, and data for their distribution in the SML is limited to measurements in the Atlantic (Kuznetsova et al., 2005) and the Pacific Ocean (Engel and Galgani, 2016). Engel and Galgani (2016) found that CSP was enriched in the SML by a factor of 0.4–4.8, which is comparable to our EFs of 1.4–2.4. CSP concentrations in the SML were generally higher in coastal waters off Peru (1024 ± 728 mm2 L−1, Engel and Galgani, 2016) compared with our measurements off the coast of Oregon (286 ± 115 mm2 L−1; mean ± SD). Research in the Atlantic Ocean and Mediterranean Sea has shown that dissolved organic matter (DOM) in the SML is enriched with nitrogen; Reinthaler et al. (2008) found a mean C:N ratio of 8.9 ± 6.2 in the SML compared with 18.2 ± 9.3 for the underlying water. The enrichment of the SML with nitrogen fits with our observation of enrichment of the SML with CSP. However, other factors could account for nitrogen enrichment in the SML; Several studies have shown that the SML is highly enriched with dissolved amino acids (Kuznetsova et al., 2004; Reinthaler et al., 2008; van Pinxteren et al., 2012; Engel and Galgani, 2016), which would pass through the filters used for CSP analysis. The concentration of dissolved free amino acids in the SML is generally an order of magnitude greater than the underlying water (Kuznetsova et al., 2004; Reinthaler et al., 2008). Higher rates of peptide hydrolysis in the SML, compared with the underlying water, indicate that the proteins and amino acids are rapidly turning over (Kuznetsova and Lee, 2001). Kuznetsova et al. (2005) conducted experiments in which natural seawater from the coastal North Atlantic was bubbled to induce aerosol formation. CSP were found in the underlying water, SML, and aerosol during these experiments. Estimates of CSP EF relative to the underlying water were 5.3 ± 2.7 and 57 ± 29 for the SML and aerosol, respectively. These EF were based on crude estimates of particle volume, and therefore were considered to be approximations (Kuznetsova et al., 2005). Nonetheless, they illustrate the potential significance of proteins both in the SML and the potential of the SML to supply the atmosphere with proteins of marine origin.
TEP and CSP may be separate populations of particles or they may be the same particles that are composed from a mixture of acid polysaccharides and protein. Based on the data and qualitative observations of the exopolymer particles in this study, TEP and CSP are different particles. Qualitative evidence for the difference between TEP and CSP was evident in the visual images. Firstly, CSP was often found in thin sheets of material, whereas TEP was more amorphous in shape. While it is hard to predict three dimensional shape from particles retained on a two-dimensional surface, the sheet-like nature of much of the CSP is apparent from its apparent thinness and in places where it has been folded back on itself. Secondly, TEP was associated with other types of particle more than CSP, indicating that it is more sticky than CSP. This is apparent from aggregates in which TEP appeared to be the glue holding the aggregate together (Figure 6C) and from acid polysaccharides adhered to the surface of empty diatom frustules (Figure 7A). Finally, quantitative data indicates that TEP and CSP are not the same; Figure 5 shows no relationship between the concentration of CSP and TEP. The selective concentration of CSP relative to TEP in the SML is further evidence that these two types of exopolymer particles are not the same. Cisternas-Novoa et al. (2015) also concluded that TEP and CSP are different populations of particles. They conducted mesocosm experiments and found that phytoplankton produced both TEP and CSP, but that the peak concentrations of TEP and CSP occurred at different stages of the bloom. In agreement with our results, they also found that TEP were more likely to be associated with other particles, such as diatoms (Cisternas-Novoa et al., 2015).
Our data show enrichment of dissolved monosaccharides and no significant enrichment of dissolved polysaccharides in the SML. The enrichment of monosaccharides may indicate high degradation rates of polysaccharides through processes such as photolysis and hydrolysis. Total dissolved carbohydrates had an EF of 1.0–1.5, mainly due to the enrichment of monosaccharides. van Pinxteren et al. (2012) found a similar EF for dissolved carbohydrates, ranging from 0.7 to 1.2 in the Baltic Sea. Relatively high EF values of 3.5–12.1 have been measured for dissolved polysaccharides in the SML of the Arctic, with bubble scavenging from the underlying water proposed as the mechanism of enrichment from water containing extracellular carbohydrates produced by both phytoplankton and sea ice algae (Gao et al., 2012).
All the stations were sampled during a diatom bloom. The bloom was in the process of collapsing as most of the diatom frustules were empty (Figure 7A). There were also live diatoms in the samples, such as the pigmented Pseudo-nitzschia sp. cells in Figure 7D. Pseudo-nitzschia is significant as it is a harmful algal bloom species that is known to bloom along the Oregon coast (McKibben et al., 2015). Phytoplankton, and to a lesser extent bacteria, are considered to be the source of TEP and the polysaccharide precursors that form TEP (Passow, 2002a,b; Thornton, 2014). It is likely that the collapsing diatom bloom was the major source of exopolymers that produced the TEP and CSP found in both water column and SML. Diatoms release a significant proportion of the carbon that they fix through photosynthesis as exudates, including as TEP and CSP, or their precursors (Engel et al., 2002; Passow, 2002b; Thornton, 2014; Chen and Thornton, 2015). TEP accumulate in cultures of diatoms (Corzo et al., 2000; Claquin et al., 2008; Fukao et al., 2010; Chen and Thornton, 2015) and in diatom-dominated blooms within mesocosm experiments using natural waters (Engel et al., 2002). Less work has been done on CSP production by diatoms; Thornton (2014) found that CSP are generally abundant in batch cultures of several different diatom species. Galgani and Engel (2013) showed that both TEP and CSP accumulated in the water column and SML in cultures of Thalassiosira weissflogii. The accumulation of diatom frustules and organic matter in the SML (Figure 7C) indicates that diatoms may make a contribution to marine aerosols. Recent work has shown that diatoms may play an important role in generating atmospheric ice nuclei (IN) and potentially affecting the formation of mixed phase and ice clouds over remote regions of the ocean (Knopf et al., 2011; Wilson et al., 2015).
The coloration and shape of many of the relatively small (<10 μm across) particles indicated that they were not exopolymer particles and were probably non-biological in origin. This was particularly apparent in samples from the SML (e.g. dark red particles in Figures 7A,B). Many of these particles may have been mineral grains blown onto the SML from the terrestrial environment or buoyant particles carried into the ocean by the Columbia River. Anthropogenic particles may have been a significant contributor as many were brightly colored, which suggests that they were composed of plastics or paints. Microplastics composed of a variety of polymers have been sampled from the SML in coastal waters off South Korea (Song et al., 2014, 2015).
These data confirm previous work showing that TEP are found in the SML. In addition, we showed that CSP are enriched in the SML compared with the underlying water. TEP and CSP are not components of the same exopolymer particles as the two pools of exopolymers behaved differently. Our samples were collected during the collapse of a diatom bloom, suggesting that diatoms were the source of the organic matter in the water column and SML. Diatom blooms vary in time and space depending on the season (Alvain et al., 2008), but are a regular occurrence in many areas of the ocean, such as in the eastern boundary current upwelling system observed in this study, the spring bloom in the North Atlantic, and the Southern Ocean during austral summer. The accumulation of diatom-derived material (TEP, CSP, empty frustules etc.) in the SML indicates that diatoms may be major contributors to the SML and on a regional scale during bloom periods.
Author Contributions
DT, SB conceived the work and collected the samples during the cruise. JC undertook the carbohydrate analysis. DT took the images, conducted the image analysis, and analyzed the data. DT, SB wrote the manuscript with input from JC.
Funding
SB, DT were supported by the National Science Foundation (United States) under Grant No. AGS 1026804. Financial support for the cruise was provided by the National Science Foundation (United States) under Grant No. OCE 1125396 to Dr. Clare Reimers (Oregon State University). Any opinions, findings, and conclusions or recommendations expressed in this material are those of the authors and do not necessarily reflect the views of the National Science Foundation. JC acknowledges financial support through a scholarship from the government of the People's Republic of China.
Conflict of Interest Statement
The authors declare that the research was conducted in the absence of any commercial or financial relationships that could be construed as a potential conflict of interest.
Acknowledgments
We thank the Captain, crew, marine technicians and the Science Party aboard the R/V Wecoma on cruise W1106A, especially the colleagues that assisted us in sampling the sea surface microlayer. We thank Dr. Clare Reimers for the opportunity to participate in the cruise. Dr. Alyson Santoro (University of Maryland Center for Environmental Science) generously provided us with processed data from the CTD casts. Dr. Aaron Beck (Virginia Institute of Marine Science) assisted with sampling and provided a pump to collect water from below the surface. Elise Wilbourn made the map used in Figure 1.
References
Agogué, H., Casamayor, E. O., Bourrain, M., Obernosterer, I., Joux, F., Herndl, G. J., et al. (2005). A survey on bacteria inhabiting the sea surface microlayer of coastal ecosystems. FEMS Microbiol. Ecol. 54, 269–280. doi: 10.1016/j.femsec.2005.04.002
Alldredge, A. L., Passow, U., and Logan, B. E. (1993). The abundance and significance of a class of large, transparent organic particles in the ocean. Deep Sea Res. 40, 1131–1140. doi: 10.1016/0967-0637(93)90129-q
Aller, J. Y., Kuznetsova, M. R., Jahns, C. J., and Kemp, P. F. (2005). The sea surface microlayer as a source of viral and bacterial enrichment in marine aerosols. J. Aerosol. Sci. 36, 801–812. doi: 10.1016/j.jaerosci.2004.10.012
Alvain, S., Moulin, C., Dandonneau, Y., and Loisel, H. (2008). Seasonal distribution and succession of dominant phytoplankton groups in the global ocean: a satellite view. Glob. Biogeochem. Cycles 22, GB3001. doi: 10.1029/2007gb003154
Azetsu-Scott, K., and Passow, U. (2004). Ascending marine particles: significance of transparent exopolymer particles (TEP) in the upper ocean. Limnol. Oceanogr. 49, 741–748. doi: 10.4319/lo.2004.49.3.0741
Berges, J. A., Franklin, D. J., and Harrison, P. J. (2001). Evolution of an artificial seawater medium: improvements in enriched seawater, artificial water over the last two decades. J. Phycol. 37, 1138–1145. doi: 10.1046/j.1529-8817.2001.01052.x
Bigg, E. K., and Leck, C. (2008). The composition of fragments of bubbles bursting at the ocean surface. J. Geophys. Res. Atmos. 113, D11209. doi: 10.1029/2007jd009078
Bradford, M. M. (1976). Rapid and sensitive method for quantitation of microgram quantities of protein utilizing principle of protein-dye binding. Anal. Biochem. 72, 248–254. doi: 10.1006/abio.1976.9999
Burd, A. B., and Jackson, G. A. (2009). Particle Aggregation. Annu. Rev. Mar. Sci. 1, 65–90. doi: 10.1146/annurev.marine.010908.163904
Chen, J. (2014). Factors Affecting Carbohydrate Production and the Formation of Transparent Exopolymer Particles (TEP) by Diatoms. Dissertation, Texas A&M University, College Station, TX.
Chen, J., and Thornton, D. C. O. (2015). Transparent exopolymer particle production and aggregation by a marine planktonic diatom (Thalassiosira weissflogii) at different growth rates. J. Phycol. 51, 381–393. doi: 10.1111/jpy.12285
Cisternas-Novoa, C., Lee, C., and Engel, A. (2015). Transparent exopolymer particles (TEP) and Coomassie stainable particles (CSP): differences between their origin and vertical distributions in the ocean. Mar. Chem. 175, 56–71. doi: 10.1016/j.marchem.2015.03.009
Claquin, P., Probert, I., Lefebvre, S., and Veron, B. (2008). Effects of temperature on photosynthetic parameters and TEP production in eight species of marine microalgae. Aquat. Microb. Ecol. 51, 1–11. doi: 10.3354/ame01187
Corzo, A., Morillo, J. A., and Rodriguez, S. (2000). Production of transparent exopolymer particles (TEP) in cultures of Chaetoceros calcitrans under nitrogen limitation. Aquat. Microb. Ecol. 23, 63–72. doi: 10.3354/ame023063
Cunliffe, M., Engel, A., Frka, S., Gasparovic, B., Guitart, C., Murrell, J. C., et al. (2013). Sea surface microlayers: a unified physicochemical and biological perspective of the air-ocean interface. Prog. Oceanogr. 109, 104–116. doi: 10.1016/j.pocean.2012.08.004
Cunliffe, M., and Murrell, J. C. (2009). The sea-surface microlayer is a gelatinous biofilm. ISME J. 3, 1001–1003. doi: 10.1038/ismej.2009.69
Cunliffe, M., and Murrell, J. C. (2010). Eukarya 18S rRNA gene diversity in the sea surface microlayer: implications for the structure of the neustonic microbial loop. ISME J. 4, 455–458. doi: 10.1038/ismej.2009.133
Cunliffe, M., Salter, M., Mann, P. J., Whiteley, A. S., Upstill-Goddard, R. C., and Murrell, J. C. (2009). Dissolved organic carbon and bacterial populations in the gelatinous surface microlayer of a Norwegian fjord mesocosm. FEMS Microb. Lett. 299, 248–254. doi: 10.1111/j.1574-6968.2009.01751.x
Cunliffe, M., Upstill-Goddard, R. C., and Murrell, J. C. (2011). Microbiology of aquatic surface microlayers. FEMS Microbiol. Rev. 35, 233–246. doi: 10.1111/j.1574-6976.2010.00246.x
Engel, A. (2009). “Determination of marine gel particles,” in Practical Guidelines for the Analysis of Seawater, ed O. Wurl (Boca Raton, FL: CRC Press), 125–142.
Engel, A., and Galgani, L. (2016). The organic sea-surface microlayer in the upwelling region off the coast of Peru and potential implications for air–sea exchange processes. Biogeosciences 13, 989–1007. doi: 10.5194/bg-13-989-2016
Engel, A., Goldthwait, S., Passow, U., and Alldredge, A. (2002). Temporal decoupling of carbon and nitrogen dynamics in a mesocosm diatom bloom. Limnol. Oceanogr. 47, 753–761. doi: 10.4319/lo.2002.47.3.0753
Engel, A., and Passow, U. (2001). Carbon and nitrogen content of transparent exopolymer particles (TEP) in relation to their Alcian Blue adsorption. Mar. Ecol. Prog. Ser. 219, 1–10. doi: 10.3354/meps219001
Engel, A., Zondervan, I., Aerts, K., Beaufort, L., Benthien, A., Chou, A., et al. (2005). Testing the direct effect of CO2 concentration on a bloom of the coccolithophorid Emiliania huxleyi in mesocosm experiments. Limnol. Oceanogr. 50, 493–507. doi: 10.4319/lo.2005.50.2.0493
Franklin, M. P., McDonald, I. R., Bourne, D. G., Owens, N. J. P., Upstill-Goddard, R. C., and Murrell, J. C. (2005). Bacterial diversity in the bacterioneuston (sea surface microlayer): the bacterioneuston through the looking glass. Environ. Microbiol. 7, 723–736. doi: 10.1111/j.1462-2920.2004.00736.x
Fukao, T., Kimoto, K., and Kotani, Y. (2010). Production of transparent exopolymer particles by four diatom species. Fish. Sci. 76, 755–760. doi: 10.1007/s12562-010-0265-z
Galgani, L., and Engel, A. (2013). Accumulation of gel particles in the sea-surface microlayer during an experimental study with the diatom Thalassiosira weissflogii. Int. J. Geosci. 4, 129–145. doi: 10.4236/ijg.2013.41013
Gao, Q., Leck, C., Rauschenberg, C., and Matrai, P. A. (2012). On the chemical dynamics of extracellular polysaccharides in the high Arctic surface microlayer. Ocean Sci. 8, 401–418. doi: 10.5194/os-8-401-2012
Harvey, G. W., and Burzell, L. A. (1972). Simple microlayer method for small samples. Limnol. Oceanogr. 17, 156–157.
Hunter, K. A. (1997). “Chemistry of the sea-surface microlayer,” in The Sea Surface and Global Change, ed P. Liss and R. A. Duce (Cambridge: Cambridge University Press), 287–320.
Joux, F., Agogué, H., Obernosterer, I., Dupuy, C., Reinthaler, T., Herndl, G. J., et al. (2006). Microbial community structure in the sea surface microlayer at two contrasting coastal sites in the northwestern Mediterranean Sea. Aquat. Microbiol. Ecol. 42, 91–104. doi: 10.3354/ame042091
Karavoltsos, S., Kalambokis, E., Sakellari, A., Plavšić, M., Dotsika, M., Karalis, P., et al. (2015). Organic matter characterization and copper complexing capacity in the sea surface microlayer of coastal areas of the Eastern Mediterranean. Mar. Chem. 173, 234–243. doi: 10.1016/j.marchem.2014.12.004
Knopf, D. A., Alpert, P. A., Wang, B., and Aller, J. Y. (2011). Stimulation of ice nucleation by marine diatoms. Nat. Geosci. 4, 88–90. doi: 10.1038/ngeo1037
Kuznetsova, M., and Lee, C. (2001). Enhanced extracellular enzymatic peptide hydrolysis in the sea-surface microlayer. Mar. Chem. 73, 319–332. doi: 10.1016/s0304-4203(00)00116-x
Kuznetsova, M., Lee, C., and Aller, J. (2005). Characterization of the proteinaceous matter in marine aerosols. Mar. Chem. 96, 359–377. doi: 10.1016/j.marchem.2005.03.007
Kuznetsova, M., Lee, C., Aller, J., and Frew, N. (2004). Enrichment of amino acids in the sea surface microlayer at coastal and open ocean sites in the North Atlantic Ocean. Limnol. Oceanogr. 49, 1605–1619. doi: 10.4319/lo.2004.49.5.1605
Leck, C., and Bigg, E. K. (2008). Comparison of sources and nature of the tropical aerosol with the summer high Arctic aerosol. Tellus B. 60, 118–126. doi: 10.1111/j.1600-0889.2007.00315.x
Liss, P. S., and Duce, R. A. (1997). “Preface,” in The Sea Surface and Global Change, eds P. Liss and R. A. Duce (Cambridge: Cambridge University Press), xiii–xvi.
Logan, B. E., Grossart, H. P., and Simon, M. (1994). Direct observation of phytoplankton, TEP and aggregates on polycarbonate filters using brightfield microscopy. J. Plankton Res. 16, 1811–1815. doi: 10.1093/plankt/16.12.1811
Long, R. A., and Azam, F. (1996). Abundant protein-containing particles in the sea. Aquat. Microb. Ecol. 10, 213–221. doi: 10.3354/ame010213
Mari, X. (1999). Carbon content and C:N ratio of transparent exopolymeric particles (TEP) produced by bubbling exudates of diatoms. Mar. Ecol. Prog. Ser. 183, 59–71. doi: 10.3354/meps183059
Mari, X. (2008). Does ocean acidification induce an upward flux of marine aggregates? Biogeosciences 5, 1023–1031. doi: 10.5194/bg-5-1023-2008
McKibben, S. M., Watkins-Brandt, K. S., Wood, A. M., Hunter, M., Forster, Z., Hopkins, A., et al. (2015). Monitoring oregon coastal harmful algae: observations and implications of a harmful algal bloom-monitoring project. Harmful Algae 50, 32–44. doi: 10.1016/j.hal.2015.10.004
Myklestad, S. M., Skanoy, E., and Hestmann, S. (1997). A sensitive and rapid method for analysis of dissolved mono- and polysaccharides in seawater. Mar. Chem. 56, 279–286. doi: 10.1016/s0304-4203(96)00074-6
Obernosterer, I., Catala, P., Lami, R., Caparros, J., Ras, J., Bricaud, A., Lebaron, P., et al. (2008). Biochemical characteristics and bacterial community structure of the sea surface microlayer in the South Pacific Ocean. Biogeosciences 5, 693–705. doi: 10.5194/bg-5-693-2008
Orellana, M. V., Matrai, P. A., Leck, C., Rauschenberg, C. D., Lee, A. M., and Coz, E. (2011). Marine microgels as a source of cloud condensation nuclei in the high Arctic. Proc. Natl. Acad. Sci. U.S.A. 108, 13612–13617. doi: 10.1073/pnas.1102457108
Ortega-Retuerta, E., Passow, U., Duarte, C. M., and Reche, I. (2009). Effects of ultraviolet B radiation on (not so) transparent exopolymer particles. Biogeosciences 6, 3071–3080. doi: 10.5194/bg-6-3071-2009
Passow, U. (2002a). Transparent exopolymer particles (TEP) in aquatic environments. Prog. Oceanogr. 55, 287–333. doi: 10.1016/s0079-6611(02)00138-6
Passow, U. (2002b). Production of transparent exopolymer particles (TEP) by phyto- and bacterioplankton. Mar. Ecol. Prog. Ser. 236, 1–12. doi: 10.3354/meps236001
Passow, U., and Alldredge, A. L. (1995). A dye-binding assay for the spectrophotometric measurement of transparent exopolymer particles (TEP). Limnol. Oceanogr. 40, 1326–1335.
Quinn, P. K., Bates, T. S., Schulz, K. S., Coffman, D. J., Frossard, A. A., Russell, L. M., et al. (2014). Contribution of sea surface carbon pool to organic matter enrichment in sea spray aerosol. Nat. Geosci. 7, 228–232. doi: 10.1038/ngeo2092
Reinthaler, T., Sintes, E., and Herndl, G. J. (2008). Dissolved organic matter and bacterial production and respiration in the sea-surface microlayer of the open Atlantic and the western Mediterranean Sea. Limnol. Oceanogr. 53, 122–136. doi: 10.4319/lo.2008.53.1.0122
Russell, L. M., Hawkins, L. N., Frossard, A. A., Quinn, P. K., and Bates, T. S. (2010). Carbohydrate-like composition of submicron atmospheric particles and their production from ocean bubble bursting. Proc. Natl. Acad. Sci. U.S.A. 107, 6652–6657. doi: 10.1073/pnas.0908905107
Schneider, C. A., Rasband, W. S., and Eliceiri, K. W. (2012). NIH Image to ImageJ: 25 years of image analysis. Nat. Methods 9, 671–675. doi: 10.1038/nmeth.2089
Sieburth, J. M. (1983). “Microbiological and organic-chemical processes in the surface and mixed layers,” in Air–Sea Exchange of Gases and Particles, eds P. S. Liss and W. G. N. Slinn (Hingham, MA: Reidel Publishers Co), 121–172.
Sieburth, J. M., Willis, P. J., Johnson, K. M., Burney, C. M., Lavoie, D. M., Hinga, K. R., et al. (1976). Dissolved organic-matter and heterotrophic microneuston in surface microlayers of north-atlantic. Science 194, 1415–1418.
Song, Y. K., Hong, S. H., Jang, M., Han, G. M., and Shim, W. J. (2015). Occurrence and distribution of microplastics in the sea surface microlayer in Jinhae Bay, South Korea. Arch. Environ. Con. Tox. 69, 279–287. doi: 10.1007/s00244-015-0209-9
Song, Y. K., Hong, S. H., Jang, M., Kang, J. H., Kwon, O. Y., Han, G. M., et al. (2014). Large accumulation of micro-sized synthetic polymer particles in the sea surface microlayer. Environ. Sci. Technol. 48, 9014–9021. doi: 10.1021/es501757s
Taylor, J. D., and Cunliffe, M. (2014). High-throughput sequencing reveals neustonic and planktonic eukaryote diversity in coastal waters. J. Phycol. 50, 960–965. doi: 10.1111/jpy.12228
Thornton, D. C. O. (2009). Spatiotemporal distribution of dissolved acidic polysaccharides (dAPS) in a tidal estuary. Limnol. Oceanogr. 54, 1449–1460. doi: 10.4319/lo.2009.54.5.1449
Thornton, D. C. O. (2014). Dissolved organic matter (DOM) release by phytoplankton in the contemporary and future ocean. Eur. J. Phycol. 49, 20–46. doi: 10.1080/09670262.2013.875596
van Pinxteren, M., Müller, C., Iinuma, Y., Stolle, C., and Herrmann, H. (2012). Chemical characterization of dissolved organic compounds from coastal sea surface microlayers (Baltic Sea, Germany). Environ. Sci. Technol. 46, 10455–10462. doi: 10.1021/es204492b
Verdugo, P. (2012). Marine Microgels. Annu. Rev. Mar. Sci. 4, 375–400. doi: 10.1146/annurev-marine-120709-142759
Wang, X., Sultana, C. M., Trueblood, J., Hill, T. C. J., Malfatti, F., Lee, C., et al. (2015). Microbial control of sea spray aerosol composition: a tale of two blooms. ACS Cent. Sci. 1, 124–131. doi: 10.1021/acscentsci.5b00148
Wetz, M. S., Robbins, M. C., and Paerl, H. W. (2009). Transparent exopolymer particles (TEP) in a river-dominated estuary: spatial-temporal distributions and an assessment of controls upon TEP formation. Estuar. Coast. 32, 447–455. doi: 10.1007/s12237-009-9143-2
Wilson, T. W., Ladino, L. A., Alpert, P. A., Breckels, M. N., Brooks, I. M., Browse, J., et al. (2015). A marine biogenic source of atmospheric ice-nucleating particles. Nature 525, 234–238. doi: 10.1038/nature14986
Wurl, O. (2009). “Sampling and sample treatments,” in Practical Guidelines for the Analysis of Seawater, ed O. Wurl (Boca Raton, FL: CRC Press), 1–32.
Wurl, O., and Holmes, M. (2008). The gelatinous nature of the sea-surface microlayer. Mar. Chem. 110, 89–97. doi: 10.5194/bg-8-121-2011
Wurl, O., Miller, L., Ruttgers, R., and Vagle, S. (2009). The distribution and fate of surface-active substances in the sea-surface microlayer and water column. Mar. Chem. 115, 1–9. doi: 10.1016/j.marchem.2009.04.007
Wurl, O., Wurl, E., Miller, L., Johnson, K., and Vagle, S. (2011). Formation and global distribution of sea-surface microlayers. Biogeosciences 8, 121–135. doi: 10.1016/j.marchem.2008.02.009
Zack, G. W., Rogers, W. E., and Latt, S. A. (1977). Automatic-measurement of sister chromatid exchange frequency. J. Histochem. Cytochem. 25, 741–753.
Keywords: coomassie staining particles (CSP), diatom, dissolved organic matter (DOM), exopolymers, Pacific Ocean, sea surface microlayer (SML), transparent exopolymer particles (TEP)
Citation: Thornton DCO, Brooks SD and Chen J (2016) Protein and Carbohydrate Exopolymer Particles in the Sea Surface Microlayer (SML). Front. Mar. Sci. 3:135. doi: 10.3389/fmars.2016.00135
Received: 15 April 2016; Accepted: 21 July 2016;
Published: 04 August 2016.
Edited by:
Tony Gutierrez, Heriot-Watt University, ScotlandReviewed by:
Gerhard J. Josef Herndl, University of Vienna, AustriaAndrew Decker Steen, University of Tennessee, USA
Copyright © 2016 Thornton, Brooks and Chen. This is an open-access article distributed under the terms of the Creative Commons Attribution License (CC BY). The use, distribution or reproduction in other forums is permitted, provided the original author(s) or licensor are credited and that the original publication in this journal is cited, in accordance with accepted academic practice. No use, distribution or reproduction is permitted which does not comply with these terms.
*Correspondence: Daniel C. O. Thornton, dthornton@ocean.tamu.edu
†Present Address: Jie Chen, South China Sea Marine Planning and Environmental Research Institute, SOA, Guangzhou, China