Parasitic Eukaryotes in a Meso-Eutrophic Coastal System with Marked Phaeocystis globosa Blooms
 Urania Christaki1*†
  Savvas Genitsaris1,2†
  Sébastien Monchy1
  Luen L. Li1 Sara Rachik1 Elsa Breton1
  Télesphore Sime-Ngando3
- 1Laboratoire d'Océanologie et Géosciences, UMR Centre National de la Recherche Scientifique 8187, Université du Littoral Côte d'Opale, Wimereux, France
- 2School of Economics, Business Administration and Legal Studies, International Hellenic University, Thessaloniki, Greece
- 3Laboratoire Microorganismes: Génome et Environment, UMR Centre National de la Recherche Scientifique 6023, Clermont Université Blaise Pascal, Aubière, France
This study explored the potential interactions and relations of the putative Symbiotic/Decomposer/Parasitic community (SymbDec) with other taxa and predominant environmental parameters in the eastern English Channel (EEC) over a 2.5 years period (32 sampling dates). The EEC is a meso-eutrophic coastal system portrayed by intense reoccurring patterns in plankton succession with blooms of the Haptophyte Phaeocystis globosa and abundant populations of colonial diatoms and dinoflagellate grazers before and after the bloom. The study of the V2-V3 hypervariable region of the 18S rRNA gene allowed an overview of the planktonic community, which consisted of 32 high-level taxonomic groups. Forty-two percent of the identified OTUs belonged to symbionts, decomposers or other putative parasitic taxa belonging mainly to Syndiniales (MALV—MArine ALveolates), Fungi, Cercozoa, Perkinsea, and others, most of which were plankton parasites. We examined the Local Similarity Analysis (LSA) network of lag delayed correlations on the 142 most abundant OTUs (>0.1% of the total number of reads). LSA showed that 99 OTUs had highly significant connections, involving 26 OTUs characterized as potential parasites, and 2 decomposers. The parasitic network had “small world” characteristics, rendering the assemblage more robust to abiotic variations, but more exposed to the removal of highly associated taxa. The majority of the highly connected OTUs belonged to MALV, which were mainly connected with dinoflagellates, suggesting that it might play an important role on dinoflagellate top-down control. The bloom forming P. globosa was not observed in connection with parasitic OTUs in the network. Four environmental parameters (O2, N, T, and N/P) were strongly connected with only 11 OTUs, while correlations between microbes dominated the network.
Introduction
Marine parasitic protists have been observed and described—along with other protists—from the early microbiologists over the last few centuries (see Caron et al., 2009; Skovgaard, 2014, for a review). Parasitic protists are not easily identified in environmental samples, due to their absence of morphological features and endosymbiontic lifestyle (e.g., De Bary, 1879), and therefore information about their diversity, abundance, and ecology had been scarce until quite recently (Scholz et al., 2016). During the last few decades, using the genetic diversity of the 18S rRNA gene, novel eukaryotic taxonomic groups have been revealed within the marine protistan plankton (e.g., López-García et al., 2001; López-García and Moreira, 2008) with great amount of them belonging to potential intracellular symbionts and parasites (e.g., Guillou et al., 2008; Bråte et al., 2012). The development of NGS (Next Generation Sequencing) tools has suggested that marine parasites are more frequent than the literature has reported (e.g., Lefèvre et al., 2008). Parasitism is without a doubt a relation, which enhances the density and extend foodwebs. This in turn enhances the connectivity between species and makes carbon transfers more efficient, particularly because parasitic taxa have complex life cycles and infect organisms that belong at different trophic levels (e.g., Laferty et al., 2008; Niquil et al., 2011). Thus, the effect of protistan parasites in the marine plankton varies greatly depending on parasite species (Skovgaard, 2014). Taking into consideration the complexity of most microbial interactions, there are substantial limitations in our efforts for direct insight into relating taxonomic datasets to rates of discrete microbial groups exploitable in biogeochemical cycles. In addition, in many microbial communities, recurrent organizational patterns cannot always associate with straightforward community roles and/or detailed dependencies between species owing to missing information on “overlooked” microbial interactions (for a review see Bik et al., 2012).
In an alternative approach, correlation networks have been proposed as a “means to approximate microbial interactions” in a way that these networks can be further used to build models describing ecosystem functioning (Steele et al., 2011; Faust and Raes, 2012; Berry and Widder, 2014; Weiss et al., 2016). They can also be used to reveal trophic relations, food-web connectance and biodiversity loss because of disturbance in the food chain (Dunne et al., 2002). In a seminal paper, Fuhrman and Steele (2008) summarized key approaches, successes, and challenges in this field. They addressed this issue directly by associating specific functions to individual organisms, and indirectly, by investigative the statistical relationships among organisms and environmental variables measured over different temporal and spatial scales (e.g., multivariate and network analysis). Several recent metagenomic studies of marine microbes have utilized network analysis to understand ecological processes. For example, Gilbert et al. (2012) with the use of networks described the connectivity between different eukaryotic and prokaryotic taxonomic groups, and between bacteria and environmental variables through a 6-year time-series dataset in a coastal area. Logares et al. (2014) used networks to identify patterns of rare and abundant marine unicellular eukaryotes in surface coastal waters of six distinct sites in Europe.
The EEC is a meso-eutrophic coastal system portrayed by intense reoccurring patterns in plankton succession. The recurrent massive proliferation of the Haptophyte Phaeocystis globosa is associated to the surplus of nitrogen and silicate limitation atlate winter (Peperzak et al., 1998). Abundant populations of colonial diatoms and dinoflagellate grazers are observed before and after the P. globosa bloom (e.g., Schapira et al., 2008; Grattepanche et al., 2011a,b and references therein). A winter-summer succession study of planktonic protists, by means of 18S rRNA gene high-throughput sequencing approach, suggested that the previously well-established food web concept in the EEC based on predator-prey (e.g., grazer-phytoplankton) interactions is “just a part of the ecological picture” and in fact several organisms using a variety of previously “overlooked” strategies, such as parasitism and saprotrophy, were abundant members of the planktonic community (Christaki et al., 2014). The objective of the present study was to focus on the putative Symbiotic/Decomposer/Parasitic community (SymbDec) in the EEC over a 2.5 years period (32 dates). The molecular signatures of protists belonging to SymbDec are included in numerous NGS datasets, indicating a major complementary role in top-down population control (Edgcomb, 2016). Thus, the two main objectives were (1) to examine connections between SymbDec taxa and other taxa using network analysis within the seasonal microplankton succession, and (2) to identify the underlying environmental parameters that affect specific taxonomic and trophic groups of the microplankton community; both in the temperate coastal waters of the EEC.
Materials and Methods
Sample Collection
Subsurface sampling (2 m water depth) was carried out in the EEC at high tide at the coastal station C (50° 40′ 75″ N, 1° 31′ 17″E; 20–25 maximum depth) belonging to the French monitoring network SOMLIT (http://somlit.epoc.u-bordeaux1.fr/fr/), from 07 March 2011 to 09 July 2013, on a biweekly basis when local weather conditions permitted. A total of 32 samples were collected in 5 L sterile polyethylene bottles for molecular analysis, kept in the dark at the in situ temperature, and filtered at laboratory within 2 h. Before filtering, the samples were screened with a 150 μm mesh to retain larger particles and most metazoa. Next, sequential filtration through 10, 3, and 0.6 μm nucleopore filters with 47 mm diameter, was performed using a peristaltic pump with a very low filtration pressure (15 rpm). The serial filtration was used in order to avoid filter clumping and minimize organism disruption.
The filters were immediately stored at −80°C until molecular analysis. In addition, a subsample of 250 mL was collected and fixed with 2% (final concentration) Lugol-glutaraldehyde solution for microscopic analysis.
Physical-Chemical Variables and Phytoplankton Abundance
Seawater temperature (°C) and salinity were measured in situ using a conductivity-temperature-depth profiling system (CTD Seabird SBE 25). The level of oxygen was immediately analyzed in triplicate with the Wrinkler method (Aminot and Chaussepied, 1983) according to potentiometric titration with a titrino848 (Methrom). Inorganic nutrient concentrations (nitrate [], nitrite [], phosphate [], and silicate []) were determined from 100 mL samples with an Alliance Integral Futura Autoanalyzer II based on Strickland and Parsons (1972) and Aminot and Kerouel (2004).
Abundance of P. globosa and diatoms was determined in sedimentation chambers (10–25 ml) according to the Utermöhl method using an inverted microscope (Nikon Eclipse TE 2000-S). Given the complex life-cycle of P. globosa, abundance of cells embedded in P. globosa colonies was determined according to biovolume measurements at magnification of X100 or X200 of all the colonies present in the sedimentation chamber (Rousseau et al., 1994), while at least 400 free cells were counted according to random fields at X400. For diatoms, at least 400 cells of the most abundant species were counted at X400 and 100 cells of the less abundant species at X200.
DNA Extraction
The DNA of the planktonic organisms was extracted after collectively pooling the 10, 3, and the 0.6 μm filters, using the PowerWater DNA isolation kit (MoBio Laboratories Inc., CA, USA), and following the manufacturer's protocol. The samples contained between 0.5 and 4.5 ng μL−1 of DNA as measured by the Qubit 2.0 Fluorometer (Thermo Fischer Scientific Inc., Massachusetts, USA).
PCR and Tag Pyrosequencing
The DNA samples were amplified using the eukaryotic primers 18S-28F (5′-GAAACTGCGAATGGCTC-3′) (López-García et al., 2003) and Euk-516r (5′-ACCAGACTTGCCCTCC-3′) (Amann et al., 1990), which have been designed to amplify a domain around 470–480 bp corresponding to the hyper-variable V2 and V3 eukaryote 18S rRNA gene regions. These primers have been successfully used in previous studies of the protistan community in the area (Christaki et al., 2014; Genitsaris et al., 2015, 2016), and allow a comparison of the present results with previous findings. Polymerase Chain Reaction (PCR) was carried out according to standard conditions for Platinum Taq High-Fidelity DNA Polymerase (Invitrogen), with 5 ng of environmental DNA as a template, using the GeneAmp PCR System Apparatus (Applied Biosystems). Tag Pyrosequencing was carried out by the GenoScreen Company (Lille, France). The library was prepared following the procedures described by Roche (Basel, Switzerland) and used in one plate run on a 454 GS FLX Titanium Sequencer. Pyrosequences were submitted to GenBank-SRA under the accession number SRX768577.
Tag Pyrosequencing Quality Filtering
All samples produced between 12,581 and 29,712 reads. Downstream read processing was performed using the mothur 1.28.0 software following the standard operating procedure (Schloss et al., 2009, 2011), described in Genitsaris et al. (2015). Briefly, the flowgrams of each sample were extracted, separated and denoised using the mothur implementation of PyroNoise (Quince et al., 2009). Primer sequences, tag and key fragments were removed, and only reads above 200 bp long with homopolymers shorter than 8 bp were included. The dataset were dereplicated to the unique reads and aligned against the SILVA 108 database. The reads suspected of being chimeras were removed using the UCHIME software (Edgar, 2010). The dataset was normalized to the sample with the lowest number of reads using the subsample command in mothur, so that all samples contained 12,581 reads. These reads were clustered into Operational Taxonomic Units (OTUs) at 97% similarity threshold, using the average neighbor method. Finally, single singletons (i.e., unique amplicons that occurred only once in the whole dataset) were removed, as these are likely erroneous sequencing products (Kunin et al., 2010; Behnke et al., 2011).
Data Analysis
After tag pyrosequencing filtering and normalization, 1,303 OTUs were produced. Taxonomic classification was assigned using BLASTN (Altschul et al., 1990), according to the PR2 curated database (Guillou et al., 2013). All reads affiliated to metazoan were removed from the dataset, thus 1,242 OTUs belonging exclusively to protists, remained. These OTUs, belonging to nine taxonomic super-groups were sorted into six groups according to their trophic status (Table 1), as in Genitsaris et al. (2016). The six trophic groups that were formed were: SymbDec, including symbionts, decomposers, and parasites; autotrophs; heterotrophs and mixotrophs (based on their metabolism); and micro-, nano-, and picograzers (based on the size of their prey). Briefly, the strategy applied in order to sort the OTUs into trophic groups, was to individually examine the 1,242 OTUs and annotate them to a trophic group using the highest level of information. For OTUs affiliated to micro- and nanoplankton (e.g., dinoflagellates, ciliates, diatoms, cryptophytes, chlorophytes, and the blooming P. globosa) the confidence about their trophic role was high, as they had been also detected by microscopy. Conversely, for OTUs that were affiliated with taxonomic groups impossible to detect with microscopy, consideration of their annotation to higher taxonomic groups (e.g., family level) was taken into account, which is considered reliable for the size of the reads that were obtained with pyrosequencing (Bachy et al., 2013; Santoferrara et al., 2014). Thus, the taxa belonging to the groups MALV (MArine ALveolates) and MAST (MArine STramenopiles) were considered symbionts and nano-grazers, respectively, according to the existing literature (Massana et al., 2006; Skovgaard, 2014; respectively for MALV and MAST) (see Table 1).
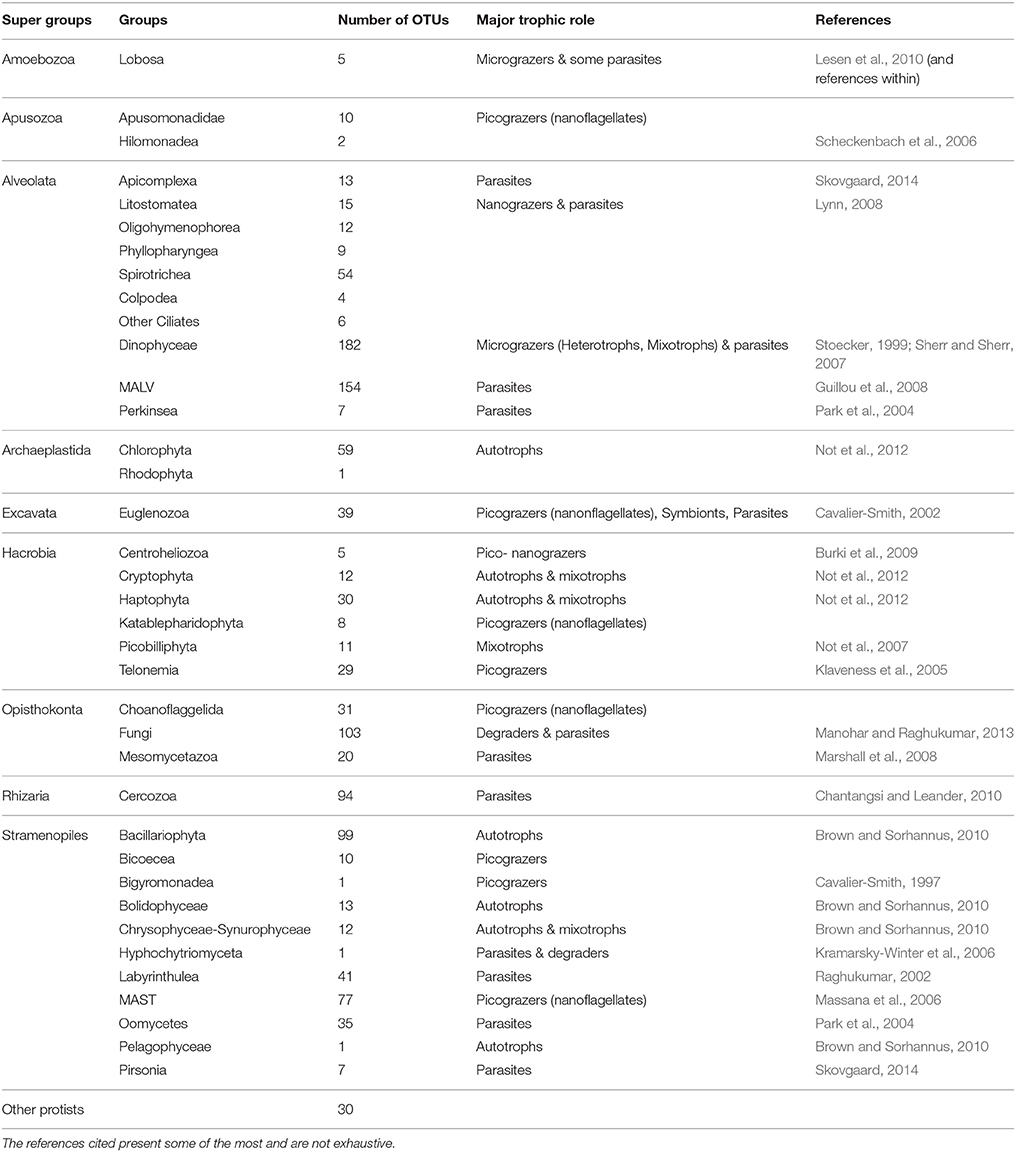
Table 1. Annotated major trophic role, OTUs number at the sampling station, and related references for the super group annotation.
Furthermore, the 1,242 OTUs were classified in relation to their total relative abundance. Specifically, the abundant OTUs were defined as those with relative abundances > 0.1% of the total number of reads, following previous studies on prokaryotes (e.g., Galand et al., 2009; Hugoni et al., 2013) and protists (e.g., Logares et al., 2014; Genitsaris et al., 2015). Overall, 142 OTUs were characterized as abundant. These alone, or in combination with the environmental variables, were used in network analysis. Two different correlation techniques were used in order to assess the significant relationships between OTUs, and between OTUs and environmental variables. It should be stated however, that here, negative and positive correlations do not necessarily indicate co-occurrence or co-exclusion patterns, as they may result from indirect interaction with a third variable, whether biotic or abiotic. The first analysis was done through MINE (Maximal Information-based Nonparametric Exploration) statistics by computing the Maximal Information Coefficient (MIC) between each pair of OTUs, and between each pair and the environmental variables (Reshef et al., 2011). MIC is a non-parametric method that captures associations between data and provides a score that represents the strength of a pair relationship, independently of their function type (e.g., linear or exponential). The matrix of MIC-values corresponding to a P < 0.01, based on pre-computed P-values of various MIC scores at different sample sizes, was used (MIC > 0.6 in this case). Second, the Local Similarity correlations (LS), were determined by LS analysis (LSA; https://bitbucket.org/charade/elsa/wiki/Home), using a delay of one time point in order to identify time-lag correlations (Ruan et al., 2006; Steele et al., 2011; Xia et al., 2011, 2012). The correlations without any delay were also checked. The correlations with P < 0.001 and R > 0.6 were taken into consideration. LS analysis is optimized to detect non-linear, time-sensitive relationships and is used to construct correlation networks from time-series data, similar to the present dataset.
The networks of significant OTU-OTU pairs, or OTU-environmental parameter pairs as identified by MIC associations, and by both time-lag LS correlations and correlations without time-lag, were constructed using Cytoscape v3.5 (Smoot et al., 2011). Network Randomizer 1.1.2 (Tosadori et al., 2016) was used to generate random networks of the dataset. The “small-world” coefficient (σ) of the network was calculated according to Humphries and Gurney (2008), as follows:
where C and Cr are the observed and random Clustering Coefficients and L and Lr the observed and random Characteristic Path Lengths. If σ > 1 (C>>Cr and L≈Lr), then the network has “small world” characteristics (Watts and Strogatz, 1998; Humphries and Gurney, 2008). In an ecological context, small-world networks have specialized nodes or regions within themselves (e.g., a parasite on a certain microbe), and at the same time they can exhibit shared or distributed processing across all of the connected nodes (all connected microbes have trophic interactions, contributing to energy transfer in the community). The topological parameters of each network were calculated according to Cytoscape v3.5.
Results
Environmental Parameters
The periods of the P. globosa blooms during the study period were determined based on microscopy observations and cell counts. Seawater temperature during the period of the study ranged from 5.4 to 18.5°C, while the salinity ranged from 33.3 to 34.7 (Figure 1). The highest value recorded for PO4 was recorded during the P. globosa bloom in April 2012 (Figure 1). The highest values of inorganic nutrients were documented for all 3 years before the onset of the P. globosa proliferation, reaching 15.1 μM for NO3 + NO2 in January 2012, and 7.7 μM for SiOH4, in February 2013. Furthermore, the N/P ratio varied from 0.1 to 43.2 (coefficient of variation CV = 109%) with values higher before and lower after the P. globosa blooms in all 3 years (Figure 1).
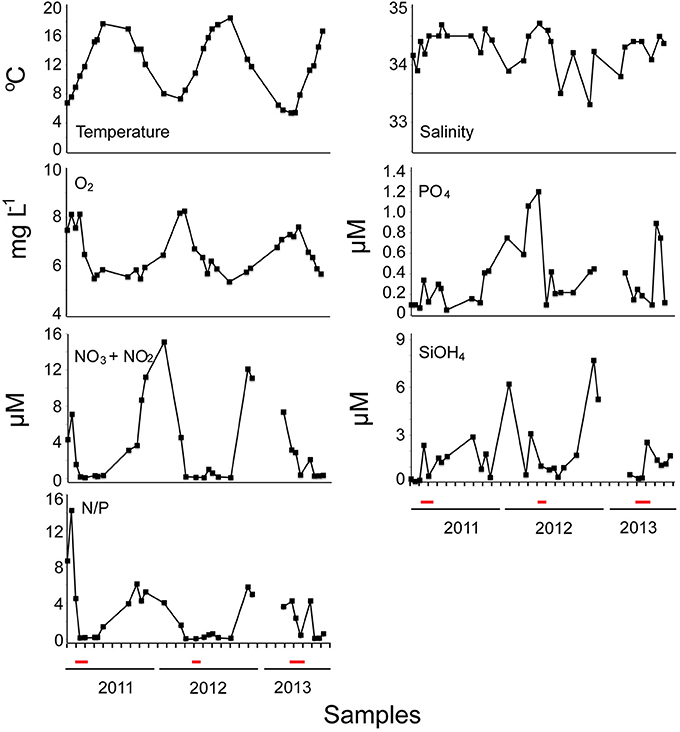
Figure 1. Temporal variation of physical and chemical parameters during the study: Temperature (°C), Salinity, Oxygen (O2), Phopshates (PO4), Nitrates and Nitrites (NO3+NO2), Silicates (SiO4), and N/P ratio. The red line the on x-axis indicates periods of the P. globosa bloom (modified from Genitsaris et al., 2015, suppl. Fig. S1).
Protistan Community and Potentially Parasitic Community
In the present study we identified 1,242 OTUs. Rarefaction curves of the samples were calculated, reaching a plateau in all cases, suggesting a good coverage of the protistan diversity in all samples (Figure S1). All OTUs were classified into 9 taxonomic super-groups, which were further sorted into 32 high-level taxonomic groups (Table 1). The microscopic counts of P. globosa, diatoms, and dinoflagellates during the sampling period showed a similar succession with read data (Figures 2A–C). The most abundant OTUs in the dataset belonged to the above 3 groups. Among the 99 diatom-related OTUs, an OTU identified as Leptocylindrus danicus (100% similarity; OTU003) showed an increase during late spring and summer (05/ 2011, 07/2012 and 05 to 07 2013, Figure 2B). Dinophyceae was the most diverse group consisting of 182 OTUs. Although many trophic types were represented in this group (Table 1), the majority were heterotrophic dinoflagellates (mainly phytoplankton grazers). The genus Gyrodinium dominated the dinoflagellate community (Figure 2C). In particular, 42 OTUs had as closest relative a dinoflagellate identified as Gyrodinium spirale, and 9 of them were abundant (> 0.1% of the total number of reads) and were included in the network analysis. Gyrodinium was present in all samples, and particularly abundant during spring and early summer coinciding with the P. globosa blooms (Figures 2A,C). P. globosa was also among the most abundant taxa and was represented by an OTU with a close relation (100% similarity). Finally, high abundance values were annotated to the potentially parasitic groups of MALV (Figure 2C), Fungi and Cercozoa throughout the study (Figure 2D).
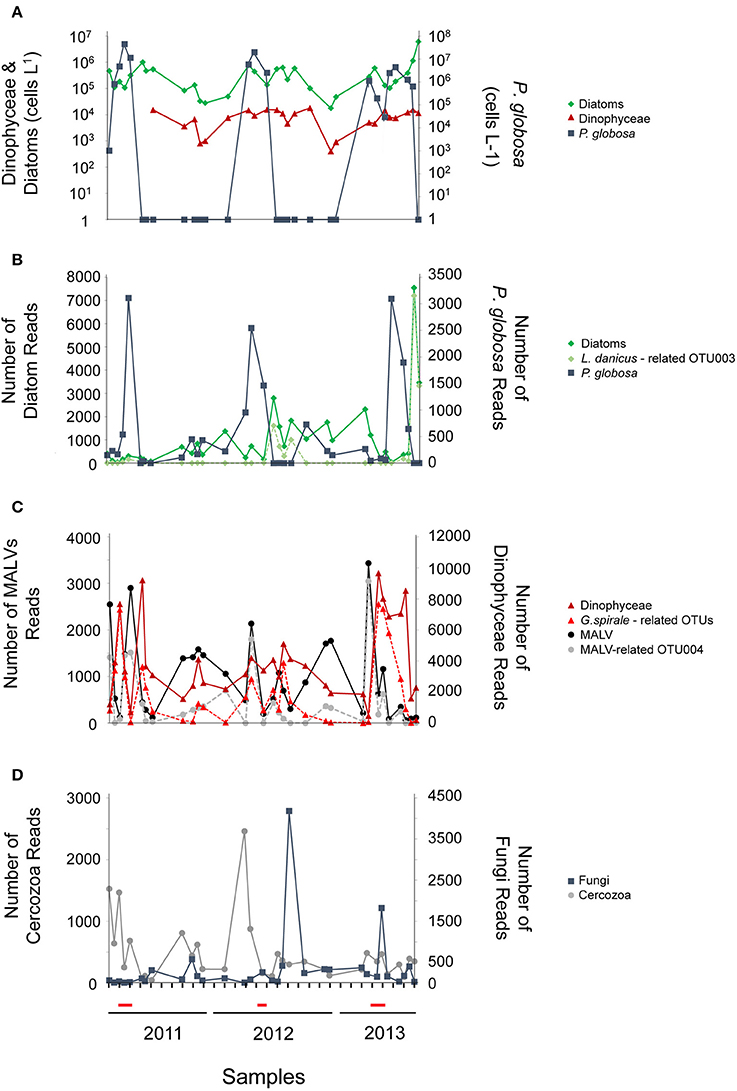
Figure 2. Microscopic counts (cells L−1) of diatoms (green line), dinoflagellates (red line) and Phaeocystis globosa (blue line) (A); Number of reads of diatoms (green line), the most abundant diatom OTU003 related to Leptocylindrus danicus (dotted light green line), and P. globosa (blue line) (B); Number of reads of heterotrophic dinoflagellates (red line), the most abundant dinoflagellate OTUs related to Gyrodinium spirale (dotted light red line), MALV (black line), and the most abundant MALV-related OTU004 (dotted gray line) (C); Number of reads of Fungi (blue line) and Cercozoa (gray line) (D). The red line on the x-axis indicates periods of the P. globosa bloom.
Among the 32 higher taxonomic groups, >10 were totally composed of or included potentially parasitic, symbiotic, or decomposers' taxa (SymbDec), making up 42% of the total number of OTUs (Figure 3). Most of the potentially parasitic groups were plankton parasites, while around 30% among them were fish/molluscs parasites. SymbDec OTUs showed the highest richness in most of the samples, reaching 130 OTUs on 03 October 2012 (Figure 4A). The lowest number of SymbDec OTUs (10 OTUs) was recorded in the sample with the lowest OTU richness on 05 April 2012 (Figure 4A). In all samples, SymbDec contributed >20% of the total number of OTUs, and in more than the half samples, they contributed >30% of the total number of OTUs (Figure 4B). It is noteworthy that in one sample (04 April 2011), the SymbDec group comprised of 58% of the total number of OTUs (Figure 4B). The trophic group following SymbDec in terms of OTUs richness (reaching 80 OTUs in one sample) and contribution (generally between 10 and 30% of the total number of OTUs) were OTUs identified as picograzers (picoG, Figure 4B), while the least represented in terms of OTUs was trophic group ciliates, identified as grazers of nanoplankton (nanoG, Table 1), which contributed to about 10% of the total OTUs in most samples (Figure 4B), and in an unique case (04/07/2012) only one OTU was present.
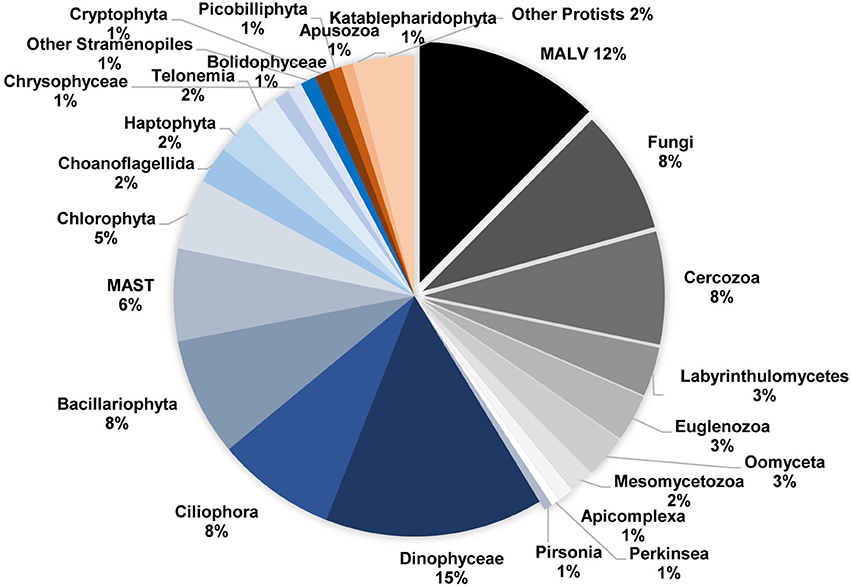
Figure 3. Relative abundance of major high-level taxonomic groups of protists that were detected in the study, based on comparisons against the Protist Robosomal Reference (PR2) database using the “blastn” function (Table 1). Groups that predominantly include symbionts, parasites and decomposers (see Table 1) are shown with shades of gray, and separated pie pieces. To facilitate reading, only groups with relative abundance >1% are presented.
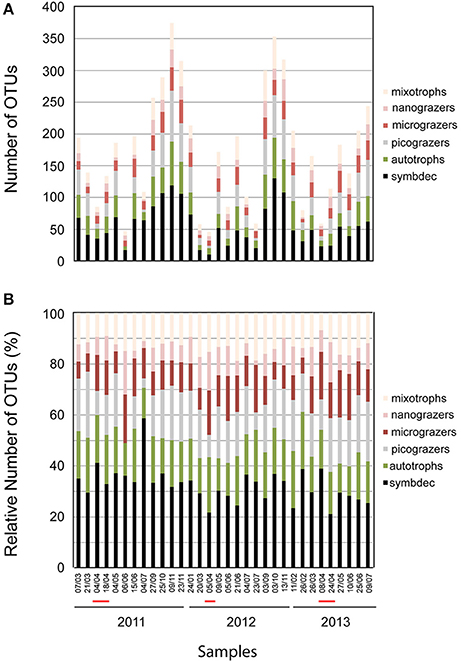
Figure 4. Absolute (A) and relative (B) number of Operational Taxonomic Units (OTUs) in the trophic groups detected during the study. The trophic groups were formed based on the trophic status of the detected OTUs in marine systems as inferred from the literature (see Table 1). The red line on the x-axis indicates periods of the P. globosa bloom.
The most diverse taxonomic group belonging to SymbDec was Syndiniales (MALV), comprising of 12% of the total number of OTUs (Figure 3, Table 1). MALVs were always present and showed several peaks (Figure 2C), the most pronounced of which were recorded in March (2011, 2013), April (2012), and May (2011) (Figure 2C). These four peaks were primarily attributed to the same OTU (Figure 2C, OTU004 with closest relative MALV-I with 100% similarity), which accounted from 52 to 89% of the MALV community in these 4 samples and 45% of the overall MALV community. The MALVs' seasonal dynamic seemed visually opposite in many cases with the heterotrophic dinoflagellates (Figure 2C, e.g., March to September 2011, March-April 2012, September-December 2012, and March to May, 2013) with a significant negative correlation calculated between them (r = −0.49, p < 0.0001). MALVs were followed in terms of OTUs richness by Fungi (8% of the total number of OTUs), and Cercozoa (8%; Figure 3). The most abundant Fungi-related OTU in terms of number of reads was an Ascomycota identified as Tritirachium sp. (100% similarity, OTU020) which accounted for 24 and 75% of the two major fungal peaks occurred in July 2012 and April 2013, respectively (Figure 2D). The second most abundant fungi-related OTU was a Basidiomycota, which accounted for 62% of the fungi-related sequences in the July 2012 peak. Among Fungi, 24 OTUs belonged to Chytridiomycota, 3 of which were Rhyzophidiales; however, chytrid-related OTUs were rare and represented <0.1% of total abundance. Cercozoa showed a pronounced peak in March 2012, which was dominated by OTUs related to an uncultured clone (OTU028; 75%) and Cryothecomonas sp. (OTU045; 14%). These two OTUs peaked also together in April 2011 (Figure 2D).
The other taxonomic groups belonging to SymbDec were Labyrinthulomycetes (3% of the total number of OTUs), Oomycetes (3%), Euglenozoa (3%), Mesomycetozoa (2%), Apicomplexa (1%), Perkinsea (1%), and Pirsonia (1%) (Figure 3, Table 1). Perkinsea, were represented by 7 OTUs including OTUs closely related to Parviculifera sp. and Perkinsus sp., and Apicomplexa were represented by 13 OTUs, including several Gregarines, but as chytrids above, they all were found at very low abundances (<0.1%).
The plot of the cumulative number of OTUs indicated that the number of newly introduced OTUs was always higher during summer and autumn for each year, and the highest number was recorded in July 2011 (98 OTUs, Figure 5A). The influx of total OTUs accelerated from September to November 2011 and 2012, and decelerated at the onset and during the P. globosa bloom (Figure 5A). A parallel but hampered trend was observed for the newly introduced SymbDec OTUs, while the MALV-related newly introduced OTUs leveled out by autumn 2011. MALV data revealed the presence of 154 species-level operational taxonomic units (OTUs) falling into three of the five well-established Syndiniales clades (Table 1). Based on the newly arriving OTUs between two consecutive dates, a highly significant positive relation was observed between the cumulative number of OTUs not belonging in SymbDec and the cumulative number of SymbDec OTUs (Figure 5B).
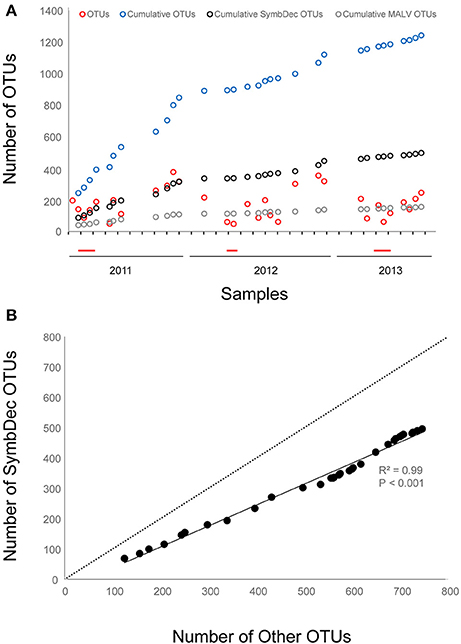
Figure 5. Plot of the total number of OTUs present at each sampling date (red circles), the cumulative number of OTUs (blue circles) based on the new arriving OTUs between two consecutive dates, the cumulative number of SymbDec OTUs (black circles) and the cumulative number of the most abundant SymbDec OTUs, MALV (gray circles) (A); and relationship between the number of cumulative OTUs (no SymbDec included to avoid autocorrelation) and SymbDec OTUs, based on the new arriving OTUs between two consecutive dates. The determination coefficient R2, the p-value and the 1:1 line are also indicated (B). The red line on the x-axis indicates periods of the P. globosa bloom.
Network Analyses
Two correlation techniques, MIC and LSA, that detect ecological and time-series relationships between 18S rRNA gene reads were selected in order to implement network analysis on the present time-series dataset.
According to the MIC, a total of 93 out of the 142 most abundant OTUs (i.e., >0.1% abundance) were found to have 254 strong correlations (edges) with each other. Fifty-seven of the correlations were negative (Table S1). The environmental parameters found to have strong correlations with OTUs were O2, N, T, and N/P (data not shown), however, only 11 OTUs were found to be connected with them. The 60 OTUs present in the MIC network when only connections of SymbDec OTUs were included were involved in 86 connections (12 negative, Table S1).
LSA with no lag showed a relatively higher level of participation of OTUs in the respective networks than MIC (Table 2). In order to explore possible correlations that could be hidden due to delayed reaction to specific changes between environmental parameters and the abundant OTUs, and OTUs of the SymbDec group and the other OTUs, a one-time point lag delay was also implemented to the LSA. In fact, the lag delayed analysis revealed a higher number of connected OTUs (103 OTUs in total, 69 when only SymbDec connections were included, and 22 connected to O2, N, T, and N/P) and significant correlations (394 total connections, 143 when only SymbDec connections were included, 28 with environmental parameters) (Figure 6A, Table 2). The topological parameters of the networks suggested that the lag-delayed analysis provided a denser network structure between the most abundant OTUs and in particular for the SymbDec OTUs. The Clustering Coefficient, the Characteristic Path Length, the Average Number of Neighbors, and the Network Density of the SymbDec lag network were all higher than in MIC and no lag networks (Table 2). Furthermore, topological parameters, such as the Clustering Coefficient, Centralization, and Heterogeneity were ~x5, x7, and x3 times higher, respectively, for the observed relative to a random network of the same size (Table 2, see Steele et al., 2011). On the other hand, the Characteristic Path Length of the 2 networks was similar (Table 2), resulting a “small-world” coefficient σ = 5.51.
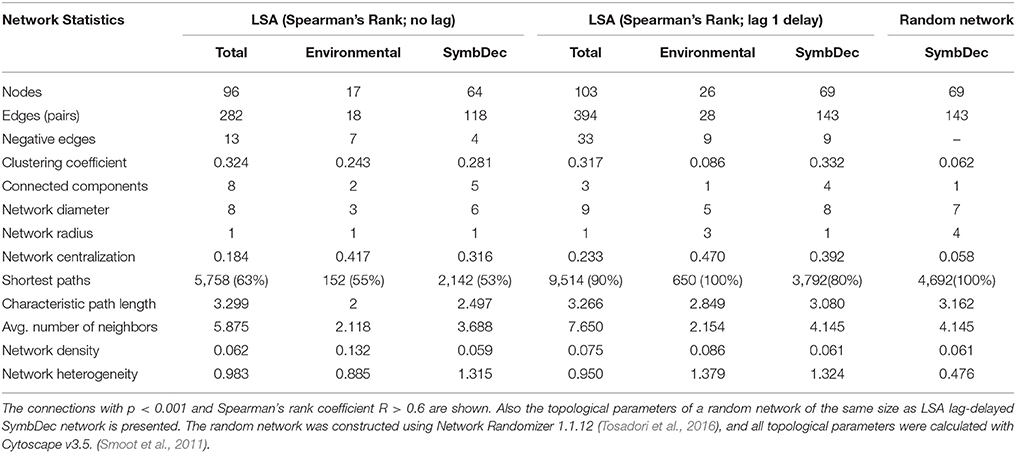
Table 2. Network statistics of the LS analysis without lag and with lag delay of 1 time point, (a) for the total community including environmental variables, (b) for the connections only with environmental variables, and (c) the connections of SymbDec.
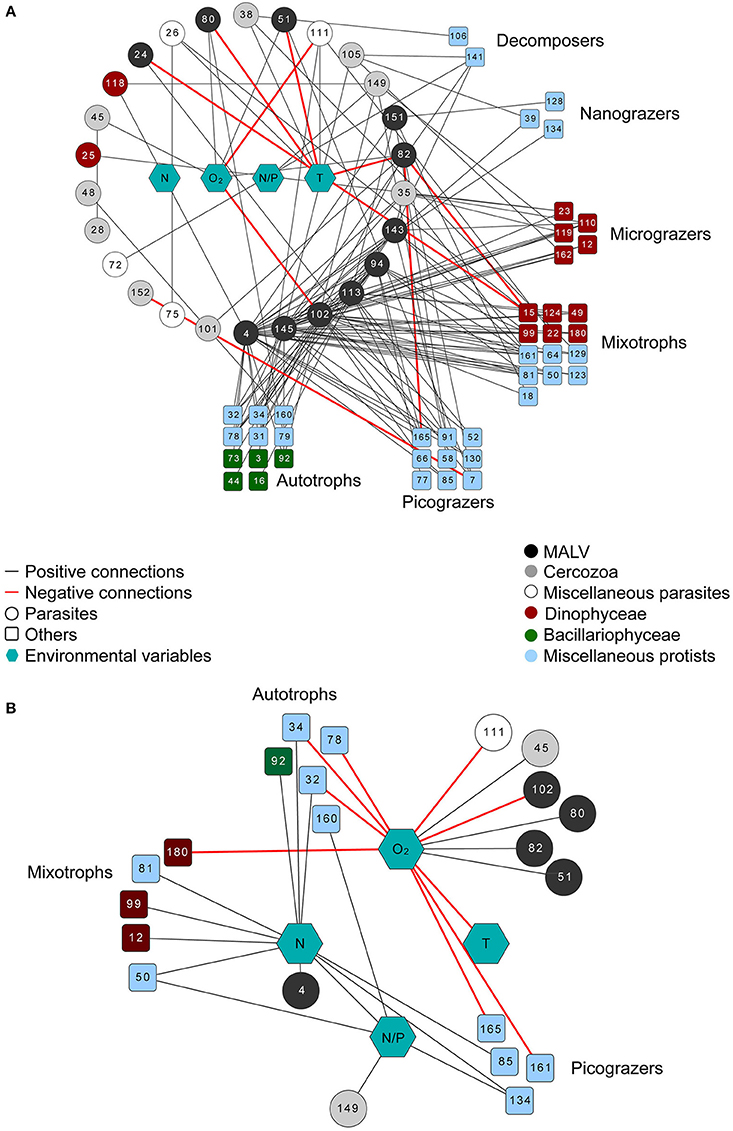
Figure 6. Network diagram of highly significant connections (R > 0.6 and p < 0.001) between the SymbDec Operational Taxonomic Units (OTUs) and other dominant OTUs, as well as the environmental variables (nodes) as determined by LS analysis (LSA) using a delay of one time point. To facilitate reading all the potentially parasitic nodes are structured as a circle which can be read anticlockwise starting from the OTU4, which has the maximum number of connections (A); Network diagram of highly significant connections (R > 0.6 and p < 0.001) between environmental parameters and dominant OTUs (nodes) as determined by LS analysis using a delay of one time point (B). The exagons represent the environmental variables, the circles represent parasitic taxa, and the rectangles all other taxa. Different colors: different taxonomic groups with emphasis on Dinophyceae (red) and Bacillariophyceae (green). Black lines (edges) represent positive connections and red lines represent negative connections. See also Table 3 for taxonomic details of the OTUs presented on this figure.
Here the lag-delayed LSA network of only SymbDec connections is shown in Figure 6A. Among the 26 potentially parasitic OTUs, the most connected belonged mainly to MALVs, Pirsonia and Cercozoa (Table 3), and 29 out of the 143 connections involved connections between SymDecs. The majority of the correlations involved in the network were positive, while only 3 negative correlations were detected among OTUs (Figure 6A). The rest of the negative edges (six) in the network were OTUs—environmental parameters pairs. Among the 4 environmental parameters (O2, N, T, and N/P), temperature (T) had the highest number of connections (eight), while half of them were negative connections with MALV-related OTUs. In order to examine the significant correlations of the environmental parameters with all OTUs in addition to the parasitic-related, a network that included only the lag-delayed connections of the environmental parameters is shown (Figure 6B). In this case, Temperature (T) was negatively connected with oxygen (O2), while O2 was the environmental parameter with the highest number of connections (12 overall, eight negative) with a variety of taxonomically and functionally different OTUs. Among them, six were with parasitic OTUs (four with MALVs). Furthermore, Nitrogen (N) had exclusively positive connections (10) with a variety of taxonomically and functionally different OTUs (Figure 6B). Finally, it is noteworthy that the bloom forming P. globosa was not present in any of the networks constructed.
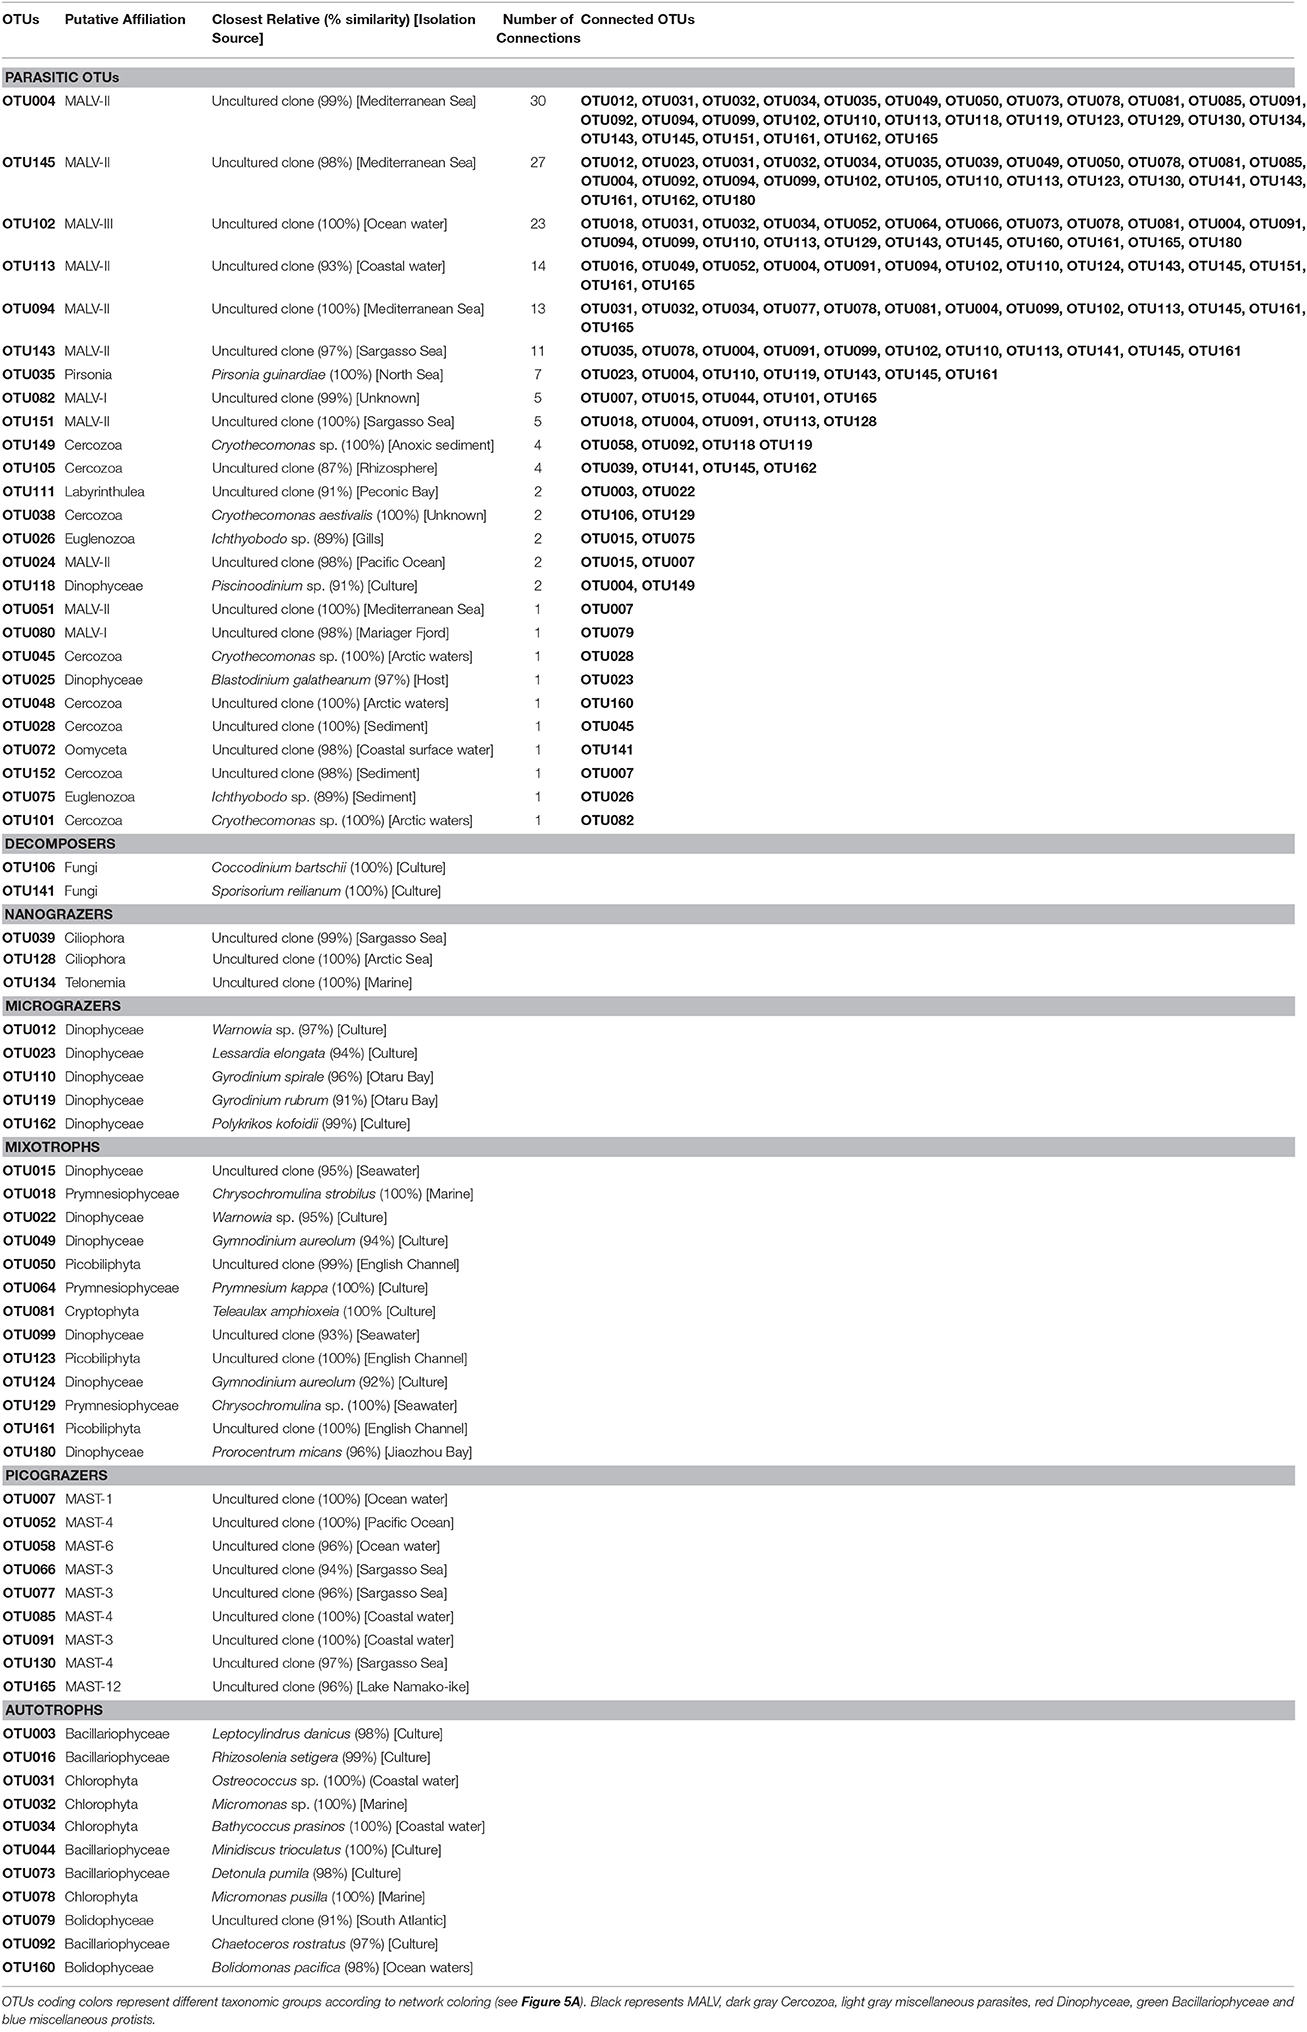
Table 3. Putative affiliation, closest relatives according to PR2 database BLAST results, and connected OTUs based on LSA lag correlation coefficient of the OTUs included in the network.
Discussion
These results have showed that the importance of SymbDec OTUs in the EEC is extended throughout the whole year, as SymbDecs were found to comprise 42% of the total number of OTUs in the entire study (Figure 3), and at least 20% of the total number of OTUs per sample (Figure 4). Accumulating evidence shows that biotic interactions among eukaryotes, as well as between bacteria and certain algae, can shape the composition and dynamics of microbial communities and algal blooms (Dang and Lovell, 2016). Although sequencing studies are not quantitative, the relative abundance of reads belonging to groups connected to parasitism or symbiosis has attracted scientific attention in virtually all marine environments (e.g., Georges et al., 2014; Duret et al., 2015; Massana et al., 2015). According to the existing literature on cell-cell interactions among the sea-surface microbiota (e.g., Dang and Lovell, 2016), it is now possible to draw a more complete picture about the microbial interactions in coastal water communities. In the present study, a network analysis approach was conducted in order to explore the aptitude of correlation networks, highlight the strong connections of SymbDec taxa within the seasonal microplankton succession and identify the underlying environmental parameters that affect specific groups of the microplankton community. The detection of ecological relationships between microbial taxa is challenging for sparse datasets and filtering out the rare biosphere in microbial datasets is recommended prior to utilizing these tools (Weiss et al., 2016). The comparison of performance of eight correlation techniques commonly used to describe microbial interactions inferred from high-throughput sequence data suggested that the best tools to address sparsity of data were MIC and LSA (Weiss et al., 2016). The authors concluded that although these tools reflect relationships that involve commensalism and mutualism, they have better fidelity in reflecting parasitic relationships than the other correlation techniques tested. Furthermore, in the case of time series data, LSA best describes the ecological relations between taxa. In particular, LSA can also identify time-lag correlations (Ruan et al., 2006; Xia et al., 2011, 2012).
For all these reasons, the network that was chosen to be presented in the paper was constructed according to LSA (Figures 6A,B). The LSA with time-lag network displayed higher connectivity than the MIC network, based on the topological parameters that show density (Clustering Coefficient, Characteristic Path Length, and Average Number of Neighbours) (Table 2, Faust and Raes, 2012). Furthermore, the higher Clustering Coefficient, Centralization, and Heterogeneity values in comparison to the clustering coefficient of a random network of the same size (Table 2) showed that the parasitic assemblage in the EEC were more connected than a random network of similar size. As the Clustering Coefficient was relatively high and the Characteristic Path Length relatively short, the parasitic network had “small world” characteristics (Watts and Strogatz, 1998; Humphries and Gurney, 2008), rendering the assemblage more robust to environmental change, but more susceptible to removal of highly associated taxa (Dunne et al., 2002). The “small world” model “of few highly connected nodes, as opposed to an even distribution of connectivity, makes the network more robust to change (Albert et al., 2000; Montoya et al., 2006) with an important caveat: if highly connected nodes are lost, the network would change dramatically”. According to Steele et al. (2011), the 'highly connected nodes' can be considered as equivalent to microbial “keystone species.”
However, it is important to consider here that network structure alone is incapable of capturing the processes that occur within a dynamic community of microbes. For instance, the presence of hub nodes could indeed confer greater robustness or resilience on a community, but considerations of bottom-up disturbances, i.e., disturbances that propagate in the direction of energy transfer, need also to be taken into account. Also, on a complementary note, the removal of nodes at higher trophic levels may not affect nodes at lower levels, and in this case it is challenging to capture any top-down effects or cascades. While this can be done in a network context, one has to add dynamic processes to the links, and go beyond considering network structure alone. For these reasons, in the present study we attempted to interpret network structure keeping in mind the community dynamics as revealed by both NGS and microscopic data, and including existing knowledge from previous studies of the plankton community in the area.
In the parasitic network of the present study, several MALVs and Cercozoa exhibit characteristics of “hubs,” as both taxonomic groups contribute with highly connected taxa, and also include few taxa with low number of connections that are traced back to the highly connected taxa of their respective groups. Many different parasites were connected; for example the most abundant cercozoan (OTU028), which showed a pronounced peak, was connected to the second most abundant cercozoan closely related to Cryothecomonas (OTU045). Cercozoans showed connections with fungi and between them and in one case, with a Chaetoceros-like diatom. According to Steele et al. (2011) several of the co-occurrences may indicate associations of taxa with analogous or matching functions, and others co-occur because they share similar optimal environmental conditions. Recent findings suggest that highly connected networks promote the stability of the community under changing environments, possibly because of direct and indirect mutualistic support (Lever et al., 2014). In other words, when harsh conditions drive the disappearance of a central highly connected network taxon, another one of the same group directly connected to the first, might survive or even thrive and take its place as if parasites were “holding the ecosystem together” (Windsor, 1998). This may be part of the explanation for the frequent and persistent occurrence of the parasitic guild, and especially of the MALVs and Cercozoa, throughout the year in the EEC, under a variety of conditions (Christaki et al., 2014; this study), based on network structure. Indeed, among SymbDec groups, MALVs show overwhelming occurrences representing up to 50% of sequences retrieved, from coastal waters to deep hydrothermal vents (Guillou et al., 2008).
As previously observed in the studied area (Christaki et al., 2014), MALVs were identified as the predominant group of potential parasites. While the influx of the total number of OTUs continued to increase after 32 sampling dates, the cumulative plot of newly arriving MALV OTUs leveled out before the end of the first year of sampling (see Figure 5). This result may point toward a wide host range of this group. It has been suggested that MALV groups, especially MALV-II, because of their considerable abundance and diversity in marine environments, interact mainly with dinoflagellates and also with other various hosts that include radiolarians, ciliates, as well as copepods and fish (Skovgaard et al., 2005; Harada et al., 2007; Guillou et al., 2008; Bråte et al., 2012). The relationship between MALVs and heterotrophic dinoflagellates in the present study (P < 0.001) suggests that most of these MALVs were dinoflagellate related ones. Also, according to network analysis, five out of the six most connected MALV-related OTUs (closely affiliated to MALV-II) were mostly connected with OTUs affiliated to dinoflagellates (e.g., Gyrodinium spp., Warnowia sp., Lessardia elongata). Planktonic dinoflagellates in general and the ones of the genus Gyrodinium in particular are infected by Syndiniales (e.g., Coats et al., 1996; Coats, 1999; Park et al., 2004). The genus Gyrodinium was represented by 42 OTUs of which 9 were abundant (>0.1%), and was always present in the samples and particularly abundant during spring and summer. Although dinoflagelllate cells have been found to contain multiple 18S rRNA gene copies, thus potentially affecting abundance data by oversaturating the sequencing samples (Stoeck et al., 2010; Pirreda et al., 2016), our microscope observations of the samples confirmed the overall dominant presence of Gyrodinium species. To date, the phenomenon of massive killing of dinoflagellates by MALV (e.g., Coats et al., 1996; Park et al., 2004; Guillou et al., 2008) has been the subject of scientific interest as a possible means to limit toxic dinoflagellate blooms (Chambouvet et al., 2008). In addition, according to the overall connections of MALV-related OTUs as revealed by network analysis (Figure 6A), a larger host range and variability than previously thought was indicated, as MALVs are highly connected to diatoms (e.g., Rhizosolenia setigera, Minidiscus sp.), ciliates (Strombidium spp.), MAST groups, and taxa belonging to Picobiliphyta. The most abundant MALV OTU, which was also mainly responsible for the four most important MALV peaks during the study (Figure 2C), was the most highly connected; with connections to a variety of organisms, including MAST groups, diatoms and a small number of dinoflagellates.
MALV were followed in richness and abundance in the SymbDec assemblage, by Fungi and Cercozoa, which showed several peaks but did not show any particular seasonal dynamic (Figure 2D). Fungi and Cercozoa were represented by 103 and 94 OTUs, respectively. In a previous study carried out in the EEC, these groups were mostly connected with diatoms (Christaki et al., 2014). In another study in contrasting Southern Ocean waters, Fungi and Cercozoa were associated with high diatom biomasses present in iron-fertilized waters; but almost absent in the High Nutrient Low Chlorophyll waters dominated by small sized phytoplankton (Georges et al., 2014). Relative to sequence abundances the two highest fungal peaks in July 2012 and April 2013 were mainly attributed to one Basidiomycetes (OTU021) and one Ascomycota (OTU020) OTU respectively. Their peaks followed diatom declines in July 2012 and March 2013, observed in both microscopy and sequencing data (Figures 2A,B,D), suggesting that they were related to phytoplankton exudates such as polysaccharides which are known to promote the growth of Fungi (Myklestad, 1995; Kimura and Naganuma, 2001; and references therein). Still, at this level of taxonomic identification and the lack of any knowledge of their ecology does not allow us to make any further hypothesis about their role. For example, many members of zoosporic fungi are hyperparasites having complex tripartite interactions and are consequently difficult to monitor (Gleason et al., 2014). Among Fungi, Chytridiomycota gain more and more attention since a large number of phytoplankton and invertebrate taxa are affected by chytrid parasites. Chytrids play also an important role in the food web since they recycle dead organic matter which can be further used by other organisms (see Gleason et al., 2011 for a review). In this study, chytrids accounted for about the 25% of fungal OTUs (24 OTUs) but, as also observed before at the same station their number of sequences were low and without apparent relation to the phytoplankton blooms in the area (Monchy et al., 2012; Christaki et al., 2014). Most of the OTUs found in the data set are currently reported as freshwater and soil inhabiting chytrids and it cannot be excluded that they arrived from rain or freshwater inputs at this coastal station. However, four OTUs were affiliated to the genus Rhizophydium, which is reported to include parasites of chlorophytes and diatoms ((Gleason et al., 2011) and references therein) but they were also low in abundance (<0.1%) and no relation with other OTUs could be established here.
Cercozoa showed a pronounced peak in March 2012, which was dominated by an uncultured clone (OTU028; 75%) and a Cryothecomonas-related OTU (OTU045 14%). These two OTUs peaked also together in April 2011 (Figure 2D). Cercozoa are parasites of a variety of marine organisms, including diatoms (e.g., Tillmann et al., 1999; Schnepf and Kühn, 2000), for example Cryothecomonas sp. has been identified as a parasite of the diatom Guinardia delicatula (Drebes et al., 1996).
The same pattern of large peaks attributed almost exclusively to one distinct MALV, Cercozoa or Fungi OTU has been previously observed at the EEC SOMLIT station (Christaki et al., 2014). We compared these OTUs sampled from February to June 2009 and the ones found here and concluded that the MALV (OTU004), the Ascomycota (OTU020) and the Cercozoa (OTU045) related OTUs were identical or almost identical (Table S2) with the ones that were found to peak in the 2009 samples (Christaki et al., 2014). These OTUs are most likely persistent and important members of the SymbDec community and they deserve further attention.
From the 99 diatom OTUs identified in the present data set, 12 were considered as abundant (>0.1%) and only two OTUs affiliated to L. danicus and Rhizosolenia sp. showed significant connections (Figure 6A, Table 3). During a 3 year microscopic survey (from May 2011 to June 2014, 47 samples) at a neighboring EEC station L. danicus, Rhizosolenia sp., and G. delicatula were found in 51%, 74% and 70% of the samples (Breton et al., 2017). L. danicus showed the highest mean biomass of all the 58 diatoms identified by microscopy and was followed in biomass by Rhizosolenia sp. and G. delicatula (Breton et al., 2017). In the present data set a Labyrinhulea-related OTU (OTU111) was connected with the L. danicus-related OTU (OTU003). Labyrinthulomycetes are common osmoheterotrophic marine unicellular eukaryotes (López-García et al., 2001) that may have a variety of relationships with their hosts including parasitism, commensalism and mutualism. OTU111 showed several peaks in spring, winter and summer; the two highest peaks occurred simultaneously with higher numbers of L. danicus sequences in July 2012 and July 2013 (Labyrinthulea data not drawn).
The studied area is subject to P. globosa proliferation, which may account up to 90% of the algal biomass (Grattepanche et al., 2011a,b) but there is no record up to date of any harmful bloom. Microscopy and experimental data at the same site have recognized certain heterotrophic dinoflagellates and in particular those of the genus Gyrodinium as the main predators of diatoms and P. globosa colonies (Grattepanche et al., 2011a,b). These studies proposed that because copepods do not consume P. globosa colonies, they intensively graze on heterotrophic dinoflagellates (top-down control) and in this way they promote the buildup of P. globosa biomass. Based on the results of the present study, parasitism on potential P. globosa grazers such as Gyrodinium taxa and competitors, might further promote P. globosa biomass buildup. Furthermore, the P. globosa-related OTU, albeit being one of the 5 most abundant OTUs in the entire dataset, did not show any significant correlation with parasitic or/and other, possibly indicating no parasitic or antagonistic regulation. Also, at the best of our knowledge there have been no reports about eukaryotic P. globosa parasites. However, it is well-documented that viruses play an important ecological role in population regulation of free P. globosa cells (Brussard et al., 2007). The presence of a “skin,” which effectively protects from grazing and infection by pathogens, is most likely the key reason why P. globosa colonies have reduced mortality relatively to singular cells and can create large blooms in various areas of the world's oceans (Hamm et al., 1999). The combination of the dominance of P. globosa and its absence of connections with parasitic taxa is intriguing. Moreover, in comparison to pre-bloom and post-bloom periods, the lower rate of newly-introduced OTUs was observed during all three P. globosa blooms (Figure 5).
Finally, network inference can also incorporate measurements of environmental traits by assuming they are additional taxa (e.g., Steele et al., 2011). All the Nitrogen connections were positive, while those of O2 were mostly negative due to highest N concentrations being before and lowest O2 concentrations being during the phytoplankton bloom, respectively (Figure 1). In comprehensive studies, strong associations between microbes and concentrations of nutrients such as nitrites and nitrates, can identify taxa that contribute in biogeochemical cycling (Falkowski et al., 2008; Fuhrman, 2009). In the EEC the light increase and the limitation in nutrients during early spring, was associated to an increase of ‘functional dominance’ of phytoplankton (diatoms and P. globosa), promoting nitrogen use efficiency (Breton et al., 2017). However, this was not clearly reflected in the network connections as P. globosa was virtually missing and few connections of nutrients concerned diatoms. Not conclusive network connections allowing predictions of relationships between taxa and environment have also been reported in Steele et al. (2011).
Generally, significant relations between microbial taxa dominated the network, while significant relations between microbes and abiotic variables were scarce (Figure 6) suggesting that changes in community composition were determined more by biological relationships than by major changes in the physical and chemical environment (Steele et al., 2011; Genitsaris et al., 2015). However, since correlations are not necessarily causative agents of the observed biological relations, network data connections among a variety of different taxa can be interpreted by different, but possibly interrelating, explanations. Because of the sampling frequency applied here, the picture consists of a series of snapshots giving a broad idea of extremely complex microbial interactions. It is encouraging though that many of the results of this study support previous evidence and naturally lead to some new hypotheses that deserve further research. For example future studies may aim at investigating if P. globosa colonies are indeed free from parasites; which is the role of the MALV taxa in many marine systems in the C flux, and if it can favor phytoplankton accumulation through dinoflagellate control.
Author Contributions
UC: study conception and design, acquisition of data, analysis and interpretation of data, drafting of manuscript; SG: acquisition of data, analysis and interpretation of data, drafting of manuscript; EB: acquisition of data, analysis of data; SM: analysis of data; LL, SR: critical revision. TS-N: study conception and design.
Conflict of Interest Statement
The authors declare that the research was conducted in the absence of any commercial or financial relationships that could be construed as a potential conflict of interest.
Acknowledgments
This study was supported by the “Nord-Pas de Calais” FRB-DEMO (FRB 2013), the ANR-ROME (ANR 12 BSV7 0019) and the SOMLIT network. The authors thank Eric Lecuyer for his help during the sampling. We thank www.englisheditor.webs.com for English proofing. We are thankful to three reviewers for their constructive comments that have helped improve the original manuscript.
Supplementary Material
The Supplementary Material for this article can be found online at: https://www.frontiersin.org/articles/10.3389/fmars.2017.00416/full#supplementary-material
References
Albert, R., Jeong, H., and Barabási, A. L. (2000). Error and attack tolerance of complex networks. Nature 406, 378–382. doi: 10.1038/35019019
Altschul, S. F., Gish, W., Miller, W., Myers, E. W., and Lipman, D. J. (1990). Basic local alignment search tool. J. Mol. Biol. 215, 403–410. doi: 10.1016/S0022-2836(05)80360-2
Amann, R. I., Blinder, B. J., Olson, R. J., Chrisholm, S. W., Devereux, R., and Stahl, D. A. (1990). Combination of 16S rRNA-targeted oligonucleotide probes with flow cytometry for analyzing mixed microbial populations. Appl. Environ. Microbiol. 56, 1919–1925.
Aminot, A., and Chaussepied, M. (1983). Manuel des Analyses Chimiques en Milieu Marin. Brest: CNEXO.
Aminot, A., and Kerouel, R. (2004). Dissolved organic carbon, nitrogen, and phosphorus in the N-E Atlantic and N-W Mediterranean with particular reference to non-refractory fractions and degradation. Deep Sea Res. I 51, 1975–1999. doi: 10.1016/j.dsr.2004.07.016
Bachy, C., Dolan, J. R., López-García, P., Deschamps, P., and Moreira, D. (2013). Accuracy of protest diversity assessments: morphology compared with cloning and direct pyrosequencing of the 18S rRNA genes and ITS regions using the conspicuous tintinnid ciliates as a case study. ISME J. 7, 244–255. doi: 10.1038/ismej.2012.106
Behnke, A., Engel, M., Christen, R., Nebel, M., Klein, R. R., and Stoeck, T. (2011). Depicting more accurate pictures of protistan community complexity using pyrosequencing of hypervariable SSU rRNA gene regions. Environ. Microbiol. 13, 340–349. doi: 10.1111/j.1462-2920.2010.02332.x
Berry, D., and Widder, S. (2014). Deciphering microbial interactions and detecting keystone species with co-occurrence networks. Front. Microbiol. 5:219. doi: 10.3389/fmicb.2014.00219
Bik, H. M., Porazinska, D. L., Creer, S., Caporaso, J. G., Knight, R., and Thomas, W. K. (2012). Sequencing our way towards understanding global eukaryotic biodiversity. Trends Ecol. Evol. 27, 233–243. doi: 10.1016/j.tree.2011.11.010
Bråte, J., Krabberot, A. K., Dolven, J. K., Ose, R. F., Kristensen, T., Bjorklund, K. R., et al. (2012). Radiolaria associated with large diversity of marine alveolates. Protist 163, 767–777. doi: 10.1016/j.protis.2012.04.004
Breton, E., Christaki, U., Bonato, S., Didry, M., and Artigas, L. F. (2017). Phytoplankton trait variation and nitrogen use efficiency in temperate coastal phytoplankton. Mar. Ecol. Prog. Ser. 563, 35–49. doi: 10.3354/meps11974
Brown, J. W., and Sorhannus, U. (2010). A molecular genetic timescale for the diversification of autotrophic stramenopiles (Ochrophyta): substantive underestimation of putative fossil ages. PLoS ONE 5:e12759. doi: 10.1371/journal.pone.0012759
Brussard, C. P. D., Bratbak, G., Baudoux, A. C., and Ruardij, G. (2007). Phaeocystis and its interaction with viruses. Biogeochemistry 83, 201–215. doi: 10.1007/s10533-007-9096-0
Burki, F., Inagaki, Y., Bråte, J., Archibald, J. M., Keeling, P. J., Cavalier-Smith, T., et al. (2009). Large-scale phylogenomic analyses reveal that two enigmatic protist lineages, telonemia and centroheliozoa, are related to photosynthetic chromalveolates. Genome Bio. Evol. 1, 231–238. doi: 10.1093/gbe/evp022
Caron, D. A., Worden, A. Z., Countway, P. D., Demir, E., and Heidelberg, K. B. (2009). Protists are microbes too: a perspective. ISME J. 3, 4–12. doi: 10.1038/ismej.2008.101
Cavalier-Smith, T. (1997). Sagenista and bigyra, two phyla of heterotrophic heterokont chromists. Arch. Protistenkd. 148, 253–267. doi: 10.1016/S0003-9365(97)80006-1
Cavalier-Smith, T. (2002). The phagotrophic origin of eukaryotes and phylogenetic classification of Protozoa. Int. J. Syst. Evol. Micr. 52, 297–354. doi: 10.1099/00207713-52-2-297
Chambouvet, A., Morin, P., Marie, D., and Guillou, L. (2008). Control of toxic marine dinoflagellate blooms by serial parasitic killers. Science 322, 1254–1257. doi: 10.1126/science.1164387
Chantangsi, C., and Leander, B. S. (2010). An SSU rDNA barcoding approach to the diversity of marine interstitial cercozoans, including descriptions of four novel genera and nine novel species. Int. J. Syst. Evol. Micr. 60, 1962–1977. doi: 10.1099/ijs.0.013888-0
Christaki, U., Kormas, K. A., Genitsaris, S., Georges, C., Sime-Ngando, T., Viscogliosi, E., et al. (2014). Winter-summer succession of unicellular eukaryotes in a meso-eutrophic coastal system. Microb. Ecol. 67, 13–23. doi: 10.1007/s00248-013-0290-4
Coats, D. W. (1999). Parasitic life styles of marine dinoflagellates. J. Eukaryot. Microbiol. 46, 402–409. doi: 10.1111/j.1550-7408.1999.tb04620.x
Coats, D. W., Adam, E. J., Gallegos, C. L., and Hedrick, S. (1996). Parasitism of photosynthetic dinoflagellates in a shallow subestuary of Chesapeake Bay, USA. Aquat. Microb. Ecol. 11, 1–9. doi: 10.3354/ame011001
Dang, H., and Lovell, C. R. (2016). Microbial surface colonization and biofilm development in marine environments. Microbiol. Mol. Biol. R. 80, 91–138. doi: 10.1128/MMBR.00037-15
Drebes, G., Kühn, S. F., Gmelch, A., and Schnepf, E. (1996). Cryothecomonas aestivalis sp. nov., a colourless nanoflagellate feeding on the marine centric diatom Guinardia delicatula (Cleve). Hasle. Helg. Mar. Res. 50, 497–515.
Dunne, J. A., Williams, R. J., and Martinez, N. D. (2002). Network structure and biodiversity loss in food webs: robustness increases with connectance. Ecol. Lett. 5, 558–567. doi: 10.1046/j.1461-0248.2002.00354.x
Duret, M. T., Pachiadaki, M. G., Stewart, F. J., Sarode, N., Christaki, U., Monchy, S., et al. (2015). Size-fractionated diversity of eukaryotic microbial communities in the Eastern Tropical North Pacific oxygen minimum zone. FEMS Microbiol. Ecol. 91:fiv037. doi: 10.1093/femsec/fiv037
Edgar, R. C. (2010). Search and clustering orders of magnitude faster than BLAST. Bioinformatics 26, 2460–2461. doi: 10.1093/bioinformatics/btq461
Edgcomb, V. P. (2016). Marine protist associations and environmental impacts across trophic levels in the twilight zone and below. Curr. Opin. Microbiol. 31, 169–175. doi: 10.1016/j.mib.2016.04.001
Falkowski, P. G., Fenchel, T., and Delong, E. F. (2008). The microbial engines that drive earth's biogeochemical cycles. Science 320, 1034–1039. doi: 10.1126/science.1153213
Faust, K., and Raes, J. (2012). Microbial interactions: from networks to models. Nat. Rev. Microbiol. 10, 538–550. doi: 10.1038/nrmicro2832
Fuhrman, J. A. (2009). Microbial community structure and its functional implications. Nature 459, 193–199. doi: 10.1038/nature08058
Fuhrman, J. A., and Steele, J. A. (2008). Community structure of marine bacterioplankton: patterns, networks, and relationships to function. Aquat. Microb. Ecol. 53, 69–81. doi: 10.3354/ame01222
Galand, P. E., Casamayor, E. O., Kirchman, D. L., and Lovejoy, C. (2009). Ecology of the rare microbial biosphere of the Arctic Ocean. Proc. Natl. Acad. Sci. U.S.A. 106, 22427–22432. doi: 10.1073/pnas.0908284106
Genitsaris, S., Monchy, S., Breton, E., Lecuyer, E., and Christaki, U. (2016). Small-scale variability of protistan planktonic communities relative to environmental pressures and biotic interactions at two adjacent coastal stations. Mar. Ecol. Prog. Ser. 548, 61–75. doi: 10.3354/meps11647
Genitsaris, S., Monchy, S., Viscogliosi, E., Sime-Ngando, T., Ferreira, S., and Christaki, U. (2015). Seasonal variations of marine protest community structure based on taxon-specific traits using the eastern English Channel as a model coastal system. FEMS Microbiol. Ecol. 91:fiv034. doi: 10.1093/femsec/fiv034
Georges, C., Monchy, S., Genitsaris, S., and Christaki, U. (2014). Protist community composition during early phytoplankton blooms in the naturally iron-fertilized Kerguelen area (Southern Ocean). Biogeosciences 11, 5847–5863. doi: 10.5194/bg-11-5847-2014
Gilbert, J. A., Steele, J. A., Caporaso, J. G., Steinbrück, L., Reeder, J., Temperton, B., et al. (2012). Defining seasonal marine microbial community dynamics. ISME J. 6, 298–308. doi: 10.1038/ismej.2011.107
Gleason, F. H., Küpper, F. C., Amon, J. P., Picard, K., Gachon, C. M. M., Marano, A. V., et al. (2011). Zoosporic true fungi in marine ecosystems: a review. Mar. Freshw. Res. 62, 383–393. doi: 10.1071/MF10294
Gleason, F. H., Lilje, O., Marano, A. V., Sime-Ngando, T., Sullivan, B. K., Kirchman, M., et al. (2014). Ecological functions of zoosporic hyperparasites. Front. Microbiol. 5:244. doi: 10.3389/fmicb.2014.00244
Grattepanche, J. D., Breton, E., Brylinski, J. M., Lecuyer, E., and Christaki, U. (2011a). Succession of primary producers and micrograzers in a coastal system dominated by Phaeocystis globosa blooms. J. Plankton Res. 33, 37–50. doi: 10.1093/plankt/fbq097
Grattepanche, J. D., Vincent, D., Breton, E., and Christaki, U. (2011b). Phytoplankton growth and microzooplankton grazing during a spring bloom in the eastern English Channel. J. Exp. Mar. Biol. Ecol. 404, 87–97. doi: 10.1016/j.jembe.2011.04.004
Guillou, L., Bachar, D., Audic, S., Bass, D., Berney, C., Bittner, L., et al. (2013). The Protist Ribosomal Reference database (PR2): a catalog of unicellular eukaryote small sub-unit rRNA sequences with curated taxonomy. Nucleic Acids Res. 41, D597–D604. doi: 10.1093/nar/gks1160
Guillou, L., Viprey, M., Chambouvet, A., Welsh, R. M., Kirkham, A. R., Massana, R., et al. (2008). Widespread occurrence and genetic diversity of marine parasitoids belonging to Syndiniales (Alveolata). Environ. Microbiol. 10, 3349–3365. doi: 10.1111/j.1462-2920.2008.01731.x
Hamm, C. E., Simson, D. A., Merkel, R., and Smetacek, V. (1999). Colonies of Phaeocystis globosa are protected by a thin but tough skin. Mar. Ecol. Prog. Ser. 187, 101–111. doi: 10.3354/meps187101
Harada, A., Ohtsuka, S., and Horiguchi, T. (2007). Species of the parasitic genus Duboscquella are members of the enigmatic marine alveolate group, I. Protist 158, 337–347. doi: 10.1016/j.protis.2007.03.005
Hugoni, M., Taib, N., Debroas, D., Domaizon, I., Dufournel, I. J., Bronner, G., et al. (2013). Structure of the rare archaeal biosphere and seasonal dynamics of active ecotypes in surface coastal waters. Proc. Natl. Acad. Sci. U.S.A. 110, 6004–6009. doi: 10.1073/pnas.1216863110
Humphries, M. D., and Gurney, K. (2008). Network “small-world-ness”: a quantative method for determining canonical network equivalence. PLoS ONE 3:e0002051. doi: 10.1371/journal.pone.0002051
Kimura, H., and Naganuma, T. (2001). Thraustochytrids: a neglected agent of the marine microbial food chain. Aquat. Ecosyst. Health 4, 13–18. doi: 10.1080/146349801753569243
Klaveness, D., Shalchian-Tabrizi, K., Thomsen, H. A., Eikrem, W., and Jakobsen, K. S. (2005). Telonema antarcticum sp. nov., a common marine phagotrophic flagellate. Int. J. Syst. Evol. Micr. 55, 2595–2604. doi: 10.1099/ijs.0.63652-0
Kramarsky-Winter, E., Harel, M., Siboni, N., Ben Dov, E., Brickner, I., Loya, Y., et al. (2006). Identification of a protist-coral association and its possible ecological role. Mar. Ecol. Prog. Ser. 317, 67–73. doi: 10.3354/meps317067
Kunin, V., Engelbrektson, A., Ochman, H., and Hugenholtz, P. (2010). Wrinkles in the rare biosphere: pyrosequencing errors can lead to artificial inflation of diversity estimates. Environ. Microbiol. 12, 118–123. doi: 10.1111/j.1462-2920.2009.02051.x
Laferty, K. D., Allesina, S., Arim, M., Briggs, C. J., De Leo, G., Dobson, A. P., et al. (2008). Parasites in food webs: the ultimate missing links. Ecol. Lett. 11, 533–546. doi: 10.1111/j.1461-0248.2008.01174.x
Lefèvre, E., Roussel, B., Amblard, C., and Sime-Ngando, T. (2008). The molecular diversity of freshwater picoeukaryotes reveals high occurrence of putative parasites in the plankton. PLoS ONE 3:e2324. doi: 10.1371/journal.pone.0002324
Lesen, A. E., Juhl, A. R., and Anderson, O. R. (2010). Heterotrophic microplankton in the lower Hudson River Estuary: potential importance of naked, planktonic amebas for bacterivory and carbon flux. Aquat. Microb. Ecol. 61, 45–56. doi: 10.3354/ame01434
Lever, J. J., Van Nes, E. H., Scheffer, M., and Bascompte, J. (2014). The sudden collapse of pollinator communities. Ecol. Lett. 17, 350–359. doi: 10.1111/ele.12236
Logares, R., Audic, S., Bass, D., Bittner, L., Boutte, C., Christen, R., et al. (2014). Patterns of rare and abundant marine microbial eukaryotes. Curr. Biol. 24, 813–821. doi: 10.1016/j.cub.2014.02.050
López-García, P., and Moreira, D. (2008). Tracking microbial biodiversity through molecular and genomic ecology. Res. Microbiol. 159, 67–73. doi: 10.1016/j.resmic.2007.11.019
López-García, P., Philippe, H., Gail, F., and Moreira, D. (2003). Autochthonous eukaryotic diversity in hydrothermal sediment and experimental microcolonizers at the Mid-Atlantic Ridge. Proc. Natl. Acad. Sci. U.S.A. 100, 697–702. doi: 10.1073/pnas.0235779100
López-García, P., Rodríguez-Valera, F., Pedrós-Alió, C., and Moreira, D. (2001). Unexpected diversity of small eukaryotes in deep-sea Antarctic plankton. Nature 409, 603–607. doi: 10.1038/35054537
Lynn, D. (2008). The Ciliated Protozoa. Characterization, Classification and Guide to the Literature, 3rd Edn. New York, NY: Springer.
Manohar, C. S., and Raghukumar, C. (2013). Fungal diversity from various marine habitats deduced through culture-independent studies. FEMS Microbiol. Lett. 341, 69–78. doi: 10.1111/1574-6968.12087
Marshall, W. L., Celio, G., McLaughlin, D. J., and Berbee, M. L. (2008). Multiple isolations of a culturable, motile Ichthyosporean (Mesomycetozoa, Opisthokonta), Creolimax fragrantissima n. gen., n. sp., from marine invertebrate digestive tracts. Protist 159, 415–433. doi: 10.1016/j.protis.2008.03.003
Massana, R., Gobet, A., Audic, S., Bass, D., Bittner, L., Boutte, C., et al. (2015). Marine protest diversity in European coastal water and sediments as revealed by high-throughput sequencing. Environ. Microbiol. 10, 4035–4049. doi: 10.1111/1462-2920.12955
Massana, R., Terrado, R., Forn, I., Lovejoy, C., and Pedrós-Alió, C. (2006). Distribution and abundance of uncultured heterotrophic flagellates in the world oceans. Environ. Microbiol. 8, 1515–1522. doi: 10.1111/j.1462-2920.2006.01042.x
Monchy, S., Grattepance, J. D., Breton, E., Meloni, D., Sanciu, G., Chabé, M., et al. (2012). Microplanktonic community structure in a coastal system relative to a Phaeocystis bloom inferred from morphological and tag pyrosequencing methods. PLoS ONE 7:e39924. doi: 10.1371/journal.pone.0039924
Montoya, J. M., Pimm, S. L., and Solé, R. V. (2006). Ecological networks and their fragility. Nature 442, 259–264. doi: 10.1038/nature04927
Myklestad, S. M. (1995). Release of extracellular products by phytoplankton with special emphasis on polysaccharides. Sci. Total Environ. 165, 155–164. doi: 10.1016/0048-9697(95)04549-G
Niquil, N., Kagami, M., Urabe, J., Christaki, U., Viscogliosi, E., and Sime-Ngando, T. (2011). Potential role of fungi in plankton food web functioning and stability: a simulation analysis based on Lake Biwa inverse model. Hydrobiologia 659, 65–79. doi: 10.1007/s10750-010-0308-6
Not, F., Gausling, R., Azam, F., Heidelberg, J. F., and Worden, A. Z. (2007). Vertical distribution of picoeukaryotic diversity in the Sargasso Sea. Environ. Microbiol. 9, 1233–1252. doi: 10.1111/j.1462-2920.2007.01247.x
Not, F., Siano, R., Kooistra, W. H. C. F., Simon, N., Vaulot, D., and Probert, I. (2012). Diversity and ecology of eukaryotic marine phytoplankton. Adv. Bot. Res. 64, 1–53. doi: 10.1016/B978-0-12-391499-6.00001-3
Park, M. G., Yih, W., and Coats, D. W. (2004). Parasites and phytoplankton, with special emphasis on dinoflagellate infections. J. Eukaryot. Microbiol. 51, 145–155. doi: 10.1111/j.1550-7408.2004.tb00539.x
Peperzak, L., Colijn, F., Gieskes, W. W. C., and Peeters, J. C. H. (1998). Development of the diatom – Phaeocystis spring bloom in the Dutch coastal zone of the North Sea: the silicon depletion versus the daily irradiance threshold hypothesis. J. Plankton Res. 20, 517–537. doi: 10.1093/plankt/20.3.517
Pirreda, R., Tomasino, M. P., D'Erchia, A. M., Manzari, C., Pesole, G., Montresor, M., et al. (2016). Diversity and temporal patterns of planktonic protist assemblages at a Mediterranean long term ecological research site. FEMS Microbiol. Ecol. 93:fiw200. doi: 10.1093/femsec/fiw200
Quince, C., Lanzén, A., Curtis, T. P., Davenport, R. J., Hall, N., Head, I. M., et al. (2009). Accurate determination of microbial diversity from 454 pyrosequencing data. Nat. Methods 6, 639–641. doi: 10.1038/nmeth.1361
Raghukumar, S. (2002). Ecology of the marine protists, the Labyrinthulomycetes (Thraustochytrids and Labyrinthulids). Eur. J. Protistol. 38, 127–145. doi: 10.1078/0932-4739-00832
Reshef, D. N., Reshef, Y. A., Finucane, H. K., Grossman, S. R., McVean, G., Turnbaugh, P. J., et al. (2011). Detecting novel associations in large data sets. Science 334, 1518–1524. doi: 10.1126/science.1205438
Rousseau, V., Vaulot, D., Casotti, R., Cariou, V., Lenz, J., Gunkel, J., et al. (1994). The life cycle of Phaeocystis (Prymnesiophyceae): evidence and hypotheses. J. Marine Syst. 5, 23–39. doi: 10.1016/0924-7963(94)90014-0
Ruan, Q., Dutta, D., Schwalbach, M. S., Steele, J. A., Fuhrman, J. A., and Sun, F. (2006). Local similarity analysis reveals unique associations among marine bacterioplankton species and environmental factors. Bioinformatics 22, 2532–2538. doi: 10.1093/bioinformatics/btl417
Santoferrara, L. F., Grattepanche, J. D., Katz, L. A., and McManus, G. B. (2014). Pyrosequencing for assessing diversity of eukaryotic microbes: analysis of data on marine planktonic ciliates and comparison with traditional methods. Environ. Microbiol. 16, 2752–2763. doi: 10.1111/1462-2920.12380
Schapira, M., Vincent, D., Gentilhomme, V., and Seuront, L. (2008). Temporal patterns of phytoplankton assemblages, size spectra and diversity during the wane of a Phaeocystis globosa spring bloom in hydrologically contrasted coastal waters. J. Mar. Biol. Assoc. U.K. 88, 649–662. doi: 10.1017/S0025315408001306
Scheckenbach, F., Wylezich, C., Mylnikov, A. P., Weitere, M., and Arndt, H. (2006). Molecular comparisons of freshwater and marine isolates of the same morphospecies of heterotrophic flagellates. Appl. Environ. Microb. 72, 6638–6643. doi: 10.1128/AEM.02547-05
Schloss, P. D., Gevers, D., and Westcott, S. L. (2011). Reducing the effects of PCR amplification and sequencing artifacts on 16S rRNA-based studies. PLoS ONE 6:e27310. doi: 10.1371/journal.pone.0027310
Schloss, P. D., Westcott, S. L., Ryabin, T., Hall, J. R., Hartmann, M., Hollister, E. B., et al. (2009). Introducing mothur: open-source, platform-independent, community-supported software for describing and comparing microbial communities. Appl. Environ. Microbiol. 75, 7537–7541. doi: 10.1128/AEM.01541-09
Schnepf, E., and Kühn, S. F. (2000). Food uptake and fine structure of Cryothecomonas longipes sp. nov., a marine nanoflagellate incertae sedis feeding phagotrophically on large diatoms. Helgol. Mar. Res. 54, 18–32. doi: 10.1007/s101520050032
Scholz, B., Guillou, L., Marano, A. V., Neuhauser, S., Sullivan, B. K., Karsten, U., Küpper, F. C., et al. (2016). Zoosporic parasites infecting marine diatoms – A black box that needs to be opened. Fungal Ecol. 19, 59–76. doi: 10.1016/j.funeco.2015.09.002
Sherr, E. B., and Sherr, B. F. (2007). Heterotrophic dinoflagellates: a significant component of microzooplankton biomass and major grazers of diatoms in the sea. Mar. Ecol. Prog. Ser. 352, 187–197. doi: 10.3354/meps07161
Skovgaard, A. (2014). Dirty tricks in the plankton: diversity and role of marine parasitic protists. Acta Protozool. 20, 130–134. doi: 10.4467/16890027AP.14.006.1443
Skovgaard, A., Massana, R., Balague, V., and Saiz, E. (2005). Phylogenetic position of the copepod-infesting parasite Syndinium turbo (Dinoflagellata, Syndinea). Protist 156, 413–423. doi: 10.1016/j.protis.2005.08.002
Smoot, M. E., Ono, K., Ruscheinski, J., Wang, P. L., and Ideker, T. (2011). Cytoscape 2.8: new features for data integration and network visualization. Bioinformatics 27, 431–432. doi: 10.1093/bioinformatics/btq675
Steele, J. A., Countway, P. D., Xia, L., Vigil, P. D., Beman, J. M., Kim, D. Y., et al. (2011). Marine bacterial, archaeal and protistan association networks reveal ecological linkages. ISME J. 5, 1414–1425. doi: 10.1038/ismej.2011.24
Stoecker, D. K. (1999). Mixotrophy among Dinoflagellates. J. Eukaryot. Microbiol. 46, 397–401. doi: 10.1111/j.1550-7408.1999.tb04619.x
Stoeck, T., Bass, D., Nebel, M., Christen, R., Jones, M. D. M., Breiner, H.-W., et al. (2010). Multiple marker parallel tag environmental DNA sequencing reveals a highly complex eukaryotic community in marine anoxic water. Mol. Ecol. 19, 21–31. doi: 10.1111/j.1365-294X.2009.04480.x
Strickland, J., and Parsons, T. A. (1972). A Practical Handbook of Seawater Analysis. Ottawa, ON: Fisheries Research Board of Canada.
Tillmann, U., Hesse, K. J., and Tillmann, A. (1999). Large-scale parasitic infection of diatoms in the Northfrisian Wadden Sea. J. Sea Res. 42, 255–261. doi: 10.1016/S1385-1101(99)00029-5
Tosadori, G., Bestvina, I., Spoto, F., Laudanna, C., and Scardoni, G. (2016). Creating, generating and comparing random network models with Network Randomizer. F1000Res. 5:2524. doi: 10.12688/f1000research.9203.1
Watts, D. J., and Strogatz, S. H. (1998). Collective dynamics of “small-world” networks. Nature 393, 440–442.
Weiss, S., Van Treuren, W., Lozupone, C., Faust, K., Friedman, J., Deng, Y., et al. (2016). Correlation detection strategies in microbial data sets vary widely in sensitivity and precision. ISME J. 10, 1669–1681. doi: 10.1038/ismej.2015.235
Windsor, D. A. (1998). Controversies in parasitology, most of the species on earth are parasites. Int. J. Parasitol. 28, 1939–1941. doi: 10.1016/S0020-7519(98)00153-2
Xia, L. C., Ai, D., Cram, J., Fuhrman, J. A., and Sun, F. (2012). Efficient statistical significance approximation for local similarity analysis of high-throughput time series data. Bioinformatics 29, 230–237. doi: 10.1093/bioinformatics/bts668
Keywords: unicellular eukaryotes, 18S rRNA gene, Phaeocystis, MALV, coastal waters, network, local similarity analysis
Citation: Christaki U, Genitsaris S, Monchy S, Li LL, Rachik S, Breton E and Sime-Ngando T (2017) Parasitic Eukaryotes in a Meso-Eutrophic Coastal System with Marked Phaeocystis globosa Blooms. Front. Mar. Sci. 4:416. doi: 10.3389/fmars.2017.00416
Received: 02 July 2017; Accepted: 04 December 2017;
Published: 19 December 2017.
Edited by:
Hongyue Dang, Xiamen University, ChinaReviewed by:
Esther Garcés, Consejo Superior de Investigaciones Científicas (CSIC), SpainPeter David Roopnarine, California Academy of Sciences, United States
Toshi Nagata, The University of Tokyo, Japan
Copyright © 2017 Christaki, Genitsaris, Monchy, Li, Rachik, Breton and Sime-Ngando. This is an open-access article distributed under the terms of the Creative Commons Attribution License (CC BY). The use, distribution or reproduction in other forums is permitted, provided the original author(s) or licensor are credited and that the original publication in this journal is cited, in accordance with accepted academic practice. No use, distribution or reproduction is permitted which does not comply with these terms.
*Correspondence: Urania Christaki, urania.christaki@log.cnrs.fr
†These authors have contributed equally to this work.