Sensitive Determination of the Dissolved Phosphate Pool for an Improved Resolution of Its Vertical Variability in the Surface Layer: New Views in the P-Depleted Mediterranean Sea
 Kahina Djaoudi1*
  France Van Wambeke1
  Laurent Coppola2
  Fabrizio D'Ortenzio2 Sandra Helias-Nunige1
  Patrick Raimbault1
  Vincent Taillandier2
  Pierre Testor3 Thibaut Wagener1
  Elvira Pulido-Villena1
- 1Aix-Marseille Univ., Université de Toulon, Centre National de la Recherche Scientifique, IRD, MIO UM 110, Marseille, France
- 2Sorbonne Université, CNRS, Laboratoire d'Océanographie de Villefanche, LOV, Villefranche-sur-mer, France
- 3Sorbonne Université, UPMC, Université Paris 06, Centre National de la Recherche Scientifique, IRD, MNH, Laboratoire d'Océanographie et de Climatologie, IPSL, Paris, France
An accurate understanding of the biogeochemistry of dissolved phosphate pool in the upper waters of P-depleted oceanic regions is constrained by the low sensitivity of routine phosphate measurements. In this study, by using the sensitive Liquid Waveguide Capillary Cell method, we report the first extensive cross-basin survey of nanomolar dissolved inorganic phosphate (DIP) and dissolved organic phosphate (DOP) concentration in P-depleted surface waters of the Mediterranean Sea during the stratification period. In the north western Mediterranean Sea (NWMS), DIP above the mixed layer depth (MLD) ranged between 4.9 and 26.5 nM. Along an E-W transect crossing Ionian and Tyrrhenian Seas (E-W transect), DIP above the MLD was lower, ranging between 0.9 and 11.4 nM. Contrarily to the traditional view of a depleted and invariant surface dissolved phosphate pool, a significant vertical variability of DIP and DOP was revealed in upper waters. A positive gradient of DIP was observed above the phosphacline, between the MLD and the deep chlorophyll maximum (DCM) depth, suggesting a potential diffusion of new phosphate to near-surface waters, even under stratified conditions. Interestingly, despite this apparent DIP availability, a significant negative gradient of DOP concentration was observed in the same layer. Finally, the positive gradient in DIP coincided with a significant increase in N:P ratio, suggesting a higher rate of increase of N than of P. The results obtained in this study indicate that acquiring nanomolar DIP data is a sine qua non condition for the comprehension and prediction of the biogeochemical functioning of P-depleted oceanic regions, such as the Mediterranean Sea.
Introduction
Nitrogen (N) and phosphorus (P) are essential macronutrients for sustaining marine organisms (Redfield, 1958). By controlling the efficiency of the biological pump, N and P determine the strength of the oceanic carbon uptake (Balino et al., 2001). Over the vast oligotrophic ocean, upper waters are often subjected to N and P exhaustion due to a strong vertical stratification and an active drawdown by biological activity (Tyrrell, 1999). N has traditionally been viewed as the limiting nutrient of primary production in marine waters (Ryther and Dunstan, 1971). However, with an increased understanding of the N cycling in the ocean, there is a growing awareness that P has also the potential to limit primary production in certain regions of the oligotrophic ocean (i.e., Wu et al., 2000; Moutin et al., 2008; Lomas et al., 2010). The Redfield N:P ratio of 16:1 has been considered as a fundamental tenet in marine biogeochemistry. Deviations from this canonical ratio have been used to provide insights, for instance, on the efficiency of carbon sequestration in the ocean (Sigman and Boyle, 2000), or on nutrient limitation of primary production (i.e., Falkowski and Raven, 1997; Moore et al., 2013). In some oligotrophic regions, such as the North Atlantic subtropical gyre, N:P ratios in near-surface waters are higher than 16:1, suggesting a depletion of P before that of N (Wu et al., 2000; Ammerman et al., 2003).
In such P-depleted oligotrophic regions, the quantification of dissolved inorganic phosphate (DIP) is a challenging task because concentrations drop to nanomolar (nM) levels, so unquantifiable using the conventional automated colorimetric procedure (CACP) which presents a limit of detection (LOD) of 20 nM, at best cases. Alternative analytical procedures have been introduced to improve the LOD and precision of DIP analysis (see review by Patey et al., 2008). The pre-concentration by magnesium-induced co-precipitation (MAGIC) method substantially improved the amount of DIP data at nM levels (Karl and Tien, 1992; Rimmelin and Moutin, 2005). During the last decade, the Liquid Waveguide Capillary Cell (LWCC) method, have gained a foothold as a reliable method for nM DIP measurements (i.e., Zhang and Chi, 2002; Patey et al., 2008). By using these high sensitive methods, studies in both the North Pacific (Karl et al., 2001 and references therein; Suzumura et al., 2012; Hashihama et al., 2013) and North Atlantic (Ammerman et al., 2003; Lomas et al., 2010) subtropical gyres have revealed DIP concentrations as low as 0.2 nM (Wu et al., 2000). Moreover, since the determination of dissolved organic phosphate (DOP) relies upon DIP measurements, some of the above cited studies have also provided accurate DOP data (i.e., Mather et al., 2008; Suzumura et al., 2012), crucially enhancing our knowledge on the biogeochemical functioning of P-depleted oceanic regions, where DOP represents a P source for sustaining community productivity (Karl and Björkman, 2015 and references therein; Sato et al., 2013).
The Mediterranean Sea is one of the world's most oligotrophic oceanic regions. It is divided into two sub-basins, western and eastern, exhibiting distinct hydrodynamics and biogeochemical features. The Mediterranean Sea exhibits low nutrient concentrations, with a west to east decreasing gradient (Krom et al., 1991; Moutin and Raimbault, 2002; De Madron et al., 2011), partly linked to its anti-estuarine thermohaline circulation (Crispi et al., 2001). Available nutrients in the Atlantic surface inflow entering the Mediterranean Sea are consumed along the way to the eastern basin and exported to deep waters (Crise et al., 1999; Lazzari et al., 2012). Consequently, the western Mediterranean basin is oligotrophic while the eastern basin is ultraoligotrophic (Moutin and Raimbault, 2002).
In the Mediterranean surface waters, DIP concentration has been shown to limit primary production, nitrogen fixation and heterotrophic bacterial activity (Van Wambeke et al., 2002; Thingstad et al., 2005). These findings are supported by low DIP concentrations measured in upper waters and a deep N:P ratio which diverges greatly from the canonical Redfield ratio, with values ranging between 21 and 23 in the Western basin (Bethoux et al., 1992) and even higher in the Eastern basin (Krom et al., 1991). Surface DIP concentration in surface waters is systematically below 20 nM (LOD of the CACP) during the stratification period, dramatically constraining data coverage in this oceanic region (i.e., Pujo-Pay et al., 2011; Céa et al., 2015). The depth at which DIP concentration becomes measurable by the CACP is usually used to define the phosphacline and it has been reported to be between 45 m and 120 m, during the stratified period, in the western and eastern Mediterranean Sea, respectively (Moutin and Raimbault, 2002). To date, lack of DIP data above this phosphacline has precluded resolving vertical variability in this key layer as has led to the traditional view of an entirely depleted and invariant dissolved phosphate surface pool. Few studies, however, by using sensitive determination of DIP, have reported low but detectable increases in nanomolar DIP concentration above the phosphacline adding evidence against this traditional view (Van Wambeke et al., 2002; Krom et al., 2005; Djaoudi et al., 2017). Nevertheless, the scarcity and the sparse nature of available nM DIP data in the Mediterranean Sea still precludes a complete assessment of DIP dynamics in the upper waters at the basin scale.
As for DIP, a critical gap in accurate DOP data (i.e., based on nanomolar DIP measurements) persists in the upper waters of the Mediterranean Sea (Moutin and Raimbault, 2002; Pujo-Pay et al., 2011). Indeed, only two studies have reported nanomolar DIP and DOP data simultaneously (Krom et al., 2005; Djaoudi et al., 2017). In the Mediterranean Sea, when DIP is exhausted, DOP becomes a possible alternative source of P as confirmed by high activities of alkaline phosphatase suggesting an active utilization of the DOP pool in upper waters (Van Wambeke et al., 2002, 2009; Thingstad and Mantoura, 2005). How and to which extent such biogeochemical dynamics induce changes in DOP concentration above the phosphacline remains unknown.
In this study, we conducted cross-basin observations of nM DIP and DOP concentration in the Mediterranean Sea with emphasis on upper waters. The main goals of this work are: (1) to extend the nM dataset of accurate paired DIP/DOP data in the upper Mediterranean Sea under stratification conditions, (2) to examine the vertical variability of both DIP and DOP above the phosphacline, under stratification conditions and, (3) to better resolve the DIN:DIP and DON:DOP ratios in the upper waters of this P-depleted oceanic region.
Materials and Methods
Study Area and Sampling
This study was performed in the framework of two research cruises carried out in 2015 in the Mediterranean Sea, during the stratification period, MOOSE-GE (doi.org/10.18142/235) and BioArgomed (doi.org/10.17882/51678) (Figure 1).
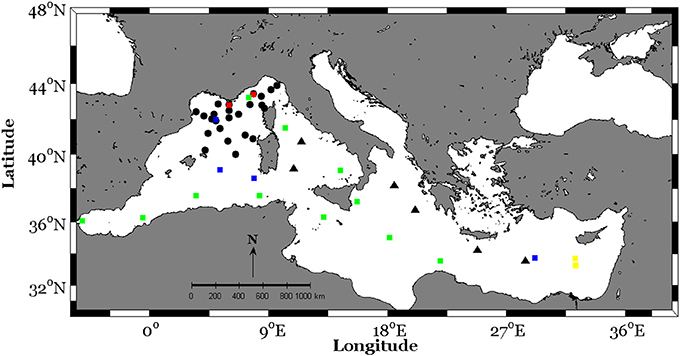
Figure 1. Station locations in the North Western Mediterranean Sea (MOOSE-GE cruise, black circles) and along an E-W transect crossing Ionian and Tyrrhenian seas (BioArgomed cruise, black triangles). The squares represent sampling stations from published studies reporting nanomolar dissolved inorganic phosphate in the Mediterranean Sea (green squares: PROSOPE cruise, 1999; blue squares: BOUM cruise, 2008; red squares: MOOSE-ANTARES and MOOSE-DYFAMED fixed stations, see Table 1 for references).
The MOOSE-GE (Mediterranean Ocean Observing System for the Environment– Grande Échelle) cruise took place on board the R/V Le Suroit between 10 and 26 July in the oligotrophic North Western Mediterranean Sea (NWMS). The BioArgoMed cruise took place on board the R/V Tethys II between 13 May and 03 June along an east to west transect (E-W transect) crossing the ultraoligotrophic Ionian and Tyrrhenian Seas. Therefore, these cruises covered the two Mediterranean sub-basins, western and eastern, which exhibit distinct hydrological and biogeochemical features (i.e., De Madron et al., 2011).
During the two cruises, oceanographic casts were acquired using a conductivity-temperature-depth profiling system (SBE911 + CTD unit). The density profiles were calculated from temperature and salinity profiles, and linearly interpolated at 1 m depth intervals. Fluorescence profiles were provided by a Chelsea Aquatracka 3 fluorimeter interfaced with the CTD unit.
Seawater samples were collected during up casts with a carousel of Niskin bottles for analyses of dissolved phosphate (dissolved inorganic phosphate, DIP; total dissolved phosphate, TDP) and dissolved nitrogen (dissolved inorganic nitrogen, DIN; total dissolved nitrogen, TDN). In the present study, DIN includes nitrate + nitrite concentration and does not include ammonium. Pujo-Pay et al. (2011) reported concentrations in the Mediterranean Sea between 0 and 10 nM, indicating that DIN data reported in this study can suffer from up to 10 nM underestimation.
Samples were collected in duplicate and filtered on board through a pre-cleaned (500 mL of ultrapure water) 0.2 μm syringe filter. Samples were then disposed into acid washed HDPE-60 mL bottles and were stored frozen (−20°C) until analysis. To check for potential N and P contamination through filtration, DIP and DIN concentration were analyzed on ultrapure water filtered the same way as samples. DIN concentration in such blanks was below the limit of detection. DIP concentrations in the blanks was 2.8 ± 0.6 nM (n = 5), not significantly different from the reagent blanks (2.2 ± 0.3 nM, n = 5).
During the MOOSE-GE cruise, seawater samples were collected at 25 stations (Figure 1), between the surface and 100 m at 4 different depths. Sampling depths were chosen according to the density and fluorescence depth profiles. Density profiles were used to determine the depth of the mixed layer, in which a sampling point was defined (depth 1, Figure 2). From the fluorescence depth profiles, which exhibited the characteristic subsurface maximum (deep chlorophyll maximum, DCM) reported for the western Mediterranean Sea during the stratification period (Lavigne et al., 2015), 3 sampling points were defined: one point at the DCM (depth 3, Figure 2) and two points above and below the DCM (depths 2 and 4, Figure 2). During the BioArgoMed cruise, seawater samples were collected from 6 stations (Figure 1) at 6 different depths between the surface and 120 m.
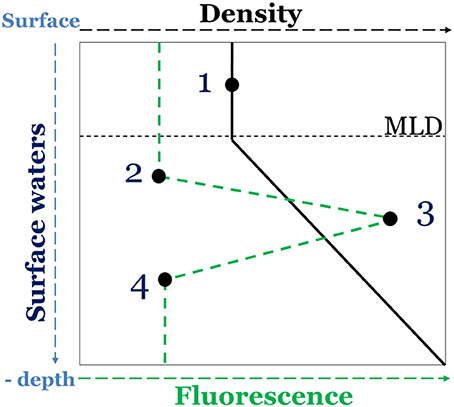
Figure 2. Schematic representation of the sampling depth determination in the North Western Mediterranean Sea, based on density (black plot) and fluorescence (dashed green plot) depth profiles.
Dissolved Nutrient Analysis
DIP concentration was determined by using both the CACP (Aminot and Kérouel, 2007) and the LWCC method (Zhang and Chi, 2002). Both spectrophotometric methods are based on the molybdenum blue reaction, described by Murphy and Riley (1962). In the LWCC method, according to the Beer-Lambert law, the sensitivity of the spectrophotometric measurement is improved by increasing the optical path length of the measurement cell from 1 cm (CACP) to 2.5 m (LWCC). The LOD, estimated as three times the standard deviation of ten measurements of the blank, was 20 and 0.8 nM for the CACP and the LWCC method, respectively. For the LWCC method, the linearity of absorbance vs. DIP concentration was assessed, and the dynamic range was determined to be between 0.8 and 143 nM. Therefore, for DIP concentrations above such range, the DIP value provided by the CACP was used. Between 20 and 143 nM (range of concentrations for which both methods are comparable), the relationship between the two methods followed a linear model (r = 0.96; n = 80) with a slope of 1.14 ± 0.04, not significantly different from 1 (p > 0.05).
Total dissolved phosphate (TDP) concentration was analyzed by using the CACP after sample processing by the wet oxidation method (Valderrama, 1981). DOP concentrations were then estimated by subtracting nM LWCC-DIP from TDP concentrations, with an analytical precision of 7%.
Dissolved inorganic nitrogen (DIN) and total dissolved nitrogen (TDN) concentrations were measured by using the CACP with a LOD of 50 nM. As for TDP, samples for TDN were processed according to the wet oxidation method (Valderrama, 1981). Dissolved organic nitrogen (DON) concentrations were then estimated by subtracting DIN from TDN concentrations.
Data Treatment and Calculations
The mixed layer depth (MLD) was estimated from the density profiles as the depth where the difference of density from the surface reference (i.e., density at 10 m depth) was 0.03 kg m−3 (De Boyer Montégut, 2004).
The depth of the phosphacline was calculated as the average of 4 phosphacline depth values determined based on 4 different reported criteria following Van Wambeke et al. (2009). Phosphacline1 and phosphacline2 were calculated as the shallowest depths in which DIP concentrations exceeded the mixed layer value by 10 and 50 nM, respectively (Van Wambeke et al., 2009); phosphacline3 and Phosphacline4 were calculated as the depths in which DIP concentrations exceeded the concentration at the immediate previous depths by 20 and 100 nM, respectively (Van Wambeke et al., 2009; Pujo-Pay et al., 2011).
The Wilcoxon signed-rank test was used to assess the overall significance of the vertical differences in DIP and DOP concentration for each cruise. For each individual profile, vertical differences in DIP and DOP concentration where considered significant when they were higher than the LOD and precision of the analytical methods.
Results
Over the study area and for both cruises, a stratification of the water column was observed. The MLD ranged between 6 and 30 m with an average of 13 ± 5 m (n = 25) during the MOOSE-GE cruise (hereafter, NWMS: for NW Mediterranean Sea) and between 14 and 20 m with an average of 17 ± 3 m (n = 6) during the BioArgoMed cruise (hereafter, E-W transect) (Figure 3). The phosphacline depth in the NWMS ranged between 30 and 89 m with an average of 56 ± 14 m for 21 stations and was higher than 100 m for the remaining 4 stations (Figure 3). Along the E-W transect, the phosphacline depths were higher than 120 m (maximum sampled depth) except for one value at 70 m (Figure 3).
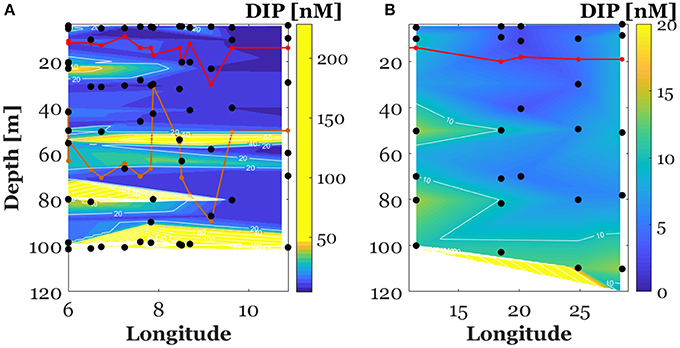
Figure 3. Vertical section of dissolved inorganic phosphate concentrations (DIP) in the North Western Mediterranean Sea (between the surface and 100 m, A) and along the E-W transect crossing Ionian and Tyrrhenian seas (between the surface and 120 m, B). The red plot represents the mixed layer depth. The orange plot represents the phosphacline depth. Note that the scale of the color bar has been tightened to point out the positive gradient of DIP in the North Western Mediterranean Sea.
Dissolved Phosphate Pools
By using the LWCC, all DIP concentrations in the upper waters of the Mediterranean Sea obtained in this study were above the LOD of 0.8 nM. Compared to the CACP, the sensitive LWCC method resulted in a 75% increase of valid DIP data and therefore of DOP data in the study area.
Surface (0–100 m) DIP concentration in the NWMS ranged over two orders of magnitude, between 3.6 and 251 nM (Figure 3A). Surface (0–120 m) DIP concentrations along the E-W transect were lower, ranging between 0.9 and 14.6 nM except for one single value at 127.5 nM (Figure 3B). DIP concentrations above the MLD ranged between 4.9 and 26.5 with an average of 12.8 ± 6.8 (n = 28) in the NWMS (Figure 3A) and between 0.9 and 11.4 nM with an average of 5.5 ± 3.6 nM (n = 11) along the E-W transect (Figure 3B).
Concerning vertical variability, DIP concentration in the NWMS exhibited a first significant increase between the MLD and the DCM depth (Wilcoxon signed-ranks test, Z = 3.2, p < 0.01, n = 25) (Figure 4). It then increased more sharply between the DCM depth and 100 m (Wilcoxon signed-ranked test, Z = 4.0, p < 0.001, n = 25) (Figure 4). In order to get a deeper insight on the observed DIP vertical variability, a gradient of DIP was calculated by dividing the difference in DIP concentration by the corresponding difference in depth. In the NWMS, the first DIP positive gradient (between the MLD and the DCM depth) was recorded in 21 out of 25 of the sampling stations (Figure S1) and ranged between 0.04 and 3.2 nM m−1 with an average of 0.4 ± 0.7 nM m−1. The second positive gradient (between the DCM depth and 100 m) was recorded in 21 out of 25 of the sampling stations (Figure S1) and ranged between 0.03 and 5.7 nM m−1 with an average of 2.6 ± 1.6 nM m−1.
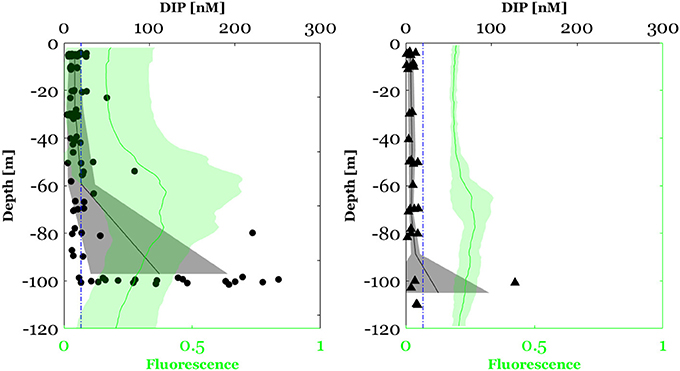
Figure 4. Dissolved inorganic phosphate (DIP) concentration between the surface and 100 m in the North Western Mediterranean Sea (circles) and between the surface and 120 m along the E-W transect crossing Ionian and Tyrrhenian seas (triangles). The black plot represents the mean profile of DIP concentration and the bounded line the standard deviation from the mean. The blue dashed line corresponds to the limit of detection (LOD) of the conventional automated colorimetric procedure (20 nM). The green plot represents the fluorescence profile (mean ± standard of deviation).
Likewise, along the E-W transect, a significant increase in DIP concentration was observed between the MLD and the DCM depth (Wilcoxon signed-ranks test, Z = 2.2, p < 0.05, n = 6) (Figure 4). This DIP positive gradient was recorded for all stations and ranged between 0.01 and 0.08 nM m−1 with an average of 0.04 ± 0.03 nM m−1 (Figure S1). Because in the E-W transect the maximum sampling depth was above the phosphacline, the second increase in DIP concentration below the DCM was not observed.
Surface DOP concentration in the NWMS ranged between 4 and 149 nM with an average of 44 ± 25 nM (n = 100) (Figure 5A). As for DIP, DOP concentrations were lower along the E-W transect, ranging between 15 and 64 nM with an average of 33 ± 12 nM (n = 36) (Figure 5B). DOP concentration above the MLD ranged between 17 and 139 nM with an average of 47 ± 36 (n = 28) in the NWMS (Figure 5A) and between 20 and 62 nM with an average of 35 ± 11 nM (n = 11) along the E-W transect (Figure 5B).
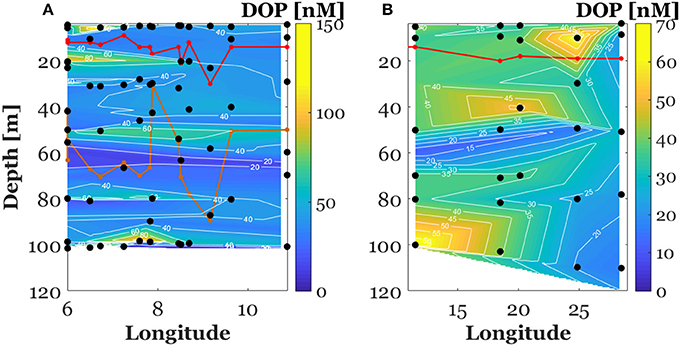
Figure 5. Vertical section of dissolved organic phosphate concentrations (DOP) in the North Western Mediterranean Sea (between the surface and 100 m, A) and along the E-W transect crossing Ionian and Tyrrhenian seas (between the surface and 120 m, B). The red plot represents the mixed layer depth. The orange plot represents the phosphacline depth. Note that the scale of the color bar has been tightened to point out the negative gradient of DOP in the North Western Mediterranean Sea.
Concerning the vertical variability, DOP concentration in the NWMS exhibited a significant decrease between the MLD and the DCM (Wilcoxon signed-ranks test, Z = 2.1, p < 0.05, n = 25) (Figure 6). As for DIP, a DOP gradient between the MLD and the DCM was calculated by dividing the difference in DOP concentration by the corresponding difference in depth. The negative gradient of DOP in this layer was recorded in 15 out of 25 of the sampling stations (Figure S2) and ranged between 0.05 and 2.7 nM m−1 with an average value of 0.6 ± 0.7 nM m−1.
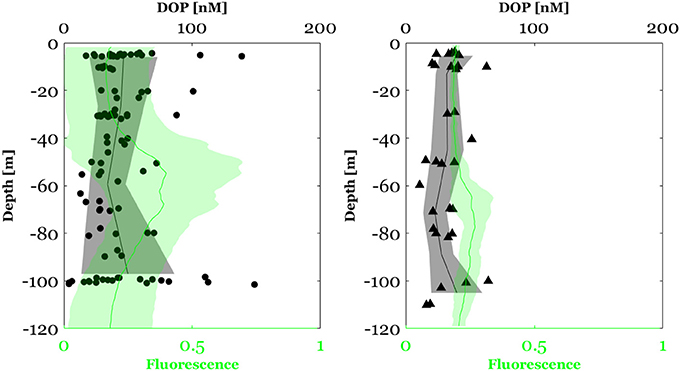
Figure 6. Dissolved organic phosphate (DOP) concentration in the North Western Mediterranean Sea (circles) and Along the E-W transect crossing Ionian and Tyrrhenian seas (triangles). The black plot represents the mean depth profile of DOP concentrations and the bounded line the deviation from the mean. The green plot represents the fluorescence profile (mean ± standard of deviation).
Along the E-W transect, no significant difference in DOP concentration was observed between the MLD and the DCM depth (Wilcoxon signed-ranks test, Z = 0.94, p > 0.05, n = 6).
N:P Molar Ratios in the Upper Mediterranean Sea
In the NWMS, surface (0–100 m) DIN:DIP ratios ranged between 2 and 165 (Figure 7) and DON:DOP ratios ranged between 55 and 525 (Figure 8). Above the mixed layer depth, DIN:DIP ratios ranged between 1 and 65 with an average of 20 ± 19 and DON:DOP ratios between 113 and 312 with an average of 182 ± 55. Along the E-W transect, 50% of DIN data were below the LOD of the CACP. When DIN data were available, the surface (0–120 m) DIN:DIP ratios in this area ranged between 10 and 289 (Figure 7) and DON:DOP ratios ranged between 67 and 252 (Figure 8). Along the E-W transect, DIN:DIP and DON:DOP molar ratios have not been calculated above the MLD due to insufficient valid DIN data.
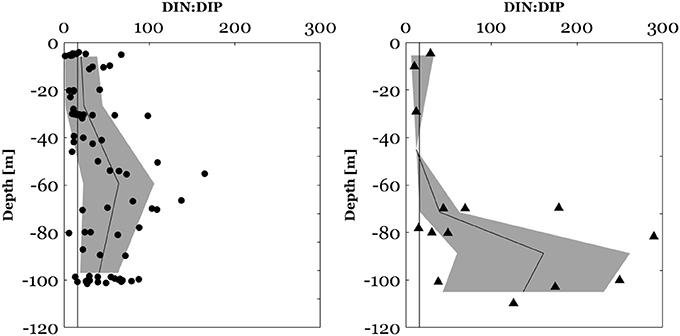
Figure 7. DIN:DIP molar ratios between the surface and 100 m in the NWMS (circles) and DIN:DIP ratios between the surface and 120 m along the E-W transect (triangles). The black plot represents the mean depth profile of the DIN:DIP ratio, the bounded line the standard deviation from the mean and the dark vertical line the Redfield molar ratio of 16:1.
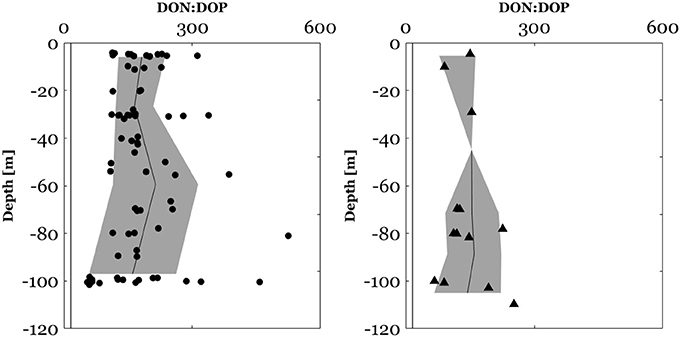
Figure 8. DON:DOP ratios between the surface and 100 m in the North Western Mediterranean Sea (circles). DON:DOP molar ratios between the surface and 120 m along the E-W transect (triangles) crossing Ionian and Tyrrhenian seas. The black plot represents the mean depth profile of the DON:DOP ratio, the bounded line the standard deviation from the mean and the black vertical line the Redfield molar ratio of 16:1.
Regarding vertical profiles, in the NWMS, there was a significant increase of DIN:DIP (Wilcoxon signed-ranks test, z = 3.4, p < 0.001, n = 19) and of DON:DOP ratios (Wilcoxon signed-ranks test, z = 2.4, p < 0.05, n = 17), between the MLD and the DCM (Figures 7, 8). The increase in the DIN:DIP ratio was observed for 15 out of 19 stations (Figure S3) and ranged between 0.2 and 5.7 m−1. The increase in the DON:DOP ratio within this layer was observed for 12 out of 17 stations (Figure S4) and ranged between 0.2 and 9.3 m−1. Along the E-W transect, no assessment of the vertical variability of N:P ratios was made due to insufficient valid DIN data.
Discussion
In the Mediterranean Sea, the existent dataset of nM measurements of DIP at both spatial and temporal scales is severely scarce. The few reported nM concentrations of DIP are limited to two cross-basin cruises (PROSOPE cruise in 1999, Moutin et al., 2002: 7 values reported; Van Wambeke et al., 2002: 2 profiles reported and BOUM cruise in 2008: Talarmin et al., 2015, 5 profiles reported) and data acquired as part of the CYCLOPS project in the eastern basin of the Mediterranean Sea (Krom et al., 2005, 3 profiles reported). Two additional studies reported 1-year time series of surface nM DIP in the NW Mediterranean Sea at fixed observation stations: DYFAMED (Pulido-Villena et al., 2010) and ANTARES (Djaoudi et al., 2017). By reporting an important amount of vertical profiles along a longitudinal gradient, the present study is the first to extensively address the distribution of nM DIP in the P-depleted Mediterranean surface waters.
The nM DIP data obtained in this study are within the range reported in the above cited few previous studies, despite the use of different methods of analysis (Table 1). Regarding the longitudinal pattern of nM DIP, as previously reported by Moutin et al. (2002) for bioavailable DIP concentration in the upper layer (between 10 and 15 m), the present study shows a decreasing trend toward the East within the mixed layer with lower concentrations along the E-W transect (5.5 ± 3.6 nM) compared to the NWMS (12.8 ± 6.8 nM). This longitudinal gradient extends below the mixed layer (between the surface and 100 m), in contrast to Talarmin et al. (2015) study in which DIP concentrations (between the surface and 130 m) did not show any clear longitudinal trend crossing a W-E transect.
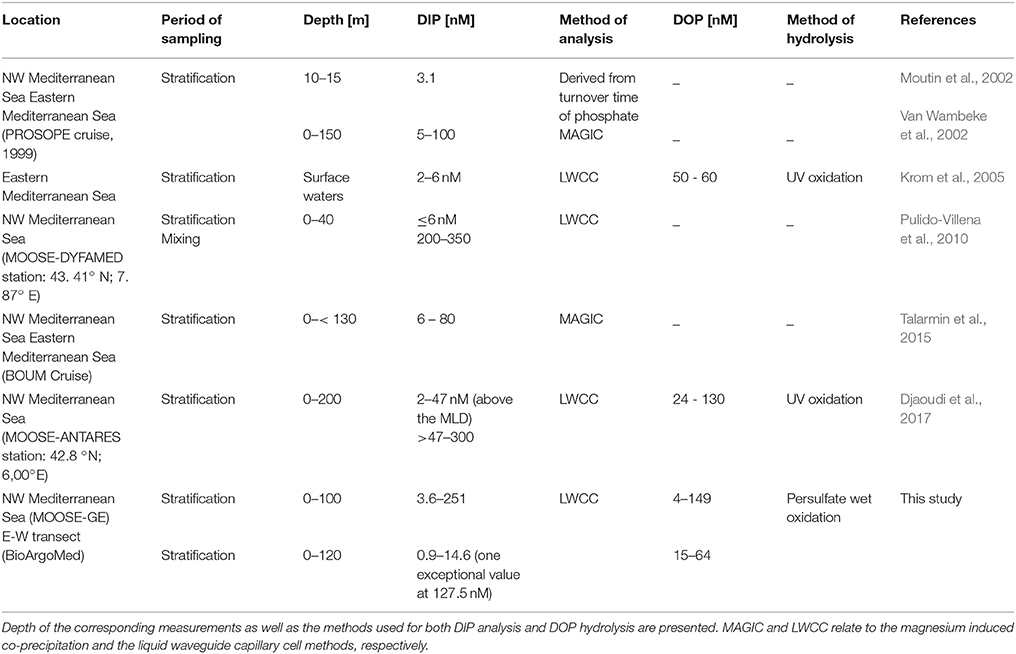
Table 1. Summary of published data on nanomolar dissolved inorganic phosphate (DIP) and dissolved organic phosphate (DOP) concentration in the Mediterranean Sea.
Regarding the vertical variability of surface DIP, the few existing data revealed a low but detectable increase of DIP concentration in the layer encompassing the DCM depth (Van Wambeke et al., 2002; Krom et al., 2005). In the present study, a significant vertical gradient of DIP but also of DOP was observed in both the NWMS and the E-W transect, allowing the generalization of this vertical pattern to the whole Mediterranean Sea. The positive gradient of DIP occurred above the phosphacline depth (Figure S1), suggesting that the phosphacline may be shallower than previously thought in both the NWMS and along the E-W transect. This result confirms that DIP in surface waters is not just a depleted invariant pool, highlighting the need to refine the criteria of the phosphacline determination.
The observed positive gradient of DIP, both in the NWMS and along the E-W transect, was higher than the bioavailable orthophosphate (<1–3 nM) reported by Moutin et al. (2002) in the upper waters (10–15 m). This means that the positive gradient of DIP observed in this study may be sufficient to sustain a biological activity in the surface waters, particularly by promoting microbial assemblages with very high-affinity transport systems and living very close to the theoretical diffusion limit for uptake. Indeed, the success of Synechococcus in the oligotrophic Mediterranean Sea has been linked to its ability to acquire phosphate even at low (<5 nM) concentrations (Moutin et al., 2002). However, the lack of biological data in this study precludes any deeper interpretation of the observed DIP gradient in a biological context.
The DIP concentration in surface waters would be the net resultant between biological and physical sources and sinks. The appearance of a positive gradient in upper waters suggests a balance in favor of DIP supply. This positive gradient of DIP could indeed arise from vertical phosphate diffusion from deep layers, suggesting the potential ability of new DIP to reach the upper waters even under stratification conditions in spite of an active biological uptake. The positive gradient of DIP above the phosphacline was, on average, higher in the NWMS than along the E-W transect, in agreement with reported differences in oligotrophy degree between the two sub-basins. Differences in DIP diffusion from deep layers, but also in rates of DOP hydrolysis could explain the observed differences in DIP gradient between the two cruises.
DOP data reported in this study are within the range of previous studies (Table 1), despite using different digestion methods (wet persulfate oxidation vs. UV digestion). Regarding the vertical profiles, this study revealed an important variability of DOP concentration in surface waters. Indeed, in the NWMS, a significant negative gradient of DOP was observed between the MLD and the DCM depth (av. 0.6 ± 0.7 nM m−1), which could be the result of its potential bioavailability. High alkaline phosphatase activities have been reported in the NW Mediterranean basin (Van Wambeke et al., 2002; Thingstad and Mantoura, 2005), suggesting an active DOP hydrolysis of phospho-ester bonds which could explain the DOP decrease observed in our study. Interestingly, the negative DOP gradient coincided with the DIP positive gradient, suggesting a DOP utilization even under available DIP conditions. These findings could suggest a possible simultaneous biological uptake of both DIP and DOP in this layer. In a cross-basin cruise in the Mediterranean Sea, Van Wambeke et al. (2002) showed that heterotrophic prokaryotes switched from P to labile carbon limitation at depths where DIP was still undetectable by the conventional technique. Thus, another explanation for the observed DOP decreasing gradient at the DCM depth coincident with sufficiently available DIP is a possible limitation by organic carbon, based on the hypothesis that another role of alkaline phosphatase is to decompose dissolved organic matter (Nausch and Nausch, 2004; Luo et al., 2011). Therefore, if the diffusion is enough to maintain a DIP gradient in the nanomolar range and, thus, remove P limitation, then the observed DOP decrease may be a consequence of the shift from P to C limitation. Again, further studies combining nanomolar DIP and DOP measurements with biological data are needed to confirm the biological meaning of the observed gradients.
N:P Ratios
N:P ratios in the upper waters reported in this study showed a high variability in both inorganic and organic pools. This contrasts with the deep waters of the Mediterranean Sea in which N:P ratios are constrained to a narrow range of values, between 21 and 22 in the western basin, and somewhat higher in the eastern basin (Krom et al., 1991; Bethoux et al., 1992). The vertical profiles of DIN:DIP ratio exhibited the classical shape reported for the Mediterranean Sea surface waters, during the stratification period, with a marked increase of the DIN:DIP ratio in subsurface water (Diaz et al., 2001; Moutin and Raimbault, 2002; Van Wambeke et al., 2009). Based on the conventional definition of nutriclines, this increase would be due to a nitracline shallower than the phosphacline, as previously reported (Moutin and Raimbault, 2002; Van Wambeke et al., 2009; Pujo-Pay et al., 2011). In this study, the use of the sensitive LWCC technique for DIP analysis revealed that this increase of the N:P ratio occurred between the MLD and the DCM depth. As said previously, a positive gradient of nM DIP was recorded in this layer, indicating the existence of a higher gradient of DIN compared to DIP. This observation stresses the need to extend nanomolar measurements to DIN concentration for a better understanding of the controlling factors of DIN:DIP ratios variability as on other oceans, DIN also can be the first limiting nutrient (i.e., Gruber, 2008)
The DON:DOP molar ratios in the surface waters of both NWMS and along the E-W transect were higher than the corresponding DIN:DIP ratios pointing to a DOP depletion relative to DON. This could be the result of a preferential remineralization of DOP with depth as reported by Aminot and Kérouel (2004) in the Mediterranean Sea and by Letscher and Moore (2015) at the scale of the global ocean. Similarly to the DIN:DIP molar ratios, an increase of the DON:DOP was observed at the DCM depth. This finding could be related to a biological utilization of DOP, since in this layer a negative gradient of DOP was observed. Nevertheless, accurate measurement of DON, implying nM measurements of nitrogen, would help to a better constraining of the DON:DOP variability in upper waters.
Conclusion
This study reports the first cross-basin distribution of nM DIP and DOP in the P-depleted Mediterranean surface waters. Surface DIP and DOP concentration showed an important variability on both longitudinal and vertical axis. Vertical profiles of DIP exhibited a significant positive gradient above the phosphacline, suggesting the potential of new phosphate to reach the near-surface waters by diffusion even under stratified conditions, and giving evidence against the traditional view of a depleted invariant DIP pool in the surface Mediterranean Sea. Despite this evidence of sufficient P availability, a significant negative gradient of DOP concentration was observed between the mixed layer depth and the DCM. Finally, the positive gradient in DIP was accompanied by a concomitant increase in N:P ratios, suggesting the existence of a higher gradient in DIN compared to DIP. The results obtained in this study indicate that acquiring nanomolar DIP data is a sine qua non condition for the comprehension and prediction of the biogeochemical functioning of the P-depleted Mediterranean Sea.
Author Contributions
KD, EP-V, and FV contributed to the conception and design of the study. KD and TW did seawater sampling and sample conditioning during the MOOSE-GE and BioArgoMed cruises, respectively. KD and SH-N analyzed nutrient concentrations. VT, LC, and PT acquired hydrological data (CTD). KD organized the database and wrote the first draft of the manuscript. EP-V and FV wrote sections in the manuscript. LC and PT were chief scientists during the MOOSE-GE cruise. VT and FD were chief scientists during the BioArgoMed cruise. PR is the principal investigator of the MOOSE project. FD is the coordinator of the Mediterranean work package of the NAOS project. All authors contributed to the manuscript revision, read and approved the submitted version.
Conflict of Interest Statement
The authors declare that the research was conducted in the absence of any commercial or financial relationships that could be construed as a potential conflict of interest.
Acknowledgments
The authors would like to thank the MOOSE project and the NAOS project (ANR J11R107-F, funded by the French Equipement d'Avenir) in the framework of which this study was performed. Captains and crews of the R/V le Suroit and the R/V le Tethys II are warmly acknowledged for their cooperative work at sea. The work leading to this publication has received funding from European FEDER Fund under project 1166-39417. This work is a contribution to the Labex OT-Med (n° ANR-11-LABX-0061) funded by the French Government Investissements d'Avenir program of the French National Research Agency (ANR) through the A*MIDEX project (n° ANR-11-IDEX-0001-02). Two reviewers are acknowledged for their relevant comments and suggestions on the manuscript.
Supplementary Material
The Supplementary Material for this article can be found online at: https://www.frontiersin.org/articles/10.3389/fmars.2018.00234/full#supplementary-material
References
Aminot, A., and Kérouel, R. (2007). Dosage Automatique des Nutriments Dans Les Eaux Marines: Méthodes en Flux Continu. Plouzané: Ed Ifremer-Quae, 188.
Aminot, A., and Kérouel, R. (2004). Dissolved organic carbon, nitrogen and phosphorus in the N-E Atlantic and the N-W Mediterranean with particular reference to non-refractory fractions and degradation. Deep Sea Res. Part I Oceanogr. Res. Pap. 51, 1975–1999. doi: 10.1016/j.dsr.2004.07.016
Ammerman, J. W., Hood, R. R., Case, D. A., and Cotner, J. B. (2003). Phosphorus deficiency in the Atlantic: an emerging paradigm in oceanography. Eos Trans. Am. Geophys. Union 84, 165–170. doi: 10.1029/2003EO180001
Balino, B., Fasham, M., and Bowles, M. (eds.) (2001). Ocean Biogeochemistry and Global Change: JGOFS Research Highlightings 1988–2000, IGBP Science 2. Stockholm: IGBP, 32.
Bethoux, J. P., Morin, P., Madec, C., and Gentili, B. (1992). Phosphorus and nitrogen behavior in the Mediterranean Sea. Deep Sea Res. Part A Oceanogr. Res. Pap. 39, 1641–1654. doi: 10.1016/0198-0149(92)90053-V
Céa, B., Lefèvre, D., Chirurgien, L., Raimbault, P., Garcia, N., Charrière, B., et al. (2015). An annual survey of bacterial production, respiration and ectoenzyme activity in coastal NW Mediterranean waters: temperature and resource controls. Environ. Sci. Pollut. Res. Int. Research, 22, 13654–13668. doi: 10.1007/s11356-014-3500-9
Crise, A., Allen, J., Baretta, J., Crispi, G., Mosetti, R., and Solidoro, C. (1999). The Mediterranean pelagic ecosystem response to physical forcing. Prog. Oceanogr. 44, 219–243. doi: 10.1016/S0079-6611(99)00027-0
Crispi, G., Mosetti, R., Solidoro, C., and Crise, A. (2001). Nutrients cycling in Mediterranean basins: the role of the biological pump in the trophic regime. Ecol. Model. 138, 101–114. doi: 10.1016/S0304-3800(00)00396-3
De Boyer Montégut, C. (2004). Mixed layer depth over the global ocean: an examination of profile data and a profile-based climatology. J. Geophys. Res. 109, 1–20. doi: 10.1029/2004JC002378
De Madron, X. D., Guieu, C., Sempere, R., Conan, P., Cossa, D., D'Ortenzio, F., et al. (2011). Marine ecosystems' responses to climatic and anthropogenic forcings in the Mediterranean. Prog. Oceanogr. 91, 97–166. doi: 10.1016/j.pocean.2011.02.003
Diaz, F., Raimbault, P., Boudjellal, B., Garcia, N., and Moutin, T. (2001). Early spring phosphorus limitation of primary productivity in a NW Mediterranean coastal zone (Gulf of Lions). Mar. Ecol. Prog. Ser. 211, 51–62. doi: 10.3354/meps211051
Djaoudi, K., Van Wambeke, F., Barani, A., Hélias-Nunige, S., Sempéré, R., and Pulido-Villena, E. (2017). Atmospheric fluxesof soluble organic C, N and P to the Mediterranean Sea: potential biogeochemical implications in the surface layer. Progr. Oceanogr. 163, 59–69. doi: 10.1016/j.pocean.2017.07.008
Gruber, N. (2008). The marine nitrogen cycle: overview and challenges. Nitrog. Mar. Environ. 2, 1–50. doi: 10.1016/B978-0-12-372522-6.00001-3
Hashihama, F., Kinouchi, S., Suwa, S., Suzumura, M., and Kanda, J. (2013). Sensitive determination of enzymatically labile dissolved organic phosphorus and its vertical profiles in the oligotrophic western North Pacific and East China Sea. J. Oceanogr. 69, 357–367. doi: 10.1007/s10872-013-0178-4
Karl, D. M., and Björkman, K. M. (2015). “Dynamics of dissolved organic phosphorus,” in Biogeochemistry of Marine Dissolved Organic Matter, eds D. A. Hansell and C. A. Carlson (Burlington: Academic Press), 579–608.
Karl, D. M., Björkman, K. M., Dore, J. E., Fujieki, L., Hebel, D. V., Houlihan, T., et al. (2001). Ecological nitrogen-to-phosphorus stoichiometry at station ALOHA. Deep Sea Res. Part II Top. Stud. Oceanogr. 48, 1529–1566. doi: 10.1016/S0967-0645(00)00152-1
Karl, D. M., and Tien, G. (1992). Magic - a sensitive and precise method for measuring dissolved phosphorus in aquatic environments. Limnol. Oceanogr. 37, 105–116. doi: 10.4319/lo.1992.37.1.0105
Krom, M. D., Kress, N., Brenner, S., and Gordon, L. I. (1991). Phosphorus limitation of primary productivity along the E-W transect. Limnol. Oceanogr. 36, 424–432. doi: 10.4319/lo.1991.36.3.0424
Krom, M. D., Woodward, E. M. S., Herut, B., Kress, N., Carbo, P., Mantoura, R. F. C., et al. (2005). Nutrient cycling in the south-east Levantine basin of the eastern Mediterranean: results from a phosphorus starved system. Deep Sea Res. Part II Top. Stud. Oceanogr. 52, 2879–2896. doi: 10.1016/j.dsr2.2005.08.009
Lavigne, H., D'Ortenzio, F., D'Alcala, M. R., Claustre, H., Sauzede, R., and Gacic, M. (2015). On the vertical distribution of the chlorophyll a concentration in the Mediterranean Sea: a basin-scale and seasonal approach. Biogeosciences 12, 5021–5039. doi: 10.5194/bg-12-5021-2015
Lazzari, P., Solidoro, C., Ibello, V., Salon, S., Teruzzi, A., Béranger, K., et al. (2012). Seasonal and inter-annual variability of plankton chlorophyll and primary production in the Mediterranean Sea: a modelling approach. Biogeosciences 9, 217–233. doi: 10.5194/bg-9-217-2012
Letscher, R. T., and Moore, J. K. (2015). Preferential remineralization of dissolved organic phosphorus and non-Redfield DOM dynamics in the global ocean: impacts on marine productivity, nitrogen fixation, and carbon export. Global Biogeochem. Cycles 29, 325–340. doi: 10.1002/2014GB004904
Lomas, M. W., Steinberg, D. K., Dickey, T., Carlson, C. A., Nelson, N. B., Condon, R. H., et al. (2010). Increased ocean carbon export in the Sargasso Sea linked to climate variability is countered by its enhanced mesopelagic attenuation. Biogeosciences 7, 57–70. doi: 10.5194/bg-7-57-2010
Luo, H., Zhang, H., Long, R. A., and Benner, R. (2011). Depth distributions of alkaline phosphatase and phosphonate utilization genes in the North Pacific Subtropical Gyre. Aquat. Microb. Ecol. 62, 61–69. doi: 10.3354/ame01458
Mather, R. L., Reynolds, S. E., Wolff, G. A., Williams, R. G., Torres-Valdes, S., Woodward, E. M. S., et al. (2008). Phosphorus cycling in the North and South Atlantic Ocean subtropical gyres. Nat. Geosci. 1, 439–443. doi: 10.1038/ngeo232
Moore, C. M., Mills, M. M., Arrigo, K. R., Berman-Frank, I., Bopp, L., Boyd, P. W., et al. (2013). Processes and patterns of oceanic nutrient limitation. Nat. Geosci. 6, 701–710. doi: 10.1038/ngeo1765
Moutin, T., Karl, D. M., Duhamel, S., Rimmelin, P., Raimbault, P., Van Mooy, B. A. S., et al. (2008). Phosphate availability and the ultimate control of new nitrogen input by nitrogen fixation in the tropical Pacific Ocean. Biogeosciences 5, 95–109. doi: 10.5194/bg-5-95-2008
Moutin, T., and Raimbault, P. (2002). Primary production, carbon export and nutrients availability in western and eastern Mediterranean Sea in early summer 1996 (MINOS cruise). J. Mar. Syst. 33, 273–288. doi: 10.1016/S0924-7963(02)00062-3
Moutin, T., Thingstad, T. F., Van Wambeke, F., Marie, D., Slawyk, G., Raimbault, P., et al. (2002). Does competition for nano-molarphosphate supply explain the predominance of the cyanobacterium Synechococcus? Limnol. Oceanogr. 47, 1562–1567. doi: 10.4319/lo.2002.47.5.1562
Murphy, J., and Riley, J. P. (1962). A modified single solution method for the determination of phosphate in natural waters. Anal. Chim. Acta 27, 31–36. doi: 10.1016/S0003-2670(00)88444-5
Nausch, M., and Nausch, G. (2004). Bacterial utilization of phosphorus pools after nitrogen and carbon amendment and its relation to alkaline phosphatase activity. Aquat. Microb. Ecol. 37, 237–245. doi: 10.3354/ame037237
Patey, M. D., Rijkenberg, M. J. A., Statham, P. J., Stinchcombe, M. C., Achterberg, E. P., and Mowlem, M. (2008). Determination of nitrate and phosphate in seawater at nano-molarconcentrations. TrAC Trends Analy. Chem. 27, 169–182. doi: 10.1016/j.trac.2007.12.006
Pujo-Pay, M., Conan, P., Oriol, L., Cornet-Barthaux, V., Falco, C., Ghiglione, J. F., et al. (2011). Integrated survey of elemental stoichiometry (C, N, P) from the western to eastern Mediterranean Sea. Biogeosciences 8, 883–899. doi: 10.5194/bg-8-883-2011
Pulido-Villena, E., Rerolle, V., and Guieu, C. (2010). Transient fertilizing effect of dust in P-deficient LNLC surface ocean. Geophys. Res. Lett. 37, 1–5. doi: 10.1029/2009GL041415
Redfield, A. C. (1958). The biological control of chemical factors in the environment. Am. Sci. 46, 230A 205–221.
Rimmelin, P., and Moutin, T. (2005). Re-examination of the MAGIC method to determine low orthophosphate concentration in seawater. Anal. Chim. Acta 548, 174–182. doi: 10.1016/j.aca.2005.05.071
Ryther, J. H., and Dunstan, W. M. (1971). Nitrogen, phosphorus, and eutrophication in the coastal marine environment. Science 171, 1008–1013. doi: 10.1126/science.171.3975.1008
Sato, M., Sakuraba, R., and Hashihama, F. (2013). Phosphate monoesterase and diesterase activities in the North and South Pacific Ocean. Biogeosciences 10, 7677–7688. doi: 10.5194/bg-10-7677-2013
Sigman, D. M., and Boyle, E. A. (2000). Glacial/interglacial variations in atmospheric carbon dioxide. Nature 407, 859–869. doi: 10.1038/35038000
Suzumura, M., Hashihama, F., Yamada, N., and Kinouchi, S. (2012). Dissolved phosphorus pools and alkaline phosphatase activity in the euphotic zone of the western North Pacific Ocean. Front. Microbiol. 3:99. doi: 10.3389/fmicb.2012.00099
Talarmin, A., Van Wambeke, F., Lebaron, P., and Moutin, T. (2015). Vertical partitioning of phosphate uptake among picoplankton groups in the low Pi Mediterranean Sea. Biogeosciences 12, 1237–1247. doi: 10.5194/bg-12-1237-2015
Thingstad, T. F., Krom, M. D., Mantoura, R. F. C., Flaten, G. A. F., Groom, S., Herut, B., et al. (2005). Nature of phosphorus limitation in the ultraoligotrophic eastern Mediterranean. Science 309, 1068–1071. doi: 10.1126/science.1112632
Thingstad, T. F., and Mantoura, R. F. C. (2005). Titrating excess nitrogen content of phosphorous-deficient eastern Mediterranean surface water using alkaline phosphatase activity as a bio-indicator. Limnol. Oceanogr. Methods 3, 94–100. doi: 10.4319/lom.2005.3.94
Tyrrell, T. (1999). The relative influences of nitrogen and phosphorus on oceanic primary production. Nature 400, 525–531. doi: 10.1038/22941
Valderrama, J. C. (1981). The simultaneous analysis of total nitrogen and total phosphorus in natural water. Mar. Chem. 10, 102–122. doi: 10.1016/0304-4203(81)90027-X
Van Wambeke, F., Christaki, U., Giannokourou, A., Moutin, T., and Souvemerzoglou, K. (2002). Longitudinal and vertical trends of bacterial limitation by phosphorus and carbon in the Mediterranean Sea. Microb. Ecol. 43, 119–133. doi: 10.1007/s00248-001-0038-4
Van Wambeke, F., Ghiglione, J.-F., Nedoma, J., Mével, G., and Raimbault, P. (2009). Bottom up effects on bacterioplankton growth and composition during summer-autumn transition in the open NW Mediterranean Sea. Biogeosciences 6, 705–720. doi: 10.5194/bg-6-705-2009
Wu, J. F., Sunda, W., Boyle, E. A., and Karl, D. M. (2000). Phosphate depletion in the western North Atlantic Ocean. Science 289, 759–762. doi: 10.1126/science.289.5480.759
Keywords: the Mediterranean Sea, dissolved inorganic phosphate, dissolved organic phosphate, N:P ratios, liquid waveguide capillary cell
Citation: Djaoudi K, Van Wambeke F, Coppola L, D'Ortenzio F, Helias-Nunige S, Raimbault P, Taillandier V, Testor P, Wagener T and Pulido-Villena E (2018) Sensitive Determination of the Dissolved Phosphate Pool for an Improved Resolution of Its Vertical Variability in the Surface Layer: New Views in the P-Depleted Mediterranean Sea. Front. Mar. Sci. 5:234. doi: 10.3389/fmars.2018.00234
Received: 01 February 2018; Accepted: 18 June 2018;
Published: 10 July 2018.
Edited by:
Christian Lønborg, Australian Institute of Marine Science (AIMS), AustraliaReviewed by:
Masahiro Suzumura, National Institute of Advanced Industrial Science and Technology (AIST), JapanLeAnn Whitney, University of Rhode Island, United States
Copyright © 2018 Djaoudi, Van Wambeke, Coppola, D'Ortenzio, Helias-Nunige, Raimbault, Taillandier, Testor, Wagener and Pulido-Villena. This is an open-access article distributed under the terms of the Creative Commons Attribution License (CC BY). The use, distribution or reproduction in other forums is permitted, provided the original author(s) and the copyright owner(s) are credited and that the original publication in this journal is cited, in accordance with accepted academic practice. No use, distribution or reproduction is permitted which does not comply with these terms.
*Correspondence: Kahina Djaoudi, kahina.djaoudi@mio.osupytheas.fr