Constraining the Oceanic Uptake and Fluxes of Greenhouse Gases by Building an Ocean Network of Certified Stations: The Ocean Component of the Integrated Carbon Observation System, ICOS-Oceans
 Tobias Steinhoff1,2*
  Thanos Gkritzalis3*
  Siv K. Lauvset2,4,5
  Steve Jones4,5
  Ute Schuster6
  Are Olsen4,5
  Meike Becker4,5
  Roberto Bozzano7
  Fabio Brunetti8
  Carolina Cantoni9
  Vanessa Cardin8
  Denis Diverrès10
  Björn Fiedler1
  Agneta Fransson11
  Michele Giani8
  Sue Hartman12
  Mario Hoppema13
  Emil Jeansson2
  Truls Johannessen4,5
  Vassilis Kitidis14
  Arne Körtzinger1 Camilla Landa4,5
  Nathalie Lefèvre15
  Anna Luchetta9
  Lieven Naudts16
  Philip D. Nightingale14 Abdirahman M. Omar2
  Sara Pensieri7
  Benjamin Pfeil4,5
  Rocío Castaño-Primo4,5
  Gregor Rehder17
  Anna Rutgersson18 Richard Sanders12
  Ingo Schewe13 Giuseppe Siena8
  Ingunn Skjelvan2
  Thomas Soltwedel13
  Steven van Heuven19
  Andrew Watson6
- 1GEOMAR, Helmholtz Centre for Ocean Research Kiel, Kiel, Germany
- 2NORCE Norwegian Research Centre AS, Bjerknes Centre for Climate Research, Bergen, Norway
- 3Flanders Marine Institute, Ostend, Belgium
- 4Geophysical Institute, University of Bergen, Bergen, Norway
- 5Bjerknes Centre for Climate Research, Bergen, Norway
- 6College of Life and Environmental Sciences, University of Exeter, Exeter, United Kingdom
- 7Institute for the Study of the Anthropic Impacts and the Sustainability of the Marine Environment, National Research Council of Italy, Genoa, Italy
- 8Istituto Nazionale di Oceanografia e di Geofisica Sperimentale, Trieste, Italy
- 9Institute of Marine Science, National Research Council of Italy, Trieste, Italy
- 10Centre IRD de Bretagne, Plouzané, France
- 11Norwegian Polar Institute, Fram Centre, Tromsø, Norway
- 12National Oceanography Centre, Southampton, United Kingdom
- 13Alfred Wegener Institute Helmholtz Centre for Polar and Marine Research, Bremerhaven, Germany
- 14Plymouth Marine Laboratory, Plymouth, United Kingdom
- 15CNRS, IRD, MNHN, LOCEAN/IPSL Laboratory, Sorbonne Université (UPMC, Univ Paris 06), Paris, France
- 16Royal Belgian Institute of Natural Sciences-Operational Directorate Natural Environment, Ostend, Belgium
- 17Leibniz Institute for Baltic Sea Research Warnemünde, Rostock, Germany
- 18Department of Earth Sciences, Uppsala University, Uppsala, Sweden
- 19Centre for Isotope Research, Groningen University, Groningen, Netherlands
The European Research Infrastructure Consortium “Integrated Carbon Observation System” (ICOS) aims at delivering high quality greenhouse gas (GHG) observations and derived data products (e.g., regional GHG-flux maps) for constraining the GHG balance on a European level, on a sustained long-term basis. The marine domain (ICOS-Oceans) currently consists of 11 Ship of Opportunity lines (SOOP – Ship of Opportunity Program) and 10 Fixed Ocean Stations (FOSs) spread across European waters, including the North Atlantic and Arctic Oceans and the Barents, North, Baltic, and Mediterranean Seas. The stations operate in a harmonized and standardized way based on community-proven protocols and methods for ocean GHG observations, improving operational conformity as well as quality control and assurance of the data. This enables the network to focus on long term research into the marine carbon cycle and the anthropogenic carbon sink, while preparing the network to include other GHG fluxes. ICOS data are processed on a near real-time basis and will be published on the ICOS Carbon Portal (CP), allowing monthly estimates of CO2 air-sea exchange to be quantified for European waters. ICOS establishes transparent operational data management routines following the FAIR (Findable, Accessible, Interoperable, and Reusable) guiding principles allowing amongst others reproducibility, interoperability, and traceability. The ICOS-Oceans network is actively integrating with the atmospheric (e.g., improved atmospheric measurements onboard SOOP lines) and ecosystem (e.g., oceanic direct gas flux measurements) domains of ICOS, and utilizes techniques developed by the ICOS Central Facilities and the CP. There is a strong interaction with the international ocean carbon cycle community to enhance interoperability and harmonize data flow. The future vision of ICOS-Oceans includes ship-based ocean survey sections to obtain a three-dimensional understanding of marine carbon cycle processes and optimize the existing network design.
Introduction
More than a century of research on GHGs has convincingly proven that anthropogenic activities lead to global warming (IPCC, 2014). In the past three decades, research on GHGs has also become part of the international political and societal agenda. As such, there is a strong commitment from the community to continue improving relevant research and at the same time identify possible mitigation and prevention activities. The European research infrastructure “Integrated Carbon Observation System” (ICOS) provides high quality observations of GHGs (in particular CO2) from across Europe and its surrounding waters. ICOS further aims to stimulate relevant research and technological development, and interacts with the climate science communities as well as with policy bodies. ICOS intends to be the European hub for GHG research and to provide products for a better understanding of GHGs in the Earth system. The first concept toward the ICOS infrastructure was presented in 2006. Figure 1 shows the timeline and important milestones of ICOS.
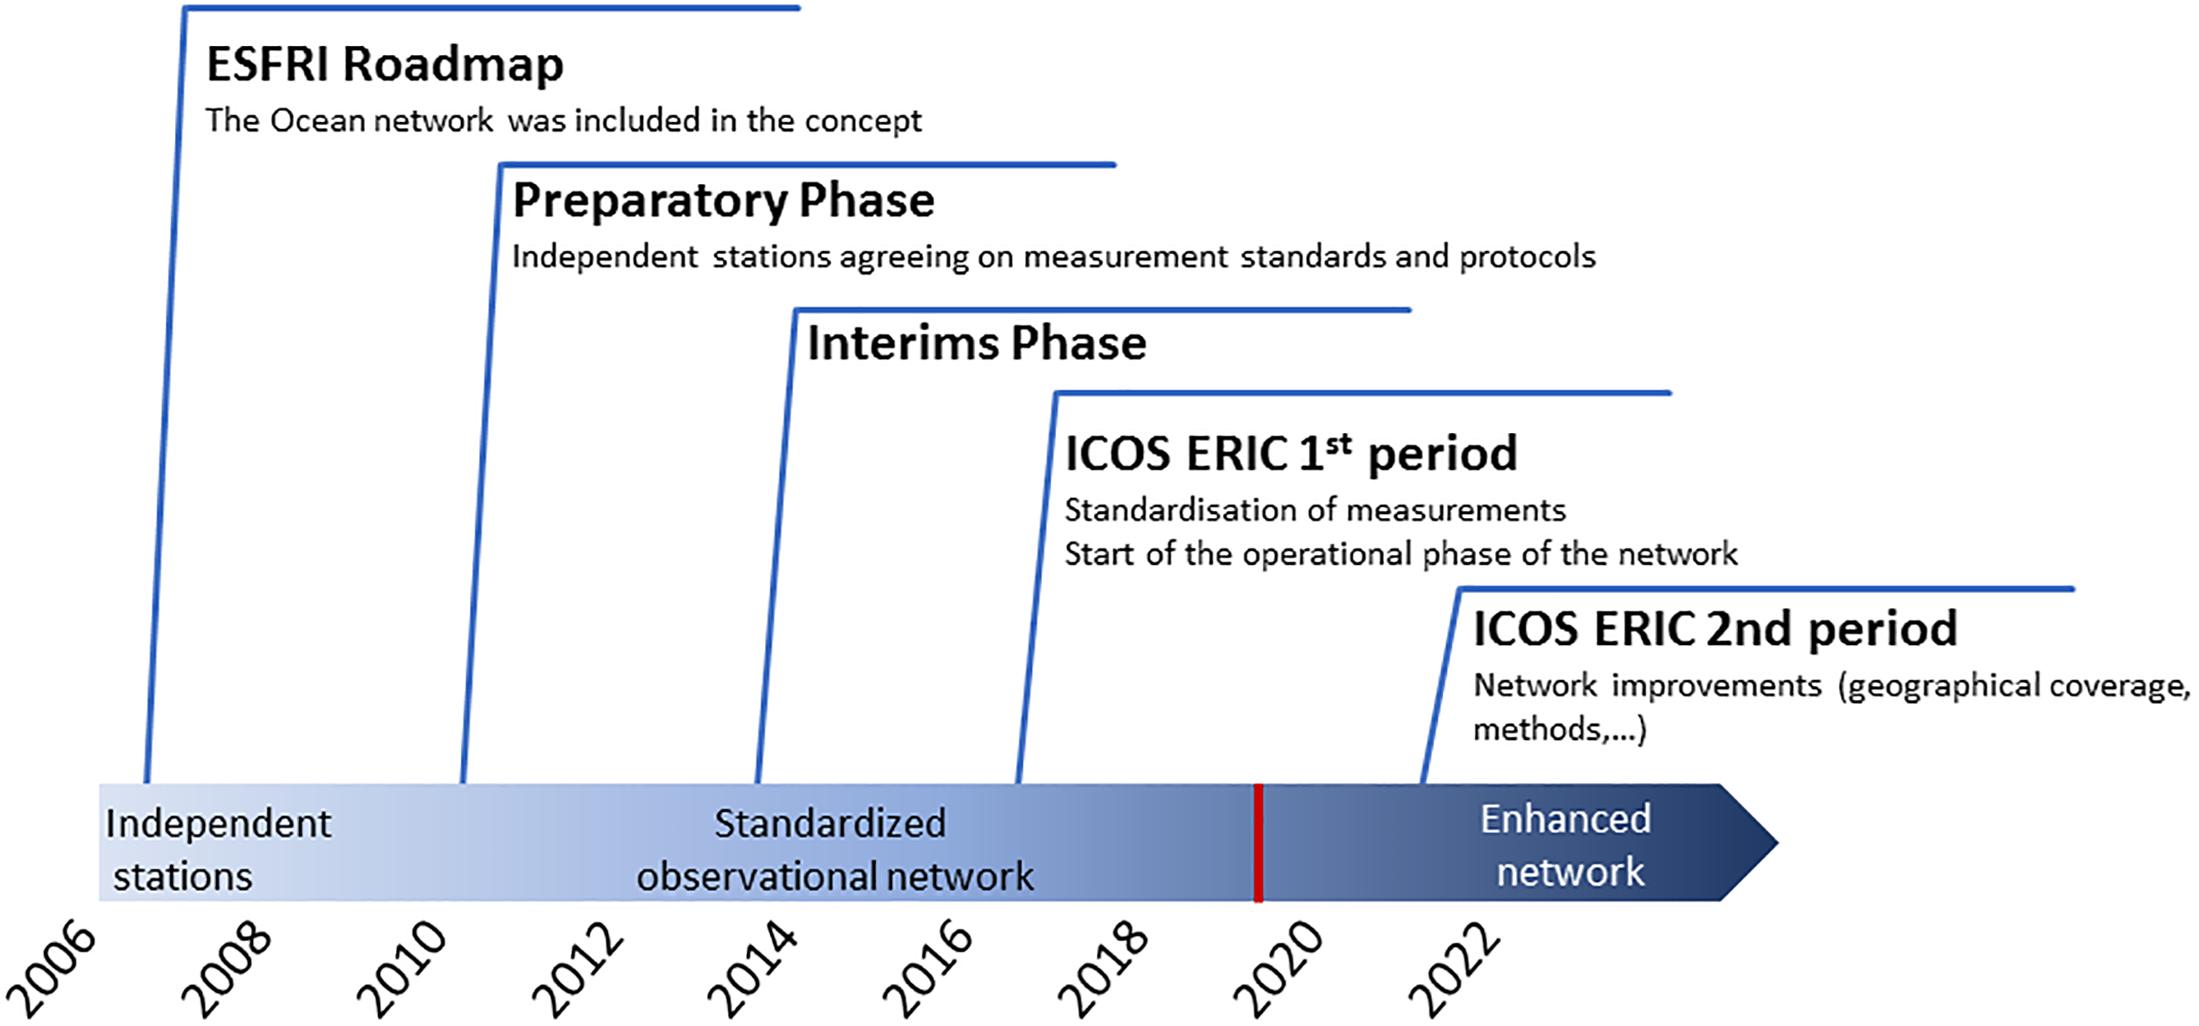
Figure 1. Time line showing the development of ICOS since 2006. The red bar denotes the time of publication of this paper in the development process. It is shown how the stations developed from independent stations to an enhanced network over time (ESFRI: European Strategy Forum on Research Infrastructures; ERIC: European Research Infrastructure Consortium).
ICOS is a pan-European network and a ERIC legal entity with more than 100 measuring stations from 12 countries. The stations are distributed across Europe and adjacent oceans and seas, from the Arctic territories (Zeppelin & Hausgarten Observatories) to the Equatorial Atlantic (Cape Verde Ocean Observatory & SOOP France-Brazil), and in the Southern Ocean (SOOP Polarstern). The network provides the operational infrastructure necessary for high quality GHG observations and consequently facilitates innovative science and research. The network’s design and operation are under constant review, with the aim of increasing the level of confidence in the data and reducing associated uncertainties. The network is split into three Thematic Centers (TCs) [atmosphere (ATC), terrestrial ecosystem (ETC), and ocean (OTC)], enabling specialists in each domain to develop the best methods and practices to achieve the goals of ICOS. Each TC has an associated Monitoring Station Assembly (MSA) which represents the interests of the measuring community. The TCs set specific, uniform, and stringent operational criteria based on current best practices, which are agreed upon with their respective MSAs. The formal decision body is the GA where the member states are represented. The general assembly (GA) meets twice a year and the TCs report to the GA. The development of the initial stages of ICOS, up until the beginning of the ICOS ERIC 1st Period (2016) was fulfilled within the scheduled timeline. From the beginning of the operational period until the red line in Figure 1, 48 out of 134 stations (approximately 36%) from all domains have received the official ICOS label, meaning that they are delivering to the high ICOS standards. This index, however, is not entirely representative of the overall ICOS progress. Developments like the setup of the Central Analytical Laboratory (CAL), the setup of the Carbon Portal (CP), the labeling protocols, the uniformity of operations in all domains, and the very high quality of the produced data highlight how much ICOS has developed. Currently, ICOS is in the important first operational phase and the number of stations that have received the ICOS label (see section “Labeling”) is growing constantly.
Each measurement station in the network is nominated by the relevant member state and is then “labeled” as being able to provide data of high quality, following a thorough review by the relevant TC. This operation mode is the backbone of ICOS and ensures that all data and derived products have low and clearly defined uncertainties. The three TCs are responsible for receiving the raw data and conduct initial quality control (QC). The data are then transferred to the central ICOS data repository (CP1).
The TCs and the CP are responsible for detailed QC of data, further processing, analysis, and delivery of products (e.g., maps, fluxes, etc.). An important aspect of ICOS is the commitment of the member states to the sustained operation of the stations in order to secure the long-term operation of the pan-European network and the value of their investment. This is of paramount importance for time series environmental observations (Henson, 2014).
The sensitivity of the oceanic carbon fluxes and reservoirs to atmospheric and ocean changes (Watson et al., 2009; Landschützer et al., 2017; Fröb et al., 2019) pushes the need to reduce the uncertainties in the observational data. Increasing the number of observations and their geographical coverage will improve derived products (Rödenbeck et al., 2015). Even if it is well-known that the carbon cycle shows annual and decadal variability, not all drivers are fully understood. The Global Carbon budget 2018 (Le Quéré et al., 2018) reports a carbon budget imbalance of 0.5 GtCyr−1. The ICOS-Oceans network is operating with this in mind, thus concretely responding to a few indications coming out from the last OceanObs’09 conference (Borges et al., 2009; Monteiro et al., 2009). The Oceans network is managed and coordinated by the OTC, which is co-hosted by Norway (NORCE Norwegian Research Centre and the University of Bergen (UiB)) and the United Kingdom (National Oceanography Centre (NOC), University of Exeter (UoE), and Plymouth Marine Laboratory (PML)). The roles of the OTC are split between these two countries (see Table 1). The OTC’s tasks also include the production and implementation of a roadmap, refreshed annually, aiming to help the MSA to maintain a robust and optimally structured network. The OTC reports to the MSA and ICOS Head Office (HO) via the “Annual Activity Report.”
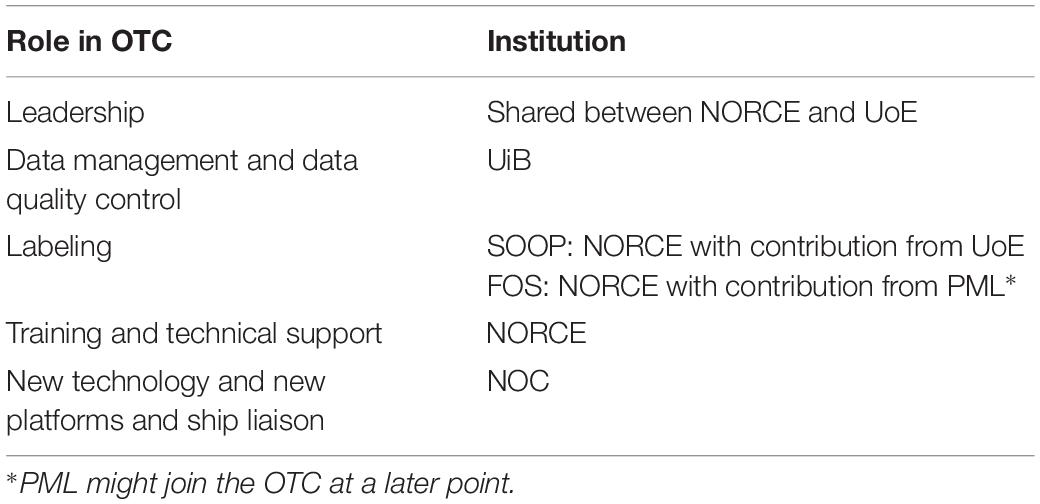
Table 1. OTC member institutes and associated function, NORCE: NORCE Norwegian Research Centre AS, Bergen, Norway; UoE: University of Exeter, United Kingdom; UiB: University of Bergen, Norway; PML: Plymouth Marine Laboratory, United Kingdom; NOC: National Oceanographic Centre, Southampton, United Kingdom.
The institutes hosting the OTC have significant experience in marine carbon measurements, ocean climate science, and data management, gained over many years of active research and matured over the last 10 to 15 years with their participation and leadership in prominent EU funded projects (CAVASSOO, CARBOOCEAN, CARBOCHANGE, Euro-Sites, FixO3, AtlantOS, RINGO, BONUS INTEGRAL). A significant number of measurement stations were designed and developed as part of these projects, allowing a benchmark of high quality to be set. Since it is the first time that a marine network has been designed with a long term perspective, the specific protocols for running an ICOS station will be adjusted over time and will be published on the OTC’s website for maximum transparency. Two motivations for designing and further evolving the ocean network have been formulated:
1. Quantifying CO2 (and other GHG) fluxes between the ocean and the atmosphere.
2. Assessing drivers and variability of CO2 and other GHGs in marine environments.
As to (1), highly accurate measurements of surface water pCO2 are required, measured onboard SOOP lines and at FOS. To properly address motivation (2), additional variables need to be measured (including, but not necessarily limited to, temperature, salinity, inorganic carbon, and oxygen) both at and below the ocean’s surface. This is best achieved by FOS. These two challenges, and their impact on the process of station labeling, are described below. Currently, ICOS-Oceans is concentrating on CO2 observations, but is keeping the possible implementation of non-CO2 GHG measurements, such as N2O and CH4, in mind. Such measurements are already conducted at a few stations.
As illustrated in Figure 2, the marine network covers the Arctic Ocean including the Barents Sea, the North and sub-tropical Atlantic, the Baltic Sea, and the Mediterranean Sea. One line also periodically covers the Southern Ocean. The network currently includes 11 SOOP lines, 9 FOS, and one MFT station, which consist of both a FOS and an ecosystem tower.
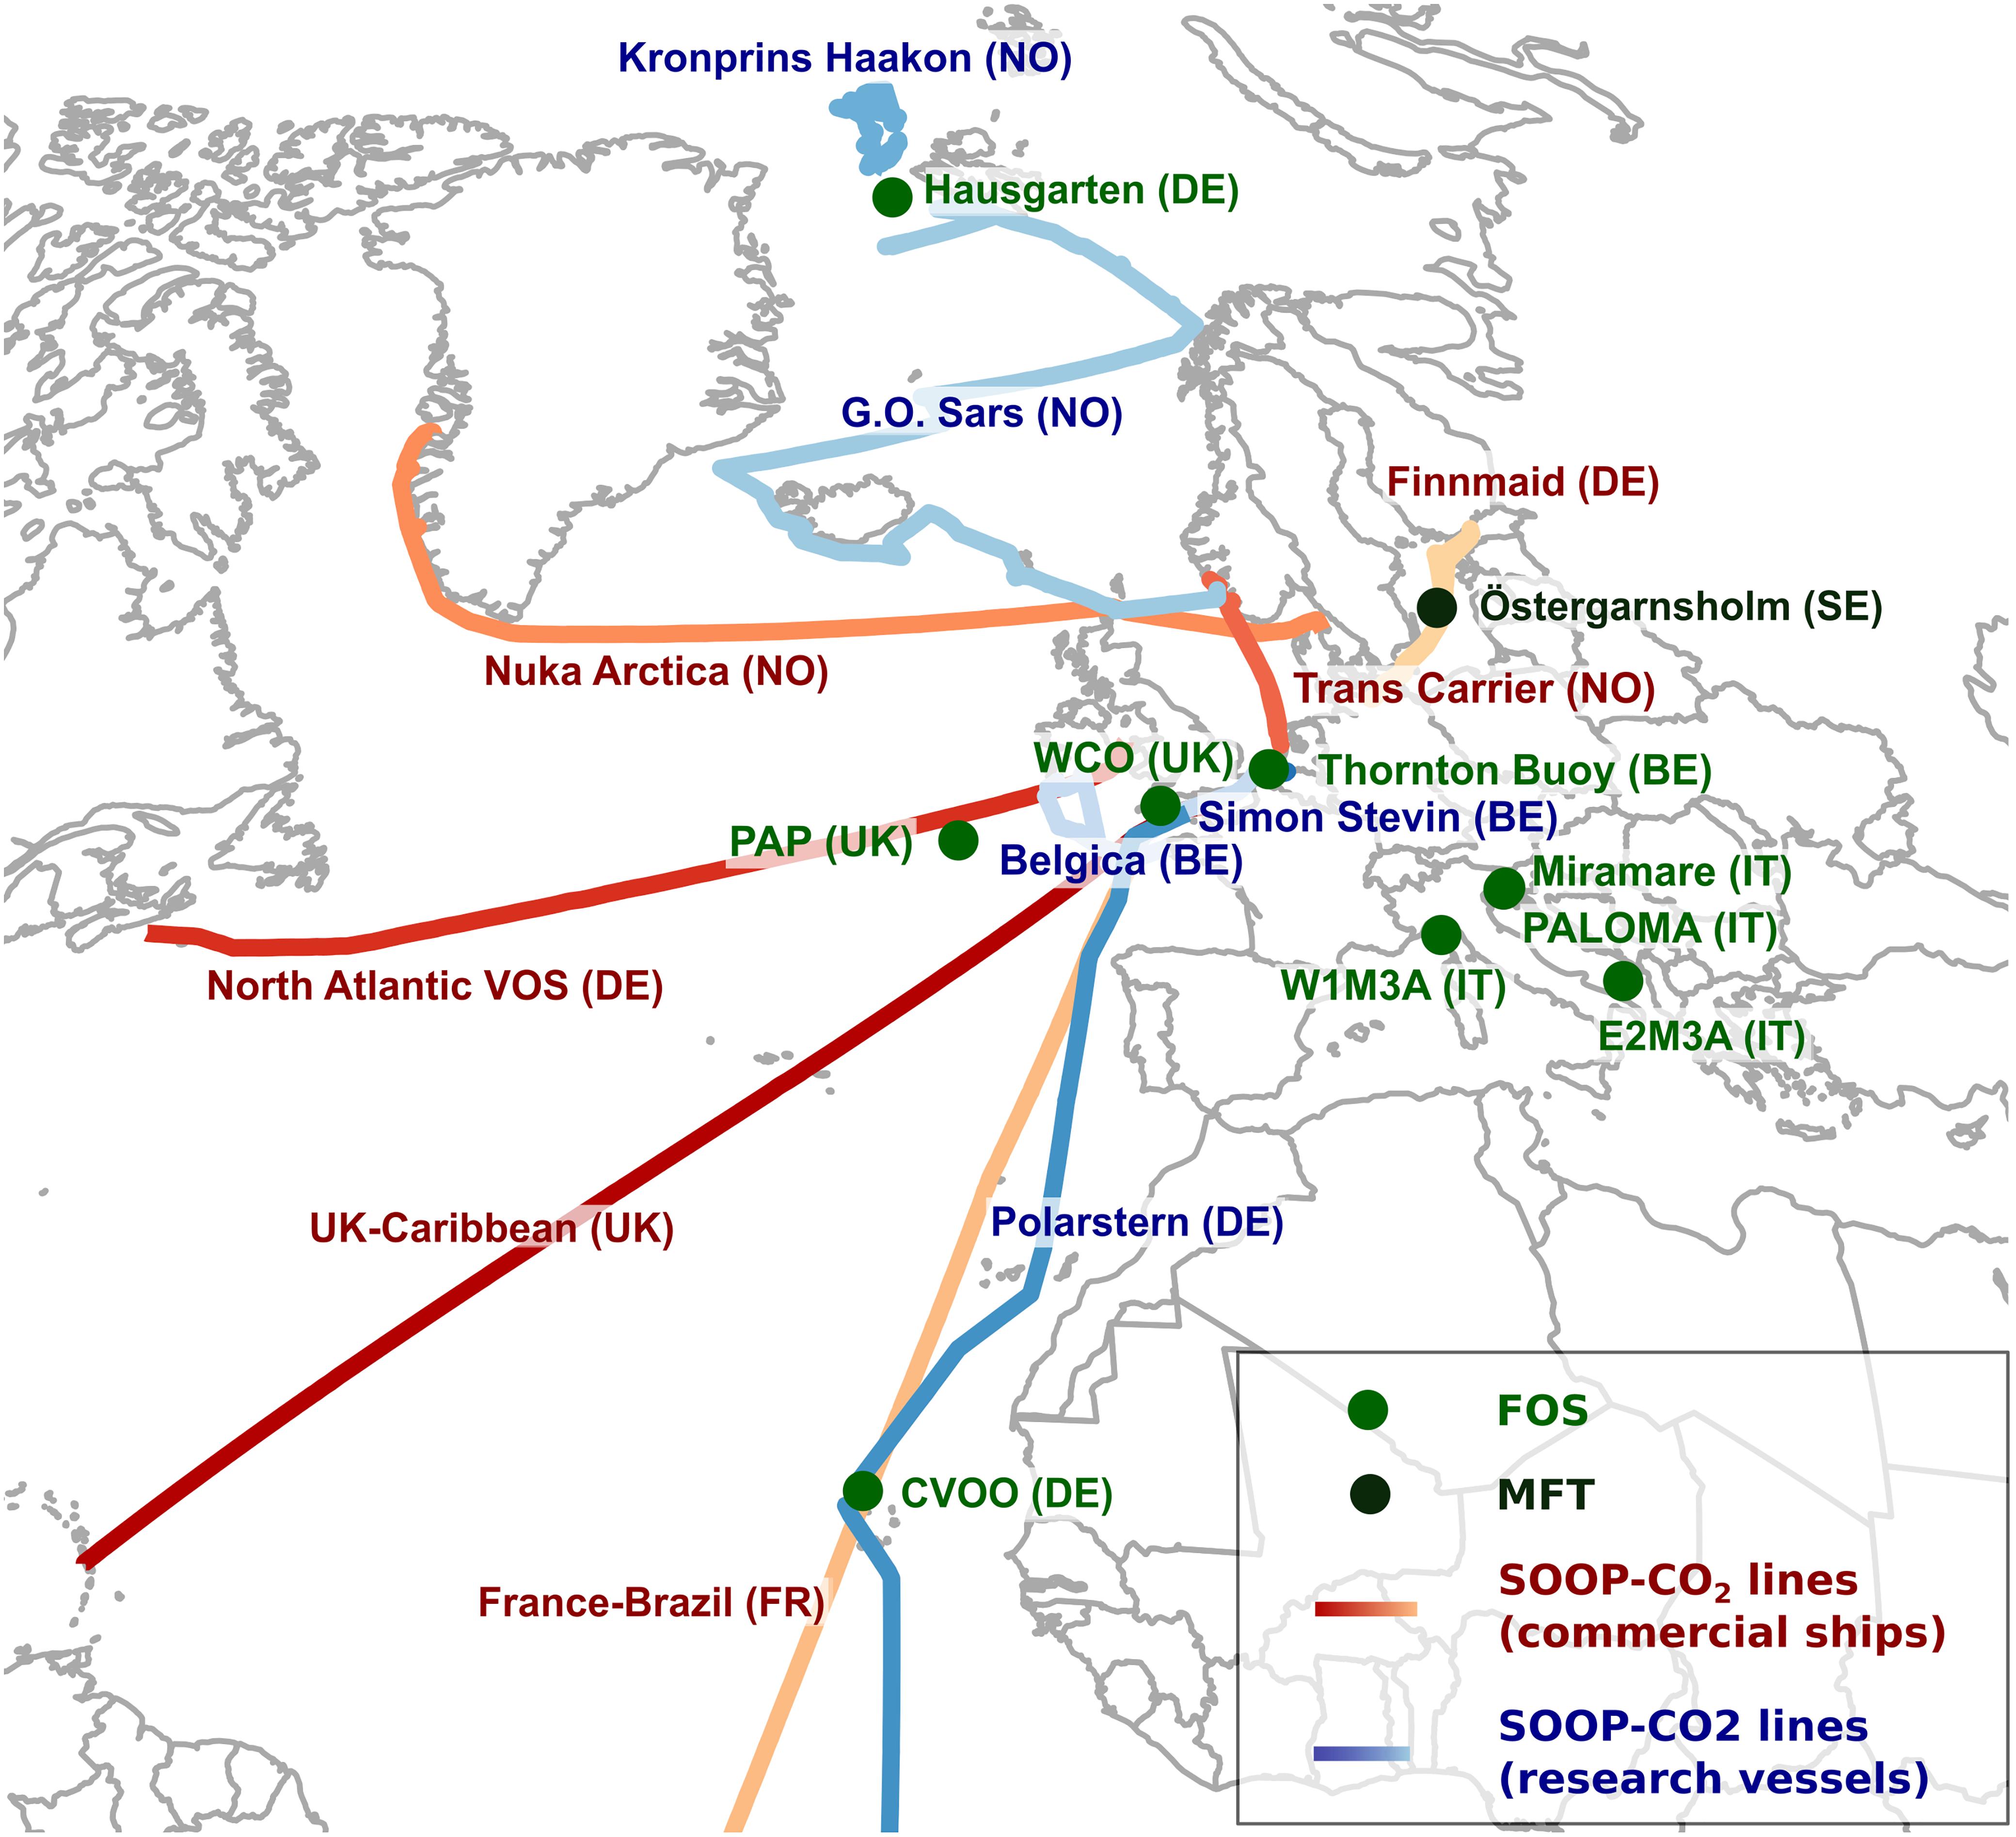
Figure 2. Distribution of stations and coverage of ICOS-Oceans network as in February 2019. Please note that ICOS-Oceans is a developing network. Please find a complete and up to date station list and information about the stations in https://otc.icos-cp.eu/station-network.
All measuring stations highlight the importance, significance, and connection of the ICOS-Oceans network to global ocean observational efforts. Figure 3 shows the observational capability of the network and its relevance to the international framework. The necessities highlighted by the international marine observations community are also indicated.
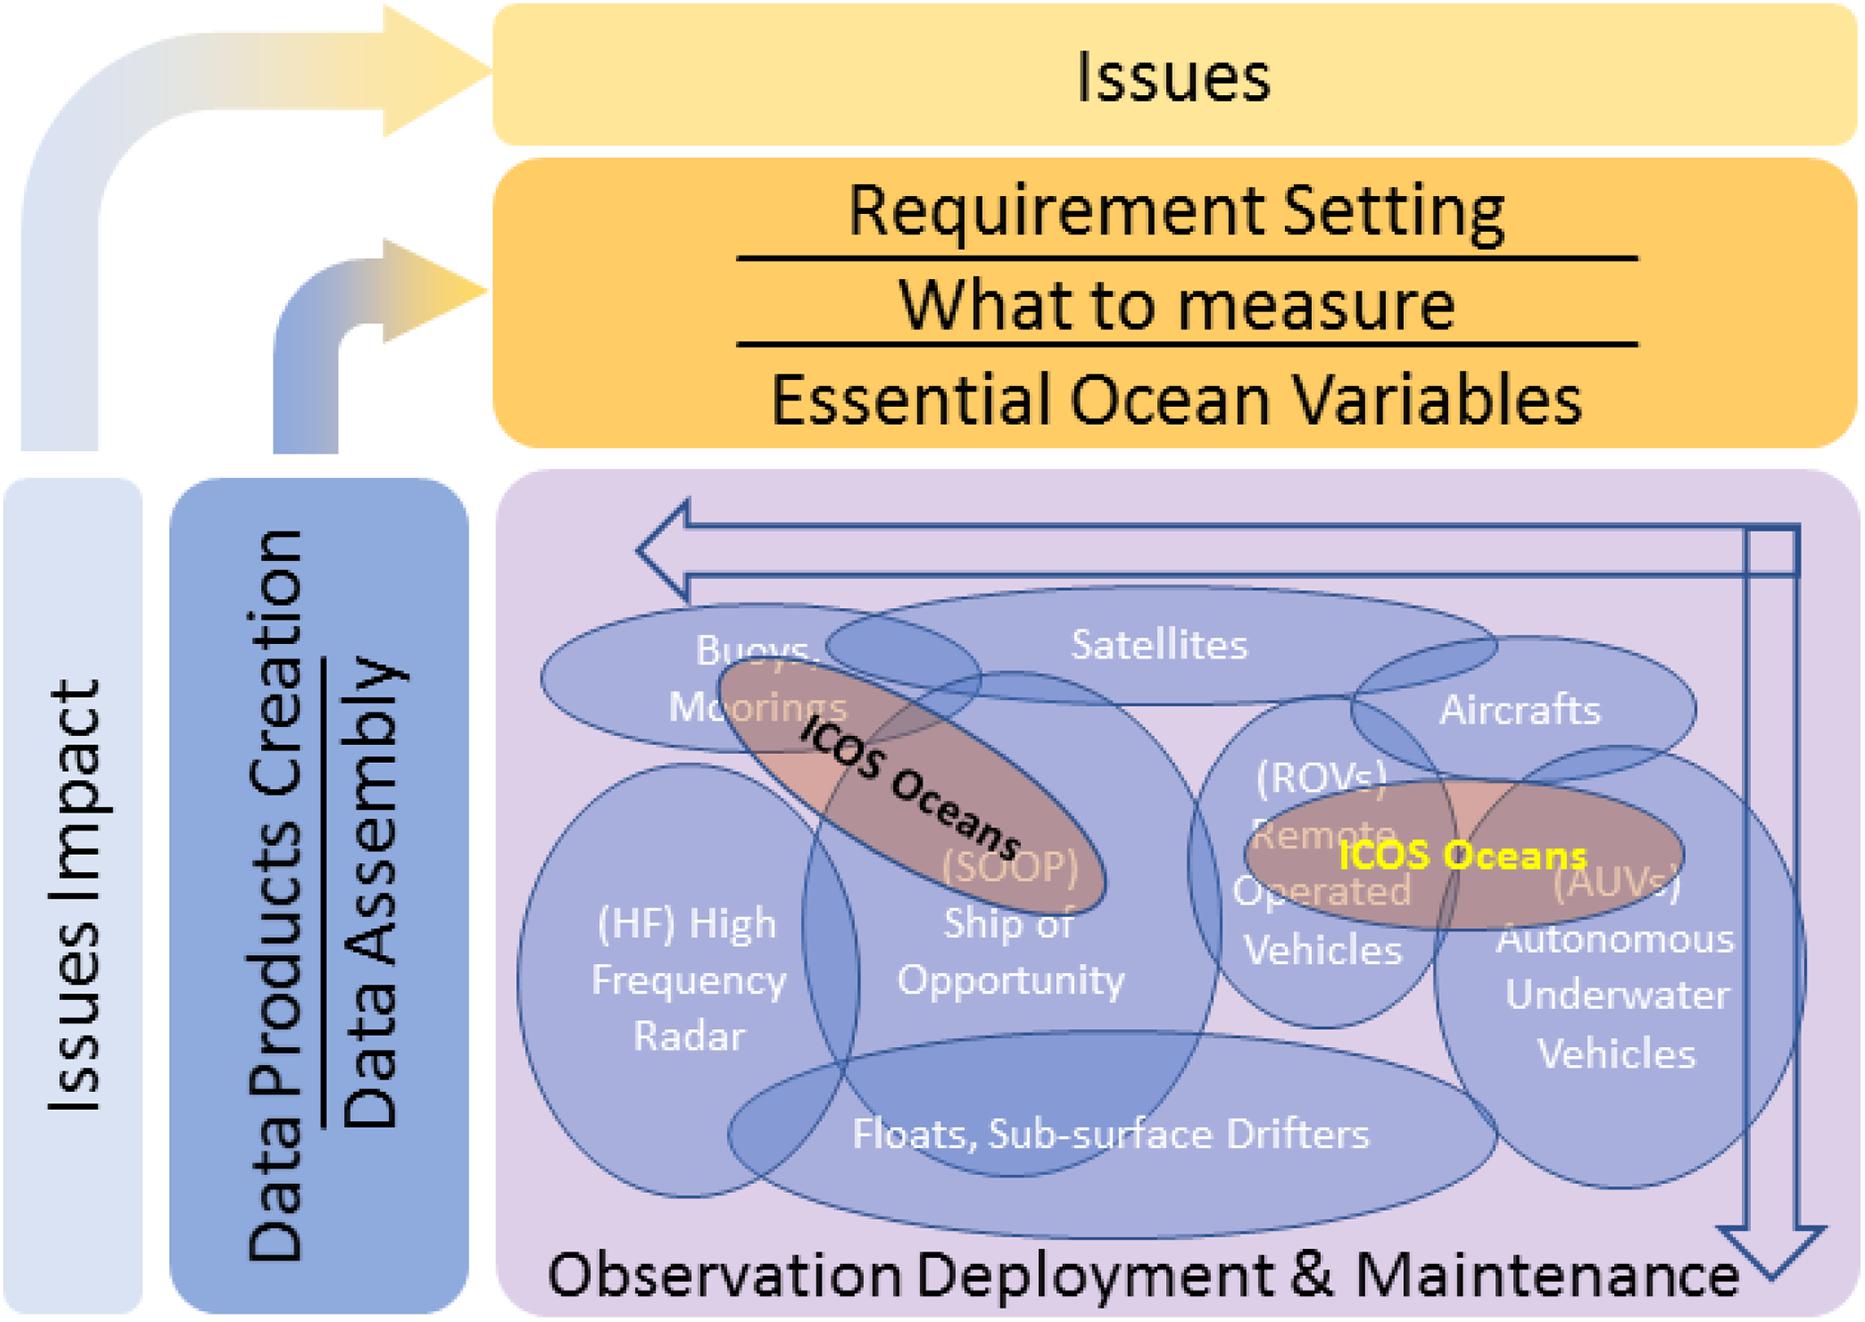
Figure 3. Observational capacity and capability of ICOS in relation with the Global Ocean Observing System (GOOS) Framework for Ocean Observing process (figure was adapted from GOOS; Lindstrom et al., 2012). The black label indicates the current capability of ICOS, and the yellow the future potential (see section “Emerging Technologies”).
The Oceans Network
The Oceans network consists of three entities. The first is the OTC, which is an ICOS central facility and functions as the coordinating body, designed to assist and support the station PIs with their ICOS-related work. The second is the ocean MSA which is the station principal investigator’s (PI) decision body. The third is the observational stations themselves.
The OTC is responsible for supporting the network of marine observing platforms, in collaboration with the CP and the ICOS HO, to deliver the data needed to quantify the role of the ocean in the global carbon cycle and any changes in this. The six major tasks of the OTC are:
(1) Coordination of the marine network and network design. The OTC facilitates forums for communication between the partners, e.g., regular newsletters and information exchange with the marine MSA, and also promotes communication with partners outside the network, e.g., stakeholders, external projects, other research infrastructures, and external data users [such as the Global Carbon Project, the International Oceanographic Data and Information Exchange (IODE) of the Intergovernmental Oceanographic Commission (IOC) of UNESCO, Copernicus, the European Marine Observation and Data Network (EMODnet), and the Surface Ocean CO2 Reference Observing Network (SOCONET)] (Wanninkhof et al., 2019). This ensures wide visibility and use of ICOS data, and enhances the scientific and social relevance of both the Ocean network and ICOS in general. The OTC will also produce and implement a roadmap aimed at helping the MSA to build a robust and optimally structured network. The roadmap will be refreshed annually and be reported on to the MSA. All OTC efforts are reported in the OTC annual activity report.
(2) Training and knowledge exchange. The OTC is responsible for providing training to optimize and standardize the performance of the network, and to promote the exchange of knowledge. The major training activity is an annual workshop, which represents an important meeting point between the instrument suppliers, station PIs and technical staff, and data managers.
(3) Station labeling. The OTC is responsible for both the formal application and data evaluation of the ICOS marine stations. The process is started by applying to become an ICOS-Oceans station. In this first step (see section “Labeling”), the station design is evaluated and the outcome is discussed between the OTC and the station PI. The work toward labeling the stations involves automatic data reduction and QC using state-of-the-art software (QuinCe) developed at the OTC, manual evaluation of the automatic data QC, and the writing of a labeling report on which the ICOS GA bases its decision of whether or not to accept a station into the ICOS network.
(4) Data quality control and management. The OTC operationally produces data streams of the Essential Ocean Variable “Inorganic Carbon,” the core variable of the marine part of ICOS, operational and available through the CP. This is a pivotal mission of OTC and a major undertaking due to the variety of analytical instrumentation used by the marine network. Automated data ingestion, processing, and QC software has been developed by OTC.
(5) Ship Liaison. The OTC has begun a systematic program of engagement with the shipping industry/coastal installations community, with the aim of operating autonomous data collection systems focused on evaluating CO2 fluxes and other GHGs across the air-sea interface. This effort can also support the SOOP community in sustaining and replacing platforms, in particular SOOP lines, via dialog with the shipping industry.
(6) New technology and new platforms. The OTC will encourage collaboration with technology partners in future research grants to identify and exploit new sensors and new platforms.
The OTC is also responsible for developing best practice guidelines and protocols to ensure the high quality of ocean carbon data. The ambition is to provide near realtime (NRT) data, which will be used to assess the oceans’ role in the global carbon cycle and the uptake of GHGs. Furthermore the OTC advocates ocean carbon science in policy and to funding bodies, and speaks for all ICOS ocean stations. It operates in close contact with the MSA chairs to ensure that the needs of the observational community are met. It also represents the ICOS stations in the European and international ocean carbon community.
The MSA consists of all the station PIs, and its main remit is monitoring, developing, and improving the scientific and technical basis of the network. The MSA, together with the OTC, have formulated the operational requirements for the stations, following Standard Operating Procedures (SOPs) established by the marine inorganic carbon chemistry community (Dickson et al., 2007) and adapting them to the network needs where necessary.
Each observational station has its own scientific focus. Most stations existed before ICOS and were established by scientists not only to monitor carbon fluxes, but also to study major marine biogeochemical cycles and their governing processes. This is one of the main strengths of ICOS, as it ensures that the members of the MSA (with its pure observational focus) are also well-connected with the scientific community. Another implication is that ICOS stations can serve as multidisciplinary observational platforms for further research and as validation stations for the development of new observational strategies.
The three entities together provide highest quality data for surface ocean pCO2. The data shown in Figure 4 are from 2017, where the ICOS SOOP network produced nearly 1 million data points in the area north of 30°N. Data gaps due to instrument failure or just lack of SOOP lines (e.g., Mediterranean) are clearly visible. ICOS will help the community to reduce data gaps and establish more SOOP lines to fill the white spots on the ocean map.
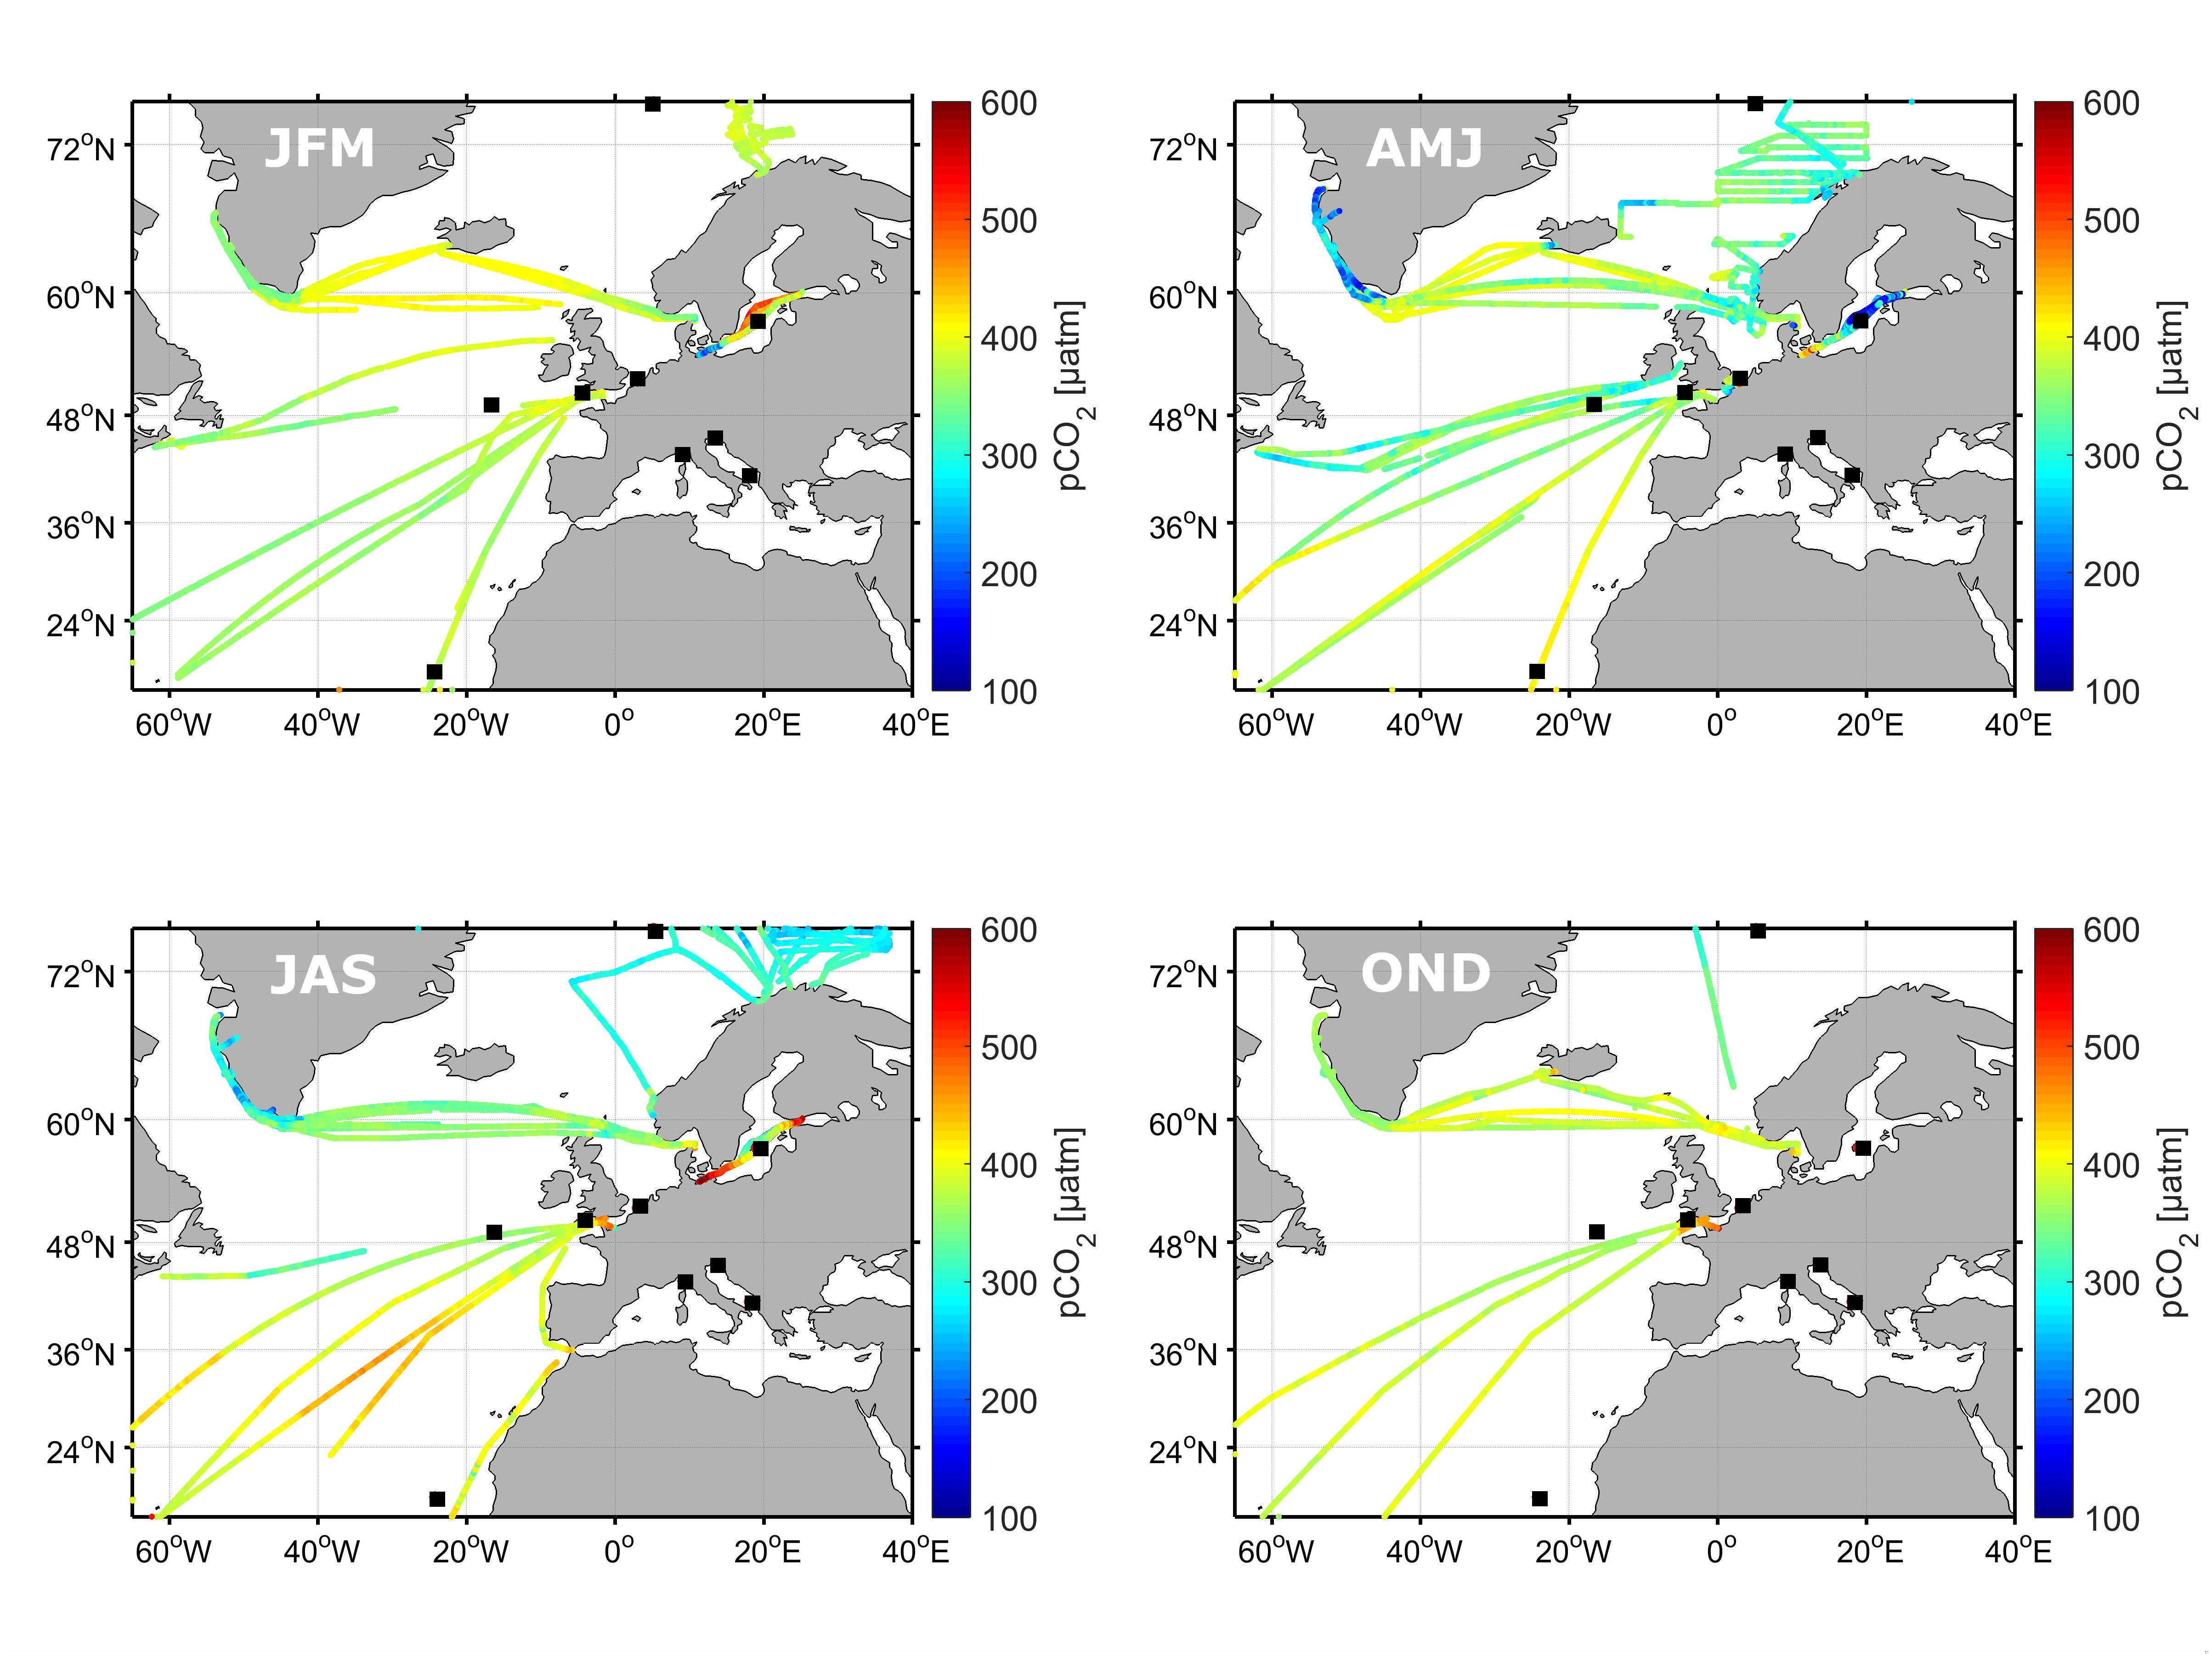
Figure 4. Seasonal pCO2 (e.g., JFM: January, February, March) data generated by the ICOS SOOP network in the year 2017 (data can be downloaded at www.socat.info). The FOS are shown as black squares.
Structure and Operation of the Observational Stations
ICOS-Oceans network includes different types of stations measuring various parts of the marine carbon cycle. Some are contributing to the observation and documentation of air-sea fluxes of CO2 whilst others also add to the understanding of flux variability and its drivers. Presently the core variables for SOOP lines are sea surface pCO2, intake and equilibrator temperature, air and equilibrator pressure. For the FOS, the core variables are pCO2, sea temperature, salinity, and dissolved oxygen. Stations providing these variables with the specified accuracy (an up-to-date version of the ICOS-Oceans labeling document can be found at https://otc.icos-cp.eu) will be classified as “Class 2” stations. If a station provides additional variables (e.g., dissolved oxygen, a second carbon variable) then it can become a “Class 1” station. It is important to mention that both station classes produce the same quality of data. The classification exists in order to highlight to which extent the station, in terms of the variables that it measures, is able to provide the information needed to understand either motivation 1 (for SOOP) or motivation 2 (for FOS), or both.
The requirements are subject to regular revision, recognizing that technical and scientific developments may lead to higher quality measurements, or the measurement of new variables. Independent of the platform, all ICOS data require comprehensive metadata. This is overseen by the OTC to ensure the reliability of the measurements and thus the highest quality data are collected.
Ship of Opportunity Program
In the past, the terms VOS and SOOP were both used for surface water carbon measurements onboard ships. To differentiate clearly between the meteorological observations (VOS) and the work that is done in ICOS, we use the term SOOP. The SOOP stations include commercial ships and research vessels that are equipped with a pCO2 measurement system and auxiliary sensors (seawater temperature, salinity, meteorological sensors). It is worthwhile noting that the accuracy requirements for all required variables are identical for both station classes. For CO2 determination, all of the SOOP stations are equipped with systems that use the same principle: determination of pCO2 in air that is in gaseous equilibrium with a continuous stream of seawater. The maximum level of uncertainty is set to ±2 μatm. This methodology follows international standards (Dickson et al., 2007), ensuring the lowest uncertainty currently achievable. Data reduction techniques follow the requirements of the international community effort (SOCAT; Pierrot et al., 2009; Pfeil et al., 2013; Bakker et al., 2016).
The data from the SOOP network primarily contribute to motivation 1 (CO2 flux quantification), whilst in conjunction with satellite and re-analysis data, they can contribute to main motivation 2 (drivers of flux variability).
Requirements for an ICOS marine SOOP Station include:
1. Calculation of fCO2 based on measured xCO2 and following an approved method and SOP criteria (Dickson et al., 2007).
2. Making quasi-continuous CO2 measurements, not analyses of discrete samples.
3. Using a flow-through equilibrator system to measure xCO2 in its headspace gas.
4. That QC, equivalent to the two highest SOCAT QC flags (fCO2 accuracy better than 2 μatm), is deemed acceptable and includes cross-over analysis where possible (Pfeil et al., 2013; Wanninkhof et al., 2013).
Furthermore, metadata are required to be submitted with the data, including:
1. Region and time of measurements.
2. Proof of the calibration of the CO2 measurements by regularly measurement of at least two non-zero gas standards traceable to World Meteorological Organization (WMO) standards.
3. Description of core variable calibration including regular recalibration of different sensors used.
On one of the SOOP lines of the network (Baltic SOOP, Baltic Sea), continuous measurements of surface methane partial pressure is established using detection by off-axis cavity enhanced output spectroscopy (Gülzow et al., 2011, 2013), serving as a pilot study for the network.
Fixed Ocean Stations
The FOS include open ocean stations (they might be reasonably close to the coast but are far enough away, and in sufficiently deep water, that coastal interaction is not significant), coastal stations, and benthic stationary platforms. In situ pCO2 sensors, which are commercially available and based on membrane equilibration technology, are most commonly used here. Alternative options that include calibration gases and a different equilibration method are limited, and none of the ICOS FOS stations are equipped with such in 2019. A number of studies and intercomparison exercises indicate that the systems presently in use are not as stable as those used for the SOOP stations, and for this reason the pCO2 performance criterion has been relaxed to ±10 μatm. As for SOOP, two station classes have been defined for FOS.
A FOS usually consist of a surface buoy with attached instruments or sensors performing continuous carbon measurements in the ocean and lower atmosphere, and/or a sub-surface mooring measuring continuously at one or more depths. FOS can also be ship-based when discrete measurements are conducted from a fixed location. Distinction between coastal and open ocean is, in addition to the distance from land, based on habitats, light penetration, nutrient availability, processes (e.g., dense water formation at the shelf and deep open ocean), tidal fronts, and river runoff. For fixed stations, inorganic carbon variables and hydrography are primarily measured, but a wide range of measurements can be performed either using discrete sampling with post-sampling analysis, or by use of autonomous sensors (e.g., Wanninkhof et al., 2013; Coppola et al., 2016), IOCCP Instruments and Sensors directory2). Sampling procedures follow the GO-SHIP manual for discrete data and (Hood et al., 2010; Lorenzoni and Benway, 2013; Wanninkhof et al., 2013) for sensor-based data. Some of the FOS (especially the ones that are located in the open ocean) determine pCO2 and other variables at several depths in addition to the surface, and thus provide information of the vertical structure in the upper water column. This enables an extensive investigation of the air-sea fluxes and the drivers’ variability. Thus, data from the FOS contribute to both main questions (flux calculations and drivers of its variability).
Requirements for ICOS FOS, using discrete samples and/or continuous measurements (class 1 and class 2), include:
1. Following approved methods and SOP criteria (Dickson et al., 2007) when measuring two out of four carbonate variables (dissolved inorganic carbon (DIC), alkalinity (TA), pH, and pCO2).
2. Proving in situ calibration of pCO2 by measuring at least one non-zero gas standard traceable to WMO standards, or, at minimum, discrete samples at the start and end of deployment.
3. Performing an appropriate secondary QC [for example GLODAPv2, SOCAT, alkalinity-salinity relationships, multi linear regression (MLR)].
Furthermore, required metadata need to be submitted with the data, including:
1. The documentation of regular calibration of the instruments.
2. A complete description of core variable calibration.
3. A detailed description of sampling and sample handling.
As of 2019, the main observational platforms of the ICOS network are SOOP lines and FOS. Two other approaches (direct flux measurements and repeat hydrography sections) are under development. While the direct flux observations are close to being included into the ICOS data flow, the inclusion of the repeat sections is still under discussion.
Marine Flux Towers
Direct flux observations deliver directly to motivation 1 [“Quantifying CO2 (and other GHG) fluxes”] of the ICOS network motivation. While SOOP and FOS stations calculate the CO2 flux based on the pCO2 difference between the atmosphere and the ocean, micrometeorological measurements using eddy covariance (EC) data are based on a direct measurement of vertical gas fluxes, but the stations and data need careful QC for reliable estimates (McGillis et al., 2001; Rutgersson et al., 2008). The prerequisites for EC measurements in marine environments are somewhat different than in terrestrial environments, and thus special labeling is required that will need an exchange of expertise between the ocean and ecosystem domains. Flux towers are predominantly situated on shores or in near-shore regions, with varying degrees of terrestrial influence. Data from different stations will therefore be grouped according to the expected level of terrestrial influence:
1. Group 1: Flux footprint represents open-sea conditions, and land influence is limited to conditions with meso-scale circulation systems (e.g., upwelling, sea-breeze circulation).
2. Group 2: Flux footprint represents “coastal zone” with heterogeneous properties.
3. Group 3: Flux footprint represents shore area and is highly active in terms of the carbon cycle.
Flux measurements can also be performed on ships, but this requires additional analysis of motion correction and flow distortion (McGillis et al., 2001; Miller et al., 2010; Landwehr et al., 2014; Prytherch et al., 2015; Butterworth and Miller, 2016). If EC data taken from moving ships are to be introduced in ICOS, a common methodology for motion correction will need to be developed. At current, only one EC flux tower is maintained within the ICOS-Oceans network, which is located on the island of Östergarnsholm in the central Baltic Sea.
Requirements for ICOS marine flux towers (MFT) (class 1 and class 2):
1. Stations should be visited on a regular basis (monthly) and instrumentation must be cleaned.
2. For stations with high salinity and large amounts of sea spray, the CO2 flux-system signal should be dried. For a non-dried system, station PIs should provide data showing this is not necessary.
Furthermore, metadata need to be submitted with the data, including:
1. A description of flux system calibration.
2. Details on data processing, required corrections, and quality.
Repeat Sections
Discussions are currently underway to incorporate these invaluable data into ICOS, and the OTC is working toward making data from repeat hydrography sections (e.g., GO-SHIP, Sloyan et al., 2019, this issue) available to the marine network for validation and verification purposes. Repeat sections are performed at least once per decade using research ships equipped with advanced high precision systems, in particular, following Dickson et al. (2007) for seawater CO2 chemistry analyses. These are typically conducted on-board on water samples collected with a CTD rosette, and sampling covers the full depth of the water column. This allows accurate measurements of carbon and transient tracers, such as CFC-12 and SF6, required for the estimation of contemporary and anthropogenic carbon storage and transport. Calibration of the measurements is performed using reference material as described by Dickson et al. (2007). Criteria for data analysis shall follow the GO-SHIP manuals (Hood et al., 2010), and crossover analyses are useful for verifying the accuracy of the data (e.g., Key et al., 2015; Olsen et al., 2016).
Data from repeat hydrography sections would clearly contribute to the main motivation 2.
The proposed requirements for ICOS marine repeat sections include:
1. Following approved methods and SOP criteria (Dickson et al., 2007) when measuring two out of four carbonate variables (DIC, TA, pH, pCO2).
2. The provision of complete metadata, including description of core variable calibration.
3. Proving regular calibration of the instruments.
4. Covering full depth of the water column.
5. QC control performed, equivalent to secondary QC routines in GLODAPv2 (Olsen et al., 2016).
Labeling
One of the fundamental aims of the OTC is to bring the European marine station network to an operational state with fully standardized and verified procedures throughout. While the community has agreed upon a set of SOPs that outline how specific measurements should be conducted with a required accuracy, and procedures for data reduction (Dickson et al., 2007; Pierrot et al., 2009), it has been largely a matter of trust that each station is implementing them to a sufficient standard. The ICOS station labeling ensures that each station is built and maintained to the specifications defined in the labeling documents and thus following internationally agreed SOPs, which is the basis for producing high quality data sets in the future.
The basic process of the station labeling is illustrated in Figure 5. The very first step in becoming an ICOS station is that the national network suggests the station to focal point of the national ICOS network. This is an important step, as the participating member state needs to cover the cost of the station contribution for participation in ICOS. The next step is based on the metadata for the station, collecting details of the instrument’s construction, the sensors used, and the maintenance and calibration schedule of the instruments. These assessments ensure that the station is capable, at least in theory, of producing data of the quality required by ICOS. If a station does not meet these requirements, ICOS OTC provides advice on the improvements needed in terms of physical changes to the instrument and/or operating procedures.
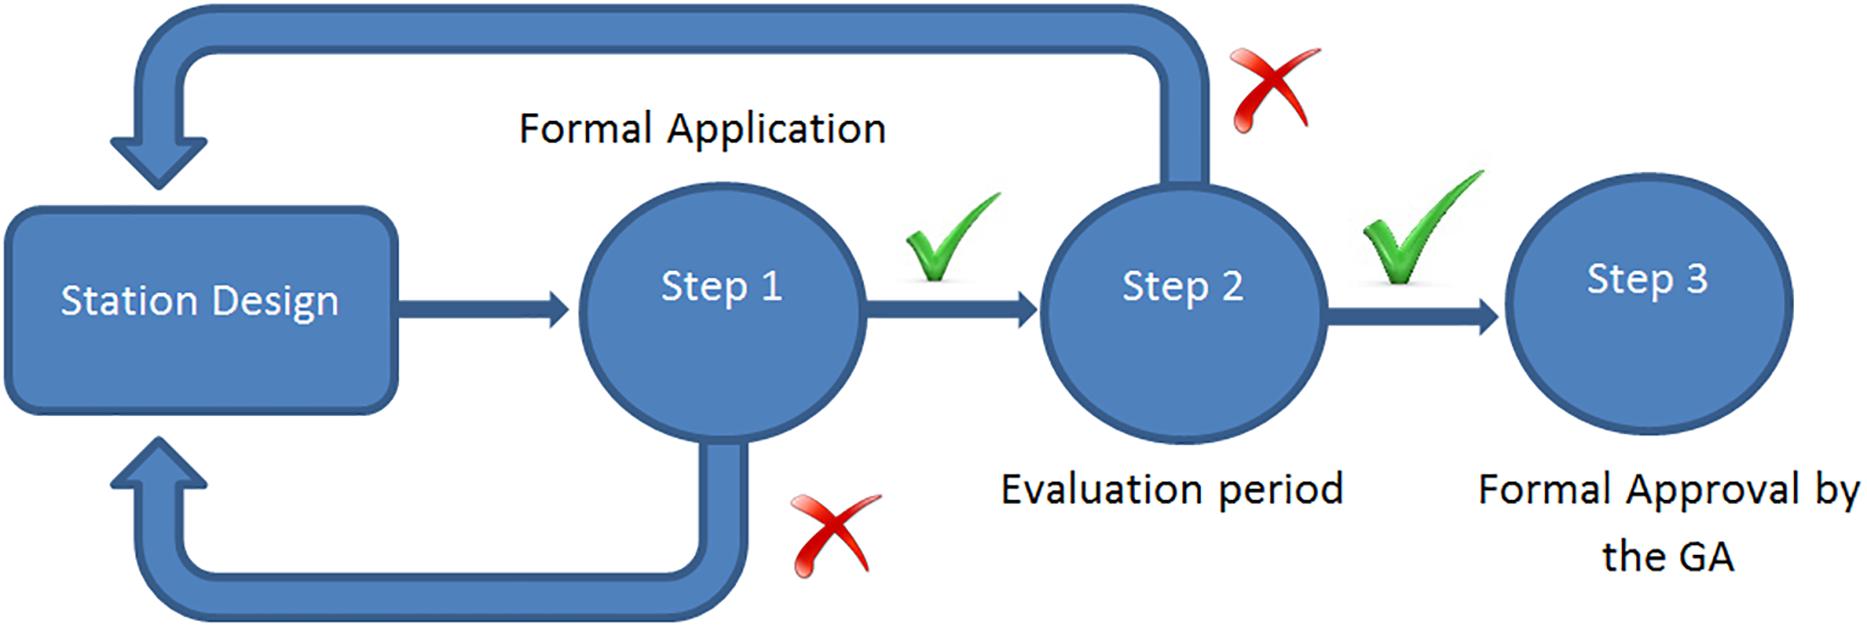
Figure 5. ICOS labeling process. This process is common for all domains. Green ticks indicate that the step is successfully completed, while red crosses indicate that there are issues that need to be addressed before proceeding to the next step.
Step 2 of the labeling process involves examining the data themselves. The station must provide at least 4–6 months of raw data (as it is collected from the instrument, with no processing performed). This is processed by an OTC expert using standardized data reduction and QC tools (see section “Data Life Cycle”). The results are examined to identify poor data that indicate either that the instruments are poorly configured or are excessively vulnerable to failure. This involves extensive interaction with the station PIs to maintain full transparency of the assessment process and to ensure that the characteristics of each station are fully understood to avoid unusual-looking data being falsely flagged as being of poor quality. If an unacceptably large proportion of the data is deemed to be of bad quality, the OTC and station PIs will enter discussions to determine how to best improve their instruments and installation and therefore increase the data reliability to the required level. Once the changes have been made, a further period of data (of a length determined by the seriousness of the problem and the minimum volume of measurements required to be satisfied that the issue has been resolved) must be submitted and examined before the station can pass step 2.
Once both labeling steps have been passed, the station’s details are passed on to the ICOS GA for official registration as an ICOS station. All 21 ICOS-Oceans stations passed Step 1. Currently eight stations are in Steps 2 and 5 are labeled ICOS stations after they passed Step 3. For updated information about the labeling process please see https://meta.icos-cp.eu/labeling/.
Examination of ICOS stations does not stop once labeling is complete. Every data set submitted to ICOS by a station is checked by an expert within the OTC to ensure that the quality of the data is being maintained. The hostile environment in which oceanic stations operate means that short-term periods of poor data and instrument failures are inevitable, but the expert reviews can help identify issues that may or have become longer term issues. Advice on the best way to mitigate these issues can also be provided. This can be aided by communication and knowledge sharing between stations across the whole network, facilitated and encouraged by OTC. The OTC will also continually ensure that stations are adhering to the recommended maintenance and calibration schedules.
Data Life Cycle
Labeled stations submit their data to ICOS where they are processed using a standardized workflow. This ensures that all data are subjected to the same community-approved processes and QC routines to produce consistent and fully reproducible outputs for all data. This workflow is shown in Figure 6, and described in detail below.
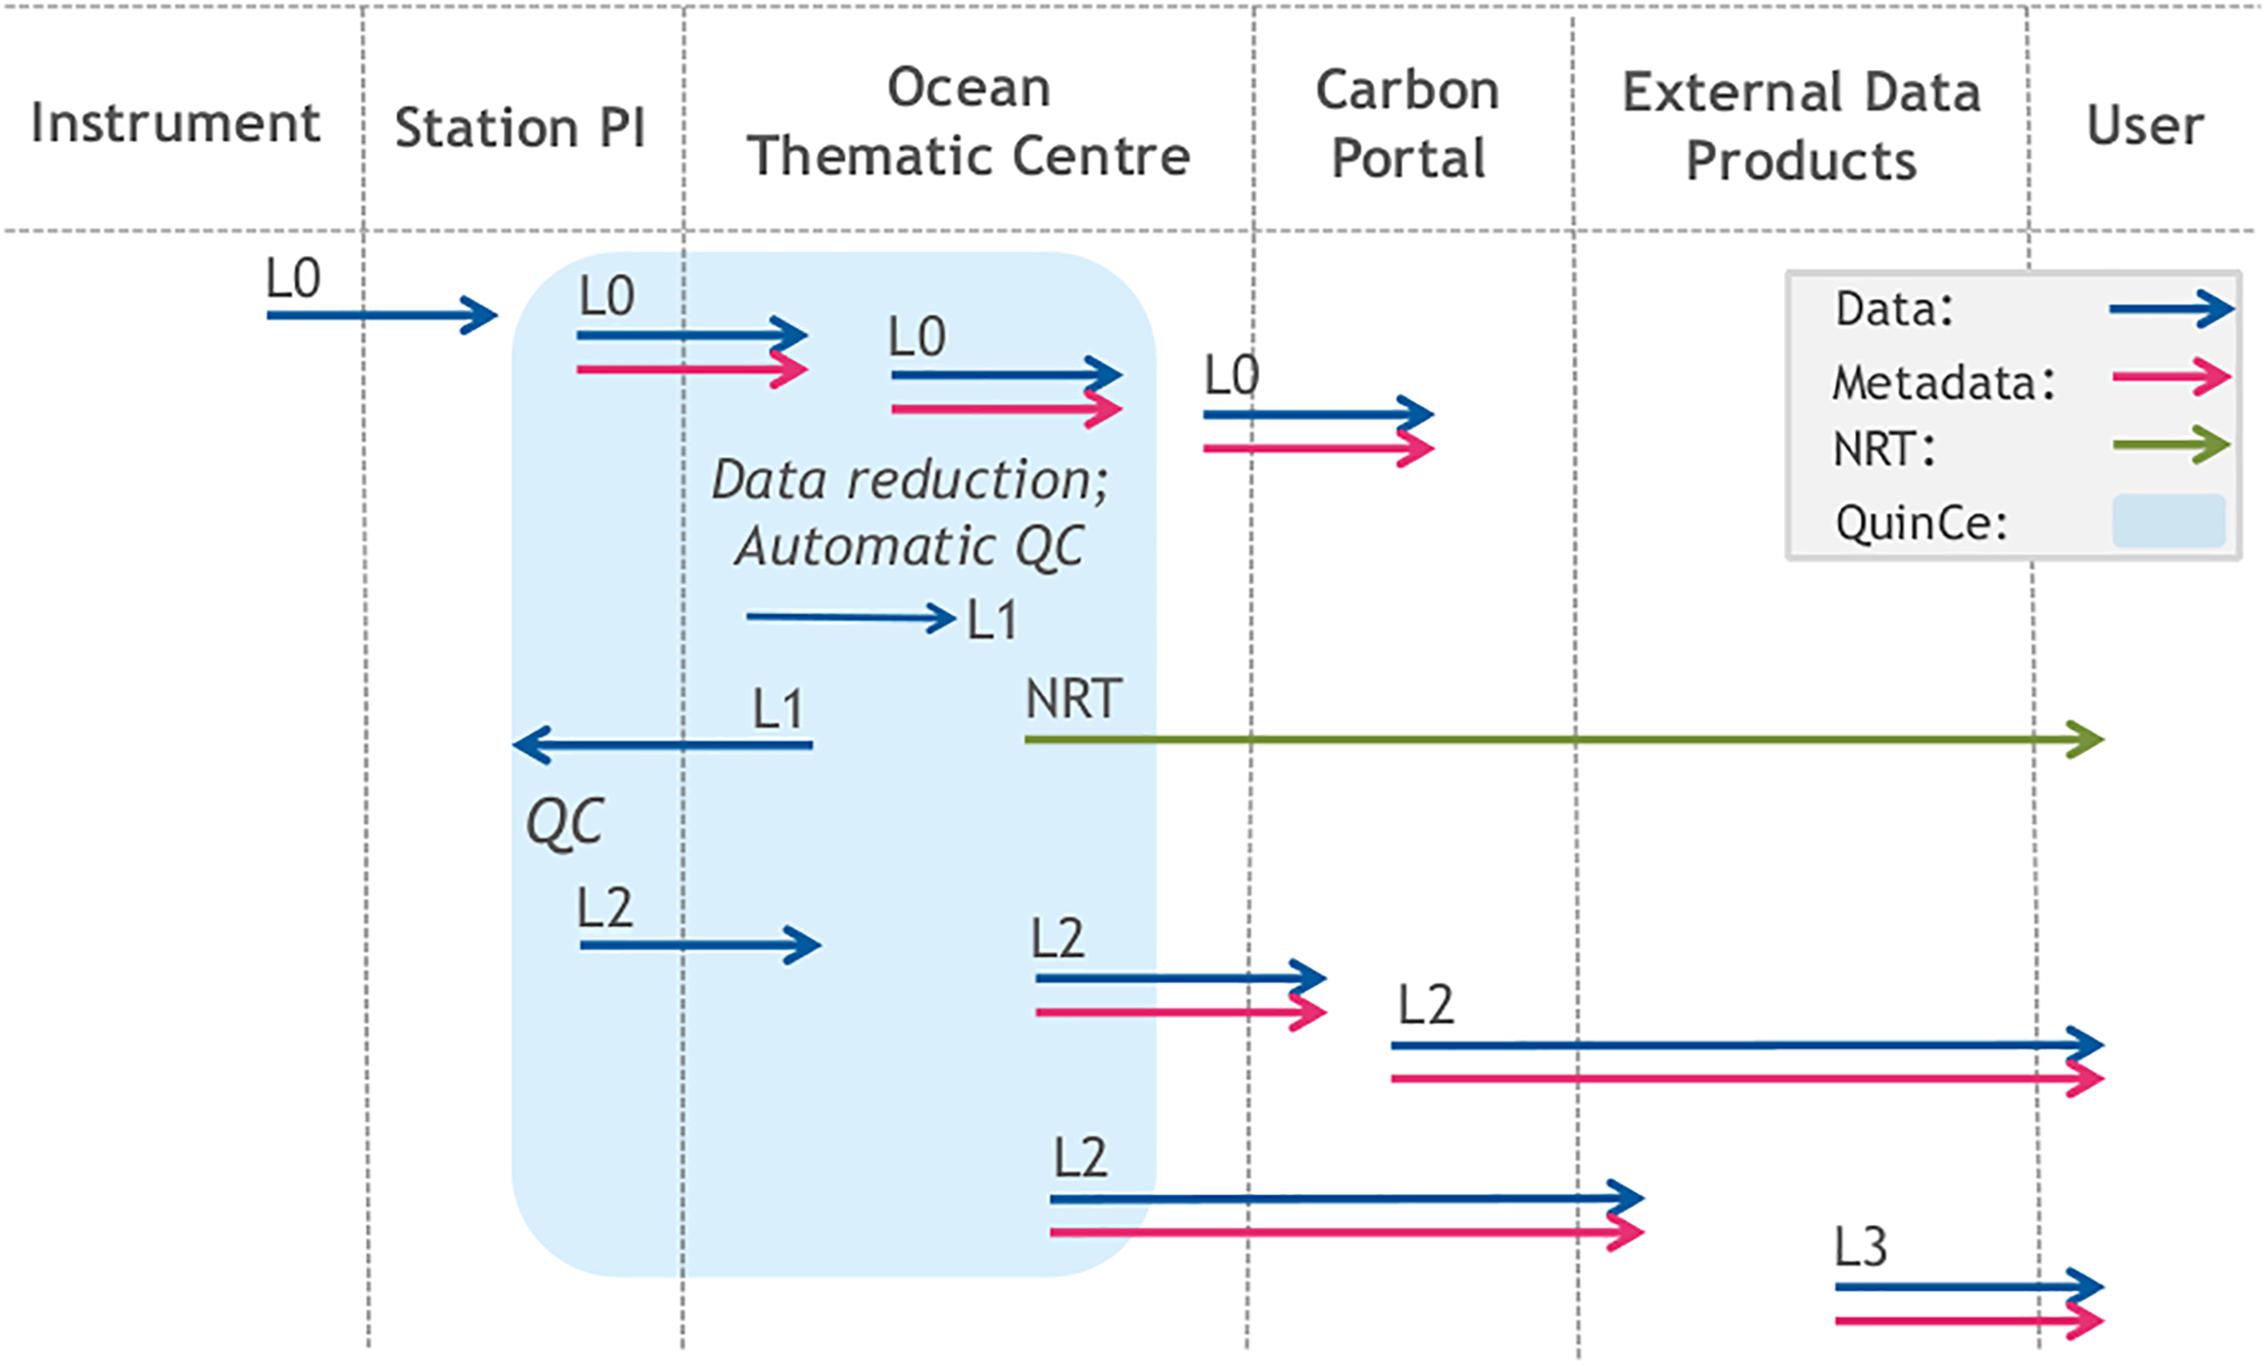
Figure 6. ICOS OTC Data life cycle, showing flow of data (blue arrows) and metadata (red arrows) between instrument, station PI, OTC, CP, producers of external data products, and final users, for Level 0 through 3 and NRT data. The processes in which the automated data QC and data reduction technique QuinCe is involved, is shown as a light blue shading.
Data processed through ICOS OTC go through the data lifecycle in a number of stages, each of which is referred to as a different level. Raw data taken directly from instruments (before any processing is performed) is termed Level 0. They are submitted to the OTC using QuinCe, an online data processing and QC tool developed by OTC, and data are immediately archived in the CP. All data are archived at each stage of processing to ensure full provenance, traceability, version control, and compliance with FAIR data treatment practices (Wilkinson et al., 2016):
Findable:
F1. (meta)data are assigned a globally unique and eternally persistent identifier.
F2. data are described with rich metadata.
F3. (meta)data are registered or indexed in a searchable resource.
F4. metadata specify the data identifier.
Accessible:
A1 (meta)data are retrievable by their identifier using a standardized communications protocol.
A1.1 the protocol is open, free, and universally implementable.
A1.2 the protocol allows for an authentication and authorization procedure, where necessary.
A2 metadata are accessible, even when the data are no longer available.
Interoperable:
I1. (meta)data use a formal, accessible, shared, and broadly applicable language for knowledge representation.
I2. (meta)data use vocabularies that follow FAIR principles.
I3. (meta)data include qualified references to other (meta)data.
Reusable:
R1. meta(data) have a plurality of accurate and relevant attributes.
R1.1. (meta)data are released with a clear and accessible data usage license.
R1.2. (meta)data are associated with their provenance.
R1.3. (meta)data meet domain-relevant community standards.
QuinCe then performs all necessary data reduction calculations according to internationally agreed standards (Dickson et al., 2007; Pierrot et al., 2009), and automatic QC to identify potential problems in the data. The resulting Level 1 data are also sent to the CP to be archived, and also published as NRT data, allowing early access to the data for users with time-sensitive data needs (full access to the NRT data will be provided on request with the understanding that they have not been fully quality controlled and may contain errors). For those stations that transmit data in real time to shore, this process from Level 0 upload to Level 1/NRT will be fully automated, providing the fastest possible data availability while simultaneously reducing the workload of the PIs.
The Level 1 data are further quality assured and controlled by the station PI’s, who can accept or reject the results of the automatic QC and perform their own additional QC using their expert knowledge of the characteristics of the carbon system measured at their station. The QCed data will be sporadically checked by the OTC in order to guarantee the high quality of the ICOS data. This will involve extensive dialog with the PI to understand the specific nuances of their data. Once the OTC expert is satisfied, they submit the fully processed data to the CP for final publication as Level 2 data. After this step has been fulfilled, the Level 1 data are no longer accessible through the standard data access interfaces, but remains in the archive for traceability.
The published Level 2 data sets are incorporated into data products (e.g., SOCAT, or the Global Carbon Budget by the Global Carbon Project; Le Quéré et al., 2018), and will be used toward the motivations stated earlier. Furthermore, the data can be used in further scientific research (e.g., as input to, or ground truthing of, models or satellite observations). The ICOS CP provides facilities for publication of ‘elaborated’ data products, such as flux maps, as Level 3 data, with full provenance links back to the original Level 2 datasets to ensure that proper credit is given to the original data providers. Users creating these Level 3 products are able to contact the PIs through the OTC to discuss aspects of their data sets and to report any possible problems with the data that may need to be corrected. This dialog allows Level 2 datasets to be corrected accordingly and new versions published.
Added Value of the Icos-Oceans Network
Network Optimization
The ICOS-Oceans network is already established in a very wide spectrum of marine environments, from the very active and diverse coastal regions to open ocean areas (large reservoirs), but also from polar areas to equatorial environments. This already provides a good and solid backbone for the network, as it allows fulfillment of the motivations of the network and additionally allows studies on the sensitivity of large carbon reservoirs and ecosystems to anthropogenic forcings and to changing conditions.
However, it needs to be acknowledged that most of the ICOS-Oceans stations have been operating prior to the formation of ICOS and that they were established for project-related research, and hence generally only have finance funded for the duration of the project(s). However, this financial and operational model is not sustainable. On top of that, the geographic distribution of the network is based on the nations that have signed up to the ICOS ERIC, and additionally on each nation’s decision on which station(s) to nominate. Such a distribution might not be in full accordance with the ICOS-Oceans network’s main motivations (see section “Introduction”) and hence the preferred spatial coverage. In reality these are not optimal conditions for network design. However, the existing network is functional and possesses a great degree of integration and operational capacity. For the latter, significant credit has to be awarded to the determination of the European Marine Carbon Observation community that has built upon the achievements of many EU and nationally funded research projects and advocated for the inclusion of ocean observations in ICOS.
It also needs to be recognized that one of the strongest features of ICOS is that it was developed within the ERIC platform. Within this framework, each member state is committed to support the high quality operation of stations over a long period (each country is free to determine the support level for its stations). To make this possible, a number of stations were overhauled and upgraded so that they can operate according to the ICOS standards. This fact, in conjunction with the structure of ICOS (interaction between HO, Research Infrastructure Committee, GA), gives the opportunity for the networks (domain, national) to have an additional communication line with the funding agencies, highlighting successes and advocating their needs. In this way, national funding bodies can have a more integrated view of the network, realize its operational status and identify its strengths and possible bottlenecks. This also allows funding bodies to evaluate more efficiently the importance of a strategic design of a research observation network and gain feedback of the added value obtained by their commitment and investment.
The network can benefit from a direct link between its governing and operational bodies (i.e., the station PI’s and the stake holders). Tools like integrated data analysis, use of modeling products, and assessment of new technologies (e.g., intercomparison exercises, new platforms, see section “Tools for Network Development”) will highlight geographical and operational gaps and can suggest where best to distribute and allocate resources.
On a more practical and technical level, the development of tools like QuinCe (see section “Data Life Cycle”) strengthens this even more and enables automatic submission of data to the ICOS CP (and thus other data activities, e.g., SOCAT, Global Carbon Project). This will reduce the effort and time needed to publish datasets, and the ability to accept and automatically process near-real-time data and additionally assist in the identification of technical issues with the station. Streamlining these processes is becoming ever more important as demand for high quality, near-real-time climate data grows. Both OTC data engineers and station PI’s are actively involved in the QC process throughout the data lifecycle and constantly evaluate both a station’s performance and providing feedback for QuinCe.
Stronger Community Voice and Impact
ICOS provides the opportunity for the European marine carbon community to strengthen communication lines with marine science policy and with decision-making bodies, and maximizes the societal impact of the network. This is achieved through interaction with ICOS bodies including a dedicated ICOS communication service.
The operation of the CP and the dissemination and publication of data in a large, globally visible, open access database multiplies its scientific impact.
It is expected that ICOS-Oceans will have a central role in shaping a sustained global marine carbon system and GHG observation network. ICOS OTC has a leading role on the discussions to harmonize data formats and data QC, and ensures that metadata requirements are aligned with international activities such as the NOAA Ocean Acidification Program, SOCAT, and the United Nations Sustainable Development Goal 4.3 on ocean acidification.
Integration and Collaboration Across the ICOS Domains
ICOS is one of the first Environmental ERICs to be established and one of the few that covers all environmental domains. To a great extent this is a response to society’s demand for better and more reliable information on the carbon cycle. ICOS wants to achieve this via observations in all three domains (oceans, atmosphere, and terrestrial biosphere) and stimulating interaction and synergies between them. In particular, the enhancement of cooperation between the oceanic, atmospheric, and terrestrial ecosystem domains and research groups within ICOS and consequently throughout Europe will result in more robust scientific results and help to identify gaps in carbon budgets (e.g., Le Quéré et al., 2018).
The three domain networks are already operating under the same basic principles (structure, labeling, data policy), highlighting the integrated nature of the network. Furthermore, the domain TCs have already identified scientific and operational areas for enhanced collaboration and integration. Some examples are the supply of high quality CO2 reference gases by the ICOS central calibration facility (CAL) to the ocean network, attempts to perform high quality atmospheric measurements on-board SOOP stations (currently tested through collaboration between the Oceans Network and the ICOS ATC), and the assistance and knowledge exchange between OTC and ETC on EC measurements at coastal stations, which can potentially evolve into high quality direct CO2/GHG fluxes calculation on-board SOOP lines.
Additionally, the next integration level will be to identify more synergies and interaction between the stations of different domains. An example might be to cluster a coastal FOS, an atmospheric mast, and an EC tower, which are all located within a specific distance, and attempt to identify boundaries and footprints, and combine/compare measurements and fluxes.
ICOS-Oceans in the International and European Ocean Observations Landscape
To our knowledge, ICOS is one of the few networks (if not the only one) that has accrued a status as a legal entity. ICOS-Oceans represents an active part of the marine carbon community and is therefore strongly involved in established groupings, efforts, and actions, such as SOCAT, GLODAP, and GO-SHIP. It builds upon the existing research effort and strives toward harmonizing methodologies and practices. Within that spirit there is ongoing dialog between ICOS-Oceans and international ocean observational groups such as the SOCONET, the Global Ocean Acidification Observation Network (GOA-ON), and the Global Ocean Observing System (GOOS, EuroGOOS).
The ICOS OTC also cooperates with the International Ocean Carbon Coordination Project (IOCCP) on the strategic design and coordination of activities to facilitate the evolution and enhancement of globally acceptable strategies, methodologies, practices, and standards for marine carbon research.
On the European level, ICOS is a strong member of the ENVRI community. Within ENVRI, synergies between the research infrastructures can be identified, and cooperation and collaboration between networks can be established. More specifically, there is ongoing and fruitful interaction between ICOS-Oceans, EMSO, Euro-ARGO, and LifeWatch, both in terms of co-location of stations and the exchange of scientific and technological expertise and data management methodologies. ICOS-Oceans follows the developments of initiatives and projects such as JERICO, DANUBIUS, and LTER, but also communities like FerryBOX in order to maximize cooperation and identify complementing scientific and operational pathways.
Integrated Carbon Observation System is active in the Group of Earth Observations (GEO) initiative, hence there is an opportunity for the ICOS-Oceans and the marine carbon research community to promote its own ocean carbon programs and activities for inclusion into globally integrated Earth system observing networks.
Tools for Network Development
Evolving Network Design
In order to respond adequately to the motivations of ICOS-Oceans (see section “Introduction”), an optimal network is needed. As mentioned in Section “Added Value of the ICOS-Oceans Network,” the ICOS-Oceans network is based on an opportunistic approach and the willingness of countries to contribute to such a network. The network needs to be improved with regard to its spatial and temporal coverage and additional variables should be considered for inclusion. Obvious improvements are additional SOOP lines (e.g., in the Mediterranean Sea) to improve spatial resolution. An important step forward will be the development of a carbon flux map for the European shelf seas in order to both identify any existing gaps in the network and regions that are overdetermined and that might be used as reference regions. These data can also be evaluated for use with atmospheric inversions (e.g., Rödenbeck et al., 2015). At least each biogeochemical Province (Longhurst, 2007; Oliver and Irwin, 2008) should be covered by a FOS. Furthermore, additional variables should be included in the future. These could be variables that give additional information about the carbon system [e.g., discrete sampling on SOOP, δ13C(CO2) measurements], or variables that allow a broader understanding of the marine system (e.g., N2O, CH4, nutrients) in certain regions. Additionally, the ICOS HO is active on the expansion of the network in all domains and works closely with all TCs to identify network gaps, hotspots, and expansion opportunities. It needs to be mentioned that OTC is targeting scientific groups and communities, while the HO can be more influential on funding bodies.
Emerging Technologies
The adoption of new technology is necessary to continuously improve the network and to future proof it. This includes additional observational approaches (e.g., direct flux measurements, see above) and novel instrumentation. The basis of the network was designed by the community through ICOS PIs. Emphasis was given to the quality of the measurements and the robustness of the observational methodologies, and these are the main criteria for selecting specific instruments and setups. The OTC and the MSA are investigating developments in analytical technology and measurement practices, in order to identify when new systems are reliable and suitable for their implementation in ICOS stations.
It is also evident that the inclusion of continuous, frequent, and reliable data for all relevant carbon variables is desirable for the ICOS-Oceans network and has been endorsed by the OTC, the HO and the CP. Currently, the instrumentation for pCO2 measurements can be considered mature and readily available (Pierrot et al., 2009). For in situ pH determination, the technology is becoming more mature, with commercial sensors and systems becoming available (Martz et al., 2010; Bresnahan et al., 2014; Rérolle et al., 2018). It has yet to be proven that these sensors fulfill the tight criteria required for using pH data to constrain the marine inorganic carbon system over the long deployments that are typical at the ICOS-Oceans stations. Analytical systems for in situ determination of DIC and TA are gradually being developed (Li et al., 2013; Wang et al., 2015) with the promise of elevated reliability in the near future (up to 5 years). Additionally, the technological development of the next generation of laser-based detectors is maturing, and their integration into alternative observational platforms such as ASVs, gliders, and profiling floats (Fiedler et al., 2013) is planned. Such new platforms and innovations will complement and enhance the current network by increasing spatio-temporal coverage and fill important data gaps. It is important to stress that the ICOS-Oceans network is perfectly suited to evaluate these sensors by providing established platforms delivering high quality carbon data.
Strengthen Engagement With the Marine Industries
The success of the ocean observing system relies on collaboration with and engagement by the marine industries. Half of the ICOS SOOP stations are located on commercial ships, so it is self-evident that the relationship with the maritime industry is a priority. There is a specific role for this activity within the OTC (a maritime industry liaison officer is located at NOC, United Kingdom), so that this collaboration is enhanced. Planned activities include meetings between the active members of the ICOS-Oceans observing community and the marine industries, with the aim to further strengthen and expand the network. At the same time, the marine industry landscape is evolving, with new infrastructures being developed (e.g., wind farms, ocean energy parks). Thus, it is beneficial to all parties to promote collaboration and synergies between the oceans network (especially coastal fixed stations) and operating companies.
Conclusion
The ocean component of ICOS is the first multi-national effort within the marine community for standardizing marine CO2 observations from the single measurement, to data reduction, to final data products. The idea and effort in harmonizing marine CO2 observations is not new; ICOS is formalizing this effort, with stations obliging themselves to follow agreed protocols. The compliance of the protocols is monitored by the OTC, so that problems at single stations can be identified at an early stage and necessary steps can be undertaken to guarantee the high quality of the ICOS carbon data. The common data reduction and QC tool (QuinCe) is at the final development stage, which will enhance the data QC and problem identification significantly. Already, though, it has been put into action and as a result 5 stations have completed step 2 of the labeling procedure and received official ICOS Class 1 status.
The network is constantly evolving, and an important part of this is to reflect on the challenges and the drawbacks that came up and still need to be addressed. Issues like harmonizing the labeling procedures for different type of stations (e.g., open ocean vs. coastal) and the spatial gaps (the network in 2019 is still unbalanced to the North Atlantic Ocean) of the network (network design) are still under discussion within the ICOS-Oceans community. As a network, ICOS-Oceans has the capacity to address these challenges and find the answers to overcome them. Currently, the funding status for a number of stations is not sustainable, as the operational funds are either not adequate (or non-existent) to allow the station to operate at the ICOS high standards. But the direct connection from the station PI through the OTC to the stakeholders gives a great opportunity to secure the high scientific quality of the data and the long term stability of stations. Thus, they can serve as multidisciplinary observational platforms for further research, and as validation stations for the development of new observational strategies.
Finally, it needs to be acknowledged that, despite the challenges, the operational capacity of the network is strong. The dedication of the ICOS-Oceans PIs, the scientific and managerial competences of the OTC and the potential impact of ICOS ERIC are a good basis for its success.
Author Contributions
All authors have made a substantial contribution to the data analysis, and commented and approved the manuscript. TSt, TG, BP, SL, and SJ drafted the manuscript.
Funding
In order to develop and maintain ICOS-Oceans, funding was received from the German Federal Ministry of Education and Research (01LK1224l, 01LK1101C, 01LK1224J, 01LK1101F, and 01LK1224D), the German Federal Ministry of Transport and Digital Infrastructure, the Italian Ministry of Education, University and Research (MIUR), The Ministry for Environment, Land and Sea Protection of Italy (MATTM), Consiglio Nazionale Ricerche Ufficio Programmazione Operativa (CNR-UPO), for PALOMA station, the H2020 project JERICONext (No. 654410), the Monitoring Programme of Italian Marine Strategy, BONUS (Art 185), Swedish Research Council Formas, Academy of Finland, BONUS (Art 185) through project BONUS INTEGRAL, BELSPO – grant numbers FR/36/IC1–IC4, the Polish National Centre for Research and Development, Estonian Research Council, CNRS-INSU, IRD, Research Foundation – Flanders (FWO, G0H3317N), BELSPO (FR/36/IC1-IC4), the research infrastructure project “Integrated Carbon Observation System (ICOS) Norway and Ocean Thematic Centre” (245927) from the Research Council of Norway, the NERC project CLASS (Climate Linked Atlantic Sector Science) (NE/R015953/1), and EMSO (EU Horizon 2020 Project “EMSO-Link” grant ID 731036).
Conflict of Interest Statement
The authors declare that the research was conducted in the absence of any commercial or financial relationships that could be construed as a potential conflict of interest.
Acknowledgments
We thank captains and crews of all ICOS SOOP lines for their support, and the editor and the reviewers for their valuable input.
Abbreviations
ASV, autonomous surface vehicle; ATC, Atmospheric Thematic Centre; CP, carbon portal, https://www.icos-cp.eu/; DIC, dissolved inorganic carbon; EMSO, European Multidisciplinary Seafloor and Water Column Observatory; ENVRI, Environmental Research Infrastructure; ERIC, European Research Infrastructure Consortium; ESFRI, European Strategy Forum on Research Infrastructures; ETC, Ecosystem Thematic Centre; FOSs, Fixed Ocean Stations; GA, general assembly; GHG, greenhouse gas; GLODAP, Global Ocean Data Analysis Project; GOOS, Global Ocean Observations System; GO-Ship, Global Ocean Ship Based Hydrographic Investigations Program; HO, Head Office; ICOS, Integrated Carbon Observation System; MFT, marine flux tower; MSA, Monitoring Station Assembly; NDIR, non-dispersive infrared; NOC, National Oceanography Centre; NRT, near real time; OTC, Ocean Thematic Centre; PI, principal investigator; PML, Plymouth Marine Laboratory; QC, quality control; SOCAT, Surface Ocean CO2 Atlas; SOCONET, Surface Ocean CO2 Observing NETwork; TA, total alkalinity; TC, Thematic Centre; UiB, University of Bergen; UN SDG, United Nations Sustainable Development Goals; UoE, University of Exeter; VOS, Voluntary Observation Ship.
Footnotes
References
Bakker, D. C. E., Pfeil, B., Landa, C. S., Metzl, N., Brien, K. M., Olsen, A., et al. (2016). A multi-decade record of high-quality fCO2 data in version 3 of the Surface Ocean CO2 Atlas (SOCAT). Earth Syst. Sci. Data Discuss. 8, 383–413. doi: 10.5194/essd-2016-15
Borges, A. V., Alin, S. R., Chavez, F. P., Vlahos, P., Johnson, K. S., Holt, J. T., et al. (2009). “A global sea surface carbon observing system: inorganic and organic carbon dynamics in coastal oceans,” in Proceedings of OceanObs’09: Sustained Ocean Observations and Information for Society, Vol. 2, eds J. Hall, D. E. Harrison, and D. Stammer (Venice: ESA Publication WPP-306), 21–25.
Bresnahan, P. J., Martz, T. R., Takeshita, Y., Johnson, K. S., and LaShomb, M. (2014). Best practices for autonomous measurement of seawater pH with the Honeywell Durafet. Methods Oceanogr. 9, 44–60. doi: 10.1016/j.mio.2014.08.003
Butterworth, B. J., and Miller, S. D. (2016). Air-sea exchange of carbon dioxide in the Southern Ocean and Antarctic marginal ice zone. Geophys. Res. Lett. 43, 7223–7230. doi: 10.1002/2016GL069581
Coppola, L., Ntoumas, M., Bozzano, R., Bensi, M., Hartman, S., Llorens, M. C., et al. (2016). Handbook of Best Practices for Open Ocean Fixed Observatories. Brussels: European Commission.
Dickson, A. G., Sabine, C. L., and Christian, J. R. (2007). Guide to Best Practices for Ocean CO2 Measurements. Sidney, BC: North Pacific Marine Science Organization.
Fiedler, B., Fietzek, P., Vieira, N., Silva, P., Bittig, H. C., and Koertzinger, A. (2013). In situ CO2 and O2 measurements on a profiling float. J. Atmos. Ocean. Technol. 30, 112–126. doi: 10.1175/JTECH-D-12-00043.1
Fröb, F., Olsen, A., Becker, M., Chafik, L., Johannessen, T., Reverdin, G., et al. (2019). Wintertime fCO2 variability in the subpolar North Atlantic since 2004. Geophys. Res. Lett 46, 1580–1590. doi: 10.1029/2018GL080554
Gülzow, W., Rehder, G., Schneider, B., Schneider, J., and Sadkowiak, B. (2011). A new method for continuous measurement of methane and carbon dioxide in surface waters using off-axis integrated cavity output spectroscopy (ICOS): an example from the Baltic Sea. Limnol. Oceanogr. Methods 9, 176–184. doi: 10.4319/lom.2011.9.176
Gülzow, W., Rehder, G., Schneider, V., Deimling, J., Seifert, T., and Tóth, Z. (2013). One year of continuous measurements constraining methane emissions from the Baltic Sea to the atmosphere using a ship of opportunity. Biogeosciences 10, 81–99. doi: 10.5194/bg-10-81-2013
Henson, S. A. (2014). Slow science: the value of long ocean biogeochemistry records. Philos. Trans. R. Soc. A Math. Phys. Eng. Sci 372:20130334. doi: 10.1098/rsta.2013.0334
Hood, E. M., Sabine, C. L., and Sloyan, B. M. M. (2010). The GO-SHIP Repeat Hydrography Manual: A Collection of Expert Reports and Guidelines, Version 1. [WWW Document]. IOCCP Rep. 14 (ICPO Publ. Ser. 134). Available at: http://www.go-ship.org/HydroMan.html (accessed June 30, 2019).
IPCC (2014). 5th Assessment Report: Summary for Policymakers, IPCC Fifth Asessement Report: Working Group III Mitigation of Climate Change. Geneva: IPCC.
Key, R. M., Olsen, A., van Heuven, S., Lauvset, S. K., Velo, A., Lin, X., et al. (2015). Global Ocean Data Analysis Project, Version 2 (GLODAPv2).
Landschützer, P., Gruber, N., and Bakker, D. C. E. (2017). An Updated Observation-Based Global Monthly Gridded Sea Surface pCO2 and Air-Sea CO2 Flux Product from 1982 Through 2015 and its Monthly Climatology. Asheville, NC: National Centers for Environmental Information.
Landwehr, S., Miller, S. D., Smith, M. J., Saltzman, E. S., and Ward, B. (2014). Analysis of the PKT correction for direct CO2 flux measurements over the ocean. Atmos. Chem. Phys. 14, 3361–3372. doi: 10.5194/acp-14-3361-2014
Le Quéré, C., Andrew, R. M., Friedlingstein, P., Sitch, S., Hauck, J., Pongratz, J., et al. (2018). Global carbon budget 2018. Earth Syst. Sci. Data 10, 2141–2194. doi: 10.5194/essd-10-2141-2018
Li, Q., Wang, F., Wang, Z. A., Yuan, D., Dai, M., Chen, J., et al. (2013). Automated spectrophotometric analyzer for rapid single-point titration of seawater total alkalinity. Environ. Sci. Technol. 47, 11139–11146. doi: 10.1021/es402421a
Lindstrom, E., Gunn, J., Fischer, A., McCurdy, A., Glover, L. K., and Members, T. T. (2012). A Framework for Ocean Observing. Paris: UNESCO, doi: 10.5270/OceanObs09-FOO
Lorenzoni, L., and Benway, H. M. (2013). Global Intercomparability in a Changing Ocean?: An International Time-Series Methods Workshop, November 28-30, 2012. Woods Hole: Ocean Carbon Biogeochemistry Program.
Martz, T. R., Connery, J. G., and Johnson, K. S. (2010). Testing the Honeywell Durafet for seawater pH applications. Limnol. Oceanogr. Methods 8, 172–184. doi: 10.4319/lom.2010.8.172
McGillis, W. R., Edson, J. B., Hare, J. E., and Fairall, C. W. (2001). Direct covariance air-sea CO 2 fluxes. J. Geophys. Res. Ocean 106, 16729–16745. doi: 10.1029/2000JC000506
Miller, S. D., Marandino, C., and Saltzman, E. S. (2010). Ship-based measurement of air-sea CO2 exchange by eddy covariance. J. Geophys. Res. Atmos. 115, doi: 10.1029/2009JD012193
Monteiro, P. M. S., Schuster, U., Hood, M., Lenton, A., Metzl, N., Olsen, A., et al. (2009). “A global sea surface carbon observing system: assessment of changing sea surface CO2 and air-sea CO2 fluxes,” in Proceedings of OceanObs’09: Sustained Ocean Observations and Information for Society, eds J. Hall, D. E. Harrison, and D. Stammer (Venice: ESA Publication WPP-306).
Oliver, M. J., and Irwin, A. J. (2008). Objective global ocean biogeographic provinces. Geoph. Res. Lett. 35, L15601. doi: 10.1029/2008/GL034238
Olsen, A., Key, R. M., Heuven, S., van Lauvset, S. K., Velo, A., Lin, X., et al. (2016). The global ocean data analysis project version 2 (GLODAPv2) – an internally consistent data product for the world ocean. Earth Syst. Sci. Data 8, 297–323. doi: 10.5194/essd-8-297-2016
Pfeil, B., Olsen, A., Bakker, D. C. E., Hankin, S., Koyuk, H., Kozyr, A., et al. (2013). A uniform, quality controlled Surface Ocean CO2 Atlas (SOCAT). Earth Syst. Sci. Data 5, 125–143. doi: 10.5194/essd-5-125-2013
Pierrot, D., Neill, C., Sullivan, K., Castle, R., Wanninkhof, R., Lüger, H., et al. (2009). Recommendations for autonomous underway pCO2 measuring systems and data-reduction routines. Deep. Res. Part II Top. Stud. Oceanogr. 56, 512–522. doi: 10.1016/j.dsr2.2008.12.005
Prytherch, J., Yelland, M. J., Brooks, I. M., Tupman, D. J., Pascal, R. W., Moat, B. I., et al. (2015). Motion-correlated flow distortion and wave-induced biases in air-sea flux measurements from ships. Atmos. Chem. Phys. Discuss. 15, 15543–15570. doi: 10.5194/acpd-15-15543-2015
Rérolle, V., Achterberg, E., Ribas-Ribas, M., Kitidis, V., Brown, I., Bakker, D., et al. (2018). High resolution pH measurements using a lab-on-chip sensor in surface waters of Northwest European shelf seas. Sensors 18:2622. doi: 10.3390/s18082622
Rödenbeck, C., Bakker, D. C. E., Gruber, N., Iida, Y., Jacobson, A. R., Jones, S., et al. (2015). Data-based estimates of the ocean carbon sink variability – first results of the Surface Ocean pCO2 Mapping intercomparison (SOCOM). Biogeosciences 12, 7251–7278. doi: 10.5194/bg-12-7251-2015
Rutgersson, A., Norman, M., Schneider, B., Pettersson, H., and Sahlée, E. (2008). The annual cycle of carbon dioxide and parameters influencing the air-sea carbon exchange in the Baltic Proper. J. Mar. Syst. 74, 381–394. doi: 10.1016/j.jmarsys.2008.02.005
Sloyan, B. M., Wanninkhof, R., Kramp, M., Johnson, G. C., Talley, L. D., Tanhua, T., et al. (2019). The global ocean ship-based hydrographic investigations program (GO-SHIP): a platform for integrated multidisciplinary ocean science. Front. Mar. Sci. 6:445. doi: 10.3389/fmars.2019.00445
Wang, Z. A., Sonnichsen, F. N., Bradley, A. M., Hoering, K. A., Lanagan, T. M., Chu, S. N., et al. (2015). In situ sensor technology for simultaneous spectrophotometric measurements of seawater total dissolved inorganic carbon and pH. Environ. Sci. Technol. 49, 4441–4449. doi: 10.1021/es504893n
Wanninkhof, R., Bakker, D., Bates, N., Steinhoff, T., and Sutton, A. (2013). Incorporation of Alternative Sensors in the SOCAT Database and Adjustments to Dataset Quality Control Flags. Oak Ridge, TN: Oak Ridge National Laboratory, 1–26. doi: 10.3334/CDIAC/OTG.SOCAT
Wanninkhof, R., Pickers, P. A., Omar, A. M., Sutton, A., Murata, A., Olsen, A., et al. (2019). A Surface Ocean CO2 Reference Network, SOCONET and associated Marine Boundary Layer CO2 measurements. Front. Mar. Sci. 6:400. doi: 10.3389/fmars.2019.00400
Watson, A. J., Schuster, U., Bakker, D. C. E., Bates, N. R., Corbiere, A., Gonzalez-Davila, M., et al. (2009). Tracking the variable North Atlantic sink for atmospheric CO2. Science 326, 1391–1393. doi: 10.1126/science.1177394
Keywords: ocean observation, network design, CO2 fluxes, flux maps, carbon sink
Citation: Steinhoff T, Gkritzalis T, Lauvset SK, Jones S, Schuster U, Olsen A, Becker M, Bozzano R, Brunetti F, Cantoni C, Cardin V, Diverrès D, Fiedler B, Fransson A, Giani M, Hartman S, Hoppema M, Jeansson E, Johannessen T, Kitidis V, Körtzinger A, Landa C, Lefèvre N, Luchetta A, Naudts L, Nightingale PD, Omar AM, Pensieri S, Pfeil B, Castaño-Primo R, Rehder G, Rutgersson A, Sanders R, Schewe I, Siena G, Skjelvan I, Soltwedel T, van Heuven S and Watson A (2019) Constraining the Oceanic Uptake and Fluxes of Greenhouse Gases by Building an Ocean Network of Certified Stations: The Ocean Component of the Integrated Carbon Observation System, ICOS-Oceans. Front. Mar. Sci. 6:544. doi: 10.3389/fmars.2019.00544
Received: 07 November 2018; Accepted: 19 August 2019;
Published: 03 September 2019.
Edited by:
Minhan Dai, Xiamen University, ChinaReviewed by:
Guiling Zhang, Ocean University of China, ChinaSamuel T. Wilson, University of Hawai‘i at Mānoa, United States
Copyright © 2019 Steinhoff, Gkritzalis, Lauvset, Jones, Schuster, Olsen, Becker, Bozzano, Brunetti, Cantoni, Cardin, Diverrès, Fiedler, Fransson, Giani, Hartman, Hoppema, Jeansson, Johannessen, Kitidis, Körtzinger, Landa, Lefèvre, Luchetta, Naudts, Nightingale, Omar, Pensieri, Pfeil, Castaño-Primo, Rehder, Rutgersson, Sanders, Schewe, Siena, Skjelvan, Soltwedel, van Heuven and Watson. This is an open-access article distributed under the terms of the Creative Commons Attribution License (CC BY). The use, distribution or reproduction in other forums is permitted, provided the original author(s) and the copyright owner(s) are credited and that the original publication in this journal is cited, in accordance with accepted academic practice. No use, distribution or reproduction is permitted which does not comply with these terms.
*Correspondence: Tobias Steinhoff, tsteinhoff@geomar.de; Thanos Gkritzalis, thanos.gkritzalis@vliz.be