Remotely Sensed Winds and Wind Stresses for Marine Forecasting and Ocean Modeling
 Mark A. Bourassa1,2*
  Thomas Meissner3
  Ivana Cerovecki4
  Paul S. Chang5 Xiaolong Dong6 Giovanna De Chiara7
  Craig Donlon8 Dmitry S. Dukhovskoy2 Jocelyn Elya2 Alexander Fore9
  Melanie R. Fewings10
  Ralph C. Foster11
  Sarah T. Gille4 Brian K. Haus12
  Svetla Hristova-Veleva9 Heather M. Holbach13 Zorana Jelenak14
  John A. Knaff15
  Sven A. Kranz1
  Andrew Manaster3
  Matthew Mazloff4 Carl Mears3 Alexis Mouche16 Marcos Portabella17
  Nicolas Reul16
  Lucrezia Ricciardulli3
  Ernesto Rodriguez9 Charles Sampson18
  Daniel Solis19
  Ad Stoffelen20
  Michael R. Stukel1 Bryan Stiles9 David Weissman21 Frank Wentz3
- 1EOAS, Florida State University, Tallahassee, FL, United States
- 2COAPS, Florida State University, Tallahassee, FL, United States
- 3Remote Sensing Systems, Santa Rosa, CA, United States
- 4Scripps Institution of Oceanography, University of California, San Diego, San Diego, CA, United States
- 5NOAA/NESDIS/Center for Satellite Applications and Research, Silver Spring, MD, United States
- 6The Key Laboratory of Microwave Remote Sensing, NSSC, CAS, Beijing, China
- 7European Centre for Medium-Range Weather Forecasts, Reading, United Kingdom
- 8Mission Science Division, Earth Observation Programme Directorate, ESTEC, European Space Agency, Noordwijk, Netherlands
- 9Jet Propulsion Laboratory and California Institute of Technology, Pasadena, CA, United States
- 10College of Earth, Ocean, and Atmospheric Sciences, Oregon State University, Corvallis, OR, United States
- 11Applied Physics Laboratory, University of Washington, Seattle, WA, United States
- 12Department of Ocean Sciences - Rosenstiel School of Marine and Atmospheric Science, University of Miami, Miami, FL, United States
- 13NOAA/AOML Hurricane Research Division, Northern Gulf Institute, Florida State University, Miami, FL, United States
- 14NOAA/NESDIS/STAR-UCAR, Washington, DC, United States
- 15NOAA Center for Satellite Applications and Research, Fort Collins, CO, United States
- 16Laboratoire d'Océanographie Physique et Spatiale, Institut Français de Recherche et d'Exploitation de la Mer, Brest, France
- 17Barcelona Expert Centre, Institute of Marine Sciences (ICM-CSIC), Barcelona, Spain
- 18U.S. Naval Research Laboratory, Monterey, CA, United States
- 19Florida Agricultural and Mechanical University, Tallahassee, FL, United States
- 20RDSW, Royal Netherlands Meteorological Institute, De Bilt, Netherlands
- 21School of Engineering and Applied Science, Hofstra University, Hempstead, NY, United States
Strengths and weakness of remotely sensed winds are discussed, along with the current capabilities for remotely sensing winds and stress. Future missions are briefly mentioned. The observational needs for a wide range of wind and stress applications are provided. These needs strongly support a short list of desired capabilities of future missions and constellations.
Introduction
This paper is focused on remotely sensed surface winds (scalar winds and vector winds) with related material on surface stress, air-sea heat fluxes, currents, sea state, and precipitation. It begins with definitions used in the description of remotely sensed winds followed by a description of wind sensing techniques including strengths, weaknesses, spatial coverage, and resolution (section Observation Technologies and Networks). Planned and suggested improvements to these observations are also discussed. Three of the largest concerns with modern observations are rain contamination (section Rain Contamination), calibration at very high wind speeds (section High Wind Speed retrieval) and the lack of observations near land and ice. Section Multi-Satellite Wind Products is a brief description of merged satellite products that are produced on a regular grid.
The connections between observing system governance (section Observing System Governance), science teams and users, and data centers (section Data and Information Systems) are explained. This is followed by sections on applications, with the greatest detail provided on operations (section Hazards and Marine Safety) and discovery (section Discovery), and the requirements for these applications. The last section is a summary of key issues and requirements.
Observation Technologies and Networks
Scalar Speed Sensors
Passive microwave sensors (radiometers) measure the wind speed over the ocean by receiving and analyzing the power spectrum (brightness temperatures) of the electromagnetic radiation that is emitted by the wind roughened water surface, largely from foam when foam is present. The retrieval of ocean surface wind speed from microwave radiometers is based on a physical radiative transfer model that calculates the microwave emission from flat and rough ocean surfaces and the absorption and emission by the Earth's atmosphere (Wentz, 1997; Meissner and Wentz, 2012).
Past and currently operating sensors that can measure ocean surface wind speed include the Special Sensor Microwave Imager (SSM/I; Hollinger et al., 1990; Wentz, 1997) and the Special Sensor Microwave Imager Sounder (SSMIS), the Tropical Rainfall Mission Microwave Imager (TMI; Wentz, 2015), the Global Precipitation Mission (GMI; Draper et al., 2015; Wentz and Draper, 2016), the Advanced Microwave Scanning Radiometers (AMSR-E and AMSR2; Imaoka et al., 2010), and the Micro-Wave Radiation Imager (MWRI) on the Feng-Yun FY-3 platforms (Yang et al., 2012). All of these instruments are conically scanning. For measuring scalar ocean surface wind speeds, they utilize the microwave frequency range between 6 GHz (C-band) and 37 GHz (Ka-band) at two polarizations (vertical V and horizontal H). The spatial resolution of the wind speeds obtained from these instruments is about 20–35 km. The multi-frequency and dual polarization channel configuration of these passive sensors makes it possible to remove the effects of atmospheric attenuation in non-precipitating scenes accurately enough to measure wind speeds at the ocean surface.
The accuracy of the scalar ocean wind speeds from microwave radiometers has been assessed through comparisons with buoys (Mears et al., 2001; Wentz, 2015; Wentz et al., 2017) and numerical weather prediction models (NWP, Meissner et al., 2001). In rain-free scenes, the accuracy matches that of an active instrument (<1 m/s; Wentz, 2015; Wentz et al., 2017). In precipitating scenes, the ability of these passive microwave sensors to measure ocean wind speeds degrades quickly with significant errors starting to appear in light rain (surface rain rates > 1 mm/h, Meissner and Wentz, 2009). This is mainly due to: (1) the attenuation of the surface signal by rain drops, and (2) the fact that the attenuation is difficult to simulate using radiative transfer models, in particular at the higher frequencies when scattering by rain drops occurs. However, because of their sensitivity to rain, the passive sensors are able to deliver an accurate measurement of the surface rain rate (Wentz and Spencer, 1998; Hilburn and Wentz, 2008). This provides valuable information for flagging wind speed retrievals in rain.
Since 1996, there have been 3–6 radiometers operating in polar and/or equatorial orbits, resulting in good spatial and temporal sampling and covering 95% of Earth's ocean surface in a given day. This temporal and spatial coverage makes it possible to integrate scalar wind speeds from satellite microwave radiometers into a long-term climate data record (Wentz et al., 2017).
Scalar surface wind data sets from these sensors are produced and distributed by several institutions (www.remss.com, https://gportal.jaxa.jp/gpr, http://satellite.nsmc.org.cn/PortalSite/Default.aspx).
Vector Wind Sensors
Vector winds are useful for a wider range of applications than scalar winds. The observational needs are most consistent with scatterometers (section Scatterometers), with existing applications discussed in sections Hazards and Marine Safety and Discovery, and goals discussed immediately below in section Scatterometers and in the summary. Passive polarimetric observations (section Polarimetric Radiometers) provide an alternative with a different set of strengths and weaknesses, while synthetic aperture radar [SAR; section Synthetic Aperture Radar (SAR)] is more capable when used very close to land and where finer resolution is required.
Scatterometers
There is a long history of scatterometer observations, which are based on active microwave radars: Seasat (Johnson et al., 1980), ERS1 and ERS2 (Attema, 1991; Lin et al., 2017), NSCAT (Naderi et al., 1991; Tsai et al., 1999; Wentz and Smith, 1999), SeaWinds instruments on QuikSCAT (Spencer et al., 2000), and ADEOS2, ASCAT (Figa-Saldaña et al., 2002) on METOP-A, -B, and -C, the RapidScat (Durden and Perkovic-Martin, 2017) on the International Space Station as well as OSCAT on OceanSat2 (Kumar et al., 2013), ScatSat-1, and HY-2A. These instruments provide very accurate winds in rain-free conditions and in some raining conditions (Stiles and Dunbar, 2010; Lin et al., 2015a; Wentz et al., 2017; Priftis et al., 2018), with the longer wavelength C-band instruments performing better in rain than the Ku-band instruments. The ASCAT products are more consistent and provide better directional accuracy across the measurement swath due to their constant azimuth viewing angles but at the expense of a large nadir gap in coverage. A new scatterometer with a rotating fan-beam began operating on CFOSAT in October 2018. It will provide an opportunity to evaluate coverage and directional performance near nadir due to its increased number of views (Li et al., 2019). Combined C and Ku-band measurements have also been demonstrated by using data collected nearly simultaneously by ASCAT and ScatSat-1 (Fore et al., 2018).
In-swath grid spacing has improved from 25 to 12.5 km for standard products (Fore et al., 2014), however, spectral analysis shows little improvement in resolution in products with finer grid spacing than 25 km. There is a special coastal ASCAT product with 5.6 km grid spacing (and <20 km resolution; Vogelzang and Stoffelen, 2017) as well as grid-spaced ultra high resolution products from Brigham Young University (Lindsley and Long, 2016), which have grid spacing as fine as 2.5 km with resolution slightly better than 20 km. The latest JPL QuikSCAT winds 12.5-km product (Level 2B Version 4.0) has also been optimized to acquire winds close to the coast (~10 km), at the price of reduced accuracy (Figure 1). Temporal sampling is a function of the orbit and the swath width. A single SeaWinds instrument has sufficient sampling for synoptic scale weather forcing, with substantial information on the mesoscale. A combined C- and Ku-band scatterometer is also planned by CMA FY-3 series satellite, which is expected to improve the performance for rain and higher wind speed conditions and to help evaluate calibration differences between Ku- and C-band instruments for these conditions and to better characterize differences in dependence on sea surface temperature (SST; Wang et al., 2017). Moreover, an additional cross-polarized beam will fly on the scatterometers (SCA) onboard the Metop Second Generation (Metop-SG) series as of 2023, providing enhanced extreme-wind retrieval capabilities.
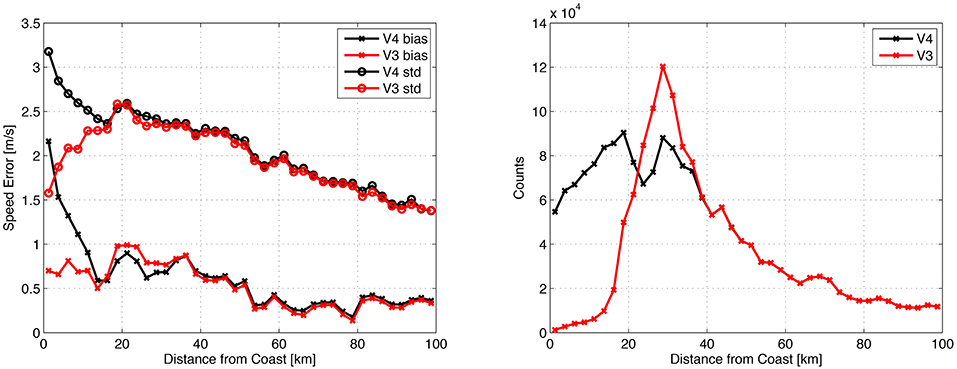
Figure 1. QuikSCAT Coastal performance (left) for versions 3 (red) and 4 (black) showing biases (crosses) and standard deviations (circles) relative to buoy observations. Version 4 has at least 10 time as many buoy hits within 20 km of the coast as version 3 (right). All available NDBC buoys were utilized in this assessment. This may tend to overemphasize near-coastal errors, because some coastal buoys are known to be non-representative of the surrounding wind field. Two trends are apparent. Differences from buoys decrease out to 100-km possibly due to more spatial variance closer to shore. There is a steeper trend from 0 to 20-km perhaps due to residual errors in coastal processing. Agreement 10-km from coast is only marginally worse than 30-40-km. Agreement within 5-km from the coast shows significant degradation. Distance from the coast is included in the product and can be used as a quality flag.
The main weaknesses of scatterometers are rain contamination for some rain conditions (far more so for Ku-band than C-band), a lack of data near land (typically within 15 km), and temporal sampling. Satellites in low Earth orbit take roughly 100 min to orbit around the world. Consecutive sun-synchronous orbits have gaps between them and thus only cover portions of the globe in 1 day (Figure 2). Multiple scatterometers greatly improve the temporal sampling (Trindade et al., 2017; Stoffelen et al., 2019). However, the number of satellites is not a good metric for coverage, as shown in 6-hourly images of coverage from RapidScat, ASCAT-A, and ASCAT-B (Figure 3).
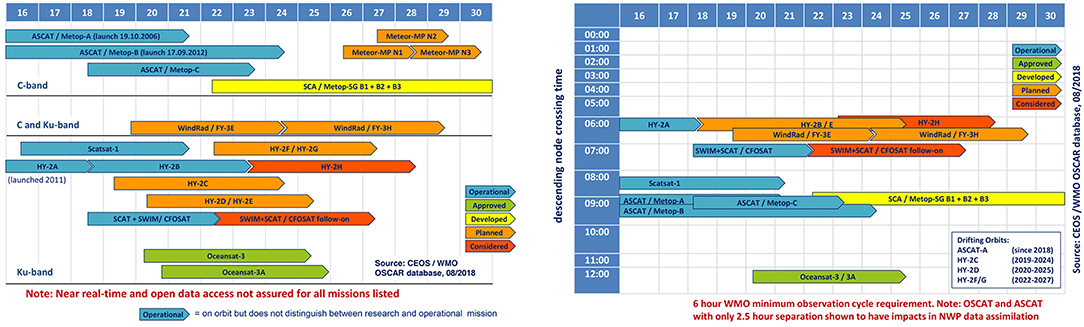
Figure 2. Projection of existing and future scatterometers (left) and sampling through the diurnal cycle (right). While the World Meteorological Organization's requirement for the number of satellites should be met, the sampling through the diurnal cycle is insufficient. Graphic courtesy of Stefanie Linow.
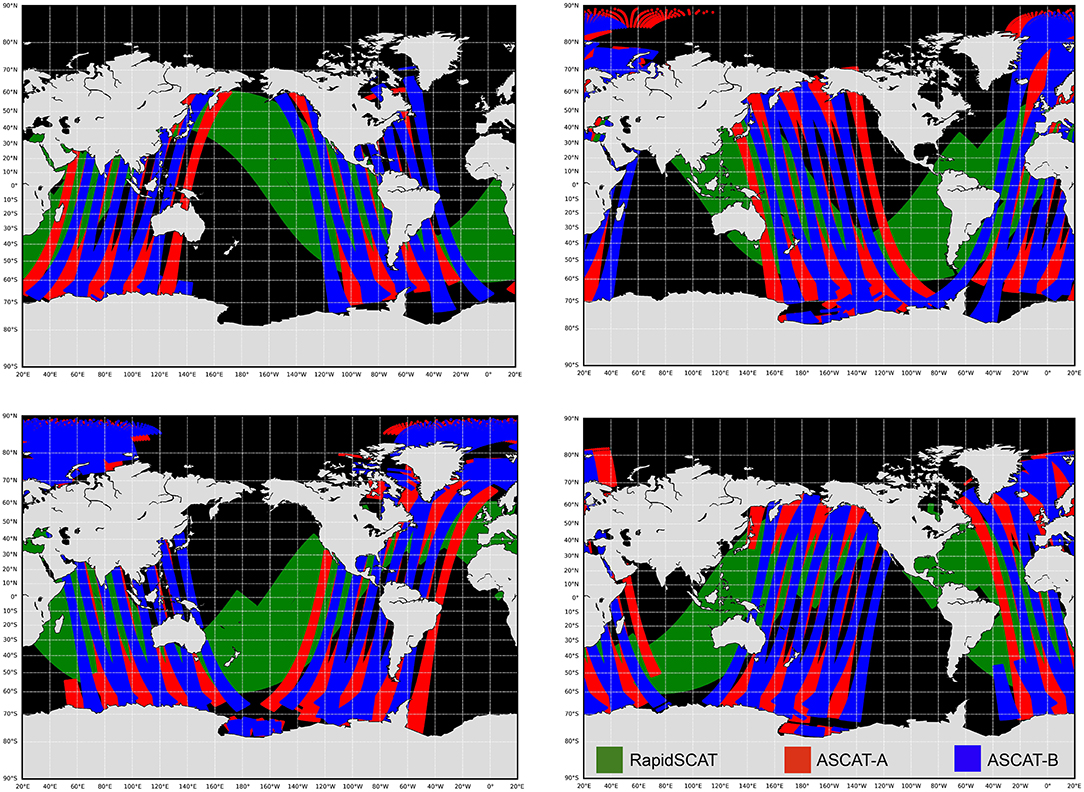
Figure 3. Examples of coverage from 0 to 6Z (upper left), 6 to 12Z (upper right), 12 to 18Z (lower left), and 18 to 24Z (lower right) based on one equatorial orbiting instrument (RapidSCAT; green) and two instruments (ASCAT-A in red and ASCAT-B in blue) in sun synchronous orbits. While this configuration has considerable advantages for intercalibration and studies of convection, and has the World Meteorological Organization recommended number of satellites, the temporal sampling is clearly insufficient.
The World Meteorological Organization specifies 25 km resolution and sampling every 6 h (ideally from three satellites) as the operational goals for scatterometers. While existing instruments achieve this spatial resolution goal, a chart of the existing and projected sensors (Figure 2) shows that the target temporal resolution cannot be achieved without more international collaboration on the timing of orbits (Stoffelen et al., 2019). Instruments in more equatorial orbits, such as RapidSCAT, considerably improve tropical coverage and allow for very fast and good intercalibration with instruments in sun-synchronous orbits (Ricciardulli et al., 2015; Wang et al., 2017; Wentz et al., 2017). Stoffelen et al. (2013) found that two scatterometers (OSCAT and ASCAT) separated by 2.5 h in local overpass time generally doubled the contribution to the reduction of wind forecast error with respect to one scatterometer overpass time (ASCAT). This indicates that sampling every 2.5 h results in very little over-sampling. Consequently, the International Ocean Vector Winds Science Team (IOVWST) recommends at least one instrument in a more tropical orbit be combined with at least three satellites in coordinated sun-synchronous orbits. The planned HY-2 constellation will fill current gaps in coverage with sun-synchronous orbits: HY-2C (to be launched in 2019) and HY-2D (planned for launch in 2020 or 2021) will be flown with two more equatorial orbits, in addition to HY-2B, which will be flown in a sun-synchronous orbit. The next ASCAT mission and the second generation of European instruments will contribute to this coverage, while upcoming missions from India will fill in the gaps at midnight and midday.
Planned advances include the use of Doppler information to improve accuracy in future Indian instruments and upgraded antenna technology for modest improvements of resolution and polarization in the follow-on to the ASCAT series of instruments (Lin et al., 2017). One goal of the remote sensing community is to add Doppler capability to future scatterometers (Rodriguez, 2018; Rodriguez et al., 2019, this issue) and altimeters (Ardhuin et al. this issue) in a manner that allows for measurements of surface currents. Traditionally, surface currents are poorly defined, thought of as currents at the surface or in the upper few meters, and more often as currents in the mixed layer (GCOS, 2015; Belward et al., 2016). Thus, very few observations are made in the upper few meters where there is great deal of variation related to winds and waves. These variations impact the calibration of winds and stress and applications that depend on stress retrievals. Simultaneous ocean motion Doppler and backscatter measurements will allow the retrieval of both winds and currents (Mouche et al., 2012; Rodriguez et al., 2018; Rodriguez et al. this issue) and improve directional accuracy. The recent National Academies of Science Earth Science and Applications from Space Decadal Survey (National Academies of Sciences, 2018) recognized the value of this combination of observations and the need to use higher frequencies to improve resolution of a SeaWinds-like instrument (Rodriguez et al., 2018). It appears that studying mesoscale air-sea interaction requires much finer scale observations, with grid spacing of roughly 5 km or finer (Villa Boas et al. this issue). Observations on these scales, with sufficient averaging in space and time, would allow investigation of most mesoscale features.
Polarimetric Radiometers
Polarimetric radiometers (passive instruments) include the ±45° polarized and left/right circular polarized channels in addition to the vertical (V) and horizontal (H) polarizations. Thus, these sensors contain complete information about the state of polarization (4 Stokes parameters) of the electromagnetic radiation that is emitted from the ocean surface. The signal in the 4 Stokes parameters of the passive microwave emission from a rough ocean surface contains a small part that depends on wind direction relative to look direction (Yueh et al., 1999). This allows the determination of the ocean vector winds, i.e., both scalar wind speed and wind direction. Wind speed accuracies are similar for passive polarimetric radiometers and for scatterometers. However, the wind directions from passive systems become less accurate as wind speeds fall below 8 m s−1 (Ricciardulli et al., 2012).
The WindSat sensor is a conically scanning polarimetric radiometer operated by the US Navy and flown on the Coriolis platform (Gaiser et al., 2004). It is fully polarimetric (measuring all 4 Stokes parameters) at 10.7 (X-band), 18.7 (Ku-band) and 37.0 (Ka-band) GHz and dual polarized (V and H) at 6.8 (C-band) and 23.8 GHz (K-band). The instrument has been operating since 2003, with just a few brief interruptions, and has been providing the oceanographic communities with high-quality ocean vector wind data (Bettenhausen et al., 2006; Meissner and Wentz, 2006).
At wind speeds below 6 m s−1, the passive wind direction signal is small in all polarizations and because of that the wind direction measurements are noisy at these wind speeds. The accuracy of the WindSat wind direction increases with increasing wind speed, because the wind direction signal increases. At 6 m s−1, the uncertainty of with WindSat wind direction is 20° (Hilburn et al., 2016), and it becomes usable for most oceanographic and meteorological applications. Above 8 m s−1, the uncertainty of the WindSat wind direction measurements (10°-15°) is similar to that of scatterometers (Ricciardulli et al., 2012; Hilburn et al., 2016). At high winds (above 10 m s−1) the passive wind direction signal is strong in all 4 Stokes parameters. Because the wind direction dependence differs for the 4 Stokes parameters it is possible to resolve the vector wind ambiguities without the use of an ancillary numerical weather prediction field. WindSat takes observations in both the forward (fore) and backward (aft) look. Using both look directions in the WindSat vector wind retrieval helps to improve its performance (Hilburn et al., 2016).
Like other passive microwave sensors, WindSat is strongly affected by rain; its ability to measure wind speed in the presence of rain is significantly diminished. However, this effect has been converted into a useful tool for estimating rain rates (and other atmospheric products) on a global scale. WindSat ocean vector winds (and other products) are produced by the Naval Research Laboratory1 and Remote Sensing Systems2.
Current plans call for the Compact Ocean Wind Vector Radiometer (COWVR) developed by the NASA Jet Propulsion Laboratory (JPL) to be launched and mounted at the International Space Station within the next couple years (Brown et al., 2017). Like WindSat, it scans conically and takes observations over the full scan both in the fore and aft look direction. It has fully polarimetric channels (18.7, 23.8, and 33.9 GHz) and lower frequency channels can be easily added. COWVR's performance to measure ocean vector winds is expected to be similar to WindSat, but it will demonstrate new technology for polarimetric radiometers. Its calibration is done internally and, unlike the previously discussed passive spaceborne sensors, only its reflector antenna rotates while its receiver is fixed to the spacecraft. This is a more cost-effective design and may pave the way to future polarimetric microwave radiometers.
The Weather System Follow-on Microwave (WSF-M) mission is currently being developed by Ball Aerospace for the U.S. Department of Defense as a continuation for the SSMIS and WindSat sensors. It will have a microwave imager with a configuration and polarimetric capabilities similar to WindSat, and is expected to be able to measure ocean surface wind vectors with an accuracy comparable to WindSat. The first of two planned sensors will launch in 2023.
Studies are underway at the European Space Agency using the Copernicus Imaging Microwave Radiometer (CIMR; see Donlon, 2018), a conically scanning imager that includes channels between 1.4 and 36.5 GHz, in a polar orbit, to provide SST, wind speed, sea surface salinity, thin sea ice thickness, and sea ice concentration with increased accuracy and spatial resolution. The initial design includes low noise dual polarization receivers and a large 7 m rotating mesh antenna. Low-noise receivers at 1.4, 6.9, 10.65, 18.7, and 36.5 GHz (L-, C-, X-, Ku-, and Ka-band) and at spatial resolutions of 5–15 km (55 km at L-band) are foreseen over a swath of ~1,920 km. CIMR is designed to address the Integrated European Union Policy for the Arctic providing a follow up for the current L-band missions—Soil Moisture and Ocean Salinity (SMOS) and Soil Moisture Active Passive (SMAP)—and the continuity of AMSR/2 low frequency channels. It is expected to have excellent capabilities for ocean wind measurements under all conditions. The CIMR mission is currently in a Phase A/B1 study that is expected to move into full implementation for a launch in the 2025+ timeframe.
Synthetic Aperture Radar (SAR)
SAR sensors measure the NRCS, similar to scatterometers. Therefore, geophysical model functions derived from abundant wind scatterometer measurements may be used to infer wind information from SAR (Portabella et al., 2002), but they cannot simultaneously retrieve both wind speed and direction. Since SARs provide a single azimuth view, one cannot infer whether backscatter variations are due to wind speed (along-view wind vector component) or wind direction (across-view wind vector component) variation. Retrieval methodology is reviewed in Beal (2005) and the references therein. Young et al. (2007) developed both manual and semi-automated methods to correct for interactions between errors in wind speed and direction. Horstmann et al. (2000) described how wind direction on the kilometer-scale can be obtained at moderate winds by evaluating wind streaks in SAR images. Mouche et al. (2012) used approach to convert SAR's backscatter and Doppler measurements of radial wind speed into a wind vector. Gade and Stoffelen (2019) described the characteristics of widely used global ocean satellite wind measurement systems, where SARs are particularly unique in their spatial resolution but lack absolute calibration, temporal sampling, and complete information for wind vector retrieval.
SAR has a unique place in satellite wind observations, having the ability to image the sea surface on a relatively finer scale, O(10 m). However, in order to remove speckle noise and to filter ocean surface waves and other non-wind-induced features, wind retrieval is usually performed at spatial scales of 0.5–1 km. C-band and L-band SAR systems have been used to retrieve surface winds on ERS-1,-2 Envisat, RADARSAT-1,-2 ALOS, and Sentinel-1A,B. Also, X-band SAR algorithms are being developed to retrieve winds on COSMO-SkyMed and TerraSAR-X.
The surface signature of marine atmospheric boundary layer organized roll vortices (Brown, 1980; Hein and Brown, 1988) has been detected in SAR imagery as far back as the Seasat L-band SAR (Fu and Holt, 1982). These rolls are kilometer-scale overturning coherent structures embedded in the marine atmospheric boundary layer turbulent flow that are approximately aligned with the surface wind direction. They induce a periodic enhancement and reduction of the surface wind speed that alternately enhances and reduces the backscatter. Beginning with Gerling (1986), this signature has been used to find the wind direction within a 180° ambiguity (Horstmann et al., 2002; Horstmann and Koch, 2005, Wackerman et al., 2006; Horstmann et al., 2013). This ambiguity can be resolved by external, larger-scale flow maps or by flow features such as wind shadows within the SAR image.
Coastal High Frequency Radar
Coastal high frequency (HF) radars operate in frequency ranges from ~5 to 30 MHz and at grazing angles. Their backscattered Doppler spectra are dominated by Bragg scattering off ocean waves ranging in length from roughly 50 to 10 m. The Doppler spectra consistently reveal peaks corresponding to waves both advancing toward and receding from the transmit/receive direction at the Doppler-shifted Bragg frequency (known as the first order peaks). The ratio of the advancing and receding peaks is related to the wind direction component directed either toward or away from the transmitted signal (Long and Trizna, 1973), however there remains an ambiguity about the look direction. By looking at the same patch of the ocean from different directions using a monostatic HF radar system this ambiguity can be resolved. Wind direction has been proven to be a robustly derived parameter from monostatic shore based radars over long ranges because of the signal-to-noise ratio of the 1st order returns (e.g., Heron and Rose, 1986). The extension of this technique to bistatic transmit receive configurations (Huang et al., 2012) as well as shipboard observations (Xie et al., 2018) is under development.
Extraction of the wind speed from HF radars is more difficult because it has typically relied on the signal level of the 2nd order returns about the 1st order peak, which are related to a longer wave modulation of the Bragg waves. These 2nd order returns are used to derive a wave spectral estimate that can then be related to the wind speed (Wyatt et al., 2006). One disadvantage of this approach is that the 2nd order returns have a lower signal-to-noise ratio than the 1st order peaks and are thus available at shorter ranges. Shen et al. (2012) developed a technique to extract the wind speed from the strength of the 1st order returns using neural networks that has the advantage of longer-range observation, but the range of wind speeds that can be observed from ~4 to 11 m/s is limited due to saturation of the Bragg wave returns.
The measurement characteristics of the HF radar winds are related to the frequency of the radar as well as the receiver antenna technology used. The spatial resolution of HF radar winds can range from O(1–10 km) in range and a few degrees in azimuth for phased-array systems, which can provide maps of the winds at 30-min intervals. The resolution of these approaches was reported by Shen et al. (2012), resulting in roughly 20° rms directional errors and ~1.5 m/s rms speed errors, limited to tens of km to roughly 79 km offshore.
The main contributions of HF radars within the context of ocean observing are their complementary capabilities to satellite based observations. In the United States the NOAA HF Radar National server presently provides continuous coastal ocean surface winds and currents at distributed sites. Expanding the data available from these systems would provide high temporal (~hourly) and spatial (a few km) resolution winds in regions that are challenging for other types of remote sensors. In particular the capability of HF radars to provide wind information within 5 km of the coastline, where there are many critical applications such as search and rescue and oil-spill response can help to address observing system gaps as addressed below.
Observing System Challenges
There are two challenges related to communications. Satellite “winds” are estimates of stress tuned to be like winds (section Interpretation of Satellite Winds). Second, the radiometry community has done a poor job orally communicating the impressive capability at high wind speeds (section Tropical Cyclone Forecasting). With current instrument capabilities and ignoring very low wind speeds (<2 ms−1) where the variability in wind direction overwhelms the mean signal on the time scale of satellite observations, there are two main areas of ongoing concern. The first is degradation of the retrievals in rain and the other is retrievals at high wind speeds, which in tropical and sub-tropical latitudes often occur with rain. Moreover, in situ measurement systems disagree on the strength of wind speeds above 15 m/s and an absolute wind reference needs to be established for calibrating the microwave satellite winds (e.g., Vandemark et al., 2018). Another issue is making observations closer to the coastline, which is challenging because the side lobes in the antenna pattern (areas outside the areas normally considered the footprint) extend roughly 60% of the footprint width beyond the edge of the traditional footprint, and because the signal from land and ice is much stronger than the signal from water. The single most effective solution to contamination from land and ice is to use finer resolution radar footprints, which is important for many applications mentioned later in this document.
Fast routines are being developed to allow on-the-fly processing of the radar spatial response functions on the ocean surface. This is useful for retrievals near land and ice because knowledge of the antenna pattern (i.e., the surface pattern including side lobes) can be used to mask backscatter observations that are contaminated by land and ice. This masking allows for retrievals to be made closer to the land or ice, albeit without all the information from an open ocean retrieval. This approach has been used to create special coastal scatterometer wind products with 5.6 km grid spacing and <20 km resolution (Vogelzang and Stoffelen, 2017). Similarly, by taking account of the estimated coastal sea and land/ice backscatter relative to the total backscatter, more winds near the coast are being processed (Stiles et al., 2018).
Interpretation of Satellite Winds
As noted above, radiometers and scatterometers respond to ocean characteristics that are driven more by stress than by wind. Satellite-derived wind speed (also called equivalent neutral wind speed; Ross et al., 1985; Liu and Tang, 1996; Kara et al., 2008a) was developed to consider the influences of atmospheric stability in the conversion from “wind” to stress. It is a wind speed for which a neutral transfer coefficient can be used to convert a satellite's equivalent neutral winds to a kinematic stress. An updated definition of equivalent neutral winds (Bourassa et al., 2009) is consistent with scatterometry, which responds to surface stress (Bourassa and Hughes, 2018). It is also considered to be applicable to SAR (Takeyama et al., 2013) and radiometric (Meissner and Wentz, 2012) wind speeds. De Kloe et al. (2017) further corrected for atmospheric mass density variations in what they called stress-equivalent winds. Unfortunately, accurate in situ measurements of near-surface stress over water are extremely sparse relative to wind speed, while surface layer models and auxiliary information used to convert winds to stress are not accurate enough (Portabella and Stoffelen, 2009); therefore, winds have historically been calibrated to equivalent neutral winds (or stress equivalent winds) rather than wind stress (Ross et al., 1985; Kara et al., 2008a,b; Stoffelen et al., 2017a). In other words, satellite instruments respond to ocean characteristics that are driven by stress rather than by wind; however, the products are “winds” that have been modified to be consistent with stress.
Another issue to consider is that satellite winds are relative to currents (Cornillon and Park, 2001; Kelly et al., 2001; Plagge et al., 2012) and thus likely to be further modified by surface wave characteristics via their dependence on stress (Quilfen et al., 2004; Bourassa, 2006). Still, some studies have not identified statistically significant differences (Portabella and Stoffelen, 2009). Improvements in our understanding of remotely sensed winds made in the last decade are expected to improve ocean forcing in the coming decade. Simultaneous observations of winds and currents (e.g., Rodriguez et al., 2019, this issue) will likely make a large contribution to better understanding observations related to air-sea coupling.
Rain Contamination
For scatterometers, there are two principal bodies of knowledge associated with the subject of rain contamination. The first is expanding the physical basis and modeling of the ocean surface spectrum (especially the relevant Bragg scattering elements) due to rain impacts as a function of rain intensity wind speed (Stiles and Yueh, 2002; Draper and Long, 2004; Weissman and Bourassa, 2008, 2011; Weissman et al., 2012; Ulaby and Long, 2014). Rain contamination is most pronounced at shorter wavelengths (Ku-band, Ka-band). At Ku-band, the primary effect of rain is increased backscatter from the rain column and rain-induced roughening of the surface, resulting in positive speed biases in wind retrievals. Only for higher wind regimes (>20 m/s) does attenuation dominate, resulting in negative biases. Numerous algorithmic methods have been shown to reduce errors in Ku-band winds due to rain contamination (Draper and Long, 2004; Hilburn et al., 2006; Stiles and Dunbar, 2010; Weissman et al., 2012; Stiles and co-authors, 2014). Several of these algorithms are utilized in the latest version of JPL QuikSCAT data product. These are accompanied by physical measurements and their interpretation. Situations involving tropical cyclones and hurricanes are not very common but they are of special interest when accompanied by near simultaneous wind and rain measurements (Weissman and Bourassa, 2011). Early studies of the L-band capability for estimating winds in hurricanes did not lead to extensive applications because the sensitivity was not as strong as Ku-band. However, there were a few studies based on SEASAT technologies that entered the literature in the 1970s and 1980s. One experimental program for hurricane Gloria in 1976 involved three aircraft collecting extensive physical and L-band backscatter data. This included high winds and rainfall (Weissman et al., 1979). Also notable in the results was that heavy rainfall can suppress the L-band surface scattering coefficient. This is relevant for the new CYGNSS cyclone observation program, which depends on the reflected L-band signals from GPS satellites. This earlier work emphasizes the need to consider radar responses to modification of the rain-impacted surface for all wavelengths. Alpers et al. (2016) elaborated this issue using C-band SAR data.
The second body of knowledge focuses on rain screening. Several rain flags and quality control metrics have been proposed over the past two decades. These are mainly based on the inversion residual (Portabella and Stoffelen, 2001; Portabella et al., 2012), the singularity analysis or local wind field decorrelation estimation (Lin et al., 2014; Lin and Portabella, 2017), and/or a combination of different scatterometer-derived parameters which are found to be sensitive to rain (Huddleston and Stiles, 2000; Stiles and Yueh, 2002; Lin et al., 2014). It is found that for C-band systems, the impact of rain on the retrieved wind quality is lower than for Ku-band systems. For example, while only a small fraction (about 0.5–1%) of ASCAT global winds are rejected by QC (Lin et al., 2015b), a much larger fraction (5–7%) of Rapidscat winds are rejected using a similar QC algorithm (Lin and Portabella, 2017). However, thanks to the inclined orbit of Rapidscat, very tight collocations (within a few minutes distance in time) with ASCAT are available, which show that Rapidscat QC is far too conservative, i.e., it rejects a substantial amount of Rapidscat winds which are in good agreement with ASCAT winds (Lin and Portabella, 2017). As such, improved Ku-band QC is required in order to keep valuable Ku-band derived winds in the vicinity of (thus not contaminated by) rain.
High Wind Speed Retrievals
It has been a long-standing challenge to accurately measure high wind speeds, such as those as found in tropical or extratropical cyclones. This is because: (1) in most sensors, the signal saturates when wind speed reaches ~35 m/s (the strength of category-1 hurricanes); (2) the signal is attenuated by heavy rainfall (where we include snow and mixed phase precipitation) that typically accompanies the majority of high wind events; (3) the resolution of the sensors is too coarse to resolve high-gradient regions that typically accompany high wind speeds; and (4) there is insufficient comparison data for validation, and some concern about the accuracy of these comparison data such as dropsondes and SFMR (Uhlhorn and Black, 2003; Uhlhorn et al., 2007; Klotz and Uhlhorn, 2014). All of these factors can result in large errors at very high wind speeds. Some next-generation scatterometers will use cross-polarization and enhanced spatial resolution to mitigate the reduced sensitivity and further improve hurricane-force retrievals (van Zadelhoff et al., 2014; Lin et al., 2017).
Scatterometers, such as ASCAT or QuikSCAT, are able to reliably measure wind speeds up to ~35 m/s, at which point they lose sensitivity and the signal begins to saturate (Donelan et al., 2004; Hwang et al., 2013; Hwang and Fois, 2015; Sapp et al., 2016). C-band scatterometers perform better in rainfall than Ku-band scatterometers, but existing C-band scatterometers sacrifice spatial coverage to do so. Most scatterometers have spatial resolutions of roughly 25 km, despite 12.5 km grid spacing in products. The combination of spatial resolution and reduced sensitivity at extreme wind speeds prevents them from resolving winds in the eyewall of a hurricane or similar resolution high wind features in extratropical cyclones. However, extratropical cyclones have large areas of high winds behind the trailing cold front, and these are easily resolved. Scatterometers are used frequently in operational applications related to tropical and extratropical cyclones. Another major benefit of scatterometers is that they provide a wind vector, not just the scalar wind speed.
The new capabilities of recent Radarsat-2 and Sentinel-1 C-band SAR missions with both co- and cross-polarized channels demonstrated the Complementarity of these two polarizations for ocean surface wind measurements. In particular, compared to co-polarized signal, the cross-polarized backscattering has a very weak incidence and azimuth angle dependency with no indication of saturation for the strongest wind speeds (up to 75 m/s). Following the pioneering work from Fu and Holt (1982) or Katsaros et al. (2000) on hurricane observations with SAR, these capacities have opened new perspectives for ocean surface wind speed measurements in Tropical Cyclones (e.g., Zhang and Perrie, 2012; Horstmann et al., 2013; Hwang et al., 2015; Mouche et al., 2017), including the Tropical Cyclone inner core. Indeed, while there are a variety of sources for TC outer-core wind data, the only inner-core wind data that are routinely available at present are collected by airplanes and limited to the Atlantic and East pacific hurricane seasons. C-Band SAR is the only space-borne instrument able to probe at very high resolution under extreme conditions. Moreover, dedicated acquisition strategy based on hurricane forecast tracks such as the Hurricane Watch program in Canada (Banal et al., 2007) or SHOC in Europe (Mouche et al., 2017) have proven to be efficient to mitigate the time sampling limitations (due to duty cycle) and provide comprehensive dataset over hurricane eyes (Li et al., 2013; Mouche et al., 2017). To note, the potential of both cross and co-polarization yielded to several proposals of concept missions, including the scatterometer onboard the Metop-SG series (Stoffelen et al., 2017b). C-band scatterometer cross-pol measurements obtained from hurricane flights with the NOAA WP-3D aircraft have also shown the sensitivity of the cross-polarized response to extreme winds (Sapp et al., 2016, 2018).
Passive microwave radiometers, such as WindSat, overcome some of the precipitation attenuation issues by obtaining measurements at multiple channels that respond differently to precipitation, although the attenuation at high winds does negatively impact the direction retrievals (Meissner et al., 2011; Zabolotskikh et al., 2015). Microwave radiometers also tend to have slightly coarser spatial resolution than scatterometers, and hence cannot retrieve winds as close to the coast. However, the passive signal does not have the reduced sensitivity issues of scatterometers, allowing for wind speed retrievals at higher wind speeds in principle. The use of radiometer wind speeds to support operational weather applications is increasing and was recently included in the Automated Tropical Cyclone Forecasting Systems (Sampson and Schrader, 2000).
The recent availability of space-borne L-band radiometers, which operate in the low range microwave frequencies (1–2 GHz), also helps overcome the signal saturation and precipitation attenuation shortcomings of scatterometers. L-band radiometers are minimally affected by rain or frozen precipitation (Wentz, 2005; Reul et al., 2012). The signal they receive remains sensitive to increasing wind even in wind speeds up to 70 m/s (Reul et al., 2012, 2016; Yueh et al., 2013; Meissner et al., 2014, 2017; Fore et al., 2016), which is the strength of category-5 tropical cyclones. Both the European Space Agency Soil Moisture and Ocean Salinity (SMOS) and the NASA Soil Moisture Active Passive (SMAP) L-band radiometers are able to provide useful estimates of extreme ocean wind speeds at a spatial resolution of 40 km (Fore et al., 2016, 2018; Reul et al., 2016, 2017; Meissner et al., 2017). However, the high-gradient regions, such as the eye and eyewall of hurricanes, are still unable to be resolved with a spatial resolution of 40 km.
SMOS (Kerr et al., 2010; Mecklenburg et al., 2012) is a passive interferometer that measures effectively the spatial Fourier transform of the emitted brightness temperature. SMAP (Entekhabi et al., 2010, 2014) has a real aperture consisting of a spinning mesh antenna 6 m in diameter. Achieving the desired spatial resolution of 40 km with the low L-band frequency requires either a large antenna or the utilization of the synthetic aperture technique. Wind speeds are processed and distributed for both sensors (www.smosstorm.org, ftp://podaac.jpl.nasa.gov/allData/smap/L3/JPL/V4/, www.remss.com/missions/smap).
For wind speeds below 15 m/s, scatterometers (QuikSCAT, ASCAT, RapidScat, OceanSat, ScatSat) outperform L-band and polarimetric microwave radiometers in the measurement of scalar wind. However, at high wind speeds, above 25 m/s, L-band and polarimetric microwave radiometers have a distinct advantages (sensitivity) and disadvantages (lower spatial resolution and inability to be used close to the coast) compared to current scatterometers. All of these instruments could be further improved with better resolution. This applies, in particular, to areas of strong wind gradients and heavy precipitation, as found in tropical cyclones and strong cold fronts. Therefore, a combination of polarimetric microwave radiometers with multiple frequencies, scatterometers, and L-band radiometers provides a complementary set of instruments for measuring ocean surface wind speeds that can be made even better if the resolution is further improved.
Multi-Satellite Wind Products
Multi-satellite wind products provide vector winds on a regularly spaced temporal/spatial grid. They attempt to preserve the satellite wind information characteristics and facilitate many science and operational applications. Single satellite sampling view the Earth usually at a single local time (both AM and PM) and are sometimes sensitive to precipitation or have no directional information. In contrast, much of the satellite wind information is generally ignored by design in global NWP models, which generally lack deterministic mesoscale structure. Multi-satellite wind products attempt to bridge the gap between single satellite products and NWP models. They resample or interpolate the satellite wind observations to regular (typically 6-h) time intervals and allow diurnal information into the processing stream of the winds over the world's oceans.
These products have several limitations for ocean vector winds including the lack of directional information in some satellite retrievals and inhomogeneous sampling caused by regions and times where there are no satellite observations or when satellite observations are affected by rain. In many blended products, a background field (usually obtained from NWP output) is used to fill regions with no observations. The background has different spatial characteristics to satellite measurements (Vogelzang et al., 2015) and may contain significant regional or global biases relative to satellites. For rainy regions, moist convection is generally poorly represented in global NWP (Lin et al., 2015b) except where observations are available for assimilation. The large mean and variance spatial biases in ERA-Interim may be corrected by computing and subtracting local mean and variable adaptations to ERA over a few days (Trindade et al., 2017; Stoffelen et al., 2019). Note that satellite winds are relative to ocean currents rather than relative to a fixed Earth surface, in contrast to both conventional observations and NWP data used as a background in these products. This difference likely leads to biases in regions with high velocity currents (McGregor et al., 2017).
Another limitation of the use of multi-satellite products is the difficulty in maintaining the subtle decadal wind trends that are contained in the stable satellite observations (Belmonte et al., 2017). These trends can be small (0.1 m/s/decade) and they can be distorted by the background field and by changing sampling. One remedy for this is to use the satellite record to monitor and correct for these types of systematic errors (Verhoef et al., 2017).
The Cross-Calibrated Multi-Platform (CCMP) ocean vector wind analysis (Atlas et al., 2011) is a quarter-degree, 6-hourly, near-global Level 4 vector wind product. Two similar products are OAFLUX (Yu et al., 2008) and Bentamy et al. (2003), which are both created using a variational analysis method that combines wind measurements from satellite retrievals and in situ measurements with a background field from a weather model. For example, CCMP version 2 (V2.0) uses wind retrievals from imaging microwave radiometers (SSM/I, SSMIS, TMI, AMSRE, AMSR2, GMI, and WindSat) and microwave scatterometers (QuikSCAT and ASCAT). Measurements from moored buoys (NBDC, TAO-TRITON, PIRATA) are directly included in CCMP, whereas they are used to bias adjust the background field in the AOFLUX product. The CCMP V2.0 background field is the 6-hourly ERA-Interim reanalysis. The background for OAFLUX is the bias adjusted relative to OceanSITES buoys. Each of these products extends more than 30 years, from mid-1987 to the present time, and will be further extended as buoy data and reanalysis fields become available. McGregor et al. (2017) recently evaluated CCMP V2.0 in the Tropical Pacific and identified several issues, including regional biases correlated with currents and distortion of derivative fields near the locations of moored buoys. We recommend a similar analysis of other gridded products.
Observing System Governance
There are three distinct satellite research communities (scatterometry, radiometry, and SAR) and a coastal HF radar community. The satellite communities interact at a very high level through the Committee on Earth Orbiting Satellites and the Coordination Group for Meteorological Satellites. Satellite data are widely used by national weather forecasting agencies that have international obligations to provide weather warning and forecasting information within their areas of responsibility under the umbrella of the World Meteorological Organization. Satellite ocean surface vector wind (OSVW) data are utilized in the daily operations of all national weather service offices with marine warning and forecasting responsibilities. These data are used to aid decisions to initiate, continue and terminate marine warnings, including advisories for tropical cyclones; adjust short-term marine forecasts for the intensity and geographic coverage of winds; identify swell generation areas for longer-term wave forecasts; identify lows, highs, fronts, and convergence zones and examine their intensity and trends; and verify in real-time the NWP analyses of winds, waves, and feature intensity.
Militaries also provide marine weather forecasting and warning services to support military operations. At a science and applications level, the scatterometry community interacts with the wind vector portion of the radiometry community and a portion of the radiometric wind speed community through the IOVWST. There is overlap with the SAR research and applications community, with common definitions and model functions for retrieval. European and U. S. scientists contributed to the cal/val of all scatterometers and started cal/val collaboration with India and more recently China.
Satellite wind products are made available by the producers and often through national laboratories. Specialized products are available from research centers and private companies. All scatterometry data are made publicly and freely available. Some SAR data are only available commercially. Scatterometer and radiometer data are very well-intercalibrated (Verhoef et al., 2017; Wentz et al., 2017) except for wind speeds >20 ms−1, for which there is a 3 ms−1 bias between the most popular products (Vandemark et al., 2018) due to the absence of an absolute and a consistent in situ wind calibration reference.
The coastal HF radar community has high level governance from the Global Ocean Observing System (GOOS), with regional and a few national groups providing more localized governance. While there has been intercomparison with satellite data, much of the data from coastal HF radar have been too close to land for comparison to satellite date. The differences in spatial and temporal sampling between satellites and radars also contributes to differences in application and hence differences in user communities.
Data and Information Systems
The models for distribution of scatterometer data can be classified as either near-real time or delayed mode. NOAA and the Royal Netherlands Meteorological Institute (KNMI) produce near real-time scatterometer data for operational use that are subsequently archived. The Eumetsat Ocean & Sea Ice Satellite Application Facility (OSI SAF) operational product (developed by KNMI) is considered a science quality product, but to make it more homogeneous old data is reprocessed to the highest and most recent standards (Verhoef et al., 2017). Also, other science quality products are produced in a delayed mode. This is the norm for scatterometer products from JPL and Remote Sensing Systems. The speed of processing these science quality products had dramatically increased over the last decade. SAR wind data (section Synthetic Aperture Radar) are slower in production and cover only a small part of the ocean surface. All these products are made available through national laboratories or private companies. There are differences in formatting and metadata from group to group, which has resulted in a great deal of confusion in the user community. Similar to the Copernicus Marine Environment Monitoring Service (CMEMS), the Center for Ocean-Atmospheric Prediction Studies at Florida State University recently produced scatterometer data in a common format with common metadata, retaining the key information from the original data provider and stored in daily files rather than orbits. Thus, one code could be used to read data from several different scatterometers. One key shortcoming that must be addressed in future products is a rain impact flag that has a similar interpretation from product to product. The discussion in section Interpretation of Satellite Winds clearly indicates that while longer wavelengths can be used to greatly reduce problems with attenuation and backscatter associated with rain, that the rain-induced modification of the surface will impact retrievals. Therefore, we recommend that approaches such as Stiles and Dunbar (2010), with a rain impact flag that is similar to a rain-induced uncertainty in the vector wind components. Collocations of RapidScat with ASCAT and ASCAT with ScatSat will help to align Ku- (~5% of data) and C-band (~0.5–1% of data) quality assessments (e.g., Lin and Portabella, 2017).
Hazards and Marine Safety
The primary operational benefit of satellite OSVW observations is the improvement of weather forecasting and warnings. In addition, knowledge of the winds and wind generated waves over the ocean is indispensable for the maritime transportation, fishing, and oil production industries, as well as for search and rescue efforts and the accurate tracking and management of marine hazards such as oil spills. It is also essential for determining the ocean forcing, wind induced mixing, currents (Kelly et al., 2004), and air/sea CO2 fluxes. Satellite OSVW data is now routinely utilized by operational weather centers around the world. The number of open ocean buoy and ship reports available at any given time is very limited, so the systematic mapping of the global ocean wind field delivered by satellite remote sensing instruments provides valuable situational awareness of conditions at the ocean surface.
Impact on Numerical Weather Prediction Winds
Currently, we can identify the deterministic scale for wind data assimilation, which is the scale supported by observations in both space and time to deterministically initialize the smallest (short-lived and small-amplitude) evolving scales in weather models. These scales will remain larger than 100 km over sea due to a persistent lack of temporal wind observation coverage. An effective dynamical model resolution can be defined, which is 5–10 times the grid length and generally smaller than the aforementioned deterministic scale. The ongoing challenge is to maximize the benefit from higher resolution observations to help support the evolution of the fast small-scale atmospheric structures, whilst the temporal coverage over sea remains limited (Stoffelen et al., 2019). This means that model scales smaller than the deterministic scale, essentially weather model noise, need to be accounted through data assimilation (Marseille and Stoffelen, 2017). For regional NWP, very high horizontal resolution models with grid lengths of 300 m or less are anticipated at the Met Office and elsewhere. For fine-scale model grid lengths, it will be important to consider the scatterometer footprint to reduce the representativeness errors and account for the deterministic scales, as mentioned above. With increased supercomputer resources, we can expect mesoscale model improvements from the use of rapidly updating 4D-Var assimilation schemes, resolving the temporal and spatial scales of convection. Further research is needed to develop more realistic, situation-dependent models and observation error schemes [based, for example, on the wind variability within the resolution cell (Lin et al., 2016)] that can improve the balance in the weight given to observations and background, and provide the optimal spatial filtering in the analysis.
Although advancing meteorological applications to resolve smaller scales offers obvious benefits, measuring mesoscale, and convective-scale wind structures poses daunting challenges (Stoffelen et al., 2019):
1. Spatial resolution and coverage must be sufficient to capture the small atmospheric scales globally;
2. Accuracy must be sufficiently high to measure the gradients on the small scales;
3. Temporal sampling must be enhanced to match convective time scales (30 min); and
4. Observation timeliness must match this time scale as well as the warning horizon needed to take action to avoid societal impacts.
NWP data assimilation is based on the best linear unbiased estimator (BLUE) and generally bias correction schemes are used to remove observation minus model biases. Figure 4 shows NWP model biases against scatterometers. Since typical random scatterometer errors on global model scales (150 km) are about 1.5 m/s (Stoffelen et al., 2017b), many locations exist where monthly biases are larger and the BLUE paradigm is violated. We note that the largest differences between scatterometer and the European Centre for Medium-Range Weather Forecasting (ECMWF) model winds appear in regions near the Inter Tropical Convergence Zone, regions with ocean currents, and near land masses or sea ice. These areas correspond to areas with large atmospheric dynamics and extensive moist convection (Belmonte and Stoffelen, 2019). In addition to considerable speed biases, substantial systematic wind direction biases also exist in NWP (Sandu et al., 2011). NWP biases occur in all NWP models and are due to fast or mesoscale processes resolved by the scatterometer but not by models, such as (moist) convection (Lin et al., 2016), atmospheric turbulence (King et al., 2015), gravity waves and systematic errors in boundary layer parameterizations, or the lack of ocean currents. These biases tend to persist over time (not shown). The occurrence of these spatial biases is, however, ignored in data assimilation and their existence prevents the correct assimilation of observed dynamical weather features, following BLUE; thus, it could be worthwhile to develop local bias reduction schemes for scatterometers to further optimize their impact (Trindade et al., 2017).
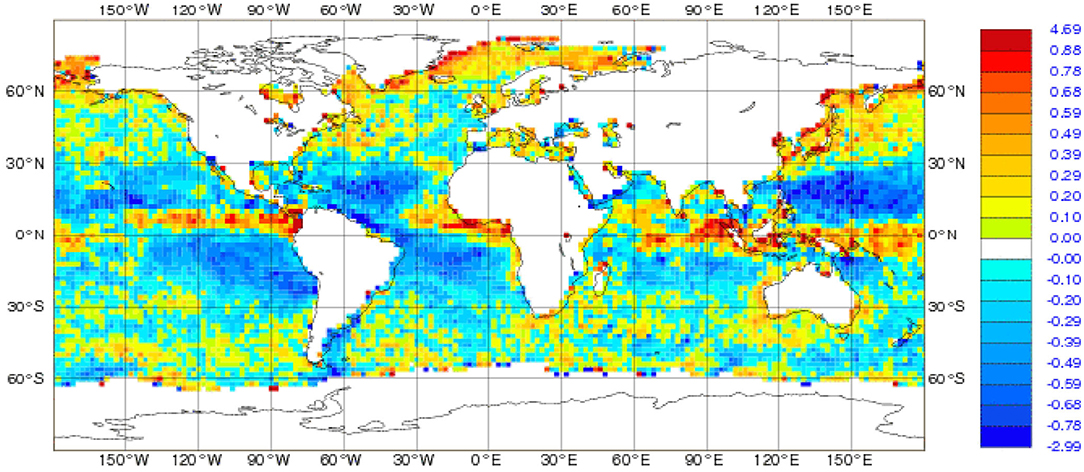
Figure 4. Accumulated statistics for 10-m equivalent-neutral mean wind speed differences in ms−1 between ASCAT-A and the European Centre for Medium-Range Weather Forecasting (ECMWF) first guess (ASCAT-A minus ECMWF) for the period from 21:00 UTC on 31 October 2015 until 9 UTC on 5 December 2015 in boxes of two by two degrees. ©EUMETSAT NWP SAF.
Accurate strong winds are important in NWP in order to get an accurate analysis of high wind speed, thus improving forecasts of severe weather events and tracking of tropical and extra-tropical storms. Strong winds are relatively rare but their impact can be very large. The current generation of scatterometer instruments is still lacking in terms of analyzing high wind speeds, which are not sufficiently accurate above 20 m/s. Other surface wind measurements that provide strong wind observations do not provide wind vectors. Therefore, the idea of using cross-polarization measurements (which will be used on the next scatterometer generation on board the METOP-SG missions) to extend the useful range of wind speed to 40 m/s or higher, is very promising. Alternatively, the Ka-band has greater sensitivity at high wind speeds and could provide a small enough footprint to see between rain bands (overcoming the issue of seeing through rain bands and dealing with rain modification of the surface).
Many NWP centers are moving toward coupled ocean-atmosphere global models and coupled data assimilation systems. This is expected to allow a better use of near-surface observations, which could help to provide a more consistent analysis of both atmosphere and ocean variables. Recent experiments in the ECMWF CERA-SAT coupled assimilation system proved that the assimilation of surface winds, similar to scatterometer observations, has a substantial impact on the ocean parameters (e.g., temperature, salinity, and currents). The impact on the ocean variables is not only confined to the ocean surface but propagated down into the ocean column. Scatterometer observations provide information on the wind-induced surface roughness (and therefore on the ocean mixing). Their assimilation in coupled systems is particularly important in areas where the detection of wind-induced ocean cooling is essential to correctly predict the intensification of the storm (e.g., tropical cyclones).
Impact of Satellite Winds on Wave Model Development, Applications, and Forecasting
Satellite winds offer a unique way to describe ocean surface conditions and the momentum transfer to the water, hence they support the modeling and forecasting of ocean wave generation and storm surges. Scatterometers respond to cm-waves on the ocean, which generally do not appear to be affected by sea state. However, wind scatterometers may be sensitive to parameters other than those that relate (correlate) with stress-equivalent winds, U10S (de Kloe et al., 2017). Variable effects such as rain (mainly for Ku-band scatterometers), extreme wind variability, complex sea states, SST, and currents can also affect geophysical model function accuracy, but are well-controlled.
Impact on Storm Surge Forecasting
Surface wind fields are the primary source of information for storm surge forecasting (Welander, 1961). Storm surges are mainly driven by momentum imparted by wind stress. Another important source of momentum for storm surges is large-scale coastally-trapped waves that transport energy over a distance impacting surge magnitude (Morey et al., 2006). Many storm surge forecast models do not directly include waves and may not include effects of tides, river runoff, and inverse barometer, implicitly adding these effects to the storm surge prediction (e.g., Jelesnianski et al., 1992; Weisberg and Zheng, 2008; Dukhovskoy and Morey, 2011). A basic system of linear storm surge prediction equations that has been used in many forecasting models is (Murty, 1984) dependent on the depth-integrated velocity components (transport), sea surface elevation, the wind stress vector, the bottom stress vector, the bottom depth, and atmospheric pressure. The evolution of a storm surge is controlled by balance between the pressure gradient force (due to the sea surface elevation), surface and bottom stresses, and the atmospheric pressure gradient. Calculation of the surface wind stress relies on the knowledge of the storm wind fields, which are very complex and vary greatly among the storms. The typical wind field of a storm is characterized by the radius of maximum sustained wind and the radius of the eyewall. However, storm wind fields are not symmetric, especially when the storm approaches land. Thus, high-resolution surface winds data are essential for accurate storm surge prediction. Temporal resolution is also important, especially for fast-moving storms, to force surge models.
Outer wind fields are also essential for storm surge forecasting. Many storm surges are preceded by forerunner waves (Kennedy et al., 2011) or strengthened by remotely generated shelf waves (Morey et al., 2006; Dukhovskoy and Morey, 2011). In both of these cases, outer wind fields determine the formation of these long waves propagating as coastal-trapped waves over large distances. Prediction of these waves is crucial for evacuation planning.
Observing the location and direction of stronger winds is key, with the more extreme winds in the core of a storm being much less important, as they have a smaller impact on the storm surge. Six-hourly sampling or better is desired.
Marine Nowcasting
Perhaps the most significant impact of satellite OSVW observations on national weather service operations has been the ability to routinely and consistently observe winds of hurricane force intensity in extratropical cyclones. This new capability, which started with the QuikSCAT mission, allowed forecasters to delineate and introduce (in December 2000) a new wind warning category of hurricane force intensity for extratropical cyclones. Prior to then, only two warning categories existed for extratropical wind sources—gale (33–47 knots) and storm (48 knots and higher)—with the most severe storms included in the rather common storm warning category, making it difficult to highlight and adequately warn for their severity. Forecasters had long been uncomfortable with this two-tier warning system, but a consistent observing capability was needed to divide the common occurrence of winds of 48–63 knots and the less common and more dangerous winds in excess of 63 knots. QuikSCAT wind observations provided that capability.
The observational requirements for marine nowcasting are similar to those for storm surge forecasting except that measurements of extreme winds are required and near-shore winds are particularly useful.
Tropical Cyclone Forecasting
Over most of the global tropical cyclone formation basins, remotely sensed winds are the primary source of ocean surface wind information available to tropical cyclone forecasters and forecast models. The North Atlantic basin has the advantage of routine aircraft reconnaissance, but only when tropical cyclones are close enough to land for the aircraft to reach them. That said, there are too few non-satellite (in situ and aircraft) extreme wind observations (>30 ms−1) to calibrate satellite observations. Therefore, calibrations from sufficient observed conditions are extrapolated to higher wind speeds.
For forecasters, ocean surface wind vectors from scatterometers are an essential tool used for identifying when a tropical disturbance has obtained a closed circulation and tropical storm force winds, thus becoming a tropical cyclone. Surface wind information from scatterometers and radiometers can also be used to identify when a tropical cyclone has reached hurricane/typhoon strength and to identify important distances from the storm center (called wind radii) at which wind exceed operationally developed thresholds (Bender et al., 2017). Obtaining information on the wind radii of tropical cyclones is necessary for forecasters to be able to issue watches and warnings that enable advance preparations to reduce the loss of property and life (Knaff et al., 2018). In addition, the surface wind information provided by scatterometers and radiometers also allows the forecast models to initialize tropical cyclones and their environment more accurately, which leads to more accurate model forecasts (Isaksen and Stoffelen, 2000; Leidner et al., 2003; Stoffelen et al., 2013). Without remotely sensed surface winds, the accuracy of tropical cyclone forecasts would be degraded.
Meaningful comparisons between satellite-derived intensities and the operational 1-min sustained winds from the Best Track3 (BT) data set require that the BT data be scaled down to 10-min sustained winds. A scale factor of 0.93 has been applied to 1-min winds as recommended by the World Meteorological Organization (Harper et al., 2010). Powell et al. (2010) used 0.91 and others have used as much as 0.87. The L-band radiometers (SMOS, SMAP) produced reliable estimates of the TC intensity when spatially averaged over the radiometer footprint. Examples are shown in Figures 5–7. The footprint averaged winds reached 60 m/s in very intense TC. This calibration has been demonstrated by comparing the L-band radiometer wind speeds with spatially averaged wind speeds from the Stepped Frequency Microwave Radiometer (Reul et al., 2016; Meissner et al., 2017; Fore et al., 2018). The advantage of L-band radiometry is that the L-band emission from whitecaps keeps increasing approximately linearly with wind speed (Nordberg et al., 1971; Monahan and O'Muircheartaigh, 1980; Reul and Chapron, 2003; Anguelova and Webster, 2006). Currently, the major limiting factor of the L-band radiometers to measure winds in tropical cyclones is their spatial resolution (~40 km). In many cases, this does not allow the structure around the eye of the tropical cyclone to be resolved and also it puts a limitation on how close to the coast accurate ocean wind speed measurements can be performed. Another concern is the influence of heavy rain on whitecapping. Early analysis indicated there is some sensitivity to heavy rain, but this is small compared to the influence or rain (Draper and Long, 2004) on higher frequency radiometers and scatterometers. Finer spatial resolution is needed to further such studies.
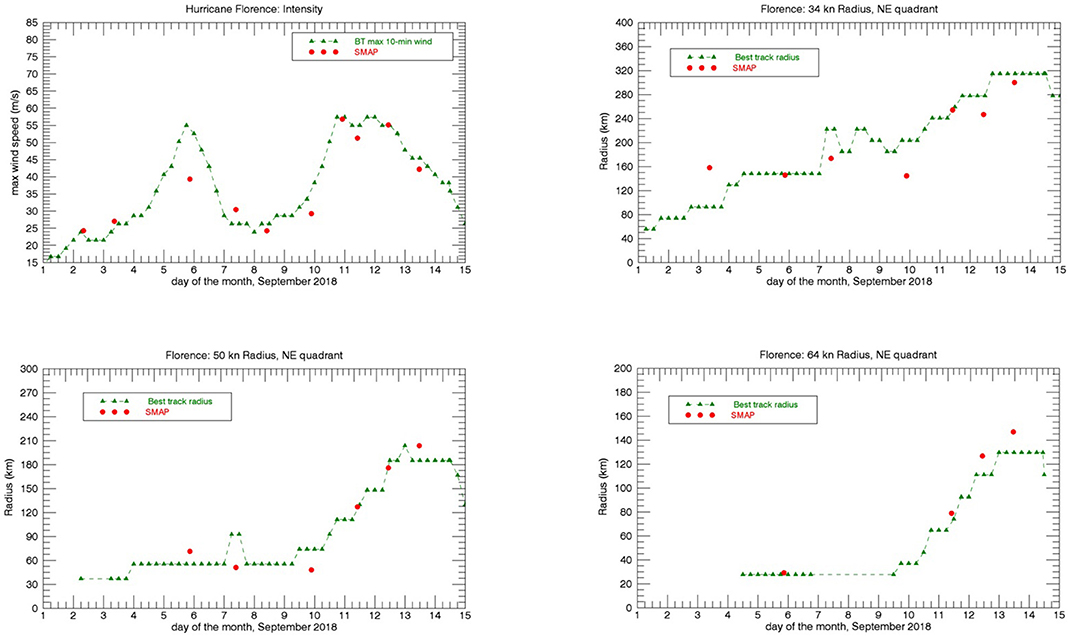
Figure 5. Time series of intensity, 34-kt (gale force), 50-kt (storm force), and 64-kt (hurricane force) wind radii of Hurricane FLORENCE in September 2018. The red circles are the values from SMAP (40 km spatial resolution). The green dashed line shows the Best Track (BT) estimates from the U.S. National Hurricane Center. The BT intensity values have been scaled to 10-min sustained winds (Harper et al., 2010). The radii are shown for the NE sector.
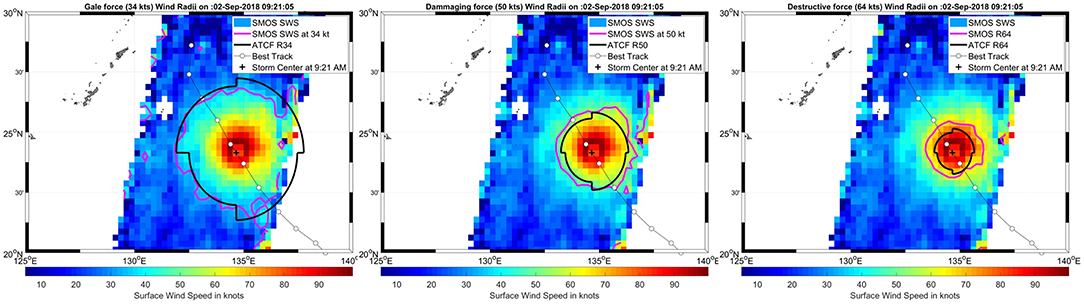
Figure 6. Surface wind speed retrieved from SMOS data as the satellite swath intercepted Super-Typhoon JEBI on 02 SEP 2018. The wind speed contours from SMOS wind (pink) at 34 (left), 50 (middle), and 64 kt (right) are superimposed with Automated Tropical Cyclone Forecasting wind-radii forecasts (thick black). The direction of motion of the storm in the Best Track is from SE to NW.
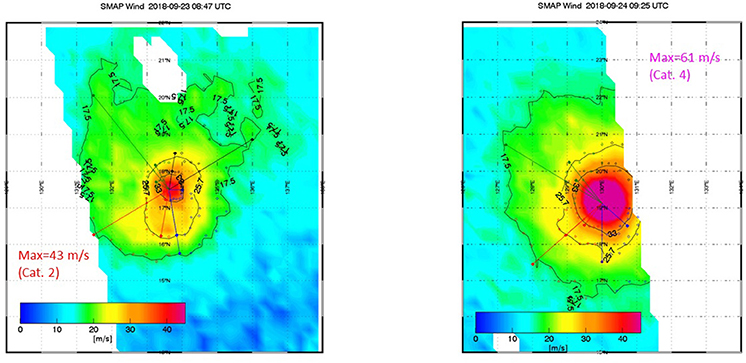
Figure 7. Two snapshots of Typhoon TRAMI observed by SMAP (40-km spatial resolution). The observed intensity changed from 43 ms−1 (89 kts, category 2) on 2018-09–23 08:47 to 61 ms−1 (119 kts, category 4) on 2018-09-24 09:25 within <25 h. The lines show the 34, 50, and 64-kt wind radii in the various sectors.
Ocean surface winds also provide critical information to improve our still lacking understanding of the physical processes that determine hurricane genesis and evolution. Of particular interest to the community is improved understanding of what leads to hurricane rapid intensification (RI) and how we can better predict it. A very important aspect of the RI process is regarding the location of the convective activity with respect to the vortex structure as depicted by the Radius of Maximum Wind (RMW). Rogers et al. (2013) found that for intensifying hurricanes the peak in the distribution of deep convective clouds (CBs) was preferentially located inside the RMW, whereas for steady-state hurricanes the CBs were primarily located outside the RMW. Such a difference in the radial distribution of CBs was deemed important based on balance arguments (e.g., Shapiro and Willoughby, 1982; Vigh and Schubert, 2009). Near-simultaneous satellite observations of precipitation and ocean surface winds (e.g., Figure 8) allows investigation of the distribution of precipitation with respect to the RMW. Recent observational (e.g., Hristova-Veleva et al., 2016) and modeling (e.g., Hristova-Veleva et al., 2018; Saiprasanth et al., 2018) studies provide strong indications for the predictive capability of this approach.
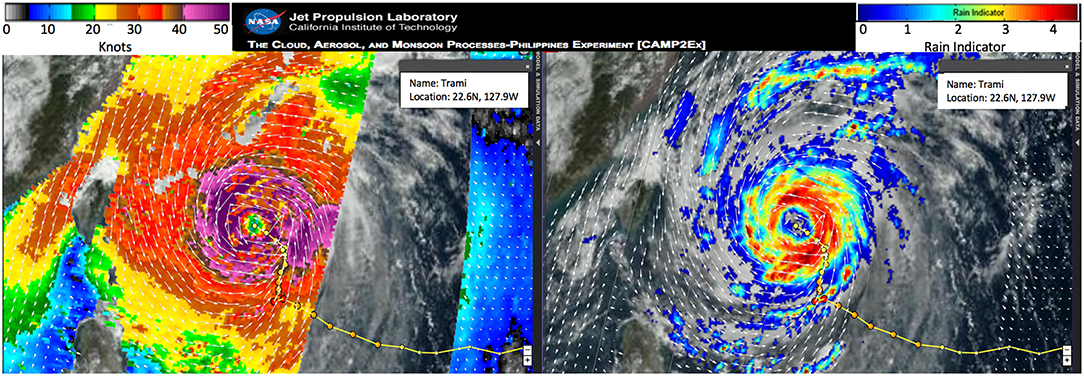
Figure 8. Retrievals of the ocean surface winds from the Ku-band ScatSat-1 scatterometer as it flew over typhoon TRAMI on 28th September 2018 at 01Z (left). Almost coincident depiction of the precipitation structure as observed by the passive microwave radiometer GMI on the GPM-core satellite, overlaid with the wind vectors retrieved from Scat-Sat1 (right). The background in both panels shows the cloud field as depicted by the visible channels of the Himawari geostationary satellite. Such multi-parameter and multi-instrument data can be visualized interactively in the CAMP2Ex and the North Atlantic Hurricane Watch portals that are part of the JPL Tropical Cyclone Information System.
An important use of SAR wind vector retrievals is the application to tropical cyclones (Li, 2017). While many wind sensors can retrieve wind speeds at or above the hurricane threshold (~33 m s−1), currently only SAR can provide the kilometer-scale resolution needed to capture the extreme radial shear in the surface wind field. Gall et al. (2013) suggested that high resolution information, especially data associated with the inner core and eyewall region, is likely to be critical for improving hurricane intensity forecasts.
The Canadian Space Agency runs a Hurricane Watch program and the European Space Agency started the Satellite Hurricane Observations Campaign based on the Sentinel-1A,B SAR missions. Tropical cyclone track forecasts are used to predict possible overlaps with the satellite image track and targeting decisions are made with relatively short lead times. Because the tropical cyclone boundary layer is an ideal environment for roll formation (Foster, 2005, 2013; Morrison et al., 2005) wind direction retrieval using the maximum gradient method of Koch (2004) or the maximum contrast method of Wackerman et al. (2006) work well (Horstmann et al., 2002, 2013; Horstmann and Koch, 2005). Research has shown that cross-polarization SAR imagery has greater sensitivity at high winds than single polarization (HH or VV). Furthermore, its sensitivity to wind direction is relatively small. Very simple geophysical model functions have been constructed (Horstmann et al., 2013; Hwang et al., 2015). Sensors such as Sentinel-1 that can retrieve simultaneous co-polarization and cross-polarization imagery have the potential for improved wind vector retrievals.
Ocean Forcing, Ecosystem Health, and Biodiversity
Wind information is not only essential to depict convection in the tropics, but it also provides the Ekman ocean currents due to wind stress and an accurate view of the tropical circulation in the atmosphere, which is otherwise lacking. Observation requirements vary greatly depending on the spatial and temporal scales of phenomena that need to be captured in a model. To a rough approximation, the accuracy requirement is 10 to 20% of the variability associated with the phenomena. Similarly, sampling requirements in space and time are driven by the need to capture the variability, and perhaps further constrained by the needs to reduce the random error in the observations. These requirements are estimated in Figure 9.
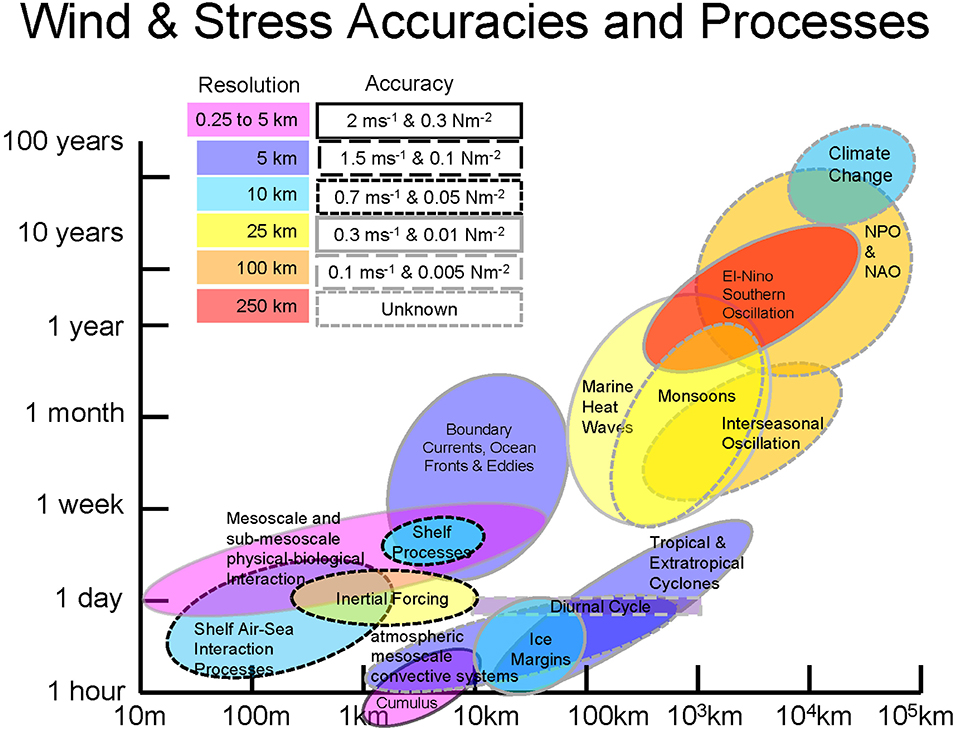
Figure 9. Summary of observing system requirements for accuracy and resolution. For the larger-scale processes (≥100 km), there will be sufficient sampling to reduce random errors to the point where they are a small concern compared to systematic errors in calibration. Currently, both bias and systematic errors are important at 25 km and at finer scales random errors will dominate on shorter timescales. Some of the smaller-scale processes (e.g., physical-biological interactions) are influenced more by horizontal shear than by the magnitude of the wind or stress, and therefore have very little sensitivity to systematic errors, but require finer spatial resolution to determine these spatial derivatives.
The need for these products in the ocean community is immense, as they provide spatial information on air-sea interaction and thus exchanges of heat, momentum, water vapor, gasses, and aerosols through processes of mixing, upwelling, and downwelling in both the atmosphere and the ocean. Moreover, this highly dynamic interface covers about 70% of the Earth's surface and, therefore, determines climate dynamics to a large degree.
Satellite vector wind products are essential for determining the large-scale ocean circulation and transport. Vector winds are also needed to estimate the ageostrophic (Ekman) component of ocean currents, and consequently are linked to coastal upwelling, primary productivity, cross shelf transport, ice transport, mixed layer evolution, and deepwater formation. Moreover, accurate wind speeds are essential for reliable computations of air/sea heat fluxes (sensible and latent heat fluxes) as well as mass fluxes (e.g., CO2 and H2O), making surface winds critically important for budgeting energy, moisture and carbon, and for studies of ocean acidification and fish stocks. OSVW and surface stress are linked to ocean, atmospheric, cryospheric, and terrestrial climate change and listed as essential climate variables.
Marine pelagic communities are fueled by the productivity of tiny plankton that float with the currents and are supported by upwelling of deepwater nutrients. Surface wind stress, which simultaneously drives surface currents and introduces energy for turbulent mixing, is thus a primary driver of spatial and temporal variability in communities ranging from phytoplankton to fish. Accurate, high-resolution, remote measurements of wind stress have multiple potential utilities for biological and chemical oceanographers. Surface wind stress can be used to diagnose horizontal currents in the ocean, which are important for interpreting the past history of water parcels sampled during field campaigns. Surface wind stress (and the surface current velocities that must be determined as part of this measurement) can also be useful for diagnosing fronts, eddies, and other meso- and submesoscale features in the ocean. These regions are important habitats for many organisms for a variety of reasons. For example, increased turbulence in frontal regions can stimulate upwelling and vertical mixing, while cold-core eddies continually introduce nutrients to the surface ocean (McGillicuddy et al., 2007; Li et al., 2013). Frontal regions also serve as areas where different water parcels (with potentially different limiting nutrients) can mix, thus alleviating nutrient stress for phytoplankton. Fronts, eddies, and jets can also aggregate organisms in convergent zones and transport organisms long distances (Hofmann et al., 1991; Bakun, 2006). Consequently, these features have been found to be sites of increased primary productivity (Franks, 1992; Benitez-Nelson et al., 2007), higher mesozooplankton and fish biomass (Lara-Lopez et al., 2012; Ohman et al., 2012; Laiz-Carrión et al., 2015), and increased carbon export to the ocean interior (Omand et al., 2015; Stukel et al., 2017). High-resolution wind and current data are essential for interpreting the physical dynamics driving such patterns at the spatial scales sampled during field campaigns or using autonomous floats and gliders.
Surface wind stress is also crucial in mediating air-sea interactions. Air-sea fluxes of gases such as O2 and CO2, dimethyl sulfide, methane, and halocarbons are commonly estimated using a gas transfer velocity (k) and the concentration gradient of the gasses between the oceanic mixed layer and the atmosphere (as measured from ships research cruises or automated ferry box systems). A necessity for an accurate estimate of those fluxes is a well-parameterized wind speed over the residence time of the gas within the water column (Wanninkhof, 1992). By using reanalyzed winds from e.g., the National Centers for Environmental Prediction (NCEP) and the ECMWF, changes in wind speeds prior to collection can be considered and a weighted average gas transfer velocity can be calculated (Jonsson et al., 2013). These data provide basin-wide reanalysis of wind speed data, however uncertainties in gas fluxes are large in oceanic regions where mesoscale events prevail (fronts, eddies, and coastal upwelling zone). High-resolution data can account for this variability and hence provide more precise estimates of gas transfer velocity.
While some regional measurements of wind speed are already in higher resolution (NCEP North American Regional Reanalysis: NARR), those data are lacking on a global scale. As shown in Bender et al. (2011), the standard deviation of differences between ship and reanalyzed winds is about 40% in the Atlantic and can lead to an even higher uncertainty as the gas transfer velocity scales with the square of wind speed.
Data products that would benefit from enhanced resolution include estimates of CO2 fluxes between the ocean and the atmosphere, estimates of net community production (the biological productivity in the mixed layer and hence the biological carbon pump), and estimates of other climate relevant gas fluxes mentioned above.
Currents
Currents are responsible for transporting debris, microorganisms, microplastics, and surface slicks (Maximenko et al., 2019). They are used in search and rescue and ship routing. Large-scale currents are mostly forced by surface winds and the rotation of the Earth. Deepwater currents are related to surface wind stress through Sverdrup transport, and surface currents related to wind and density-driven dynamic layer thicknesses plus Ekman currents (which are modeled by wind stress and frictional mixing). Thus, winds play a very important role in many types of currents, including wave-induced Stokes drift (Mouche et al., 2012).
The winds needed for large-scale currents are relatively easily met. Of greater interest is the episodic forcing from atmospheric storms and fronts, as well as mesoscale and smaller currents. Episodic currents have been shown to be responsible for greatly increasing across-shelf transport (Morey et al., 2009). Therefore, the observations must capture such features. Hurricane winds have been shown to produce 25% of the bioproductivity in a regional sea (Chu et al., 2000; Lin et al., 2003), therefore sampling and resolution should be sufficient to capture the winds around a hurricane. Through the assimilation of wind data in numerical weather models, an interpolation of winds between satellite overpasses may be performed on the larger scales (>150 km), but the small-scale variability measured by scatterometers will generally be lost in NWP fields (Belmonte and Stoffelen, 2019; Marseille and Stoffelen. Furthermore, four dimensional data assimilation does not work well with 25 km-scale winds and observations only a few times a day.
Greater constraints come from the mesoscale interaction of winds and currents (Gaube et al., 2015; Shi, 2017). Currents modify surface roughness associated with waves. These changes in roughness and the currents influence the horizontal shear of wind and stress, causing very strong curl of stress and divergence of winds (Shi, 2017), which greatly increases vertical motion and vertical mixing, modifying the local energy budgets and surface temperature. Modeling studies indicate that changes in SST and winds alter air-sea fluxes and the moisture in the atmospheric column and hence the radiative fluxes. Observation of this kind of coupling requires winds on a 5 km scale and ideally every 3 h, although the temporal resolution is likely to be achieved through data assimilation for coupled weather models. Traditional accuracies appear to be sufficient, albeit on a much smaller spatial scale. Doppler scatterometry has been suggested as an approach to measure coincident surface vector winds and currents (Rodriguez et al. this issue).
Water, Food, and Energy Security
Monsoon winds are critical to many agricultural regions, as they are essential for the supply of water, hydroelectric power, and agriculture. The Indian Monsoon is the best know example, supplying the water needs for a populous nation with agriculture as its leading economic activity. Monsoons also bring much needed rains to Eastern Asia, Australia, Central America, and the south central United States. In general, winds are a key part of the water cycle, crucial for evaporation (85% of rain comes from the ocean) and for transport of moisture. This transport is dominated by large-scale wind and pressure patterns and by atmospheric rivers. Many coastal regions benefit from rain associated with a sea breeze. Wind-driven upwelling supplies nutrients for fisheries. Wind also drive the currents (surface and deeper currents) that transport larva, thus influencing multiple aspects of the life cycle of finfish. In short, winds make enormous contributions to the availability of food from land and sea, and fresh water on land, which is often critical for the generation of energy.
The observational needs for the monsoon-related variability are mostly large-scale in both space and time, and hence sampling needs are well achieved with the existing system. Wind direction is important. However, changes in the winds on weekly to 20-day scales are associated with variability in monsoons (Roman-Stork, 2018). The observational needs for upwelling are much finer observations in space and time, requiring six hourly sampling or better, winds near the coast, and accurate directions. The coastal requirement is more easily met with high-resolution winds, which better resolve upwelling and data closer to the coast.
Marine wind climatologies are also useful for estimating wind resources for power generation. However, sampling must be greatly increased for observations alone to be sufficient. Siting for wind power is often in near coastal regions, where NWP is poor and there are few observations from satellite. Thus, greater temporal and spatial resolution are highly desirable.
Pollution and Human Health
Marine pollution is transported by wind-driven currents and wind-driven waves, resulting in the collection of debris in surface convergence zones as elaborated in Maximenko et al. (2019). A large faction of protein consumed by humans now comes from the ocean, where some of this debris is consumed by marine creatures and then by humans (Cooley et al., 2009).
The other notable contribution of winds to the transport of pollution is associated with land-sea breezes. Cities can emit pollutants into the atmospheric boundary-layer and have them moved offshore by a land breeze only to be returned later by a land breeze. This return of pollution has been noted to substantially impact cities along the United States' Great Lakes (Walter, 1973). The observational requirements for this application are higher resolution winds (5–10 km) and frequent sampling that can be effectively assimilated into a coupled weather model.
The Blue Economy
Oceans are an intrinsic part of the global economy. Commercial fisheries add $270 billion annually to the global gross domestic product, maritime and coastal tourism and recreation is a $7.2 trillion industry, and 80% of international goods are transported by sea (World Bank, 2017). Other important ocean industries include offshore renewable energy, seabed extractive activities, and marine biotechnology and bioprospecting (UNEP, 2015). However, as a public good, oceans are overused, abused and/or degraded. Pendleton et al. (2012) argued that anthropogenic activities are the main reason for the significant deterioration in ocean, wetlands and coral reefs health. About 80% of the pollution and litter in oceans come from land-based human activities (Galgani et al., 2015). To avoid irreversible degradation and encourages better stewardship of natural resources, including oceans, the United Nations adopted the Sustainable Development Goals in 2015. Within the Sustainable Development Goals, the blue economy is an international agreement that seeks to promote economic growth while encouraging better manage the many aspects of oceanic sustainability (World Bank, 2017).
Other important developments include the fact that commercial ships have doubled in size, waterborne commerce has tripled, and the number of small boats and recreational water crafts has increased during the last 50 years. To keep ships on schedule and safe from dangerous ocean storms, the $200 billion global marine shipping industry increasingly relies on accurate marine warnings and forecasts (Kite-Powell and Colgan, 2001; Kite-Powell, 2011). Accurate wind and wave information helps marine traffic avoid hazardous weather and keeps the costs of goods down, thus making products more affordable. Maritime commerce results in a contribution of $78.6 billion annually and generates nearly 16 million jobs; one out of six jobs in the U.S. is marine-related (NOAA, 1998). As a result of QuikSCAT winds, marine warning and forecast services out to 48 h (for hurricane force cyclones) saves an estimated $135 million annually in the North Pacific and North Atlantic dry bulk and container shipping industry alone by minimizing storm exposure (Kite-Powell et al., 2008; Kite-Powell, 2009, 2011).
The key observing requirements for the blue economy are sampling at 6-hourly intervals and accurate retrievals for extreme winds. Approaches to achieving this accuracy are discussed in section Near Coastal Processes.
Discovery
Air/Sea Surface Fluxes
Estimation of air-sea exchanges of thermal energy (sensible and latent heat fluxes in this context), momentum, and gasses all require surface wind or surface stress. Cronin et al. (this issue) provide detailed accuracy requirements for heat exchange and stress needed for the study of a wide range of processes. In almost all applications, the bias in wind must be small to achieve the required accuracy in stress, latent heat, and sensible heat. The accuracy requirement for uncertainty (random errors) in wind is roughly 18 times the stress requirement, which is achievable given appropriate sampling and resolution of the variability discussed below. The sampling requirement cannot be met without sufficient coverage of diurnal and inertial variability, and the resolution requirement appears to be roughly 5 km assuming that sub-mesoscale variability makes only a minor contribution to fluxes.
One challenge to determine air-sea fluxes stems from the use of transfer coefficients for momentum, sensible heat, and latent heat fluxes, particularly in cases when the fluxes are derived from in situ observations where currents were not measured. Satellite winds are current-relative, whereas in situ winds are Earth relative. We typically assume that eddy covariance methods provide unbiased in situ turbulent fluxes are measured without bias through an eddy covariance method and that in situ winds are measured without bias. In reality, turbulent fluxes depend on the vector difference of wind and current, rather than simply the Earth relative wind. The transfer coefficient is related to a ratio of the observed stress to the wind speed, where that wind speed should be current relative. If winds and currents tend to be in the same direction, the use of Earth-relative winds systematically underestimate the transfer coefficient and satellite-derived fluxes. Measurements of surface currents coincident with surface winds would largely solve this problem and lead to improved flux models.
Coupling Winds With SSTs and Currents
Air-sea fluxes are also modulated by small-scale variability in winds associated with gradients in SSTs (Chelton et al., 2007; O'Neill, 2012) and currents (Gaube et al., 2015; Shi, 2017). A science challenge is to determine the relative importance of wind, boundary-layer stratification and SST in this modulation. Both wind and SST gradients modify the atmospheric boundary-layer in a manner that is correlated with air-sea differences associated with heat and momentum fluxes, leading to small-scale variability in heat fluxes and stress. Furthermore, these processes are non-linear, meaning that the net changes because of this variability are non-zero. Net radiative fluxes are also modified because of changes in SST (modifying long-wave emission) and whitecap fraction (modifying longwave emission and shortwave albedo).
Observational studies of coupling between wind, currents, and SST have been largely based on satellite (Chelton et al., 2007) and in situ (O'Neill, 2012) measurements applicable on scales of ≥25 km, with a few model-based studies (Zheng et al., 2013; Gaube et al., 2015; Ardhuin et al., 2017; Shi, 2017). Modeling research by Shi (2017) used two-way coupling for ocean, waves, and the atmosphere, with ocean-forced changes to the atmosphere feeding back to the ocean. Results showed much stronger coupling in the areas of strong current gradients than seen in studies that did not include waves and currents. These occurred because the ocean-induced changes in stress greatly modified the stress gradients and the curl of the stress, substantially enhancing vertical transport. This finding differed from observational studies, in part because the model had 3 km grid spacing and consequently could capture changes in stress on smaller spatial scales that favor stronger curl. Shi and Bourassa (2019) showed that the current gradients had a large impact on SST gradients and wind gradients. Furthermore, high-resolution mesoscale ocean modeling studies found that strong gradients in currents occur over much of the ocean (McWilliams, 2016, others), suggesting that that the related signals in winds, turbulent fluxes, and upwelling have been missed in lower-resolution observations and models.
The oceanic vertical motion induced by winds and currents is important to biology and biogeochemistry. Vertical motions can transport nutrients and sub-surface water to the surface, with the nutrients causing greater bioproductivity and the exposure of sub-surface water enhancing gas exchanges that are exposure-limited. This motion also likely modifies vertical heat transport, suggesting that there should be greater vertical fluxes of heat along ocean fronts. The observational requirements to examine or better model these processes are 5 km resolution of winds and currents (and ideally SST and ocean color), where the winds and currents are coincident. The accuracy of wind vector components (speed alone is insufficient) is roughly the existing uncertainty for scatterometers (Chelton et al., 2018; Rodriguez et al., 2019) and about 0.5 m s−1 for currents, but at the 5 km scale. There must also be sufficient sampling (about 1.5 times per day, on average) to allow averaging to reduce the uncertainty in currents. Observations on these scales would be a tremendous breakthrough for understanding air-sea coupling processes and consequently for Earth systems modeling.
High Winds
More accurate observations of high surface winds from scatterometers, radiometers, and other spaceborne remote sensing instruments could lead to new discoveries about the magnitude of ocean surface mixing, air-sea fluxes, ocean currents, and the frequency of storm- and gale-force wind events. A better understanding of extreme ocean surface mixing, air-sea fluxes, and ocean currents from high winds may have implications on heat transfer within the ocean mixed layer, vertical nutrient transport, SST, and atmospheric stability, and these impacts can transfer all the way up to the atmospheric synoptic scale and the energy budget of the earth-atmosphere system.
Improved detection of storm- and gale-force wind events has applications in hazard avoidance for ships and extreme weather event impacts on humans, as well as the previously discussed implications on ocean surface mixing, air-sea fluxes, and ocean currents. If the frequency of storm- and gale-force wind events changes there will be implications on the climate scale.
Additionally, improved accuracy of remotely sensed surface winds will improve tropical cyclone detection and forecasting. In basins that rely on remotely sensed winds, being able to resolve high winds in tropical cyclones will provide forecasters with the necessary information to provide better analysis and forecast of surface winds to the public.
Diurnal Variability
Daily variations in solar radiative forcing result in diurnal wind fluctuations (e.g., Simpson, 1994). Near coastlines, differential heating of the land and ocean drives a land breeze/sea breeze circulation, most prominently in the summertime (e.g., Gille et al., 2003; Hyder et al., 2011; Dorman et al., 2013), but diurnal winds are not confined only to the coast. In the open ocean, nearly everywhere equatorward of 30° latitude, statistically significant diurnal winds are observable (Dai and Deser, 1999; Gille et al., 2003, 2005). Diurnal winds can be comparatively small in magnitude relative to wind variability associated with synoptic storms, but their persistence makes them dynamically important and also a challenge for satellite retrievals. Quantifying diurnal wind variability is essential because diurnal winds can interact with diurnal heat fluxes and thus have a net (or “rectified”) impact on upper ocean processes, influencing air-sea heat and gas exchange, mixed-layer depth, SST, and the timing of storms and coastal storm surge.
Full sampling of a diurnal cycle requires a minimum of four measurements, well separated in time, over the course of the 24-h cycle. A single sun-synchronous satellite (or a series of sun-synchronous satellites that all use the same equator crossing time) can only obtain measurements at two times of day, and thus samples at the Nyquist frequency of the diurnal cycle, which precludes determination of the amplitude and phase of the diurnal cycle. Two sun-synchronous satellites with different equator crossing times will sample different phases of the diurnal wind. If the satellites are well calibrated, their measurements can be combined to infer the structure of the diurnal wind, as was done for the QuikSCAT and ADEOS-2 tandem mission (e.g., Gille et al., 2005; Wood et al., 2009; Gille and Llewellyn Smith, 2014). Conversely, if the diurnal cycle were to be overlooked in cross-calibrating the satellites, then there would be a risk of misinterpreting diurnal wind fluctuations as satellite bias. Bias errors could, in principle, be minimized by using prior knowledge of the diurnal cycle to help interpret differences between measurements collected at different times of day. However, prior knowledge of the diurnal cycle is not trivially inferred from sparse observations; Giglio et al. (2018) highlighted the fact that the diurnal cycle has a non-stationary amplitude that varies throughout the year. Annual (and interannual) modulations of the diurnal cycle should be taken into account in evaluating diurnal wind variability. For instance, RapidScat, which flew on a non-sun-synchronous orbit, provided coincident measurements with multiple satellites, offering one strategy for intercalibrating different wind satellites. Diurnal variability and seasonal modulation of the diurnal cycle could be inferred with reasonable skill if the constellation of scatterometers met the IOVWST recommendation (summarized in Scatterometers) for three scatterometers, with two in sun-synchronous orbits at different times of day and a third in a non-sun-synchronous intercalibration orbit.
Near Coastal Processes
Winds in the region within ~25 km of the coast are not well-resolved by currently operating satellite missions. Continental-scale reanalyses also have difficulty in this region as well because the model grids are too coarse to resolve the topography and the relevant dynamical scales (Kara et al., 2008b). However, sparse measurements from buoys, aircraft, and SAR, as well as high-resolution models with smaller domains, all show small-scale wind features generated by coastal topography. Hydraulic expansion fans in the marine boundary layer near capes and points (Winant et al., 1988; Rahn et al., 2013; Parish et al., 2016), coastally-trapped wind reversals (Nuss et al., 2000), and along-shore wind jets confined by coastal mountains can have cross-coast scales of 5-10 km or smaller. We only have limited knowledge of the climatology of these features. The associated wind stress divergence and curl (Dorman et al., 2013; Juliano et al., 2017) generate circulations in the ocean (Pringle and Dever, 2009; Perlin et al., 2011) that affect coastal fisheries and other ecosystems by changing transport patterns of fish and invertebrate larvae or harmful algal blooms; upwelling nutrients into the euphotic zone; and transporting carbon offshore. Surface stresses in coastal regions can also be larger than expected for the same wind and wave conditions in the open ocean, and directions of the stress and wind velocity can differ (Fisher et al., 2015; Ortiz-Suslow et al., 2015) due to the effects of short fetch or waves interacting with the bottom. Satellite ocean vector wind data have enabled recent progress in understanding coastal wind fluctuations in the region >25 km from the coast (Fewings et al., 2016; Fewings, 2017) and their effects on ocean conditions (Flynn et al., 2017), but much remains to be learned about the area within 25 km of the coast.
Satellite wind measurements with ~5 km resolution and coverage to within a few kilometers of the coast worldwide would advance our understanding of physical controls on coastal ecosystems, such as wind forcing of the water temperature and circulation variations that affect kelp forests and marine protected areas (Fewings et al., 2015; Aristizábal et al., 2016, 2017). Improved satellite-based coastal winds would also help marine weather forecasting (Samelson, 2019) for applications including search and rescue, oil spill and harmful algal bloom tracking, storm surge prediction, and wind energy production. Many of these applications do not require climate data record levels of accuracy in winds, because the variability at weather-band frequencies is strong—the wind velocity signals of interest are O(several m s−1) or greater. Improvements in spatial resolution, spatial coverage within 25 km of the coast, and temporal sampling (ideally, at least four times daily) would advance our understanding of coastal processes, often more so than improving the accuracy of the wind measurements. To obtain the highest possible spatial resolution and finest coastal coverage, the Coastal Scatterometry Working Group of the International Ocean Vector Winds Science Team recommends that future satellite missions be designed to have as little onboard data averaging as possible. This will permit higher resolution reprocessing of the data beyond the standard products, such as the Ultra-High Resolution and coastal QuikSCAT products discussed in section Scatterometers (e.g., Plagge et al., 2009).
High Latitude Processes and Water Mass Formation
Vertical mixing resulting from air-sea fluxes of heat and momentum influence the rate of property exchange between the atmosphere and deeper ocean, and thus govern the ocean's capacity to store heat, carbon, and nutrients. Thus, even relatively small changes in wind stress can lead to significant changes in mixing and transport of these tracers into ocean interior (Klocker, 2018). Accurate representation of global water mass distribution and its recent trends crucially depends on skilled estimates of surface winds (Klocker, 2018).
The strongest trends of water mass properties in recent decades have been observed in the Southern Ocean (Roemmich et al., 2015; Haumann et al., 2016). The intensification and poleward shift of the westerly winds in the Southern Ocean in recent decades, enhanced upwelling of deep waters south of the Antarctic Circumpolar Current (ACC) and increased formation of mode and intermediate waters north of the ACC, causing large scale coherent changes in Southern Ocean circulation (Waugh et al., 2013). Much of the increase in global upper ocean heat content observed in recent decades has been attributed to this wind-forced volume changes of mode and intermediate waters (Gao et al., 2018).
Along with warming, Southern Ocean freshening is also a prominent climate change signal (Durack et al., 2012). Haumann et al. (2016) attributed freshening to an increase in wind-driven northward freshwater transport by Antarctic sea ice. Changing wind patterns lead to increased sea ice formation near Antarctica in winter, increasing transformation of deep water into denser bottom water due to brine rejection. After the sea ice is transported equatorward it melts, increasing the buoyancy of lighter variety of deep water, mode and intermediate waters (Abernathey et al., 2016; Haumann et al., 2016; Pellichero et al., 2018). This way wind-driven northward freshwater transport by Antarctic sea ice represents a dominant mechanism destroying the old, deep waters that upwell in the Southern Ocean driven by strong westerly winds (Abernathey et al., 2016).
The large-scale heat, freshwater, carbon, and nutrient content of the deep ocean is set by water masses that form via mechanisms acting on short time- and space scales (Li and Lee, 2017). Therefore, diagnosing, modeling, and predicting the high-latitude water mass changes requires accurate wind observations at high resolution in both time and space.
Seasonal to Interannual Variability, Decadal Variability, Climate Variability, and Change
Changes in large-scale wind patterns are associated with changes in surface pressure patterns, cloud cover, rainfall, ocean upwelling (Rodriguez et al., 2019, this issue), surface fluxes (Cronin et al., 2019), and temperature. Due to the large number of satellite marine wind observations, it is much easier to observe the changes in surface wind patterns than the changes in marine pressure patterns (Belmonte and Stoffelen, 2019). Decadal variability in winds is related to ocean biology and productivity (section High Latitude Processes and Water Mass Formation). At one time, there was a concern about different satellites having different global trends. However, it was later found that these variations were due to the different spatial sampling of each satellite and that there was excellent agreement on local trends. Decadal changes in wind patterns appear to be far larger than observational limits (e.g., Yang et al., 2007; Zheng et al., 2017), making the restrictive factor the length of the observational record (e.g., Han et al., 2014).
Monitoring, understanding, and predicting oceanic variations associated with natural climate variability and human-induced changes is challenging (Stephens et al., 2018). For example, global change detection of 0.1 m/s per decade is required, which corresponds to a calibration accuracy of a scatterometer of about 0.1 dB over 10 years. However, new methods provide precise instrument monitoring and potentially instrument intercalibration to within a few hundreds of dB (Belmonte et al., 2017). That said, current satellite data records and, as a result, multi-satellite gridded products do not yet achieve such precision and accurate intercalibration. As a result, the diverse instrument climate data records remain essential to monitor trends in climate, be it locally or globally (Verhoef et al., 2017; Wentz et al., 2017).
Summary of Observational Needs
There is broad agreement across many oceanographic communities on the improvements needed for future wind sensors. These recommendations include:
1. Enhanced temporal coverage through an international virtual constellation to follow the fast, small transient mesoscales (Stoffelen et al., 2019);
2. Improved spatial resolution to better address mesoscale variability, improve coastal sampling, and make visible the areas between rain bands in tropical cyclones;
3. Coincident observations of surface vector winds and currents, to better understand the coupling of winds and currents and to improve surface flux parameterizations;
4. Instrument intercalibration (e.g., cone metrics) for all conditions;
5. Improved calibration for extreme winds (strong and weak);
6. In situ wind references (including surface currents) to calibrate and intercalibrate satellite winds and surface currents. This goal includes improved understanding of in situ and SFMR calibration at extreme winds to be used in the above calibration;
7. Consider new strategies to observe the TC inner-core and environment with high spatial and temporal resolution from the upper ocean (including pre-and post-storm) to the lower stratosphere. The observations should be used to diagnose physical processes, improve initialization through data assimilation, and evaluate and improve NWP models.
A. Prioritizes access to non-commercial C-Band SAR data collection (e.g., from Sentinel−1A and 1B satellites, NISAR, and PalSAR-2 and SAOCOM) in wide swath mode with dual-polarization over global tropical cyclones. Such observations will be useful for wind speed estimates (including RMW) for operational (and other) uses;
B. Set-up an internationally coordinated framework for targeting SAR acquisitions on TCs; and
8. Local bias correction in NWP to follow the BLUE paradigm and improve gridded products;
The accuracy requirements for surface winds and stress are highly dependent on the phenomena and the spatial/temporal scales of the variability associated with the phenomena. These complications are summarized in Figure 9, and underscore the needs listed above. The resolution needs are roughly 10 to 20% of the spatial extent of the phenomena except when spatial derivatives are critical, where the resolution need is increased by a factor of three. The temporal sampling requirement is roughly 10% of the timescale of the phenomena. The accuracy requirements are 10 to 20% of the typical dynamic range of the phenomena.
Author Contributions
MB, TM, IC, PC, XD, GD, CD, DD, JE, AF, MF, RF, SG, BH, SH-V, HH, ZJ, JK, SK, AMa, MM, CM, AMo, MP, NR, LR, ER, CS, DS, AS, MS, BS, DW, and FW contributed to the text. JE developed an original figure.
Funding
This work was funded in part by the Ocean Observing and Monitoring Division, Climate Program Office (FundRef number 100007298), National Oceanic and Atmospheric Administration, U.S. Department of Commerce, through NGI grant 18-NGI3-42; NASA Physical Oceanography (Ocean Vector Wind Science Team grants NNH14CM09C NNX14AM69G, NNX14A078G, 80NSSC17K00537, 80NSSC18K1611, and 1419699 and 1531731 via JPL), NASA grant NNX17AH17G and NNX14AM69G, SMAP Science Utilization (contracts NNH17CA04C), the Office of Naval Research, Program Elements (0602435N), National Key Research & Development Program of China (Contract No. 2016YFC1401002 and 2017YB0502800), the Spanish Research and Development Plan under Project L-BAND (ESP2017-89463-C3-1-R), and NESDIS Base Research and Technology Funding (NESDIS Base Funding).
Conflict of Interest Statement
TM, AMa, CM, LR, and FW were employed by the company Remote Sensing Systems.
The remaining authors declare that the research was conducted in the absence of any commercial or financial relationships that could be construed as a potential conflict of interest.
The handling editor declared a shared affiliation, though no other collaboration with several of the authors AF, SH-V, ER, BS at time of review.
Acknowledgments
The authors thank Roger Samelson, Dudley Chelton, Ted Strub, Eric Skyllingstad, and Larry O'Neill (all at Oregon State University), David Long (Brigham Young University), Timothy Lang (NASA Marshall Space Flight Center), and Jur Vogelzang (Royal Netherlands Meteorological Institute, KNMI) for helpful comments and suggestions, and Stefanie Linow (EUMETSAT) for the development of a figure. The views, opinions, and findings contained in this report are those of the authors and should not be construed as an official National Oceanic and Atmospheric Administration or U.S. Government position, policy, or decision.
Footnotes
1. ^https://www.nrl.navy.mil/WindSat/
2. ^www.remss.com/missions/windsat
3. ^https://www.nhc.noaa.gov/ and http://www.metoc.navy.mil/jtwc
References
Abernathey, R. P., Cerovecki, I., Holland, P. R., Newsom, E., Mazloff, M., and Talley, L. D. (2016). Water-mass transformation by sea ice in the upper branch of the Southern Ocean overturning. Nat. Geosci. 9:596. doi: 10.1038/ngeo2749
Alpers, W., Biao, Z., Alexis, M., Kan, Z., and Pak Wai, C. (2016). Rain footprints on C-band synthetic aperture radar images of the ocean – revisited. Remote Sens. Environ. 187, 169–185. doi: 10.1016/j.rse.2016.10.015
Anguelova, M., and Webster, F. (2006). Whitecap coverage from satellite measurements: a first step toward modeling the variability of oceanic whitecaps, 2008. J. Geophys. Res. 111. doi: 10.1029/2005JC003158
Ardhuin, F., Gille, S. T., Menemenlis, D., Rocha, C. B., Rascle, N., Chapron, B., et al. (2017). Small-scale open ocean currents have large effects on wind wave heights. J. Geophys. Res. Oceans 122, 4500–4517. doi: 10.1002/2016JC012413
Aristizábal, M. F., Fewings, M. R., and Washburn, L. (2016). Contrasting spatial patterns in the diurnal and semidiurnal temperature variability in the Santa Barbara Channel, California. J. Geophys. Res. Oceans 121, 427–440. doi: 10.1002/2015JC011239
Aristizábal, M. F., Fewings, M. R., and Washburn, L. (2017). Effects of the relaxation of upwelling-favorable winds on the diurnal and semidiurnal water temperature fluctuations in the Santa Barbara Channel, California. J. Geophys. Res. Oceans 122, 7958–7977. doi: 10.1002/2017JC013199
Atlas, R. M., Hoffman, R. N., Ardizzone, J., Leidner, S. M., Jusem, J. C., Smith, D. K., et al. (2011). A cross-calibrated, multi-platform ocean surface wind velocity product for meteorological and oceanographic applications. Bull. Am. Meteorol. Soc. 92, 157–174. doi: 10.1175/2010BAMS2946.1
Attema, E. P. (1991). The active microwave instrument on-board the ERS-1 satellite. Proc. IEEE 79, 791–799. doi: 10.1109/5.90158
Bakun, A. (2006). Fronts and eddies as key structures in the habitat of marine fish larvae: opportunity, adaptive response and competitive advantage. Sci. Mar. 70, 105–122. doi: 10.3989/scimar.2006.70s2105
Banal, S., Iris, S., and Saint-Jean, R. (2007). “Canadian space agency hurricane watch program: archive contents, data access and improved planning strategies,” in Proceeding of IEEE International Geoscience and Remote Sensing Symposium (Barcelona), 3494–3497.
Beal, R. S. (ed.). (2005). High Resolution Wind Monitoring With Wide Swath SAR: A Users Guide. U.S. Washington, DC: Department of Commerce; National Oceanic and Atmospheric Administration; National Environmental Satellite, Data, and Information Serve; Office of Research and Applications.
Belmonte, R. M., and Stoffelen, A. (2019). Characterizing ERA-interim and ERA5 surface wind biases using ASCAT. Ocean Sci. Discuss. 15, 831–852. doi: 10.5194/os-15-831-2019
Belmonte, R. M., Stoffelen, A., Verspeek, J., Verhoef, A., Neyt, X., and Anderson, C. (2017). Cone metrics: a new tool for the intercomparison of scatterometer records. IEEE J. Select. Topics Appl. Earth Observ. Remote Sens. 10, 2195–2204. doi: 10.1109/JSTARS.2017.2647842
Belward, A., Bourassa, M., Dowell, M., Briggs, S., Dolman, H., Holmlund, K., et al. (2016). The Global Observing System for Climate: Implementation Needs. GCOS-200, 342.
Bender, M. A., Marchok, T. P., Sampson, C. R., Knaff, J. A., and Morin, M. J. (2017). Impact of storm size on prediction of storm track and intensity using the 2016 operational GFDL Hurricane Model. Wea Forecast. 32, 1491–1508. doi: 10.1175/WAF-D-16-0220.1
Bender, M. L., Kinter, S., Cassar, N., and Wanninkhof, R. (2011), Evaluating gas transfer velocity parameterizations using upper ocean radon distributions. J. Geophys. Res. 116:C02010. doi: 10.1029/2009JC005805
Benitez-Nelson, C. R., Bidigare, R. R., Dickey, T. D., Landry, M. R., Leonard, C. L., Brown, S. L., et al. (2007). Mesoscale eddies drive increased silica export in the subtropical Pacific Ocean. Science 316, 1017–1021. doi: 10.1126/science.1136221
Bentamy, A., Katsaros, K. B., Mestas-Nuñez, A. M., Drennan, W. M., Forde, E. B., and Roquet, H. (2003). Satellite estimates of wind speed and latent heat flux over the global oceans. J. Clim. 16, 637–656. doi: 10.1175/1520-0442(2003)016<0637:SEOWSA>2.0.CO;2
Bettenhausen, M. H., Smith, C. K., Bevilacqua, R. M., Nai-Yu, W., Gaiser, P. W., and Cox, S. (2006). A nonlinear optimization algorithm for WindSat wind vector retrievals. IEEE Trans. Geosci. Remote Sens. 44, 597–610. doi: 10.1109/TGRS.2005.862504
Bourassa, M. A. (2006). “Satellite-based observations of surface turbulent stress during severe weather,” in Atmosphere - Ocean Interactions, Vol. 2, ed W. Perrie (Torquay: Wessex Institute of Technology Press), 35−52.
Bourassa, M. A., and Hughes, P. J. (2018). “Turbulent heat fluxes and wind remote sensing,” in New Frontiers in Operational Oceanography, eds E. P. Chassignet, A. Pascual, J. Tintoré, and J. Verron (Tallahassee, FL: GODAE OceanView), 245–270.
Bourassa, M. A., Rodriguez, E., and Gaston, R. (2009). Summary of the 2008 NASA ocean vector winds science team meeting. Bull. Am. Meteorol. Soc. 91, 925–928. doi: 10.1175/2010BAMS2880.1
Brown, R. A. (1980). Longitudinal instabilities and secondary flows in the planetary boundary layer: a review. Rev. Geophys. 18, 683–697. doi: 10.1029/RG018i003p00683
Brown, S., Paolo, F., Amarit, K., Frank, M., Lance, M., Oliver, M., et al. (2017). “The COWVR mission: demonstrating the capability of a new generation of small satellite weather sensors,” in IEEE Aerospace Conference (Big Sky, MT), 1–7.
Chelton, D. B., Schlax, M. G., and Samelson, R. M. (2007). Summertime coupling between sea surface temperature and wind stress in the California current system. J. Phys. Oceanogr. 37, 495–517. doi: 10.1175/JPO3025.1
Chelton, D. B., Schlax, M. G., Samelson, R. M., Farrar, J. T., Molemaker, M. J., McWilliams, J. C., et al. (2018). Prospects for future satellite estimation of small-scale variability of ocean surface velocity and vorticity. Prog. Oceanogr. 173, 256–350. doi: 10.1016/j.pocean.2018.10.012
Chu, P. C., Veneziano, J. M., Fan, C., Carron, M. J., and Liu, W. T. (2000). Response of the South China Sea to tropical cyclone Ernie 1996. J. Geophys. Res. Oceans 105, 13991–14009. doi: 10.1029/2000JC900035
Cooley, S. R., Kite-Powell, H. L., and Doney, S. C. (2009). Ocean acidification's potential to alter global marine ecosystem services. Oceanography 22, 172–181. doi: 10.5670/oceanog.2009.106
Cornillon, P., and Park, K. A. (2001), Warm core ring velocities inferred from NSCAT. Geophys. Res. Lett. 28, 575–578. doi: 10.1029/2000GL011487
Cronin, M. F., Gentemann, C. L., Edson, J., Ueki, I., Bourassa, M., Brown, S., et al. (2019). Air-sea fluxes with a focus on heat and momentum. Front. Mar. Sci. 6:430. doi: 10.3389/fmars.2019.00430
Dai, A., and Deser, C. (1999). Diurnal and semidiurnal variations in global surface wind and divergence fields. J. Geophys. Res. 104, 31109–25. doi: 10.1029/1999JD900927
Donelan, M., Haus, B., Reul, N., Plant, W., Stiassnie, M., Graber, H., et al. (2004). On the limiting aerodynamic roughness of the ocean in very strong winds. Geophys. Res. Lett. 31. doi: 10.1029/2004GL019460
Donlon, C. J. (2018). Copernicus Imaging Microwave Radiometer (CIMR) Mission Requirements Document. Norrdwijk: European Space Agency. Available online at: https://cimr.eu/documents/
Dorman, C. E., Mejia, J. F., and Koračin, D. (2013). Impact of U.S. west coastline inhomogeneity and synoptic forcing on winds, wind stress, and wind stress curl during upwelling season. J. Geophys. Res. Ocean 118, 4036–4051. doi: 10.1002/jgrc.20282
Draper, D. W., and Long, D. G. (2004). Evaluating the effect of rain on SeaWinds scatterometer measurements. J. Geophys. Res. 109. doi: 10.1029/2002JC001741
Draper, D. W., Newell, D. A., Wentz, F. J., Krimchansky, S., and Skofronick-Jackson, G. M. (2015). The global precipitation measurement (GPM) microwave imager (GMI): instrument overview and early on-orbit performance. IEEE J. Select. Topics Appl. Earth Observ. Remote Sens. 8, 3452–3462. doi: 10.1109/JSTARS.2015.2403303
Dukhovskoy, D. S., and Morey, S. L. (2011). Simulation of the Hurricane Dennis storm surge and considerations for vertical resolution. Nat. Hazards J. 58, 511–540. doi: 10.1007/s11069-010-9684-5
Durack, P. J., Wijffels, S. E., and Matear, R. J. (2012). Ocean salinities reveal strong global water cycle intensification during 1950 to 2000. Science 336, 455–458. doi: 10.1126/science.1212222
Durden, S., and Perkovic-Martin, D. (2017). “The RapidScat ocean winds scatterometer,” in IEEE Geoscience and Remote Sensing Magazine.
Entekhabi, D., Njoku, E. G., O'Neill, P. E., Kellogg, K. H., Crow, W. T., Edelstein, W. N., et al. (2010). The soil moisture active passive (SMAP) mission. Proc. IEEE 98, 704–716. doi: 10.1109/JPROC.2010.2043918
Entekhabi, D., Yueh, S., O'Neill, P. E., Kellogg, K. H., Allen, A., Bindlish, R., et al. (2014). SMAP Handbook-Soil Moisture Active Passive: Mapping Soil Moisture and Freeze/Thaw from Space. Pasadena, CA: JPL Publication.
Fewings, M. R. (2017). Large-scale structure in wind forcing over the california current system in summer. Mon. Wea. Rev. 145, 4227–4247. doi: 10.1175/MWR-D-17-0106.1
Fewings, M. R., Washburn, L., and Carter Ohlmann, J. (2015). Coastal water circulation patterns around the Northern Channel Islands and Point Conception, California. Prog. Oceanogr. 138, 283–304. doi: 10.1016/j.pocean.2015.10.001
Fewings, M. R., Washburn, L., Dorman, C. E., Gotschalk, C., and Lombardo, K. (2016). Synoptic forcing of wind relaxations at Pt. Conception, California. J. Geophys. Res. Oceans 121, 5711–5730. doi: 10.1002/2016JC011699
Figa-Saldaña, J., Wilson, J. J. W., Attema, E., Gelsthorpe, R., Drinkwater, M. R., and Stoffelen, A. (2002). The advanced scatterometer (ASCAT) on the meteorological operational (MetOp) platform: a follow on for European wind scatterometers. Can. J. Remote Sens. 28, 404–412. doi: 10.5589/m02-035
Fisher, A. W., Sanford, L. P., and Suttles, S. E. (2015). Wind stress dynamics in Chesapeake Bay: Spatiotemporal variability and wave dependence in a fetch-limited en- vironment. J. Phys. Oceanogr. 45, 2679–2696. doi: 10.1175/JPO-D-15-0004.1
Flynn, K. R., Fewings, M. R., Gotschalk, C., and Lombardo, K. (2017), Large-scale anomalies in sea-surface temperature air-sea fluxes during wind relaxation events off the United States West Coast in summer. J. Geophys. Res. Oceans 122, 2574–2594, doi: 10.1002/2016JC012613
Fore, A. G., Stiles, B. W., Chau, A. H., Williams, B. A., Dunbar, R. S., and Rodríguez, E. (2014). Point-wise wind retrieval and ambiguity removal improvements for the QuikSCAT climatological data set. IEEE Trans. Geosci. Remote Sens. 52, 51–59. doi: 10.1109/TGRS.2012.2235843
Fore, A. G., Yueh, S. H., Stiles, B. W., Tang, W., and Hayashi, A. K. (2018). SMAP radiometer-only tropical cyclone intensity and size validation. IEEE Geosci. Remote Sens. Lett. 15, 1480–1484. doi: 10.1109/LGRS.2018.2849649
Fore, A. G., Yueh, S. H., Tang, W., Stiles, B. W., and Hayashi, A. K. (2016). Combined active/passive retrievals of ocean vector wind and sea surface salinity with SMAP. IEEE Trans. Geosci. Remote Sens. 54, 7396–7404. doi: 10.1109/TGRS.2016.2601486
Foster, R. C. (2005). Why rolls are prevalent in the hurricane boundary layer. J. Atmos. Sci. 62, 2647–2661. doi: 10.1175/JAS3475.1
Foster, R. C. (2013). Signature of large aspect ratio roll vortices in SAR images of tropical cyclones. Oceanography 26, 58–67. doi: 10.5670/oceanog.2013.31
Franks, P. J. (1992). Phytoplankton blooms at fronts: patterns, scales, and physical forcing mechanisms. Rev. Aquatic Sci. 6, 121–137.
Fu, L.-L., and Holt, B. (1982). Seasat Views Oceans and Sea Ice With Synthetic-Aperture Radar. NASA; Jet Propulsion Laboratory Publication (81-120), 200.
Gade, M., and Stoffelen, A. (2019). “An introduction to microwave remote sensing of the Asian Seas,” in Remote Sensing of the Asian Seas, 1st Edn., eds V. Barale and M. Gade (Cham: Springer), XXXV; 526; 81–101.
Gaiser, P., St Germain, K. M., Twarog, E. M., Poe, G. A., Purdy, W., Richardson, D., et al. (2004). The WindSat space borne polarimetric microwave radiometer: sensor description and early orbit performance. IEEE Trans. Geosci. Remote Sens. 42, 2347–2361. doi: 10.1109/TGRS.2004.836867
Galgani, F., Hanke, G., and Maes, T. (2015). “Global distribution, composition and abundance of marine litter,” in Marine Anthropogenic Litter eds M. Bergmann, L. Gutow, and M. Klages (Cham, Heidelberg, New York, NY, Dordrecht, London: Springer International Publishing, 29–56. Available online at: https://www.amazon.com/Marine-Anthropogenic-Litter-Melanie-Bergmann-ebook/dp/B00YOFPEGC/ref=sr_1_fkmr0_1?keywords=Marine+anthropogenic+litter&qid=1564883584&s=books&sr=8-1-fkmr0#reader_B00YOFPEGC
Gall, R., Franklin, J., Marks, F., Rappaport, E. N., and Toepfer, F. (2013). The hurricane forecast improvement project. Bull. Am. Meteorol. Soc. 94, 329–343. doi: 10.1175/BAMS-D-12-00071.1
Gao, L., Rintoul, S. R., and Yu, W. (2018). Recent wind-driven change in Subantarctic Mode Water and its impact on ocean heat storage. Nat. Clim. Change 8, 58–63. doi: 10.1038/s41558-017-0022-8
Gaube, P., Chelton, D. B., Samelson, R. M., Schlax, M. G., and O'Neill, L. W. (2015). Satellite observations of mesoscale eddy-induced Ekman pumping. J. Phys. Oceanogr. 45, 104–132. doi: 10.1175/JPO-D-14-0032.1
Gerling, T. W. (1986). Structure of the surface wind field from the Seasat SAR. J. Geophys. Res. 91, 2308–2320. doi: 10.1029/JC091iC02p02308
Giglio, D., Cornuelle, B. D., Northcott, D. M., and Gille, S. T. (2018). Modulation of Diurnal Winds in the Tropical Oceans. Barcelona: International Ocean Vector Wind Science Team. Available online at: https://mdc.coaps.fsu.edu/scatterometry/meeting/docs/2018/docs/ThursdayApril26/Thursday_morning/Giglio_OVWST2018.pdf
Gille, S. T., and Llewellyn Smith, S. G. (2014). When land breezes collide: converging diurnal winds over small bodies of water. Q. J. R. Meteorol. Soc. 140, 2573–2581. doi: 10.1002/qj.2322
Gille, S. T., Llewellyn Smith, S. G., and Lee, S. M. (2003). Measuring the sea breeze from QuikSCAT scatterometry. Geophys. Res. Lett. 30. doi: 10.1029/2002GL016230
Gille, S. T., Llewellyn Smith, S. G., and Statom, N. M. (2005). Global observations of the land breeze. Geophys. Res. Lett. 32. doi: 10.1029/2004GL022139
Han, W., Vialard, J., McPhaden, M. J., Lee, T., Masumoto, Y., Feng, M., et al. (2014). Indian ocean decedal variability. Bull. Am. Meteorol. Soc. 95, 1679–1703. doi: 10.1175/BAMS-D-13-00028.1
Harper, B., Kepert, J., and Ginger, J. (2010). Guidelines for Converting Between Various Wind Averaging Periods in Tropical Cyclone Conditions. World Metrological Organization. Available online at: https://www.wmo.int/pages/prog/www/tcp/documents/WMO_TD_1555_en.pdf
Haumann, F. A., Gruber, N., Münnich, M., Frenger, I., and Kern, S. (2016). Sea ice transport driving Southern Ocean salinity and its recent trends. Nature 537, 89–92. doi: 10.1038/nature19101
Hein, P. F., and Brown, R. A. (1988). Observations of longitudinal roll vortices during arctic cold air outbreaks over open water. Bound. Layer Meteorol. 45, 177–199. doi: 10.1007/BF00120822
Heron, M., and Rose, R. (1986). On the application of HF ocean radar to the observation of temporal and spatial changes in wind direction. IEEE J. Oceanic Eng. 11, 210–218. doi: 10.1109/JOE.1986.1145173
Hilburn, K., and Wentz, F. (2008). Intercalibrated passive microwave rain products from the unified microwave ocean retrieval algorithm (UMORA). J. Appl. Meteor. Climatol. 47, 778–794. doi: 10.1175/2007JAMC1635.1
Hilburn, K. A., Meissner, T., Wentz, F. J., and Brown, S. T. (2016). Ocean vector winds from WindSat two-look polarimetric radiances. IEEE Trans. Geosci. Remote Sens. 54, 918–931. doi: 10.1109/TGRS.2015.2469633
Hilburn, K. A., Wentz, F. J., Smith, D. K., and Ashcroft, P. D. (2006). Correcting active scatterometer data for the effects of rain using passive microwave data. J. Appl. Meteorol. Climatol. 45, 382–398. doi: 10.1175/JAM2357.1
Hofmann, E. E., Hedstrom, K. S., Moisan, J. R., Haidvogel, D. B., and Mackas, D. L. (1991). Use of simulated drifter tracks to investigate general transport patterns and residence times in the coastal transition zone. J. Geophys. Res. Oceans 96, 15041–15052. doi: 10.1029/91JC00832
Hollinger, J. P., Peirce, J. L., and Poe, G. A. (1990). SSM/I instrument evaluation. IEEE Trans. Geosci. Remote Sens. 28,781–790. doi: 10.1109/36.58964
Horstmann, J., Christopher, W., Silvia, F., and Salvatore, M. (2013). Tropical cyclone winds retrieved from synthetic aperture radars. Oceanography 26, 46–57.
Horstmann, J., and Koch, W. (2005). Measurement of sea surface winds using synthetic aperture radars IEEE Trans. Geosci. Remote Sens. 30, 508–515 doi: 10.1109/JOE.2005.857514
Horstmann, J., Koch, W., Lehner, S., and Tonboe, R. (2002). Ocean winds from RADARSAT-1 ScanSAR. Can. J. Remote Sens. 28, 524–533. doi: 10.5589/m02-043
Horstmann, J., Lehner, S., and Tonboe, R. (2000). Wind retrieval over the ocean using synthetic aperture radar with C-band HH polarization. IEEE Trans. Geosci. Remote Sens. 38, 2122−2131. doi: 10.1109/36.868871
Hristova-Veleva, S. M., Chen, H., Gopalakrishnan, S. G., and Haddad, Z. S. (2018). “Low-wave number analysis of observations and ensemble forecasts to develop metrics for the selection of most realistic members to study multi-scale interactions between the environment and the convective organization of hurricanes: focus on rapid intensification,” in 98th AMS Annual Meeting; 22nd Conference on Integrated Observing and Assimilation Systems for the Atmosphere, Oceans, and Land Surface (IOAS-AOLS) (Austin, TX). Available online at: https://ams.confex.com/ams/98Annual/webprogram/Paper333206.html
Hristova-Veleva, S. M., Haddad, Z. S., Stiles, B. W., Shen, T. P. J., Niamsuwan, N., Turk, F. J., et al. (2016). “Possible predictors for the rapid intensification and evolution of hurricanes from near-coincident satellite observations of the structure of precipitation and surface winds: Hurricane Joaquin,” in 32nd AMS Conference on Hurricanes and Tropical Meteorology (San Juan, PR). Available online at: https://ams.confex.com/ams/32Hurr/webprogram/Paper293955.html
Huang, W., Gill, E., Wu, X., and Li, L. (2012). Measurement of sea surface wind direction using bistatic high-frequency radar. IEEE Trans. Geosci. Remote Sens. 50, 4117–4122. doi: 10.1109/TGRS.2012.2188298
Huddleston, J. N., and Stiles, B. W. (2000). “A multi-dimensional histogram technique for flagging rain contamination on QuikSCAT,” in Proceedings of IEEE International Geoscience and Remote Sensing Symposium, Vol. 3 (Honolulu, HI), 1232–1234.
Hwang, P., Burrage, D., Wang, D., and Wesson, J. (2013). Ocean surface roughness spectrum in high wind condition for microwave backscatter and emission computations. J. Atmos. Ocean. Technol. 30, 2168–2188. doi: 10.1175/JTECH-D-12-00239.1
Hwang, P., and Fois, F. (2015). Surface roughness and breaking wave properties from polarimetric microwave radar backscattering. J. Geophys. Res. 120, 3640–3657. doi: 10.1002/2015JC010782
Hwang, P., Stoffelen, A., van Zadelhoff, G.-J., Perrie, W., Zhang, B., Li, H., et al. (2015). Cross-polarization geophysical model function for c-band radar backscattering from the ocean surface and wind speed retrieval. J. Geophys. Res. Oceans 120, 893–909. doi: 10.1002/2014JC010439
Hyder, P., Simpson, J. H., Xing, J., and Gille, S. T. (2011). Observations over an annual cycle and simulations of wind-forced oscillations near the critical latitude for diurnal-inertial resonance. Continent. Shelf Res. 31, 1576–1591. doi: 10.1016/j.csr.2011.06.001
Imaoka, K., Kachi, M., Kasahara, M., Ito, N., Nakagawa, K., and Oki, T. (2010). Instrument performance and calibration of AMSR-E and AMSR2. in International Archives of the Photogrammetry, Remote Sensing and Spatial Information Science. 38, 13−18. Available online at: www.isprs.org/proceedings/XXXVIII/part8/pdf/JTS13_20100322190615.pdf
Isaksen, L., and Stoffelen, A. C. M. (2000). ERS scatterometer wind data impact on ECMWF's tropical cyclone forecasts. IEEE Trans. Geosci. Remote Sens. 38, 1885–1892. doi: 10.1109/36.851771
Jelesnianski, C. P., Chen, J., and Shaffer, W. A. (1992). SLOSH: Sea, Lake, and Overland Surges From Hurricanes. Silver Spring: Department of Commerce.
Johnson, J., Williams, L., Bracalente, E., Beck, F., and Grantham, W. (1980). SEASAT-A satellite scatterometer instrument evaluation. IEEE J. Ocean. Eng. OE-5, 138–144. doi: 10.1109/JOE.1980.1145461
Jonsson, B. F., Doney, S. C., Dunne, J., and Bender, M. (2013). Evaluation of the Southern Ocean O2/Ar-based NCP estimates in a model framework. J. Geophys. Res. Biogeosci. 118, 385–399. doi: 10.1002/jgrg.20032
Juliano, T. W., Parish, T. R., Rahn, D. A., and Leon, D. C. (2017). An atmospheric hydraulic jump in the Santa Barbara channel. J. Appl. Meteor. Climatol. 56, 2981–2998. doi: 10.1175/JAMC-D-16-0396.1
Kara, A. B., Wallcraft, A. J., Barron, C. N., Metzger, E. J., Hurlburt, H. E., and Bourassa, M. A. (2008b). Accuracy of 10 m Wind Speeds from Satellites and NWP Products Near Land–Sea Boundaries. J. Geophys. Res. 113:C04009. doi: 10.1029/2007JC004516
Kara, A. B., Wallcraft, A. J, and Bourassa, M. A. (2008a). Air-sea stability effects on the 10 m winds over the global ocean: evaluations of air-sea flux algorithms. J. Geophys. Res. Oceans 113. doi: 10.1029/2007JC004324
Katsaros, K., Vachon, P., Black, P., Dodge, P., and Ulhorn, E. (2000). Wind fields from SAR: could they improve our understanding of storm dynamics? Johns Hopkins APL Tech. Dig. 21, 86–93. doi: 10.4095/219617
Kelly, K. A., Dickinson, S., Chuan Li, J., Johnson, G. C., and Thompson, L. (2004). “Impact of ocean currents on scatterometer winds in the tropical Pacific Ocean,” IGARSS 2004. 2004 IEEE International Geoscience and Remote Sensing Symposium (Anchorage, AK), 799.
Kelly, K. A., Dickinson, S., McPhaden, M. J., and Johnson, G. C. (2001). Ocean currents evident in satellite wind data. Geophys. Res. Lett. 28, 2469–2472. doi: 10.1029/2000GL012610
Kennedy, A. B., Gravois, U., Zachry, B. C., Westerink, J. J., Hope, M. E., Dietrich, J. C., et al. (2011). Origin of the Hurricane Ike forerunner surge. Geophys. Res. Lett. 38. doi: 10.1029/2011GL047090
Kerr, Y., Waldteufel, P., Wigneron, J.-P., Delwart, S., Cabot, F., Boutin, J., et al. (2010). The SMOS mission: new tool for monitoring key elements of the global water cycle. Proc. IEEE 98, 666–687. doi: 10.1109/JPROC.2010.2043032
King, G. P., Vogelzang, J., and Stoffelen, A. (2015). Upscale and downscale energy transfer over the tropical Pacific revealed by scatterometer winds. J. Geophys. Res. Oceans 120, 346–361. doi: 10.1002/2014JC009993
Kite-Powell, H., Colgan, C., and Weiher, R. (2008). Estimating the economic benefits of regional ocean observing systems. Coastal Manage. 36, 125–145. doi: 10.1080/08920750701868002
Kite-Powell, H. L. (2009). Economic considerations in the design of ocean observing systems. Oceanography 22, 44–49. doi: 10.5670/oceanog.2009.37
Kite-Powell, H. L. (2011). The value of ocean surface wind information for maritime commerce. Mar. Technol. Soc. J. 45, 75–84. doi: 10.4031/MTSJ.45.1.13
Kite-Powell, H. L., and Colgan, C. S. (2001). The Potential Economic Benefits of Coastal Ocean Observing Systems, the Gulf of Maine. Washington, DC: US Department of Commerce; National Oceanic and Atmospheric Administratin; Office of Program Planning and Integration.
Klocker, A. (2018). Opening the window to the Southern Ocean: the role of jet dynamics. Sci. Adv. 4:eaao4719. doi: 10.1126/sciadv.aao4719
Kloe, J., de Stoffelen, A., and Verhoef, A. (2017). Improved use of scatterometer measurements by using stress-equivalent reference winds. IEEE J. Select. Topics Appl. Earth Observ. Remote Sens. 10, 2340–2347. doi: 10.1109/JSTARS.2017.2685242
Klotz, B., and Uhlhorn, E. (2014). Improved stepped frequency microwave radiometer tropical cyclone surface winds in heavy precipitation. J. Atmos. Ocean. Technol. 31, 2392–2408. doi: 10.1175/JTECH-D-14-00028.1
Knaff, J. A., Sampson, C. R., and Musgrave, K. D. (2018). Statistical tropical cyclone wind radii prediction using climatology and persistence: Updates for the western North Pacific. Wea Forecast. 1093–1098. doi: 10.1175/WAF-D-18-0027.1
Koch, W. (2004). Directional analysis of SAR images aiming at wind direction. IEEE Trans. Geosci. Remote Sens. 42, 702–710. doi: 10.1109/TGRS.2003.818811
Kumar, R., Chakraborty, A., Parekh, A., Sikhakolli, R., Gohil, B. S., and Kiran Kumar, A. S. (2013). Evaluation of Oceansat-2-derived ocean surface winds using observations from global buoys and other scatterometers. IEEE Trans. Geosci. Remote Sens. 51, 2571–2576. doi: 10.1109/TGRS.2012.2214785
Laiz-Carrión, R., Gerard, T., Uriarte, A., Malca, E., Quintanilla, J., Muhling, B., et al. (2015). Larval bluefin tuna (Thunnus thynnus) trophodynamics from Balearic Sea (WM) and Gulf of Mexico spawning ecosystems by stable isotope. Collect. Vol. Sci. Pap. ICCAT 71, 1354−1365.
Lara-Lopez, A. L., Davison, P., and Koslow, J. A. (2012). Abundance and community composition of micronekton across a front off Southern California. J. Plankton Res. 34, 828–848. doi: 10.1093/plankt/fbs016
Leidner, S. M., Isaksen, L., and Hoffman, R. N. (2003). Impact of NSCAT winds on tropical cyclones in the ECMWF 4D-Var assimilation system. Mon. Weather Rev. 131, 3–26. doi: 10.1175/1520-0493(2003)131<0003:IONWOT>2.0.CO;2
Li, Q., and Lee, S. (2017). A mechanism of mixed-layer formation in the Indo-western Pacific Southern Ocean: preconditioning by an eddy-driven jet-scale overturning circulation. J. Phys. Oceanogr. 47, 2755–2772. doi: 10.1175/JPO-D-17-0006.1
Li, X. (ed.). (2017). Hurricane Monitoring with Spaceborne Synthetic Aperture Radar. Singapore: Springer Natural Hazards, 398. doi: 10.1007/978-981-10-2893-9
Li, X., Zhang, J. A., Yang, X., Pichel, W. G., DeMaria, M., Long, D., et al. (2013). Tropical cyclone morphology from spaceborne synthetic aperture radar. Bull. Amer. Meteorol. Soc. 94, 215–230. doi: 10.1175/BAMS-D-11-00211.1
Li, Z., Stoffelen, A., and Verhoef, A. (2019). A generalized simulation capability for rotating- beam scatterometers. Atmos. Meas. Tech. 12, 3573–3594. doi: 10.5194/amt-12-3573-2019
Lin, C., Lengert, W., and Attema, E. (2017). Three generations of C-band wind scatterometer systems from ERS-1/2 to MetOp/ASCAT, and MetOp second generation. IEEE J. Select. Topics Appl. Earth Observ. Remote Sens. 10, 2098–2122. doi: 10.1109/JSTARS.2016.2616166
Lin, I., Liu, W. T., Wu, C. C., Wong, G. T., Hu, C., Chen, Z., et al. (2003). New evidence for enhanced ocean primary production triggered by tropical cyclone. Geophys. Res. Lett. 30. doi: 10.1029/2003GL017141
Lin, W., and Portabella, M. (2017). Towards an improved wind quality control for RapidScat. IEEE Trans. Geosci. Remote Sens. 55, 3922–3930. doi: 10.1109/TGRS.2017.2683720
Lin, W., Portabella, M., Stoffelen, A., Turiel, A., and Verhoef, A. (2014). Rain identification in ASCAT winds using singularity analysis. IEEE Geosci. Remote Sens. Lett. 11, 1519–1523. doi: 10.1109/LGRS.2014.2298095
Lin, W., Portabella, M., Stoffelen, A., Verhoef, A., and Turiel, A. (2015b). ASCAT wind quality control near rain. IEEE Trans. Geosci. Remote Sens. 53, 4165–4177. doi: 10.1109/TGRS.2015.2392372
Lin, W., Portabella, M., Stoffelen, A., Vogelzang, J., and Verhoef, A. (2015a). ASCAT wind quality under high subcell wind variability conditions. J. Geophys. Res. 120, 5804–5819. doi: 10.1002/2015JC010861
Lin, W., Portabella, M., Stoffelen, A., Vogelzang, J., and Verhoef, A. (2016). On mesoscale analysis and ASCAT ambiguity removal. Q. J. R. Meteorol. Soc. 142, 1745–1756. doi: 10.1002/qj.2770
Lindsley, R. D., and Long, D. G. (2016). Enhanced-resolution reconstruction of ASCAT backscatter measurements. IEEE Trans. Geosci. Remote Sens. 54, 2589–2601. doi: 10.1109/TGRS.2015.2503762
Liu, W. T., and Tang, W. (1996). Equivalent Neutral Wind. Pasadena, CA: JPL Publication 96-17; Jet Propulsion Laboratory.
Long, A., and Trizna, D. (1973). Mapping of North Atlantic winds by HF radar sea backscatter interpretation. IEEE Trans. Antennas Propagat. 21, 680–685.
Marseille, G. J., and Stoffelen, A. (2017). Toward scatterometer winds assimilation in the mesoscale HARMONIE Model. IEEE J. Select. Topics Appl. Earth Observ. Remote Sens. 10, 2383–2393. doi: 10.1109/JSTARS.2016.2640339
Maximenko, N., Corradi, P., Law, K. L., Van Sebille, E., Garaba, S. P., Lampitt, R. S., et al. (2019). Towards the integrated marine debris observing system. Front. Mar. Sci. 6:447. doi: 10.3389/fmars.2019.00447
McGillicuddy, D. J., Anderson, L. A., Bates, N. R., Bibby, T., Buesseler, K. O., Carlson, C. A., et al. (2007). Eddy/wind interactions stimulate extraordinary mid-ocean plankton blooms. Science 316, 1021–1026. doi: 10.1126/science.1136256
McGregor, S., Gupta, A. S., Dommenget, D., Lee, T., McPhaden, M. J., Kessler, W., et al. (2017). Factors influencing the skill of synthesized satellite wind products in the tropical Pacific. J. Geophys. Res. Oceans 18. doi: 10.1002/2016JC012340
McWilliams, J. C. (2016). Submesoscale currents in the ocean. Proc. R. Soc. A 472:20160117. doi: 10.1098/rspa.2016.0117
Mears, C. A., Smith, D. K., and Wentz, F. J. (2001). Comparison of special sensor microwave imager and buoy-measured wind speeds from 1987 - 1997. J. Geophys. Res. 106, 11719–11729. doi: 10.1029/1999JC000097
Mecklenburg, S., Drusch, M., Kerr, Y. H., Font, J., Martin-Neira, M., Delwart, S., et al. (2012). ESA's soil moisture and ocean salinity mission: mission performance and operations. IEEE Trans. Geosci. Remote Sens. 50, 1354–1366. doi: 10.1109/TGRS.2012.2187666
Meissner, T., Ricciardulli, L., and Wentz, F. (2011). “All-weather wind vector measurements from intercalibrated active and passive microwave satellite sensors,” Proceedings of the 2011 IEEE International Geoscience and Remote Sensing Symposium (IGARSS) (Vancouver, BC:IEEE).
Meissner, T., Ricciardulli, L., and Wentz, F. J. (2017). Capability of the SMAP mission to measure ocean surface winds in storms. Bull. Am. Meteorol. Soc. 98, 1660–1677. doi: 10.1175/BAMS-D-16-0052.1
Meissner, T., Smith, D., and Wentz, F. (2001). A 10-year intercomparison between collocated special sensor microwave imager oceanic surface wind speed retrievals and global analyses. J. Geophys. Res. 106, 11731–11742. doi: 10.1029/1999JC000098
Meissner, T., and Wentz, F. (2009). Wind vector retrievals under rain with passive satellite micro-wave radiometers. IEEE Trans. Geosci. Remote Sens. 47, 3065–3083. doi: 10.1109/TGRS.2009.2027012
Meissner, T., and Wentz, F. (2012). The emissivity of the ocean surface between 6 - 90 GHz over a large range of wind speeds and Earth incidence angles. IEEE Trans. Geosci. Remote Sens. 50, 3004–3026. doi: 10.1109/TGRS.2011.2179662
Meissner, T., Wentz, F., and Ricciardulli, L. (2014). The emission and scattering of L-band microwave radiation from rough ocean surfaces and wind speed measurements from the Aquarius sensor. J. Geophys. Res. 119, 6499–6522. doi: 10.1002/2014JC009837
Meissner, T., and Wentz, F. J. (2006). “Ocean retrievals for WindSat: radiative transfer model, algorithm, validation,” in 9th Specialist Meeting on Microwave Radiometry and Remote Sensing Applications (San Juan, PR).
Monahan, E., and O'Muircheartaigh, I. (1980). Optimal power-law description of oceanic white-cap coverage dependence on wind speed. J. Phys. Oceanogr. 10, 2094–2099. doi: 10.1175/1520-0485(1980)010<2094:OPLDOO>2.0.CO;2
Morey, S. L., Baig, S., Bourassa, M. A., Dukhovskoy, D. S., and O'Brien, J. J. (2006). Remote forcing contribution to storm-induced sea level rise during Hurricane Dennis. Geophys. Res. Lett. 33, L19603–19607. doi: 10.1029/2006GL027021
Morey, S. L., Dukhovskoy, D. S., and Bourassa, M. A. (2009). Connectivity between variability of the Apalachicola River flow and the bio-optical oceanic properties of the northern West Florida Shelf. Cont. Shelf Res. 29, 1264–1275. doi: 10.1016/j.csr.2009.02.003
Morrison, I., Businger, S., Marks, F., Dodge, P., and Businger, J. A. (2005). An observational case for the prevalence of roll vortices in the hurricane boundary layer. J Atmos. Sci. 62, 2662–2673. doi: 10.1175/JAS3508.1
Mouche, A., Chapron, B., Zhang, B., and Husson, R. (2017). Combined co- and cross- polarized SAR measurements under extreme wind conditions. IEEE Trans. Geosci. Remote Sens. 55, 6476–6467. doi: 10.1109/TGRS.2017.2732508
Mouche, A. A., Collard, F., Chapron, B., Dagestad, K.-F., Guitton, G., Johannessen, J. A., et al. (2012). On the use of doppler shift for sea surface wind retrieval from SAR. IEEE Trans. Geosci. Remote Sens. 50, 2901–2909. doi: 10.1109/TGRS.2011.2174998
Naderi, F., Freilich, M. H., and Long, D. G. (1991). Spaceborne radar measurement of wind velocity over the ocean: an overview of the NSCAT scatterometer system. Proc. IEEE 79, 850–866. doi: 10.1109/5.90163
National Academies of Sciences Engineering, and Medicine. (2018). Thriving on Our Changing Planet: A Decadal Strategy for Earth Observation From Space. Washington, DC: The National Academies Press.
NOAA (1998). Year of the Ocean Discussion Papers, Office of the Chief Scientist. Available online at: https://nepis.epa.gov/Exe/tiff2png.cgi/200051DL.PNG?-r+85+-g+15+-h+2,15,5,5,44,13+D%3A%5CZYFILES%5CINDEX%20DATA%5C95THRU99%5CTIFF%5C00001056%5C200051DL.TIF
Nordberg, W., Conaway, J., Ross, D., and Wilheit, T. (1971). Measurement of microwave emission from a foam covered wind driven sea. J. Atmos. Sci. 38, 429–433. doi: 10.1175/1520-0469(1971)028<0429:MOMEFA>2.0.CO;2
Nuss, W. A., Bane, J. M., Thompson, W. T., Holt, T., Dorman, C. E., Ralph, F. M., et al. (2000). Coastally trapped wind reversals: progress toward understanding. Bull. Am. Meteorol. Soc. 81, 719–744. doi: 10.1175/1520-0477(2000)081<0719:CTWRPT>2.3.CO;2
Ohman, M. D., Powell, J. R., Picheral, M., and Jensen, D. W. (2012). Mesozooplankton and particulate matter responses to a deep-water frontal system in the southern California Current System. J. Plankton Res. 34, 815–827. doi: 10.1093/plankt/fbs028
Omand, M. M., D'asaro, E. A., Lee, C. M., Perry, M. J., Briggs, N., Cetinić, I., et al. (2015). Eddy-driven subduction exports particulate organic carbon from the spring bloom. Science 348, 222–225. doi: 10.1126/science.1260062
O'Neill, L. W. (2012). Wind speed and stability effects on the coupling between surface wind stress and SST observed from buoys and satellite. J. Climate 26, 1544–1569. doi: 10.1175/JCLI-D-11-00121.1
Ortiz-Suslow, D., Haus, B., Williams, N., Laxague, N., Reniers, A., and Graber, H. (2015). The spatial-temporal variability of air-sea momentum fluxes observed at a tidal inlet. J. Geophys. Res. 120, 660–676. doi: 10.1002/2014JC010412
Parish, T. R., Rahn, D. A., and Leon, D. C. (2016). Aircraft measurements and numerical simulations of an expansion fan off the California coast. J. Appl. Meteor. Climatol. 55, 2053–2062. doi: 10.1175/JAMC-D-16-0101.1
Pellichero, V., Sallée, J. B., Chapman, C. C., and Downes, S. M. (2018). The southern ocean meridional overturning in the sea-ice sector is driven by freshwater fluxes. Nat. Commun. 9:1789. doi: 10.1038/s41467-018-04101-2
Pendleton, L., Donato, D. C., Murray, B. C., Crooks, S., Jenkins, W. A., Sifleet, S., et al. (2012). Estimating global “blue carbon” emissions from conversion and degradation of vegetated coastal ecosystems. PLoS ONE 7:e43542. doi: 10.1371/journal.pone.0043542
Perlin, N., Skyllingstad, E. D., and Samelson, R. M. (2011). Coastal atmospheric circulation around an idealized cape during wind-driven upwelling studied from a coupled ocean–atmosphere model. Mon. Wea. Rev. 139, 809–829. doi: 10.1175/2010MWR3372.1
Plagge, A. M., Vandemark, D., and Chapron, B. (2012). Examining the impact of surface currents on satellite scatterometer and altimeter ocean winds. J. Atmos. Ocean. Technol. 29, 1776–1793. doi: 10.1175/JTECH-D-12-00017.1
Plagge, A. M., Vandemark, D. C., and Long, D. G. (2009). Coastal validation of ultra-high resolution wind vector retrieval from QuikSCAT in the Gulf of Maine. IEEE Geosci. Remote Sens. Lett. 6, 413–417. doi: 10.1109/LGRS.2009.2014852
Portabella, M., and Stoffelen, A. (2001). Rain detection and quality control of SeaWinds. J. Atmos. Ocean. Technol. 18, 1171–1183. doi: 10.1175/1520-0426(2001)018<1171:RDAQCO>2.0.CO;2
Portabella, M., and Stoffelen, A. (2009). On scatterometer ocean stress. J. Atmos. Ocean. Technol. 26, 368–382. doi: 10.1175/2008JTECHO578.1
Portabella, M., Stoffelen, A., and Johannessen, J. A. (2002). Toward an optimal inversion method for SAR wind retrieval. J. Geophys. Res. 107, 1–13. doi: 10.1029/2001JC000925
Portabella, M., Stoffelen, A., Verhoef, A., and Verspeek, J. (2012). A new method for improving scatterometer wind quality control. IEEE Geosci. Remote Sens. Lett. 9, 579–583. doi: 10.1109/LGRS.2011.2175435
Powell, M. D., Murillo, S., Dodge, P., Uhlhorn, E., Gamache, J., Cardone, V., et al. (2010). Reconstruction of Hurricane Katrina's wind fields for storm surge and wave hindcasting. Ocean Eng. 37, 26–36. doi: 10.1016/j.oceaneng.2009.08.014
Priftis, G., Garg, P., Lang, T., Chronis, T., Nesbitt, S., and Lindsley, R. (2018). “Examining convective signatures in scatterometer data,” International Ocean Vector Winds Science Team IOVWST (Barcelona). Available online at: https://mdc.coaps.fsu.edu/scatterometry/meeting/docs/2018/docs/TuesdayApril24/TuesdayAfternoon/iovwst_presentation_lang.pptx
Pringle, J. M., and Dever, E. P. (2009). Dynamics of wind-driven upwelling and relaxation between Monterey Bay and Point Arena: Local-, regional-, and gyre-scale controls, J. Geophys. Res. 114:C07003. doi: 10.1029/2008JC005016
Quilfen, Y., Chapron, B., Collard, F., and Vandemark, D. (2004). Relationship between ERS scatterometer measurement and integrated wind and wave parameters. J. Atmos. Ocean. Technol. 21, 368–373. doi: 10.1175/1520-0426(2004)021<0368:RBESMA>2.0.CO;2
Rahn, D. A., Parish, T. R., and Leon, D. (2013). Airborne measurements of coastal jet transition around point conception, California. Mon. Weather Rev. 141, 3827–3839. doi: 10.1175/MWR-D-13-00030.1
Reul, N., and Chapron, B. (2003). A model of sea-foam thickness distribution for passive micro-wave remote sensing applications. J. Geophys. Res. 108. doi: 10.1029/2003JC001887
Reul, N., Chapron, B., Zabolotskikh, E., Donlon, C., Mouche, A., Tenerelli, J., et al. (2017). A new generation of tropical cyclone size measurements from space. Bull. Am. Meteorol. Soc. 98, 2367–2385. doi: 10.1175/BAMS-D-15-00291.1
Reul, N., Chapron, B., Zabolotskikh, E., Donlon, C., Quilfen, Y., Guimbard, S., et al. (2016). A revised L-band radio-brightness sensitivity to extreme winds under Tropical Cy-clones: the five year SMOS-storm database. Remote Sens. Environ. 180, 274–291. doi: 10.1016/j.rse.2016.03.011
Reul, N., Tenerelli, J., Chapron, B., Vandemark, D., Quilfen, Y., and Kerr, Y. (2012). SMOS satellite L-band radiometer: a new capability for ocean surface remote sensing in hurricanes. J. Geophys. Res. 117:C02006. doi: 10.1029/2011JC007474
Ricciardulli, L., Meissner, T., and Wentz, F. (2012). “Towards a climate data record of satellite ocean vector winds,” Proceedings of the 2012 IEEE International Geoscience and Remote Sensing Symposium (Munich: IEEE).
Ricciardulli, L., Wentz, F., and Meissner, T. (2015). “Bringing consistency among scatterometer winds using radiometer observations,” IOVWST Meeting 2015 (Portland). Available online at: https://mdc.coaps.fsu.edu/scatterometry/meeting/docs/2015/ClimateDataRecordDevelopmentAndAnalysis/Ricciardulli_ovwst_2015.pdf
Rodriguez, E. (2018). On the optimal design of doppler scatterometers. Remote Sens. 10:1765. doi: 10.3390/rs10111765
Rodriguez, E., Bourassa, M., Chelton, D., Farrar, J. T., Long, D. D., Perkovic-Martin, D., et al. (2019). The winds and currents mission concept. Front. Mar. Sci. 6, 1–8. doi: 10.3389/fmars.2019.00438
Rodriguez, E., Wineteer, A., Perkovic-Martin, D., Gál, T., Stiles, B. W., Niamsuwan, N., et al. (2018). Estimating ocean vector winds and currents using a Ka-band pencil-beam doppler scatterometer. Remote Sens. 10:576. doi: 10.3390/rs10040576
Roemmich, D., Church, J., Gilson, J., Monselesan, D., Sutton, P., and Wijffels, S. (2015): Unabated planetary warming its ocean structure since 2006. Nat. Clim. Change. 5 240–245. doi: 10.1038/nclimate2513
Rogers, R., Reasor, P., and Lorsolo, S. (2013). Airborne Doppler observations of the inner-core structural differences between intensifying and steady-state tropical cyclones. Mon. Wea. Rev. 141, 2970–91.
Roman-Stork (2018). Analysis of the 10–20-Day intraseasonal oscillation in the indian ocean using surface winds from composite satellite data (MS Thesis). Florida State University.
Ross, D. B., Cardone, V. J., Overland, J., McPherson, R. D., Pierson, W. J. Jr., and Yu, T. (1985). Oceanic surface winds. Adv. Geophys. 27, 101–138. doi: 10.1016/S0065-2687(08)60404-5
Saiprasanth, B., Haddad, Z. S., Hristova-Veleva, S., and Marks, F. D. Jr. (2018). “A low-wavenumber analysis of the environmental and vortex-scale variables responsible for rapid intensity changes in landfalling tropical cyclones,” in Remote Sensing and Modeling of the Atmosphere, Oceans, and Interactions VII, Vol. 10782 (International Society for Optics and Photonics), 1078208. Available online at: https://www.spiedigitallibrary.org/conference-proceedings-of-spie/10782/1078208/A-low-wavenumber-analysis-of-the-environmental-and-vortex-scale/10.1117/12.2500290.short?SSO=1
Samelson, R. M. (2019). Challenges and Opportunities in Coastal Prediction. Earth & Space Science News, 100.
Sampson, C., and Schrader, A. (2000). The automated tropical cyclone forecasting system (version 3.2). Bull. Am. Meteorol. Soc. 81, 1231–1240. doi: 10.1175/1520-0477(2000)081<1231:TATCFS>2.3.CO;2
Sandu, I., Beljaars, A., Bechtold, P., Mauritsen, T., and Balsamo, G. (2011). Why is it so difficult to represent stably stratified conditions in numerical weather prediction (NWP) models? J. Adv. Model. Earth Syst. 5, 117–133. doi: 10.1002/jame.20013
Sapp, J., Alsweiss, S., Jelenak, Z., Chang, P., Frasier, S., and Carswell, J. (2016). Airborne co-polarization observations of the ocean-surface NRCS at C-band. IEEE Trans. Geosci. Remote Sens. 54, 5975–5992. doi: 10.1109/TGRS.2016.2578048
Sapp, J., Jelenak, Z., Chang, P., and Frasier, S. (2018). “C-band cross-polarization ocean surface observations in Hurricane Matthew,” in IGARSS. (Valencia).
Shapiro, L. J., and Willoughby, H. E. (1982). The response of balanced hurricanes to local sources of heat and momentum. J. Atmos. Sci. 39, 378–394. doi: 10.1175/1520-0469(1982)039<0378:TROBHT>2.0.CO;2
Shen, W., Gurgel, K.-W., Voulgaris, G., Schlick, T., and Stammer, D. (2012). Wind-speed inversion from HF radar first-order backscatter signal. Ocean Dyn. 62, 105–121. doi: 10.1007/s10236-011-0465-9
Shi, Q. (2017). Coupling ocean currents and waves with wind stress over the Gulf Stream (Ph.D. dissertation). Tallahassee, FL, USA: Florida State University.
Shi, Q., and Bourassa, M. A. (2019). Coupling ocean currents and waves with wind stress over the gulf stream. Remote Sens. 11:1476. doi: 10.3390/rs11121476
Spencer, M. W., Wu, C., and Long, D. G. (2000). Improved resolution backscatter measurements with the SeaWinds pencil-beam scatterometer. IEEE Trans. Geosci. Remote Sens. 38, 89–104. doi: 10.1109/36.823904
Stephens, G. L., Lebsock, M., Yue, Q., Kahn, B. H., et al. (2018). Regional intensification of the tropical hydrological cycle during ENSO. Geophys. Res. Lett. 45, 4361–4370. doi: 10.1029/2018GL077598
Stiles, B., Fore, A., Ricciardulli, L., Wineteer, A. G., Hristova-Veleva, S., Rodriguez, E., et al. (2018). “Imporvements in the version 4.0 QuikSCAT ocean vector winds,” in International Ocean Vector Wind Science Team (Barcelona). Available online at: https://mdc.coaps.fsu.edu/scatterometry/meeting/docs/2018/docs/TuesdayApril24/TuesdayAfternoon/Stiles_QSCATV4_slides.pptx
Stiles, B.W., and co-authors (2014). Optimized tropical cyclone winds from QuikSCAT: a neural network approach. IEEE Trans. Geosci. Remote Sens. 52, 7418–7434. doi: 10.1109/TGRS.2014.2312333
Stiles, B. W., and Dunbar, R. S. (2010). A neural network technique for improving the accuracy of scatterometer winds in rainy conditions. IEEE Trans. Geosci. Remote Sens. 48, 3114–3122. doi: 10.1109/TGRS.2010.2049362
Stiles, B. W., and Yueh, S. H. (2002). Impact of rain on spaceborne Ku-band wind scatterometer data. IEEE Trans. Geosci. Remote Sens. 40, 1973–1983. doi: 10.1109/TGRS.2002.803846
Stoffelen, A., Aaboe, S., Calvet, J.-C., Cotton, J., De Chiara, G., Saldana, J., et al. (2017b). Scientific Developments and the EPS-SG Scatterometer. IEEE J. Select. Topics Appl. Earth Observ. Remote Sens. 10, 2086–2097. doi: 10.1109/JSTARS.2017.2696424
Stoffelen, A., Anton, V., Jeroen, V., Jur, V., Gert-Jan, M., Driesenaar, T., et al. (2013). Research and Development in Europe on Global Application of the OceanSat-2 Scatterometer Winds. Final Report of OceanSat-2 Cal/Val AO project, NWPSAF-KN-TR-022, SAF/OSI/CDOP2/KNMI/TEC/RP/196
Stoffelen, A., Kumar, R., Zou, J., Karaev, V., Chang, P. S., and Rodriguez, E. (2019). “Ocean surface vector wind observations,” in Remote Sensing of the Asian Seas (Cham: Springer), 429–447.
Stoffelen, A., Verspeek, J. A., Vogelzang, J., and Verhoef, A. (2017a). The CMOD7 geophysical model function for ASCAT and ERS wind retrievals. IEEE J. Select. Topics Appl. Earth Observ. Remote Sens. 10, 2123–2134. doi: 10.1109/JSTARS.2017.2681806
Stukel, M. R., Aluwihare, L. I., Barbeau, K. A., Chekalyuk, A. M., Goericke, R., Miller, A. J., et al. (2017). Mesoscale ocean fronts enhance carbon export due to gravitational sinking and subduction. Proc. Natl. Acad Sci. U.S.A. 114, 1252–1257. doi: 10.1073/pnas.1609435114
Takeyama, Y., Ohsawa, T., Kozai, K., Hasager, C. B., and Badger, M. (2013). Comparison of geophysical model functions for SAR wind speed retrieval in Japanese coastal waters. Remote Sens. 5, 1956–1973. doi: 10.3390/rs5041956
Trindade, A., Portabella, M., Lin, W., and Stoffelen, A. (2017). “On the development of a scatterometer-based correction for NWP wind forcing systematic errors: impact of satellite sampling,” in Proceedings of the International Geoscience and Remote Sensing Symposium (IGARSS) (Fort Worth, TX).
Tsai, W.-Y., Graf, J. E., Winn, C., Huddleston, J. N., Dunbar, S., Freilich, M. H., et al. (1999). Postlaunch sensor verification and calibration of the NASA scatterometer. IEEE Trans. Geosci. Remote Sens. 37, 1517–1542. doi: 10.1109/36.763264
Uhlhorn, E., and Black, P. (2003). Verification of remotely sensed sea surface winds in hurricanes. J. Atmos. Ocean. Technol. 20, 99–116. doi: 10.1175/1520-0426(2003)020<0099:VORSSS>2.0.CO;2
Uhlhorn, E., Franklin, J., Goodberlet, M., Carswell, J., and Goldstein, A. (2007). Hurricane surface wind measurements from an operational stepped frequency microwave radiometer. Mon. Wea. Rev. 135, 3070–3085. doi: 10.1175/MWR3454.1
Ulaby, F., and Long, D. (2014). Microwave Radar and Radiometric Remote Sensing. Ann Arbor: The University of Michigan Press.
UNEP. (2015). Blue Economy—Sharing Success Stories to Inspire Change. UNEP Regional Seas Report and Studies No. 195, Nairobi.
van Zadelhoff, G. J., Stoffelen, A., Vachon, P. W., Wolfe, J., Horstmann, J., and Belmonte-Rivasm, M. (2014). Retrieving hurricane wind speeds using cross-polarization C-band measurements. Atmos. Measure. Tech. 7, 437–449. doi: 10.5194/amt-7-437-2014
Vandemark, D., James, E., and Marc, E. (2018). “Evaluating several key issues in satellite wind stress validation,” in International Ocean Vector Winds Science Team IOVWST (Barcelona). Available online at: https://mdc.coaps.fsu.edu/scatterometry/meeting/docs/2018/docs/WednesdayApril25/WednesdayMorning/vandemark_edson_OVW2018_talk.pptx
Verhoef, A., Vogelzang, J., Verspeek, J., and Stoffelen, A. (2017). Long-term scatterometer wind climate data records. IEEE J. Select. Topics Appl. Earth Observ. Remote Sens. 10, 2186–2194. doi: 10.1109/JSTARS.2016.2615873
Vigh, J. L., and Schubert, W. H. (2009) Rapid development of the tropical cyclone warm core. J. Atmos. Sci. 66, 3335–3350. doi: 10.1175/2009JAS3092.1
Vogelzang, J., King, G. P., and Stoffelen, A. (2015). Spatial variances of wind fields and their relation to second-order structure functions and spectra. J. Geophys. Res. Oceans 120, 1048–1064. doi: 10.1002/2014JC010239
Vogelzang, J., and Stoffelen, A. (2017). ASCAT ultrahigh-resolution wind products on optimized grids. IEEE J. Select. Topics Appl. Earth Observ. Remote Sens. 10, 2332–2339. doi: 10.1109/JSTARS.2016.2623861
Wackerman, C. C., Pichel, W., Li, X., and Clemente-Colòn, P. (2006). “Estimation of surface winds from SAR using a projection algorithm,” in Proceedings of the 14th Conference on Satellite Meteorology and Oceanography (Atlanta, GA).
Walter, A. (1973). Detailed mesometeorological studies of air pollution dispersion in the Chicago Lake Breeze. Monthly Weather Rev. 101:387. doi: 10.1175/1520-0493(1973)101<0387:DMSOAP>2.3.CO;2
Wang, Z, Stoffelen, A., Fois, F., Verhoef, A., Zhao, C., Lin, M., et al. (2017). SST Dependence of Ku- and C-band backscatter measurements. IEEE J. Select. Topics Appl. Earth Observ. Remote Sens. 10, 2135–2145. doi: 10.1109/JSTARS.2016.2600749
Wanninkhof, R. (1992). Relationship between wind-speed and gas-exchange over the ocean. J. Geophys. Res. Oceans 97, 7373–7382. doi: 10.1029/92JC00188
Waugh, D. W., Primeau, F., DeVries, T., and Holzer, M. (2013). Recent changes in the ventilation of the Southern Oceans. Science 339, 568–570. doi: 10.1126/science.1225411
Weisberg, R. H., and Zheng, L. (2008). Hurricane storm surge simulations comparing three-dimensional with two-dimensional formulations based on an Ivan-like storm over the Tampa Bay, Florida region. J. Geophys. Res. Oceans 113. doi: 10.1029/2008JC005115
Weissman, D., King, D., and Thompson, T. W. (1979). Relationship between hurricane surface winds and L-band radar backscatter from the sea surface. Appl. Meteorol. J. 18, 1023–1034. doi: 10.1175/1520-0450(1979)018<1023:RBHSWA>2.0.CO;2
Weissman, D. E., and Bourassa, M. A. (2008). Measurements of the effect of rain-induced sea surface roughness on the QuikSCAT scatterometer radar cross section. IEEE Trans. Geosci. Remote Sens. 46, 2882–2894. doi: 10.1109/TGRS.2008.2001032
Weissman, D. E., and Bourassa, M. A. (2011). The influence of rainfall on scatterometer backscatter within tropical cyclone environments – implications of parameterization of sea surface stress. IEEE Trans. Geosci. Remote Sens. 49, 4805–4814. doi: 10.1109/TGRS.2011.2170842
Weissman, D. E., Stiles, B., Hristova-Veleva, S., Long, D., Smith, D., Hilburn, K., et al. (2012). Challenges to satellite sensors of ocean winds; addressing precipitation effect. Atmos. J. Oceanic Technol. 29, 356–374. doi: 10.1175/JTECH-D-11-00054.1
Welander, P. (1961). Numerical prediction of storm surges. Adv. Geophys. 8, 315–379. doi: 10.1016/S0065-2687(08)60343-X
Wentz, F. (1997). A well calibrated ocean algorithm for special sensor microwave/imager. J. Geophys. Res. 102, 8703–8718. doi: 10.1029/96JC01751
Wentz, F. (2005). The Effects of Cloud and Rain on the Aquarius Salinity Retrieval. Algorithm Theoretical Basis Document, RSS Technical Report 3031805, Remote Sensing Systems (Santa Rosa, CA). Available online at: www.remss.com/papers/aquarius/rain_effect_on_salinity.pdf
Wentz, F. (2015). A 17-year climate record of environmental parameters derived from the Tropical Rainfall Measuring Mission (TRMM) Microwave Imager. J. Clim. 28, 6882–6902. doi: 10.1175/JCLI-D-15-0155.1
Wentz, F., Ricciardulli, L., Rodriguez, E., Stiles, B., Bourassa, M., Long, D., et al. (2017). Evaluating and extending the ocean winds data climate record. J. Select. Topics Appl. Earth Observ. Remote Sens. 99, 2165–2185. doi: 10.1109/JSTARS.2016.2643641
Wentz, F., and Spencer, R. (1998). SSM/I rain retrievals within a unified all-weather ocean algorithm. J. Atmos. Sci. 55, 1613–1627. doi: 10.1175/1520-0469(1998)055<1613:SIRRWA>2.0.CO;2
Wentz, F. J., and Draper, D. (2016). On-orbit absolute calibration of the global precipitation measurement microwave imager. J. Atmos. Ocean. Technol. 33, 1393–1412. doi: 10.1175/JTECH-D-15-0212.1
Wentz, F. J., and Smith, D. K. (1999). A model function for the ocean normalized radar cross-section at 14 GHz derived from NSCAT observations. J. Geophys. Res. 104, 11499–11524. doi: 10.1029/98JC02148
Winant, C. D., Dorman, C. E., Friehe, C. A., and Beardsley, R. C. (1988). The marine layer off northern California: an example of supercritical channel flow. J. Atmos. Sci. 45, 3588–3605. doi: 10.1175/1520-0469(1988)045<3588:TMLONC>2.0.CO;2
Wood, R., Koehler, M., Bennartz, R., and O'Dell, C. (2009). The diurnal cycle of surface divergence over the global oceans. Q. J. R. Meteorol. Soc. 135, 1484–1493. doi: 10.1002/qj.451
World Bank (2017). The Potential of the Blue Economy: Increasing Long-Term Benefits of the Sustainable Use of Marine Resources for Small Island Developing States and Coastal Least Developed Countries. Washington, DC: World Bank.
Wyatt, L., Green, J., Middleditch, A., Moorhead, M., Howarth, J., Hol, M., et al. (2006). Operational wave, current, and wind measurements with the pisces HF radar. IEEE J. Ocean. Eng. 31, 819–834. doi: 10.1109/JOE.2006.888378
Xie, J., Yao, G., Sun, M., and Ji, Z. (2018). Measuring ocean surface wind field using shipborne high-frequency surface wave radar. IEEE Trans. Geosci. Remote Sens. 56, 3383–3397. doi: 10.1109/TGRS.2018.2799002
Yang, X. -Y, Huang, R. X., and Wang, D. X. (2007). Decadal changes of wind stress over the southern ocean associated with Antarctic Ozone depletion. Clim. J. 20, 3395–3410. doi: 10.1175/JCLI4195.1
Yang, Z., Lu, N., Shi, J., Zhang, P., Dong, C., and Yang, J. (2012). Overview of FY-3 Payload and ground application system. IEEE Trans. Geosci. Remote Sens. 50, 4846–4853. doi: 10.1109/TGRS.2012.2197826
Young, G. S., Sikora, T. D., and Winstead, N. S. (2007). Manual and semiautomated wind direction editing for use in the generation of synthetic aperture radar wind speed imagery. J. Appl. Meteorol. Clim. 46, 776–790. doi: 10.1175/JAM2507.1
Yu, L., Jin, X., and Weller, R. A. (2008). Multidecade Global Flux Datasets From the Objectively Analyzed Air-Sea Fluxes (OAFlux) Project: Latent and Sensible Heat Fluxes, Ocean Evaporation, and Related Surface Meteorological Variables. OAFlux Project Technical Report OA-2008-01.
Yueh, S., Tang, W., Fore, A., Neumann, G., Hayashi, A., Freedman, A., et al. (2013). L-band passive and active microwave geophysical model functions of ocean sur-face winds and applications to Aquarius retrieval. IEEE Trans. Geosci. Remote Sens. 51, 4619–4662 doi: 10.1109/TGRS.2013.2266915
Yueh, S. H., Wilson, W. J., Dinardo, S. J., and Li, F. K. (1999). Polarimetric microwave brightness signatures of ocean wind directions. IEEE Trans. Geosci. Remote Sens. 37, 949–959. doi: 10.1109/36.752213
Zabolotskikh, E., Mitnik, L., Reul, N., and Chapron, B. (2015). New possibilities for geophysical parameter retrievals opened by GCOM-W1 AMSR2. IEEE J. Select. Topics Appl. Earth Observ. Remote Sens. 8, 4248–4261. doi: 10.1109/JSTARS.2015.2416514
Zhang, B., and Perrie, W. (2012). Cross-polarized synthetic aperture radar: a new potential measurement technique for Hurricanes. Bull. Am. Meteorol. Soc. 93, 531–541. doi: 10.1175/BAMS-D-11-00001.1
Zheng, C. W., Li, C. Y., and Li, X. (2017). Recent decadal trend in the North Atlantic wind energy resources. Adv. Meteorol. 2017, 1–8. doi: 10.1155/2017/7257492
Keywords: satellite, wind, stress, ocean, requirements
Citation: Bourassa MA, Meissner T, Cerovecki I, Chang PS, Dong X, De Chiara G, Donlon C, Dukhovskoy DS, Elya J, Fore A, Fewings MR, Foster RC, Gille ST, Haus BK, Hristova-Veleva S, Holbach HM, Jelenak Z, Knaff JA, Kranz SA, Manaster A, Mazloff M, Mears C, Mouche A, Portabella M, Reul N, Ricciardulli L, Rodriguez E, Sampson C, Solis D, Stoffelen A, Stukel MR, Stiles B, Weissman D and Wentz F (2019) Remotely Sensed Winds and Wind Stresses for Marine Forecasting and Ocean Modeling. Front. Mar. Sci. 6:443. doi: 10.3389/fmars.2019.00443
Received: 16 November 2018; Accepted: 05 July 2019;
Published: 23 August 2019.
Edited by:
Tong Lee, NASA Jet Propulsion Laboratory (JPL), United StatesReviewed by:
Amanda Plagge, Global Science and Technology, Inc., United StatesAaron Christopher Paget, Concord University, United States
Copyright © 2019 Bourassa, Meissner, Cerovecki, Chang, Dong, De Chiara, Donlon, Dukhovskoy, Elya, Fore, Fewings, Foster, Gille, Haus, Hristova-Veleva, Holbach, Jelenak, Knaff, Kranz, Manaster, Mazloff, Mears, Mouche, Portabella, Reul, Ricciardulli, Rodriguez, Sampson, Solis, Stoffelen, Stukel, Stiles, Weissman and Wentz. This is an open-access article distributed under the terms of the Creative Commons Attribution License (CC BY). The use, distribution or reproduction in other forums is permitted, provided the original author(s) and the copyright owner(s) are credited and that the original publication in this journal is cited, in accordance with accepted academic practice. No use, distribution or reproduction is permitted which does not comply with these terms.
*Correspondence: Mark A. Bourassa, mbourassa@fsu.edu