The Global Ocean Ship-Based Hydrographic Investigations Program (GO-SHIP): A Platform for Integrated Multidisciplinary Ocean Science
 Bernadette M. Sloyan1*
  Rik Wanninkhof2*
  Martin Kramp3*
  Gregory C. Johnson4
  Lynne D. Talley5
  Toste Tanhua6 Elaine McDonagh7
  Caroline Cusack8
  Eleanor O’Rourke8
  Evin McGovern8
  Katsuro Katsumata9 Steve Diggs5
  Julia Hummon10
  Masao Ishii11
  Kumiko Azetsu-Scott12
  Emmanuel Boss13
  Isabelle Ansorge14
  Fiz F. Perez15
  Herlé Mercier16
  Michael J. M. Williams17 Leif Anderson18
  Jae Hak Lee19
  Akihiko Murata9
  Shinya Kouketsu9 Emil Jeansson20 Mario Hoppema21 Edmo Campos22,23
- 1CSIRO, Oceans and Atmosphere, Hobart, TAS, Australia
- 2NOAA’s Atlantic Oceanographic and Meteorological Laboratory, Miami, FL, United States
- 3JCOMMOPS, WMO/IOC-UNESCO, Brest, France
- 4NOAA’s Pacific Marine Environmental Laboratory, Seattle, WA, United States
- 5Scripps Institution of Oceanography, University of California, San Diego, La Jolla, CA, United States
- 6GEOMAR Helmholtz Centre for Ocean Research Kiel, Kiel, Germany
- 7National Oceanography Centre, Southampton, United Kingdom
- 8Marine Institute, Galway, Ireland
- 9Global Chemical and Physical Oceanography Group, JAMSTEC, Yokosuka, Japan
- 10SOEST, University of Hawai’i, Honolulu, Honolulu, HI, United States
- 11JMA, Meteorological Research Institute, Tsukuba, Japan
- 12Bedford Institute of Oceanography, Dartmouth, NS, Canada
- 13School of Marine Sciences, The University of Maine, Orono, ME, United States
- 14Department of Oceanography, University of Cape Town, Cape Town, South Africa
- 15Instituto de Investigaciones Marinas (IIM-CSIC), Vigo, Spain
- 16CNRS, Ifremer Centre de Bretagne, University of Brest, Plouzané, France
- 17National Institute of Water and Atmospheric Research, Wellington, New Zealand
- 18Department of Marine Sciences, University of Gothenburg, Gothenburg, Sweden
- 19Korea Institute of Ocean Science and Technology, Busan, South Korea
- 20NORCE Norwegian Research Centre AS, Bjerknes Centre for Climate Research, Bergen, Norway
- 21Alfred Wegener Institute, Helmholtz Centre for Polar and Marine Research, Bremerhaven, Germany
- 22Oceanographic Institute, University of São Paulo, São Paulo, Brazil
- 23Gulf Environments Research Institute, American University of Sharjah, Sharjah, United Arab Emirates
The Global Ocean Ship-Based Hydrographic Investigations Program (GO-SHIP) provides a globally coordinated network and oversight of 55 sustained decadal repeat hydrographic reference lines. GO-SHIP is part of the global ocean/climate observing systems (GOOS/GCOS) for study of physical oceanography, the ocean carbon, oxygen and nutrient cycles, and marine biogeochemistry. GO-SHIP enables assessment of the ocean sequestration of heat and carbon, changing ocean circulation and ventilation patterns, and their effects on ocean health and Earth’s climate. Rapid quality control and open data release along with incorporation of the GO-SHIP effort in the Joint Technical Commission for Oceanography and Marine Meteorology (JCOMM) in situ Observing Programs Support Center (JCOMMOPS) have increased the profile of, and participation in, the program and led to increased data use for a range of efforts. In addition to scientific discovery, GO-SHIP provides climate quality observations for ongoing calibration of measurements from existing and new autonomous platforms. This includes biogeochemical observations for the nascent array of biogeochemical (BGC)-Argo floats; temperature and salinity for Deep Argo; and salinity for the core Argo array. GO-SHIP provides the relevant suite of global, full depth, high quality observations and co-located deployment opportunities that, for the foreseeable future, remain crucial to maintenance and evolution of Argo’s unique contribution to climate science. The evolution of GO-SHIP from a program primarily focused on physical climate to increased emphasis on ocean health and sustainability has put an emphasis on the addition of essential ocean variables for biology and ecosystems in the program measurement suite. In conjunction with novel automated measurement systems, ocean color, particulate matter, and phytoplankton enumeration are being explored as GO-SHIP variables. The addition of biological and ecosystem measurements will enable GO-SHIP to determine trends and variability in these key indicators of ocean health. The active and adaptive community has sustained the network, quality and relevance of the global repeat hydrography effort through societally important scientific results, increased exposure, and interoperability with new efforts and opportunities within the community. Here we provide key recommendations for the continuation and growth of GO-SHIP in the next decade.
Introduction
The Global Ocean Ship-based Hydrographic Investigations Program (GO-SHIP2), building on the successes of hydrographic surveys such as the international geophysical year, IGY (1957/58); the Indian Ocean expedition IIOE (≈1959–1965); the Geochemical Sections Study, GEOSECS (1968–1978); the transient tracers in the ocean program, TTO (1979–1983); the World Ocean Circulation Experiment, World Hydrographic Survey /Joint Global Ocean Flux Study, WOCE/WHP/JGOFS (1986–1996); and the Climate Variability program (1995-current, CLIVAR, 2018), maintains the global survey of select hydrographic sections. Hereafter, “GO-SHIP” refers to the global hydrographic observations with modern standards that began with WOCE in the 1990s.
Global Ocean Ship-Based Hydrographic Investigations Program, in combination with earlier programs, has led to improved understanding of the role of the ocean in climate variability and change, carbon cycling, and biogeochemical responses to climate change. GO-SHIP data have been, either exclusively or in combination with other data, used to document: (1) heat and freshwater storage and flux, (2) ocean circulation and circulation variability, (3) sequestration of anthropogenic carbon, (4) ventilation of deep and shallow water masses, and (5) changes in biogeochemical properties such as inorganic carbon, pH, oxygen and nutrients. The data have also been extensively used for model initialisation, calibration and validation. Talley et al. (2016) provide a comprehensive review of the science achievements of GO-SHIP; here we summarize those achievements and their societal impacts.
Assessment of Ocean Change
Heat and Fresh Water Changes
Argo floats now routinely sample the upper ocean (0–2000 m) and provide monthly estimates of upper ocean heat and freshwater change, whereas the global ocean below 2000 m depth is currently primarily sampled through GO-SHIP (Talley et al., 2016). GO-SHIP data have revealed that the deep (z > 2000 m) oceans have warmed from the 1990s to 2000s, storing some of the excess heat entering Earth’s climate system and contributing to global sea level rise (SLR) through thermal expansion (Purkey and Johnson, 2010, 2013; Kouketsu et al., 2011; Desbruyères et al., 2016). The GO-SHIP global sampling has shown that the deep warming is significantly larger in regions of the global ocean ventilated largely by Antarctic Bottom Water (AABW) with the strongest warming in the Southern Ocean near AABW formation sites and decreasing to the north (Sloyan et al., 2013). The deep warming equates globally to a 0.07 W m-2 average flux applied over Earth’s surface area (Purkey and Johnson, 2010; Rhein et al., 2013).
During the 2010s, GO-SHIP completed a reoccupation of the global hydrographic survey (Figure 1). The extended time-series has shown rapid AABW changes, including accelerated freshening in the Australian-Antarctic Basin and accelerated warming in the Southwest Pacific Basin in the last decade (Menezes et al., 2017; Purkey et al., 2019). In contrast, Johnson et al. (2014) find, in the Southwest Atlantic, that near-bottom warming in the Argentine Basin was reduced or absent from 2005 to 2014 compared to between 1989 and 2005, although warming continued in the bottom Brazil Basin. The difference in deep heat uptake between regions suggests different dynamical controls and/or regional variability in forcing the deep ocean. Further investigations are required to thoroughly understand these mechanisms. GO-SHIP observations have clearly shown that the ocean below 2000 m is varying and plays a significant role in the Earth energy and freshwater balance (Palmer et al., 2019). The detection of deep ocean variability has highlighted the need for more deep ocean observations, and in-part has led to the development and beginning of implementation of deep Argo float deployments that cover the full water column (Johnson et al., 2015; Jayne et al., 2017).
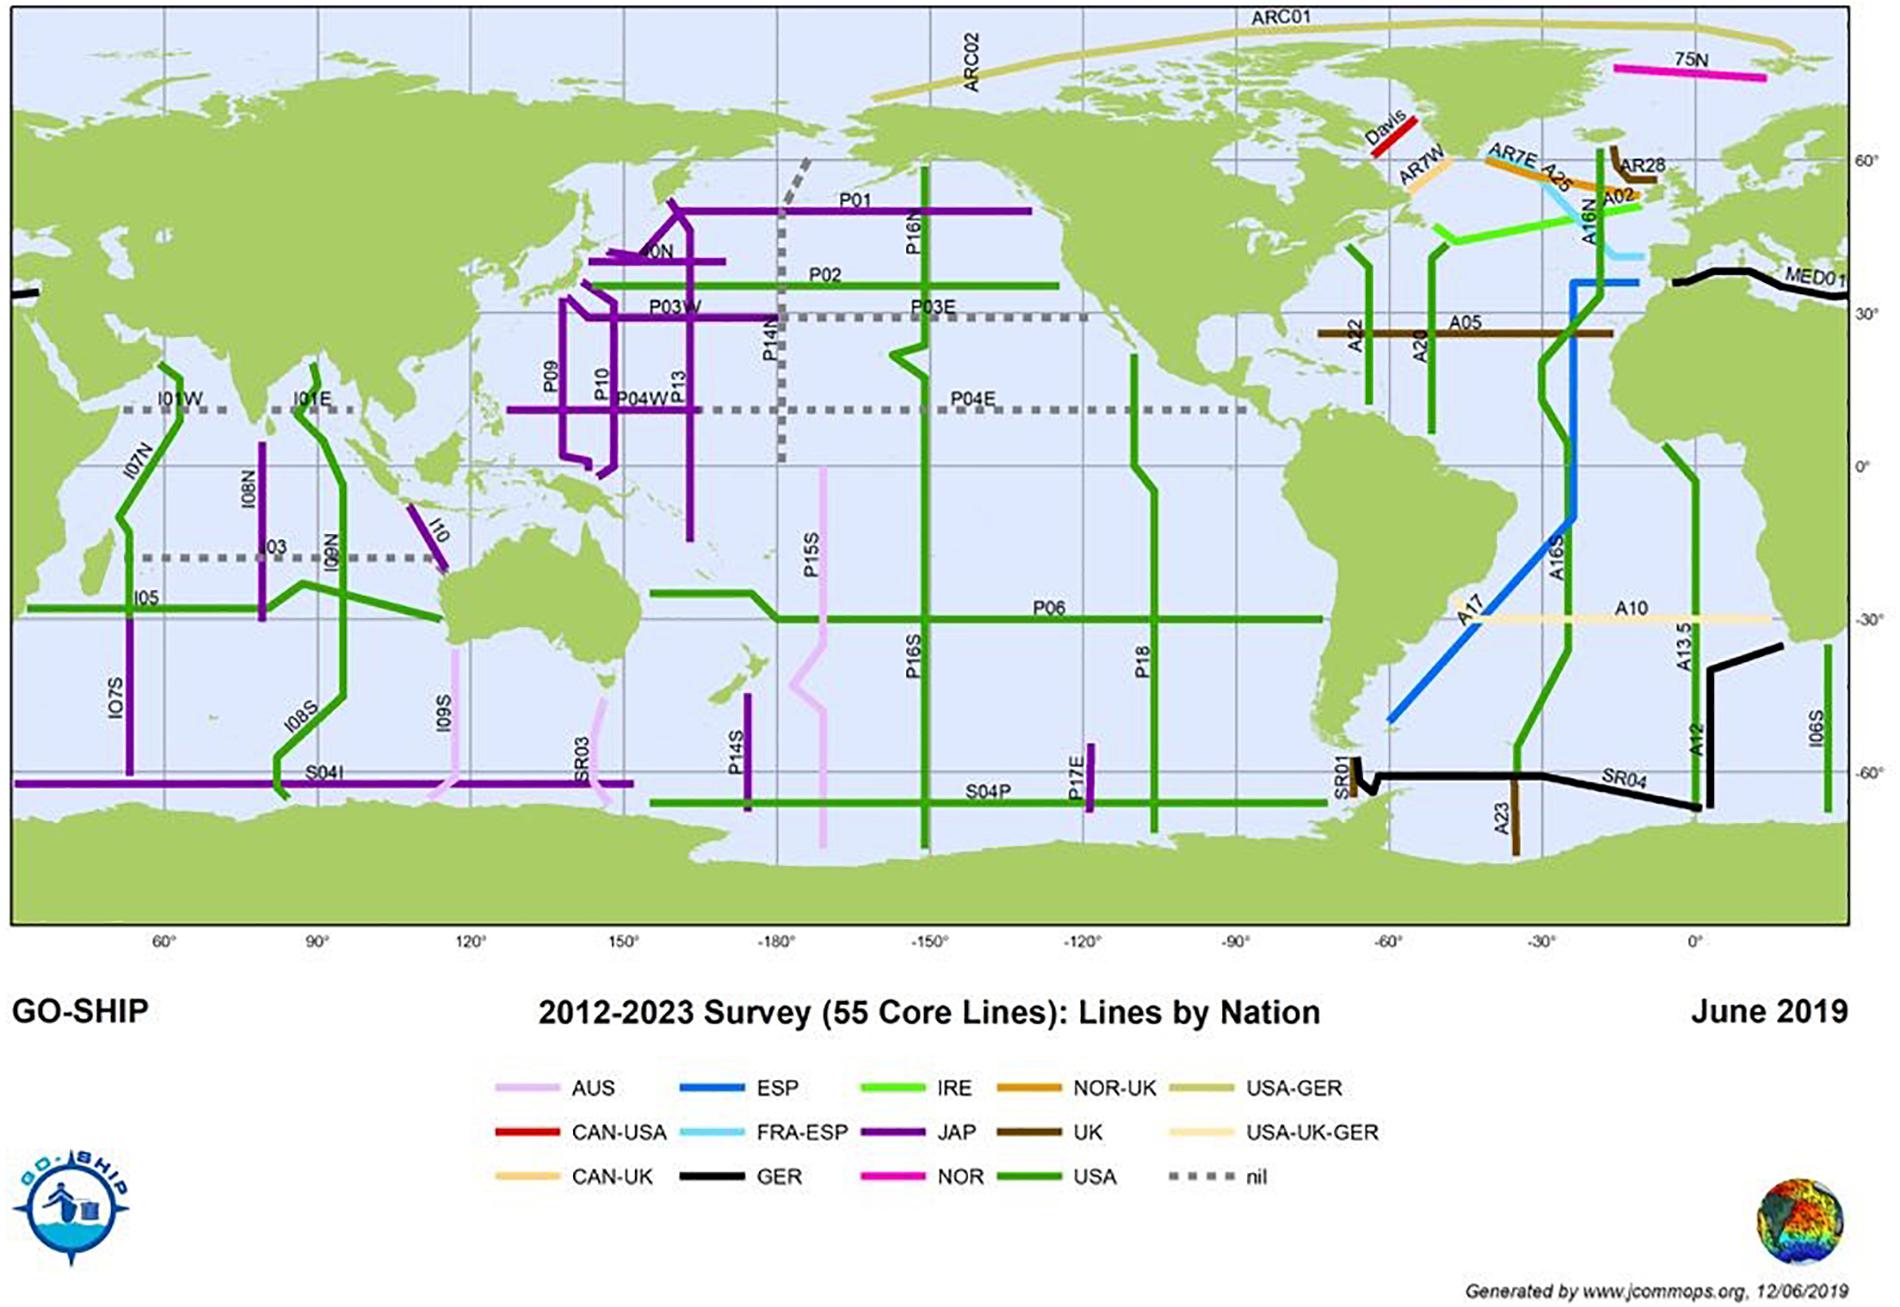
Figure 1. Global Ocean Ship-Based Hydrographic Investigations Program (GO-SHIP) reference lines according the nations leading the effort (color coded).
Circulation and Mixing
Global Ocean Ship-Based Hydrographic Investigations Program coast-to-coast sections provide a unique data set to monitor and documents changes in the large-scale basin circulation of the global ocean (e.g., Ganachaud and Wunsch, 2000; Sloyan and Rintoul, 2001; Lumpkin and Speer, 2007; McDonagh et al., 2008; Katsumata et al., 2013; Talley, 2013; Mercier et al., 2015; Hernandez-Guerra and Talley, 2016). GO-SHIP data have been combined with other components of the observing system, including satellite altimetry sea surface height and Argo float velocity (e.g., Roemmich et al., 2007) or OceanSITES boundary current transport and midocean arrays (e.g., Carton and Hakkinen, 2011; Carton et al., 2014) to investigate key questions regarding basin circulation. In addition full-depth temperature, salinity and velocity profiles have been used to investigate the spatial and vertical distribution of ocean mixing (Kunze et al., 2006; Huussen et al., 2012; Talley et al., 2016).
Transient Tracers
Anthropogenic transient-tracers such as chlorofluorocarbons (CFCs) and sulfur hexafluoride (SF6), collected as part of GO-SHIP, enable the science community to investigate the pathways, rates, and temporal variations in the processes ventilating the ocean on decadal timescales (Johnson et al., 2008; Wanninkhof et al., 2013b; Purkey et al., 2018). In addition, CFC and other tracer data are used to reconstruct the spatial and temporal evolution of anthropogenic carbon in the global ocean (Sabine and Tanhua, 2010; Khatiwala et al., 2013; Wanninkhof et al., 2013a); to estimate apparent oxygen utilization rates (Jenkins, 1977; Stanley et al., 2012); and to separate observed changes in oxygen and nutrients into physical (e.g., solubility, circulation, and mixing) and biological processes (Jenkins, 1998; Emerson et al., 2001; Mecking et al., 2006; Sonnerup et al., 2013, 2015; de la Paz et al., 2017). Transient tracers observations have revealed decadal scale variability of ventilation (e.g., Waugh et al., 2013; Tanhua et al., 2017).
Anthropogenic Carbon and Ocean Acidification
The tracking of global ocean uptake of anthropogenic carbon since the 1990s has only been possible due to the sustained GO-SHIP decadal survey. Changes in DIC concentration between repeat sections reflect both anthropogenic carbon uptake as well as natural variations in circulation and organic matter remineralization (Sabine and Tanhua, 2010).
Using GO-SHIP data a number of methods have been developed to estimate the ocean’s anthropogenic carbon uptake and inventory (Gruber et al., 1996; Friis et al., 2005). Based on these methods, Kouketsu and Murata (2014) estimated an anthropogenic storage rate of 2.9 (± 0.4) Pg C year-1 for the most recent decade (Figure 2). Gruber et al. (2019) provide a comprehensive analyses of GO-SHIP, and other ocean interior data and determine an uptake of 2.6 (± 0.3) Pg C year-1 between 1994 and 2006. Data-constrained ocean models for the period 1994–2010 suggest an ocean mean annual uptake rate of approximately 2.3 Pg C year-1. This equates to approximately 27% of the total anthropogenic carbon emissions absorbed by the ocean over this time period (Khatiwala et al., 2013).
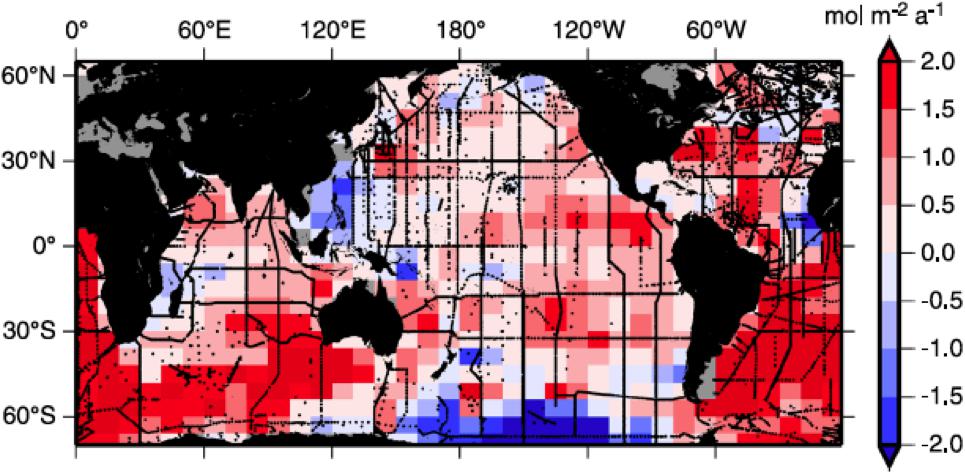
Figure 2. Column inventory changes in anthropogenic carbon in the global ocean based on the CARINA and PACIFICA syntheses from Kouketsu and Murata (2014).
Takatani et al. (2014) used the GO-SHIP reference and high-frequency sections to show that the rate of anthropogenic carbon increase in the western North Pacific subtropical gyre over the past two decades is consistent with atmospheric CO2 increases. The mean rate of anthropogenic carbon inventory change over the past few decades varies from 0.22 ( ± 0.05) mol m-2 year-1 to 0.94 ( ± 0.10) mol m-2 year-1, depending on the depth to which the ocean is ventilated (Talley et al., 2016). There is still considerable debate on whether this uptake is stored locally or exported (Sabine et al., 2004; van Heuven et al., 2011) and what water masses are involved (e.g., Gruber et al., 1996; Sabine et al., 2004; van Heuven et al., 2011; Pardo et al., 2014; Groeskamp et al., 2016). Once the anthropogenic carbon enters the ocean it is redistributed by the ocean circulation. It has been found that the deep western boundary currents serve as important ventilation pathways and carry an appreciable amount of anthropogenic carbon into the interior (Körtzinger et al., 1999; Murata et al., 2010; Brown et al., 2010; Waters et al., 2011; Ríos et al., 2012; Sloyan et al., 2013; Guallart et al., 2015; Carter et al., 2019).
The increase in ocean carbon concentration due to anthropogenic carbon uptake and rising ocean temperature has also lead to ocean acidification (Feely et al., 2009; Doney et al., 2009; Jiang et al., 2015). Results from GO-SHIP and the earlier programs (Feely et al., 2004, 2009; Key et al., 2004; Sabine et al., 2004; García-Ibáñez et al., 2016), have shown a pH change in the surface water of approximately -0.002 year-1 from 1991 to 2006 along sections in the North Pacific (for a summary, see Rhein et al., 2013). Based on frequently repeated GO-SHIP section in the North Atlantic it was shown how Meridional overturning circulation transports acidification signal to the deep waters (Perez et al., 2018).
Oxygen and Deoxygenation
Large and systematic changes in oxygen, mostly reductions, have been documented over the last two decades through GO-SHIP and additional local time-series data (e.g., Keeling et al., 2010; Hahn et al., 2017). Based on modeling studies (Deutsch et al., 2005) and correlations with physical forcing (Johnson and Gruber, 2007), it is suggested that the oxygen changes are mainly driven by physical forcing changes. The deoxygenation in the open-ocean thermocline over the past two decades is consistent with the expectation that warmer waters will hold less dissolved oxygen (the solubility effect) and that warming-induced stratification leads to a decrease in the transport of dissolved oxygen from surface to subsurface waters (the stratification effect) (Matear and Hirst, 2003; Deutsch et al., 2005; Frölicher et al., 2009).
Nutrients
Global Ocean Ship-Based Hydrographic Investigations Program provides high quality ocean nutrient data. The observed nutrient changes are due to a combination of both physical and land-use changes; physical stratification and wind changes and use of fertilizer in agriculture production leading to riverine discharge of nitrate to the ocean (Doney, 2010). A study by Kim et al. (2014), using derived excess nitrate, N∗ measurements and ventilation rates from CFCs, determined that the atmospheric deposition of anthropogenic nitrate in the western North Pacific is leading to excess nitrate in the upper water column. Note, N∗ = NO3 - RN:P ∗ PO4, where NO3 and PO4 are the measured nitrate and phosphate concentrations and RN:P is the Redfield ratio of 16:1. The excess nitrate was highest close to Asia with rates decreasing eastward across the North Pacific and suggests implications for the ecosystem from nitrate to phosphate limitation (Kim et al., 2014).
Multi-Variable Analyses
The value of a suite of contemporaneous ocean variables in GO-SHIP has been demonstrated in a number of studies. Oxygen data combined with transient-tracer data provides evidence regarding the timescales at which the ocean ventilation changes occur. The combination of oxygen data with carbon data (e.g., Sabine et al., 2008) and pH data (e.g., Byrne et al., 2010) has allowed separation of DIC/pH changes along the GO-SHIP sections into anthropogenic and ventilation/remineralization components, including their respective effects on carbon storage and ocean acidification. Ko et al. (2018) estimated net community production (NCP) in the N-depleted oligotrophic oceans on the basis of the seasonal changes in surface water partial pressure of CO2, pCO2, and DIC in absence of nutrients, largely based on GO-SHIP cruises. The combinations of ocean tracers and carbon have been used to investigate air-sea gas exchange and reconstruct the spatial and temporal evolution of anthropogenic carbon in the global ocean. All of these biogeochemical variables rely on high quality temperature and/or salinity data for many of their analytical analysis techniques.
GO-SHIP Measurement Attributes
Global Ocean Ship-Based Hydrographic Investigations Program’s unique capability of high-quality, contemporaneous ocean observations has and will continue to support physical, biogeochemical and importantly multidisciplinary ocean research. The provision of physics, biogeochemistry and increasingly biological/ecosystem ocean observations, combined with other observing systems (satellites and in situ platforms including increasing use of autonomous platforms) will support many of the user requirements of the observing system, such as climate monitoring and reporting and ocean health, in particular those identified by the UN Sustainable Development Goals3. GO-SHIP data are required to monitor the Earth’s energy imbalance, and provide a significant contribution, and decadal anchor point, to enabling tracking of the global carbon budget (Le Quéré et al., 2018). While the high quality data are generally provided in delayed-mode, the data are used in the calibration of near-real-time data that are heavily used by climate and ocean operational service providers.
Go-Ship: Structure and Oversight Role
As a component of the Global Climate Observing System (GCOS) and the Global Ocean Observing System (GOOS), it provides necessary international coordination and scientific oversight for repeat hydrography. The initial GO-SHIP Panel was established in 2007 to develop a strategy for a sustained global repeat hydrography program as a contribution to the OceanObs09 Conference (Hood et al., 2010).
As GO-SHIP established itself as an integral component of the Global Ocean Observing System (GOOS) network, the initial panel has evolved to a science committee with Executive Group and Steering Group Members committee representing all nations that execute GO-SHIP reference lines. The GO-SHIP co-chairs serve on the Joint Technical Commission for Oceanography and Marine Meteorology Observation Coordination group (JCOMM OCG).
The main tasks of the national representatives and international GO-SHIP committees are to:
• Develop international agreements for a sustained international repeat ship-based hydrography program, including a strategy and program plan,
• Advocate for national contributions to this strategy and participation in the global program,
• Provide a central forum for communication, coordination, and best practices, and
• Partner in syntheses of hydrographic data, in collaboration with regional, national, international, and global research programs.
Ship-based hydrography remains the only method for obtaining coincident reference standard, high-quality, high lateral and vertical resolution measurements of a suite of physical, chemical, and biological parameters over the full water column. The GO-SHIP principal scientific objectives are: (1) understanding and documenting the large-scale ocean water property distributions, their decadal changes, and drivers of those changes; and (2) addressing questions of the large physical, biogeochemical, and biological changes anticipated for the future ocean. This includes increasing dissolved inorganic carbon (DIC), warming, acidification, deoxygenation, and increased stratification of the ocean due to atmospheric CO2 increases and associated warming caused by changes in the Earth’s radiation balance. The observations will aid understanding of interaction of anthropogenic perturbations with natural cycles of water, including sea-ice, and with changes in circulation and ventilation processes. The addition of biological and ecosystem measurements will enable GO-SHIP to determine trends and variability in key indicators of ocean health.
Currently 10 nations contribute to the GO-SHIP reference and high frequency lines (Figure 1) and GO-SHIP lines increasingly benefit from multi-national participation and support (see section “Multi-Nation Voyages”). Approximately a third are performed by the United States with support from the National Science Foundation (NSF) and the National Oceanic and Atmospheric Administration (NOAA); some Level 3 optical measurements (Table 2) are being supported by the National Aeronautics and Space Administration (NASA). Australia is a core contributor to observations in the Southern Ocean, relying on other nations for measurement of transient tracers (United States, Japan). Japan has been active in observing the Pacific; their large contributions extend to the Southern Ocean and the Indian Ocean. The United Kingdom has increased its participation in long line cruises with focus on Atlantic zonal sections and Atlantic sector Southern Ocean sections. Germany has had a long-standing effort in the Mediterranean Sea and in the Southern Ocean sector of the Atlantic, and recently completed a joint multi-nation effort with Brazil, Argentina, and South Africa that has aided the GO-SHIP capacity building activities. Spain continues its long-term commitment to Atlantic meridional and zonal sections, one of them with biennial occupancy. France and Spain contribute through a biennial line in the northern North Atlantic. Ireland led its first GO-SHIP cruise in the North Atlantic with participation from Germany, United States, United Kingdom, and Canada. Canada and Norway occupy annual lines at high northern latitudes in the Atlantic.
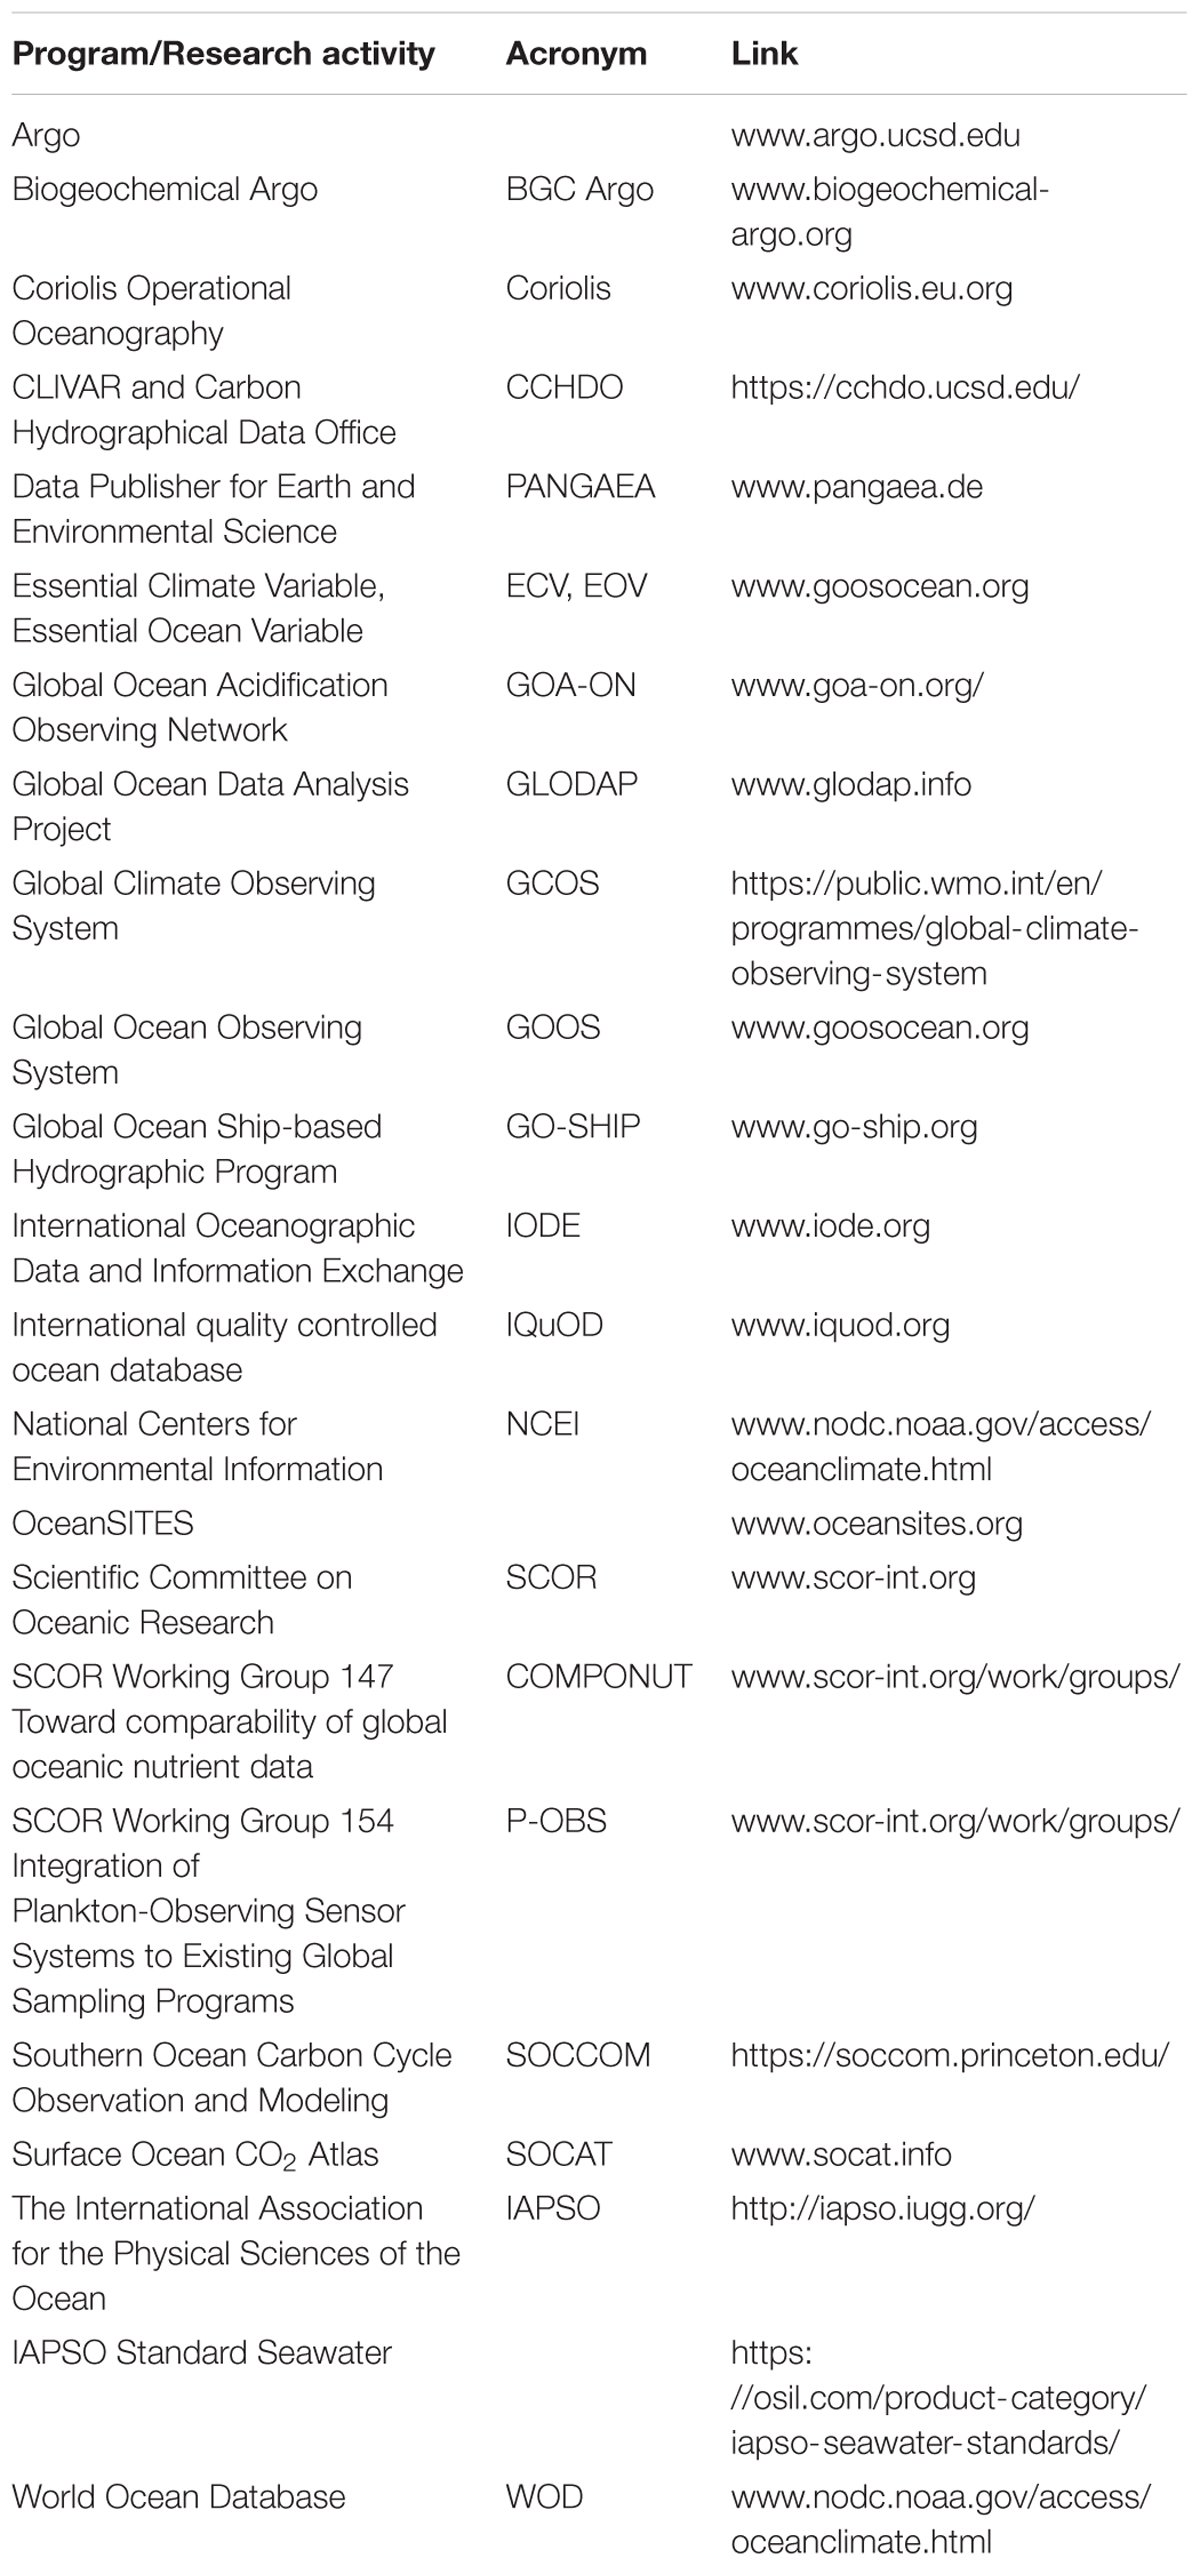
Table 1. Significant ocean science programs and research activities.
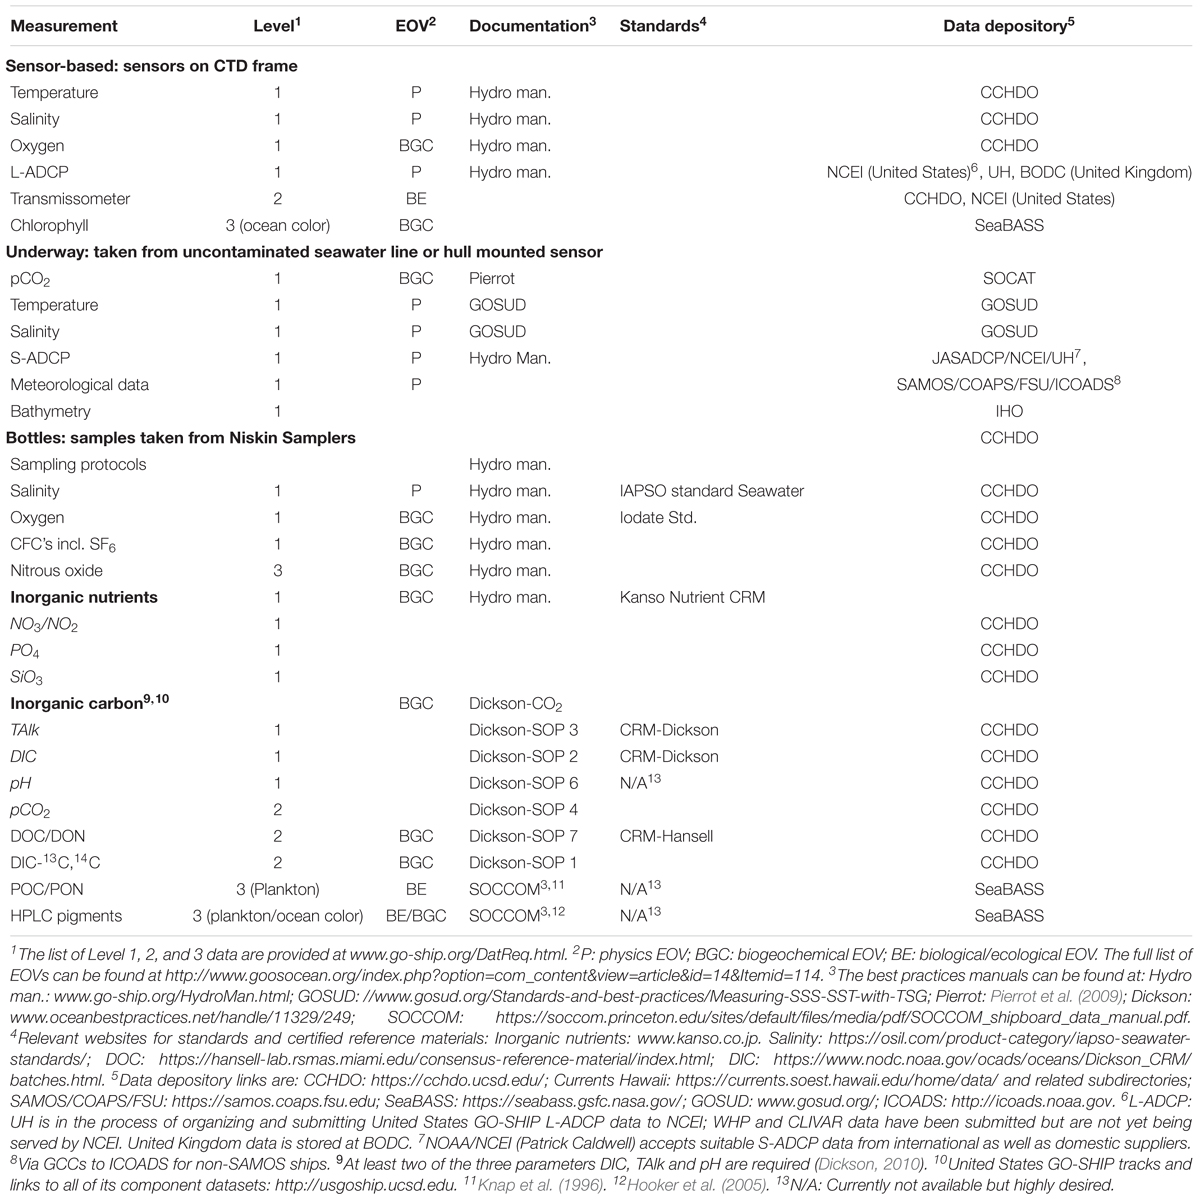
Table 2. Variables measured on Global Ocean Ship-Based Hydrographic Investigations Program (GO-SHIP) cruises1 with location of documentation, calibration, and data storage.
The GO-SHIP cruises are completed by highly qualified and experienced observing teams. The observations meet the highest standards necessary (“climate quality4”), increasingly facilitated by use of certified reference materials (CRMs). The strict GO-SHIP data release policy is grounded on the premise that the data are a shared community resource and should be publicly available as soon as possible. The use of high quality GO-SHIP in situ data continues to grow with the expanding use of autonomous ocean observing platforms, now including those that measure biogeochemical parameters and small physical changes in the deep ocean. GO-SHIP’s high quality global data are essential and irreplaceable for global climatologies that are used for calibration and reference standards for these autonomous sensors, particularly given decadal changes in ocean properties.
Global Ocean Ship-Based Hydrographic Investigations Program comprises sections in three different categories, and measurements in three priority levels. The sections are categorized as follows:
Decadal Full GO-SHIP (Reference or Core Lines)
These are a series of zonal and meridional lines that go coast to coast (or ice edge) and full depth of the ocean (Figure 1) at a target spacing of 30 nautical miles, sometimes less in regions of strong property gradients. Currently the reference network is 55 cruises sampling all major ocean basins. Level 1 data (see below) are collected at least once per decade on these sections.
High Frequency GO-SHIP
A subset of core GO-SHIP lines are occupied at higher frequencies (annual, biennial) typically with limited parameters, but with at least one decadal full GO-SHIP cruise with all Level 1 and many Level 2 and 3 measurements. High frequency cruises must (i) occupy the regular line end-to-end, (ii) cover full depth, and (iii) comply with the data policy.
Associated GO-SHIP
Repeat hydrographic sections that do not necessarily meet the sampling density and are not coast-to-coast/ice, which (i) deliver high quality data, (ii) establish full depth stations below 2000 m at least every 240 nm, (iii) are repeated at least once per decade with sufficient Level 1 parameters to quantify decadal change in inorganic carbon and heat inventories, (iv) at a minimum resolution of 60 nm, and (v) comply with the data policy.
Measurement Levels
Measurements in GO-SHIP are prioritized based on the overall goals of the program. GO-SHIP ranks the measurements as Level 1, 2, or 3. Level 1 “core” measurements are the highest priority for the scientific objectives; Level 2 are desirable and often include measurements of high interest for the particular region; and Level 3 are ancillary measurements. Level 3 measurements may include new instrumentation and experimental techniques that benefit from validation using the core measurements. The parameters for Level 1 and some Level 2 can be found in Table 2 with a full list at http://www.go-ship.org/DatReq.html.
The enduring legacy of GO-SHIP is dependent on ready access of the quality data. These yield the scientific and synthesis products, and discoveries. The value of easy access to a unified dataset for the global ocean, and recognition of the GO-SHIP contribution to these products, is important to sustain the GO-SHIP effort.
Data Procedures and Access
Data Acquisition: Best Practices, Standards, and Data Consistency
The acquisition of GO-SHIP data involves several steps. GO-SHIP data acquisition and laboratory analyses follow best practices, including providing standardized metadata and quality control. The quality-controlled (QC’d) data are submitted to central depositories in a timely fashion where they are checked and made available to the community at large. Coordination and assistance in these steps by the GO-SHIP science committee and JCOMMOPS coordinator are an important part of the program. Once collected and archived, GO-SHIP data form the basis for essential synthesis products and calibration of autonomous observations. The World Ocean Atlas (WOA) is a synthesized product based on the physical, oxygen, and nutrient data. For carbon and other biogeochemical analysis, the Global Ocean Data Analysis Project (GLODAP) is a major bottle data synthesis product involving extensive additional quality control in the form of cross-over adjustments. A tool to facilitate primary QC and coherent submission of bottle data was recently published5. The most recent complete version is GLODAPv2 (Olsen et al., 2016) with an update in 2019, GLODAPv2.2019 (Olsen et al., 2019). Calibrated GO-SHIP CTD data are an important input for autonomous observations such as Argo floats. Climatologies of physical and biogeochemical parameters are produced by several national data centers, incorporating GO-SHIP data.
The process of acquiring quality oceanographic data commences with cruise planning and follows a multi-step process to final product. Full documentation of these steps and easy access to the procedures at sites such as the online International Oceanographic Data and Information Exchange (IODE) best practices depository6 facilitate the process. This documentation is very useful to new participants in the program and when considering the inclusion of new measurements. The “how to” information is regularly reviewed to provide information and incorporate new procedures relevant to the planning and running of GO-SHIP sections.
Measurement techniques for all Level 1 and some Level 2 parameters are described in the GO-SHIP Repeat Hydrography Manual: A Collection of Expert Reports and Guidelines, often referred to as the GO-SHIP hydro manual (Hood et al., 2010). Chapters of the manual and other pertinent best practices related to GO-SHIP can be found at https://www.oceanbestpractices.net/handle/11329/371. As requirements change, parameters are included or deleted as Level 1 measurements. For example, currently the required transient tracer variables are under discussion. The CFCs, which are currently Level 1, are analyzed by only a limited number of laboratories; moreover the atmospheric inputs have changed over time, with CFC-11, and CFC-12 concentrations leveling off in the atmosphere, reducing their usefulness as transient tracers. However, SF6, which is included in CFCs and measured from the same samples, continues to increase in the atmosphere and this variable is becoming more useful in meeting the GO-SHIP science objectives.
At present, GO-SHIP requires the following data-release timelines (Talley et al., 2016)7:
• Preliminary datasets for all Level 1 and Level 2 ship-based measurements released within 5 weeks of the cruise
• Final datasets for all Level 1 and Level 2 ship-based measurements released within 6 months of the cruise
• Final datasets within 24 months for all Level 3 data
The relatively rapid release of data is motivated by their usefulness for climate studies and the observed rapid change in the ocean, which are of increasing societal importance. The GO-SHIP data policy is stringent and geared toward rapid, open dissemination, with a clear structure for all data to undergo quality control, and to be sent to and available from recognized data centers. All data collected as part of the program need to be submitted to a designated data management structure for quality control and dissemination for syntheses. As indicated in the recommendations, this is an ongoing effort.
The GO-SHIP suite of observations includes a significant number of Essential Ocean Variables (EOVs) and some are Essential Climate Variables (ECVs), reflecting their importance, spanning the physical, biogeochemical, and biological/ecosystem ocean (Table 2). These variables are collected by various national laboratories and universities, and rely on the international ocean research community to collaborate to collect and analyze samples following a suggested procedure and accuracy (Hood et al., 2010). Standardized collection and analysis procedures to ensure consistency of observations amongst the nations involved in the program are of utmost importance.
Global Ocean Ship-Based Hydrographic Investigations Program actively supports efforts to improve the standard and consistency amongst the research community involved in collection. In recent years, GO-SHIP has endorsed two Scientific Committee on Oceanic Research (SCOR) working groups: Toward comparability of global oceanic nutrient data (COMPONUT), and Integration of Plankton-Observing Sensor System to existing global sampling programs (P-OBS). These working groups bring together an international group of experts to develop agreed standards and procedures required to review and develop commonly agreed methodologies. GO-SHIP relies on these groups of experts to revise its hydrographic manual and update Best Practices. A significant outcome of the COMPONUT group has been the adoption of certified reference material and inter-laboratory calibration for nutrients that included 69 laboratories from 30 countries (Aoyama et al., 2012; Aoyama, 2018) and an updated chapter of Best Practices for nutrient analyses (Becker et al., 2019)8.
The production and increased use of reference materials and standards are critical for accurate measurements and their use is advocated in Best Practice procedures. Standard seawater has long been used for bottle salinity analyses, but other new reference materials have increased the quality of data. For example, use of reference material for inorganic carbon has led to a two to threefold increase in accuracy of the measurements of DIC and TAlk (Dickson et al., 2003). Reference materials come in different forms including primary standards (such a pure CO2 and compressed gas standards for pCO2 and CFC analyses), standard solutions for titrants (such as KIO3 for Winkler O2 and HCl for Alkalinity), and increasingly well-characterized seawater for the parameter of interest (for dissolved organic matter (DOM), DIC, Total Alkalinity (TAlk), and inorganic nutrients).
Reference materials are produced by manufacturers or by individual investigator’s academic institutions. There can be a significant cost that, in some instances, leads to insufficient use, although costs may be subsidized by national funding agencies. Salinity, DIC, TAlk, DOM and nutrients references are prepared from natural seawater; oxygen standardization is based a calibrated iodate standard. Many of the references are “certified,” that is tied to a primary standard, but nutrient standards are consensus values (Aoyama et al., 2012; Aoyama, 2018). The reference materials are often used as calibrants and values measured are adjusted to the certified reference material values. For example CTD salinity (conductivity) and oxygen sensor values are adjusted to bottle salinity and oxygen measurements on GO-SHIP cruises. Bottle measurements have been declining significantly on high frequency and associate GO-SHIP cruises, and on non-GO-SHIP cruises, which typically have much less chemistry, but which all include CTD profiles. Column 5 of Table 2 indicates the priority variables in need of reference materials.
The research vessels used in GO-SHIP cruises are equipped with a number of (often semi-automatic) instruments. Seawater is pumped into the vessel through an intake, usually 1–8 m below the draft line. Temperature, salinity, and other parameters including dissolved oxygen and pCO2 in this intake water are continuously measured and reported. The intake temperature data have been used in the calibration of satellite SST (e.g., Reynolds, 1988). Sea surface salinities are obtained from thermosalinograph and stored in the GOSUD database. The underway pCO2 data are integral to the global surface ocean carbon data set (SOCAT) (Bakker et al., 2016), particularly in regions with little shipping traffic, that provides information necessary for air-sea carbon exchange and surface water ocean acidification monitoring.
Data Repositories and Accessibility
Global Ocean Ship-Based Hydrographic Investigations Program collects a large suite of measurements across multiple ocean disciplines. Thus there are multiple types of GO-SHIP datasets, including hydrographic, velocity, underway, and meteorological data, and the data therefore flow into different data centers and archives (Table 2). Development of a central data portal tracking and linking all component data sets is essential, including formal agreements on depositories, interoperability, and exchange, that extend beyond the vertical CTD and rosette-sample chemistry profile data for which there is a long-standing GO-SHIP archive. Several nations contributing to GO-SHIP provide concise links to all data types collected during each cruise (e.g., United States GO-SHIP’s cruise data tracker), but there is no parallel international structure.
In addition to providing a centralized link to the component datasets from each GO-SHIP cruise, providing stable locations for submission and retrieval of some of the GO-SHIP data types is essential. Examples are the Level 1 shipboard acoustic Doppler profiler (S-ADCP) and lowered acoustic Doppler profiler (L-ADCP) velocity data, and underway data sets including Level 1 continuous sampling of temperature, salinity and pCO2 as well as Level 2 discrete surface chemistry collected in conjunction with the continuous underway sampling. There is increased recognition of the importance of data storage, and the need of exposure of the data and ease of retrieval in order to sustain and increase use of GO-SHIP data. However, funding for such activities has been lagging. Not having a clear unified strategy and resources to address data issues in global oceanography has hampered oceanographic data dissemination, in general.
That is, there is no dedicated data center or depository for all of the different types of international GO-SHIP data nor is there an international GO-SHIP requirement to submit data to a specific data center or link to a specific portal. However, GO-SHIP has identified and endorsed data centers for each type of GO-SHIP data (e.g., Table 2) and strongly recommends that data be sent to these data centers within the agreed data submission timelines (see section “Data Acquisition: Best Practices, Standards, and Data Consistency”). For several national efforts, the data submission requirements and timelines are mandated.
Full water column hydrographic profiles (CTD and discrete chemistry sampling) comprise the core data set for GO-SHIP. The most commonly used center for these data is the CLIVAR and Carbon Hydrographic Data Office (CCHDO). The mission of CCHDO is to deliver the highest possible quality global CTD and hydrographic data to users. These physical and biogeochemical data include observations carried out during numerous other past and ongoing oceanographic research programs. For GO-SHIP, the CCHDO captures the Level 1 processed CTD data, all Level 1 bottle data, and as much Level 2 and 3 bottle data as possible. The GO-SHIP JCOMMOPS-based project officer and CCHDO have close interactions and exchange information regarding voyage status and data submission. These links need to be strengthened further to ensure that each GO-SHIP cruise data set is available to the community. A challenge is that there is currently no international requirement or structure to ensure that all of the completed data sets are available from a central source. The permanent repository for hydrographic data is at NOAA National Center of Environmental Information (NCEI) and routine connection between NCEI and CCHDO assure that the permanent archive is regularly updated.
CLIVAR and Carbon Hydrographic Data Office data managers work with GO-SHIP principal investigators and GO-SHIP committee members to ensure the open and timely availability of all the high quality repeat hydrography data to the international science community. GO-SHIP and CCHDO have established a strong working relationship. This is highlighted by the recent addition of an interactive map of GO-SHIP sections on the CCHDO website and direct links to data from the GO-SHIP web site. This has greatly enhanced data searching and access. GO-SHIP, JCOMMOPS and CCHDO have undertaken an audit of GO-SHIP Data Availability at CCHDO. This essential cooperative effort will be further enhanced through the JCOMMOPS Ship Coordinator, partly (but currently ad-hocly) funded by (multi) national GO-SHIP funding sources such as AtlantOS, CSIRO, and NOAA. GO-SHIP envisages that communication between the ship coordinator and CCHDO will allow for increased tracking of the international collection of CTD and bottle data and pursuit and submission of data to CCHDO.
While bottle and CTD data are well managed through CCHDO, data management efforts for several other GO-SHIP measurements as less advanced. Level 1 velocity data for GO-SHIP are collected using S-ADCP and L-ADCP instrumentation. The S-ADCP and L-ADCP data acquired during GO-SHIP cruises can now be submitted to the Hawaii Currents group (Table 2). Establishing and maintaining a long-term data archive for all GO-SHIP velocity data, extending back through the CLIVAR and WOCE surveys that preceded it, is highly desirable, and a recommendation is to establish a routine data management system subscribed to by all GO-SHIP operators.
Underway data, predominantly T, S, and pCO2, do not have a single depository but are often included in parameter specific larger data collations. Much of the underway pCO2 data finds its way into SOCAT (Bakker et al., 2016) and some of the underway temperature and salinity are added to the GOSUD which is planned to become the general GO-SHIP archive for such data. In addition, there are efforts in the United States to place all data routinely acquired on research ships in a depository called rolling deck to depository, R2R9.
In addition to submission to centers that accept all specific GO-SHIP measurements, there are specific requirements of national funding agencies for submission to national data centers. The data centers, which are often part of world data centers under auspices of IODE or International Council for Science (ICSU), have mandates to store data in perpetuity. These include, for example, the British Oceanographic Data Centre, which is the United Kingdom facility for preserving and distributing marine data, the German data center PANGAEA, NCEI, which is the United States archive for hydrographic data, and JODC, which is the Japanese archive. These data centers often do not have an efficient way to retrieve data for programs such as GO-SHIP but rather are parameter focused. In the United States there are additional centers that house specific United States GO-SHIP datasets such as the SeaWiFS Bio-optical Archive and Storage System (SeaBASS), which is the publicly shared archive of in situ oceanographic and atmospheric data maintained by the NASA Ocean Biology Processing Group (OBPG), and the Biological and Chemical Oceanography Data Management Office (BCO-DMO) that serve data online from research projects funded by the oceanography programs at the United States National Science Foundation10.
A GO-SHIP Data Assembly Center (DAC) using modern data management and interoperability procedures would facilitate a means to submit and access data in the various repositories. The existing data assembly and archive centers need support to develop new tools and centers to manage the increasing variety of properties observed on hydrographic lines, to coordinate data management activities with programs such as Argo and OceanSITES, and to improve technology and data policies to release data in a timely manner. Linking datasets seamlessly through Global Data assembly centers (GDACs) such as proposed for marine biogeochemistry (GDAC-BGC) at the Bjerknes Climate Data Centre would aid access and discovery. GO-SHIP endorses a central portal and a logical query system where all the data obtained in GO-SHIP can be acquired.
Global Ocean Ship-Based Hydrographic Investigations Program will continue to focus on acquiring the highest quality, documented and referenced data. There is a need for clear documentation of practical information for cruise activities in an updated GO-SHIP manual and easily accessible voyage reports. This includes rosette sampling order of parameters, sample storage protocols, and cleaning and maintenance procedures for sampling bottles (Niskins). A protocol and recommendation for citation of GO-SHIP data should be developed and provided in prominent locations including all portals for GO-SHIP data, such that it is clearly referenced when used in publications or as reference data in calibration/validation of data from other observing systems such as Argo.
Systems for optimized monitoring of GO-SHIP from early cruise planning to the timely submission of data are needed. Emerging scientific products (including best practices, data synthesis and scientific publications) are presently implemented as coordinated efforts between data portals, data centers, and JCOMMOPS; coordination of these across all GO-SHIP contributors presents a major goal for the next decade.
Go-Ship Evolving to Meet Future Ocean Observation Demands
A Platform for Multidisciplinary Ocean Observations
Global Ocean Ship-Based Hydrographic Investigations Program has advanced since the first global cycle during WOCE in the 1990s and is continuing to develop as requirements and technology are evolving. The evolution in large part consists of measurements of a broader range of variables, many of which are EOVs. These include physical, biogeochemical, and biological/ecosystem variables11. Open ocean research vessels are well suited to measure EOVs and there is a focus on including more EOVs in the suite of variables measured on the GO-SHIP reference sections. This has to be balanced by the feasibility of adding measurements along with the current measurement suite, considering factors such as costs, availability of channels on conducting cable, water requirements, number of berths available, station time and endurance.
Additional variables that are measured during a GO-SHIP cruise involve either Level 2 or Level 3 variables, some of which may be EOVs. The GO-SHIP community encourages and supports these additional observations to the extent possible, subject to limitations just mentioned. The GO-SHIP science committee, in consultation with the GO-SHIP community, shifts variables to a higher priority as feasibility and impact justify this. Conversely, some parameters can be relegated to a lower level when the need to observe them decreases, such as Helium/Tritium measurements given the decay of the atomic testing signal and completion of a global survey of the deeper signal. Decisions regarding additional parameters that should/could be measured on GO-SHIP cruises must include defining suitable observing strategies. This includes all aspects of observations, such as making sure that best practices (Pearlman et al., 2019) are developed and followed, that the data reporting is well defined, and that there is a data center able to accept, serve, and provide long term storage of the data and metadata (Tanhua et al., 2019).
Sensing techniques have improved recently and can be used to determine diversity and biomass of zooplankton and phytoplankton, making these observations of biology and ecosystem EOVs on GO-SHIP cruises feasible. Techniques include: bio-optical sensors deployed on the rosette frame or in-line for underway sampling (e.g., measuring bulk absorption, attenuation, scattering and/or fluorescence at wavelengths useful to detect plankton pigments and/or their presence and size distribution); bio-acoustic techniques deployed on the rosette frame or on the hull of the research vessels for continuous operation. Imaging techniques such as the Underwater Video Profiler (UVP, Hydroptics) on the rosette, Imaging Flow Cyto-Bot (IFCB, McLane), and discrete samples for shore based analysis from rosette and/or underway surface samples. Observations include variables constraining bulk properties (e.g., POC, HPLC pigments) as well as species/group specific variables (e.g., genetics, flow-cytometry). Many of these observations (other than genetics and imaging) have long established protocols for operation and analysis. Imaging techniques have the advantage that they can be analyzed in the future through open source hosting. One example is Eco-Taxa, a web application dedicated to the visual exploration and the taxonomic annotation of images (Raes et al., 2018). The SCOR working group 154, P-OBS, is dedicated to the identification of plankton relevant technologies that could be incorporated into GO-SHIP (Boss et al., 2018; Lombard et al., 2019).
Additional areas and variables that are being considered to be elevated to Level 1 or 2 for GO-SHIP include: observations of air-sea fluxes and marine aerosols properties; additional biogeochemical EOVs such as N2O (currently a Level 2 measurement); NCP (e.g., using in-line O2-Ar Mass-spectroscopy), and observations of turbulence (currently a Level 3 measurement). Nitrous oxide (N2O) is routinely measured from bottle samples on United States GO-SHIP by the CFC groups using similar instrumentation and protocols as for CFC analyses.
There is also a need for near real-time data transmission of observations, in particular surface salinity and temperature from underway measurements and profile data from the CTD, for operational services. Currently, CTD profiles are transmitted from the United Kingdom GO-SHIP sections and retrieved by the United Kingdom MET service. The Coriolis data center is used by French and German ships for real-time CTD data transmission http://www.coriolis.eu.org/Data-Products/Submit-data. It is necessary to develop protocols to distinguish this near-real time (NRT) data from the delayed-mode calibrated data used for the detection of decadal scale trends that is the core mission of GO-SHIP and the current procedures in Argo are being scrutinized as an effective example.
Global Ocean Ship-Based Hydrographic Investigations Program cruises are also useful for development and validation of new observing techniques. For example, GO-SHIP voyages have supported the validation of pH sensor measurements in underway systems (Takeshita et al., 2018), and turbulent mixing observations using CTD-chipods (Pickering et al., 2016). Given the range of variables observed on GO-SHIP, and the facilities on research vessels in comparison to autonomous platforms, or ships of opportunity, GO-SHIP cruises can be used to an even larger extent for validation and calibration of new sensors, sampling schemes, and analytical techniques.
Autonomous Ocean Networks and Sensor Development
Global Ocean Ship-Based Hydrographic Investigations Program contributes substantially to autonomous ocean observing networks in several ways. GO-SHIP (Talley et al., 2016) provides a variety of high-quality data required for calibration and validation of sensors on autonomous oceanographic platforms such as floats, gliders, and marine mammal tag CTDs. Importantly, GO-SHIP provides the highest-quality reference standard data of salinity for the core Argo array as well as those of oxygen, pH, nitrate, and other biogeochemical data for emerging BGC Argo profiling float program. Now that Deep Argo (Johnson et al., 2015; Jayne et al., 2017) has begun sampling the full ocean depth, GO-SHIP data are crucial for ensuring the high precision and accuracy needed for deep ocean temperature and salinity analyses. GO-SHIP cruises also provide a platform for assessing the performance of new sensors. These sensors are sometimes added to the underwater package, and occasionally integrated into the CTD data-stream for direct comparisons.
High Quality Reference Data for Sensor Calibration
High quality salinity data are essential in understanding the variability and changes in ocean circulation and hydrological cycle. High quality and deep salinity profiles (reaching slightly below the 2000 dbar limit of standard Argo floats) from shipboard CTDs calibrated with bottle samples referenced to the International Association for the Physical Sciences of the Ocean (IAPSO) Standard Seawater are essential to delayed-mode scientific quality control of Argo float salinity data (Wong et al., 2003).
Conductivity sensors on Argo float CTDs are calibrated at the manufacturer prior to deployment, but a variety of factors can introduce biases into the reported salinities once the floats is deployed. Float CTD conductivity cells are occasionally subject to fouling after calibration but prior to deployment, initially biasing reported salinities fresh of actual salinities. Float CTD conductivity cells can also foul owing to biological activity, and become fresh with time. Float CTD salinity data have also sometimes exhibited a salty drift (e.g., Figure 3), very recently hypothesized to result from the separation of the protective jackets from the exterior of the cells, increasing the conductivity measured.
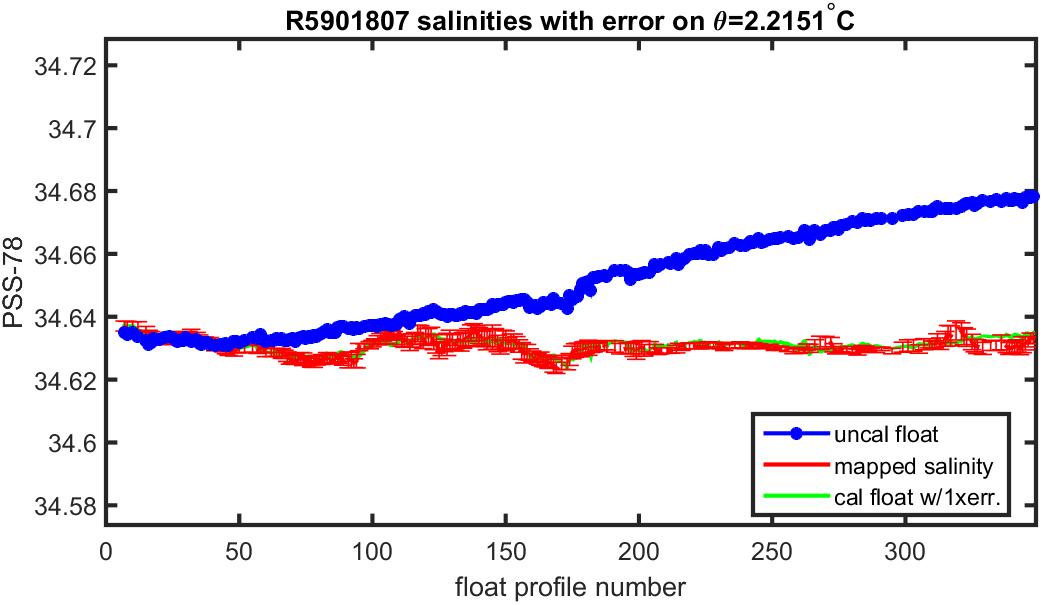
Figure 3. Salinity on a deep potential isotherm plotted vs. profile number for Argo Float WMO ID 5901807 showing the uncalibrated float data (blue line), which drift salty, the climatological values mapped from GO-SHIP and other data (red lines with error bars), which are relatively constant, and the calibrated float data (green line), which has been adjusted to the climatology using a piecewise linear fit following Owens and Wong (2009). Profiles are taken every 10 days.
CTD data that have been calibrated to bottle salinity data referenced to an international standard (IAPSO Standard Seawater) are essential for validating, and calibrating when necessary, Argo CTD salinity data. Profiles deep enough to sample water masses with relatively temporally stable and laterally homogeneous temperature-salinity relations (such as North Pacific and North Indian Deep Water, or Circumpolar Deep Water) are vital. Profiles contemporaneous and co-located with float deployments are also useful. As Deep Argo is coming on line, profiling to 6000 dbar, high accuracy GO-SHIP CTD data are essential to validate the Deep Argo CTD data.
Global Ocean Ship-Based Hydrographic Investigations Program’s decadal global monitoring of all components of the carbonate system is indispensable for being able to relate autonomous measurements from the newly expanding biogeochemical (BGC) Argo to the full carbon system. BGC Argo floats, including oxygen, pH, nitrate, and other sensors, are powerful tools for dramatically better understanding the variability and changes in ocean biogeochemistry including biological production (Johnson et al., 2017a), deoxygenation (Stramma et al., 2008; Sasano et al., 2018), air-sea CO2 fluxes (Gray et al., 2018), and ocean acidification. GO-SHIP plays two important roles in calibrating and validating these sensors. (1) The recently developed calibration methods for BGC Argo sensors (Johnson et al., 2017b) use the accurate and quality controlled Global Ocean Data Analysis Project (GLODAPv2) profile data set (Olsen et al., 2016), which is heavily based on GO-SHIP data. As the relationships between ocean properties evolve, for instance as acidification progresses and nutrient balances change, continued reference standard measurements collected in GO-SHIP, which are incorporated in the temporally evolving GLODAP synthesis, are essential for global implementation of sustained BGC Argo floats (Carter et al., 2017). (2) For validation of these BGC sensor calibrations in the large pilot Southern Ocean BGC float experiment as part of the Southern Ocean Carbon Cycle Observation and Modeling (SOCCOM12) project, shipboard measurements of salinity, oxygen, nitrate, pH, DIC and TAlk coincident with BGC Argo float deployments have been required (Williams et al., 2016). For the BGC-Argo bio-optical sensors, which are used to derive chlorophyll-a and POC, concurrent HPLC and POC shipboard sampling in the near-surface have been collected with all SOCCOM deployments. These are currently not GO-SHIP Level 1 measurements, but they have been critical for validation of the NASA algorithms for converting satellite ocean color to in situ chlorophyll-a and particulate organic carbon (POC) (Haentjens et al., 2017). GO-SHIP cruises, and cruises that are modeled closely on GO-SHIP, are by far the most helpful and highest quality for these validations.
Measurements from marine mammals typically use the Conductivity-Temperature-Depth Satellite Relay Data Logger (CTD-SRDL), developed by the Sea Mammal Research Unit at the University of St Andrews. Marine mammals often sample remote, harsh environments, e.g., the sea-ice edge and the Antarctic continental shelf during winter. However, CTD-SRDL measurements have a random bias in the conductivity cell caused by the marine mammal interfering in the inductive field of the CTD-SRDL (Böhme et al., 2009). Several methods for correcting the individual offsets, which is assumed constant in space and time, have been developed (e.g., Böhme and Send, 2005; Roquet et al., 2011; Frazer et al., 2018). Most of these rely on either little variability in deep ocean measurements from GO-SHIP or delayed mode Argo data (corrected with GO-SHIP data), implicitly placing GO-SHIP as the underlying provider of reference quality data for CTD-SRDL.
Global Ocean Ship-Based Hydrographic Investigations Program provides a platform for assessing new sensors, including BGC sensors, mixing sensors, and biological sensors, inter alia. For instance, to determine their characteristics, oxygen-sensing optodes have been deployed alongside conventional electrode oxygen sensors, allowing both to be compared with bottle oxygen titration data (Sasano et al., 2011). In addition, float CTDs can be strapped onto the shipboard CTD package for in situ evaluation of their sensors relative to reference quality shipboard CTD sensors.
Given the importance of GO-SHIP as the provider of the high quality reference data needed by autonomous platforms and other components of the observing system, it is recommended that GOOS endorses GO-SHIP as the ocean reference data set, and that GO-SHIP data be given a unique identifier in the data system to enable users to identify it separate from other observing platforms or sensors.
Deploying Autonomous Vehicles
Global Ocean Ship-Based Hydrographic Investigations Program deploys many autonomous floats for Argo, Deep Argo, BGC Argo, and drifter programs. Deployment of gliders has started on a small scale. GO-SHIP cruises are desirable for autonomous instrument deployment because of the high-quality calibration data they collect, because they are staffed by experienced scientists and technicians who can provide professional support and who recognize the value of the data collected from those vehicles, and because they reach remote locations where deployment opportunities for floats and gliders are limited. For instance, from 2002 to 2019 (Figure 4), GO-SHIP cruises deployed over 7% of Argo floats, which included 70 of the 132 SOCCOM BGC Argo floats deployed up to 2019.
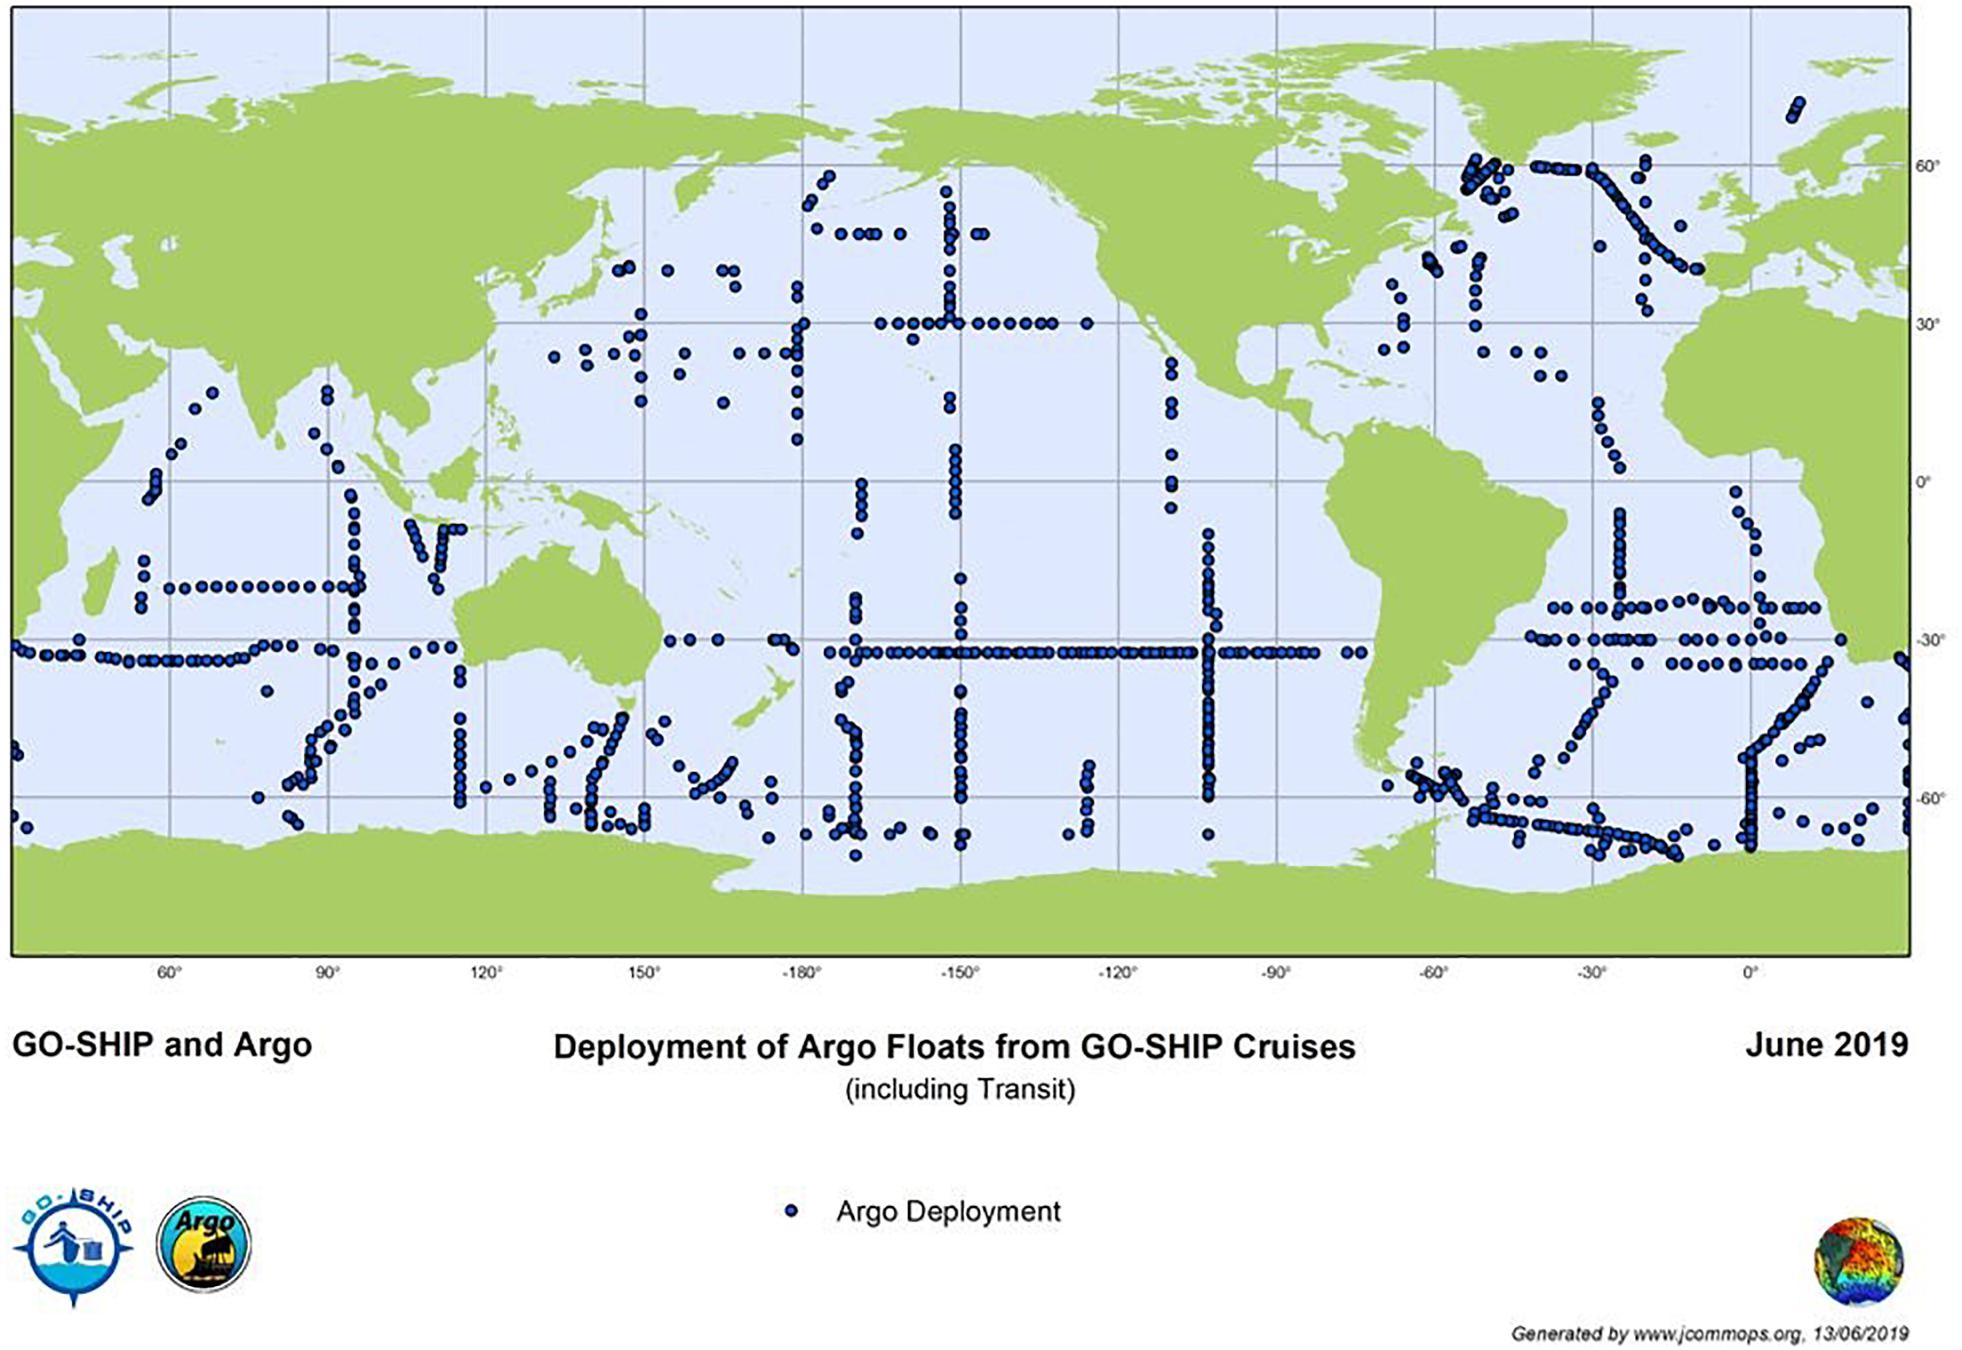
Figure 4. Deployment locations of more than 1100 Argo floats from GO-SHIP cruises from 2002 to 2019 (www.jcommops.org). The 7% deployment rate of Argo floats on GO-SHIP cruises during that time period is likely conservative, as required metadata for such an analysis are not always available Many GO-SHIP deployments are in remote locations outside commercial shipping lanes, making GO-SHIP cruises an important means to cover the global ocean.
Data Synthesis, Reanalysis Products and GO-SHIP Contribution to Improved Climate Understanding
Data syntheses are important products from GO-SHIP data (Figure 5). After the first decade of WOCE, a major synthesis effort resulted in a gridded data product, the Global Hydrographic Climatology (GHC) (Gouretski, 2018)13,14 ; print/online atlases for each of the ocean basins15; and synthesis in a digital atlas, eWOCE16 (Schlitzer, 2000). The latter utilized the widely used Ocean Data View (ODV) software package (Schlitzer, 2018). These products were focused primarily on the physical properties, oxygen, nutrients and transient tracers, although eWOCE incorporated all of the WOCE data, ranging beyond the hydrographic data sets.
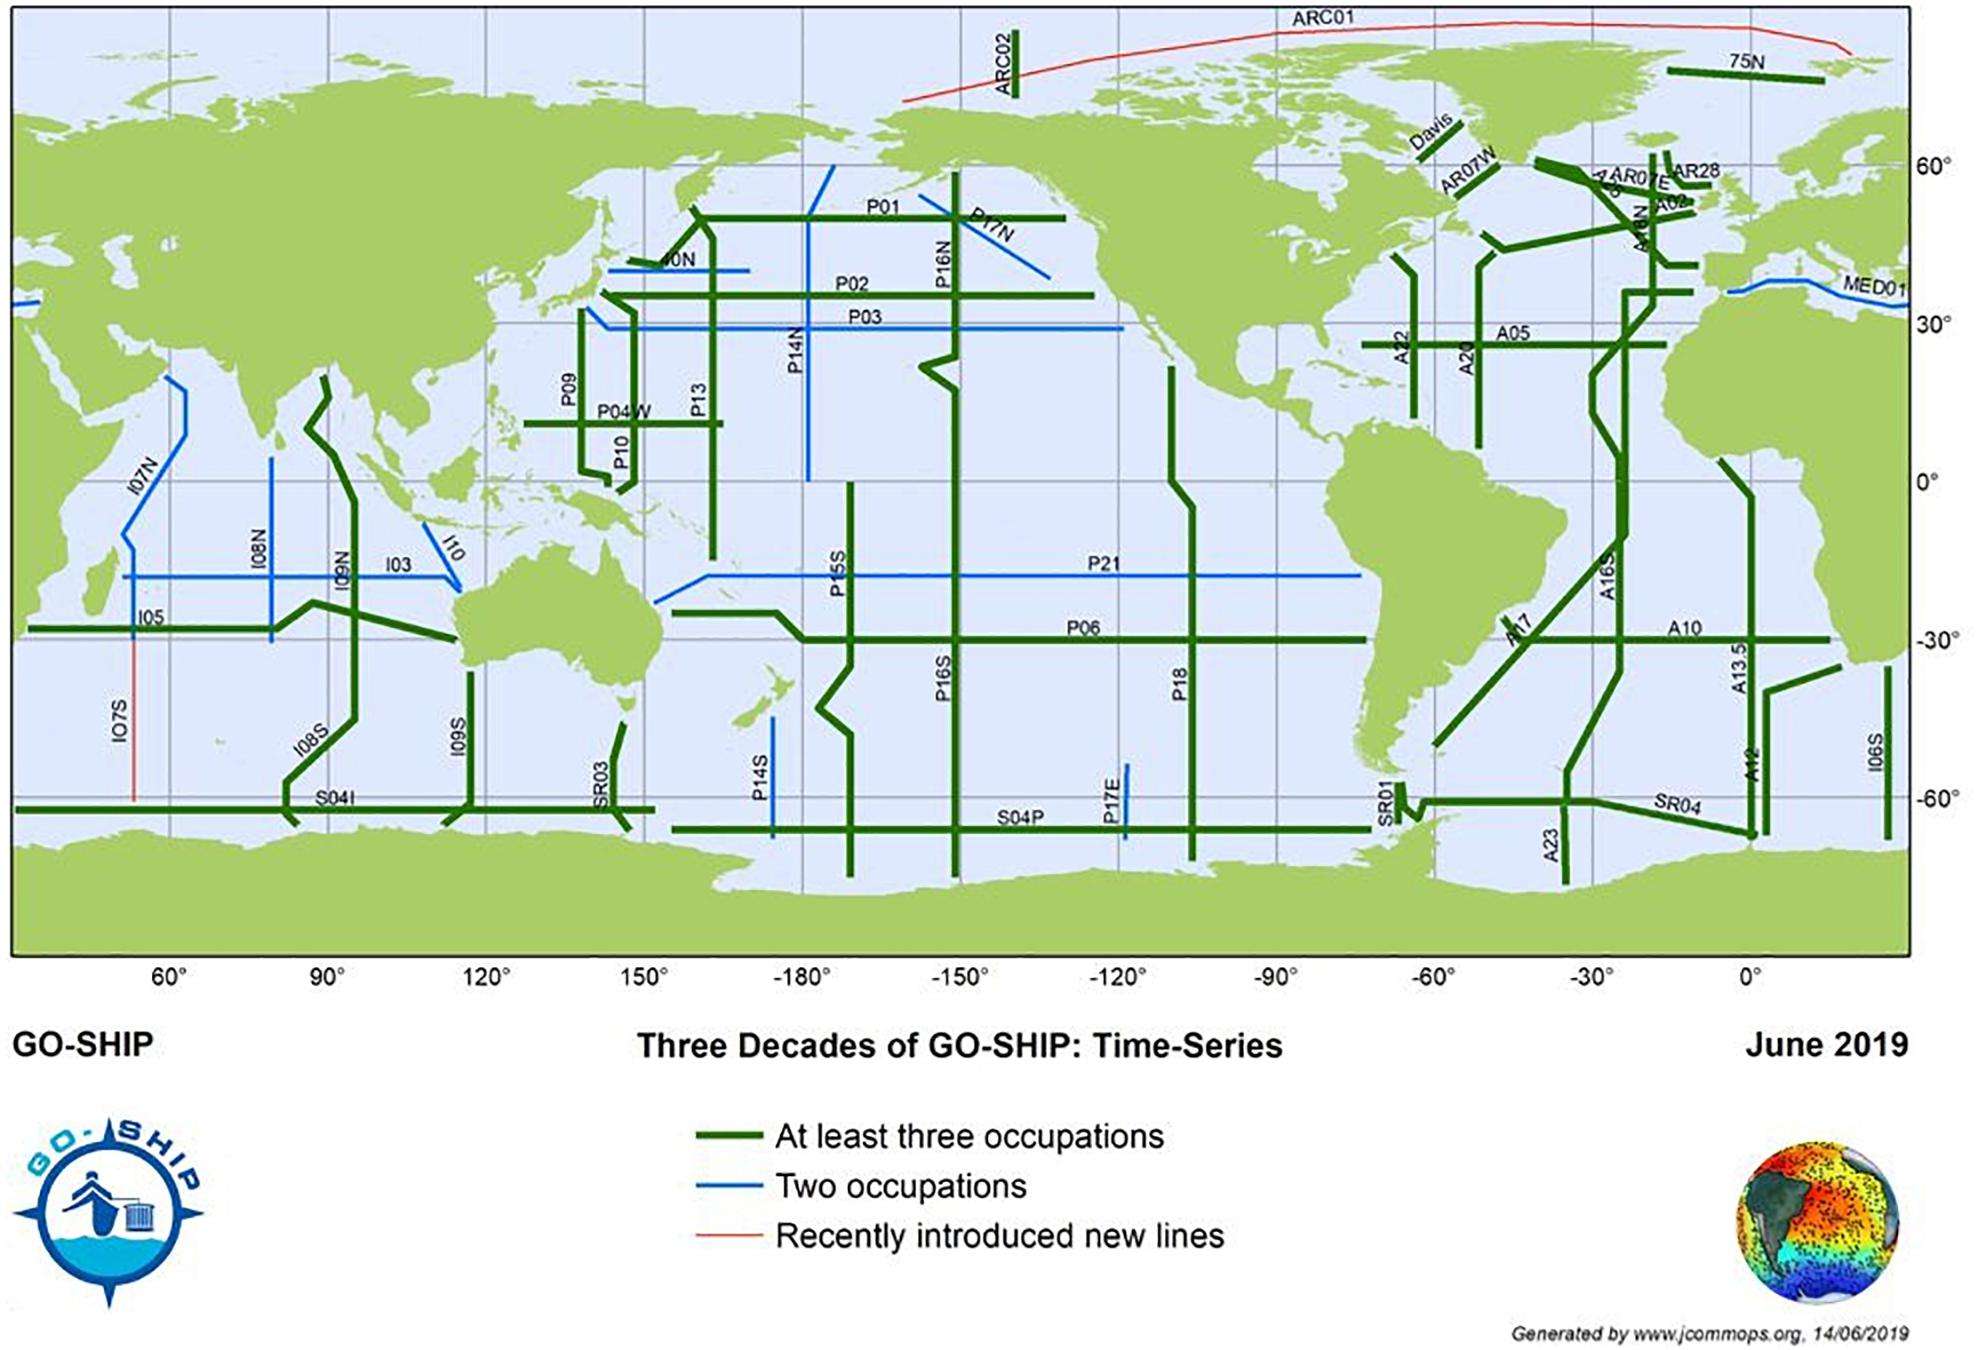
Figure 5. Time-series of GO-SHIP sections, taking into account cruises which have already been confirmed for occupation in the future. Many of the decadal full GO-SHIP sections have now been occupied three or more times. Individual occupations of the sections can be accessed from CCHDO, however, as the number of section repeats increases improved data accessibility of the section time-series should be developed.
Biogeochemical (BGC) data, with emphasis on the inorganic carbon parameters, were synthesized regionally for the Atlantic (CARINA) (Key et al., 2010) and Pacific (PACIFICA) (Suzuki et al., 2013). The overarching global synthesis of BGC data from ≈1980 to 2000 was the GLODAP project (Key et al., 2004)17, involving extensive quality control and cross-over adjustments to yield a globally consistent data set. The recently completed GLODAPv2 2019 represents a major step forward for BGC data synthesis. It includes an iterative inversion process to optimize consistency. GLODAP products include both quality controlled profile data (Key et al., 2015; Olsen et al., 2016, 2019) and a gridded product (Lauvset et al., 2016). GLODAP will be updated bi-annually, using GLODAPv2 as a basis, with a full re-analysis including a new inversion every decade.
The surface water CO2 measurements performed on GO-SHIP lines are incorporated in surface water CO2 collations such as the LDEO surface CO2 climatology (Takahashi et al., 2009) and the Surface Ocean Carbon Atlas (SOCAT)18 (Bakker et al., 2016). The GLODAPv2 and SOCAT efforts are focused on routine releases, documented submission, and QC procedures. These are labor intensive efforts, and increased automation is being implemented to facilitate uniformity and decrease the personnel time involved. GLODAP and SOCAT have working groups that are represented in the International Ocean Carbon Coordination Project (IOCCP) steering committee. A serious impediment for continuation is that they currently depend on project funds from individual countries that are proposal driven and of finite duration. Entrainment of new younger scientists in these efforts is also critical to maintain them.
Global Ocean Ship-Based Hydrographic Investigations Program is developing the protocols and methods to generate a data product that concatenates all occupations of individual sections into a time-series (Figure 5). Initial efforts are focused on CTD (temperature, salinity, and dissolved oxygen) data, with the plan to include GLODAP quality-controlled bottle data in future versions in collaboration with GLODAP.
Global Ocean Ship-Based Hydrographic Investigations Program data held at CCHDO and national data repositories are included in the World Ocean Database (WOD; Boyer et al., 2013). Much of the nutrient, carbon and deep ( > 2000 dbar) physical data in this dataset originates from GO-SHIP cruises. The WOD is used by a large number of research institutions and meteorological and ocean operational centers for many purposes. In addition, the SCOR International quality controlled ocean database (IQuOD) working group aim is to add value to the WOD by providing a consistent quality controlled subset of data, that has comprehensive meta-data information for use by climate and ocean science researchers and operational services.
All gridded ocean climatology products [e.g., World Ocean Atlas (WOA), CSIRO Atlas of Regional Seas (CARS), and Global Hydrographic Climatology (WOCEGHC)] are derived from WOD (and other data sources). Such climatologies represent a significant route by which users access GO-SHIP data. The above products mostly grid temperature and salinity, with some including dissolved oxygen and nutrients.
Global Ocean Ship-Based Hydrographic Investigations Program data, largely via WOD and other databases, contributes to ocean state estimates and reanalysis products (Balmaseda et al., 2015 includes an extensive list of products). GO-SHIP hydrographic data are also used in datasets such as EN4 and Coriolis Ocean dataset for Reanalysis (CORA), which provide higher quality measurements at a global scale for numerical modeling, data assimilation, and scientific studies. Such data assimilation efforts are used for the initialization of the current climate state from which forecasts are run.
Products based on direct velocity measurements using S-ADCP and L-ADCP instrumentation are useful (e.g., Johnson et al., 2002), and more are desired. However, the primary data management challenge at this time for ADCP data is to process and archive all of it, including essential metadata, in a single data system. This includes preservation of the WOCE ADCP datasets. The community, particularly that involved with mixing and turbulence calculations (e.g., Kunze et al., 2006; Huussen et al., 2012; Waterhouse et al., 2014), has a clear need for easy access to these velocity profile data and all repeats (e.g., Kunze, 2017a,b whose analysis relied on hydrographic data alone to achieve global coverage). Synthesis products of mixing-related quantities based on these repeats would be a useful adjunct to hydrographic data syntheses.
Global Ocean Ship-Based Hydrographic Investigations Program must develop data assemblages by section and/or decade to increase the ease of access and use of all of its Level 1 observations. These data assemblages should follow standard data practices and be provided in a number of file formats that meet users’ requirements. Funding of such activities should be a priority of the community. The use of GO-SHIP data in commonly used datasets enhances the use of the data. However, GO-SHIP should develop collaboration with the creators and users of ocean datasets to ensure attribution of the original data source, determine systematic biases in the data, and improve the quality of the observations.
International Coordination
Long-term funding commitments to sustain and enhance ocean observational efforts such as the activities carried out by the GO-SHIP network remain elusive. Current international efforts rely considerably on contributions from a limited number of countries and a small pool of dedicated scientists. Ship time is often secured 1 to 2 years in advance and is not always guaranteed. GO-SHIP activities are often funded by consecutive short-term research projects. Scientists sometimes struggle to cover the cost and must find multiple funding sources.
Multi-Nation Voyages
To maintain the GO-SHIP program and grow the number of participating nations, a modified operational and funding model should be developed to include multi-nation voyages. Active support and long-term investment from government decision makers and funders of multi-nation voyages has the potential to increase the number of participating countries, enhance capacity, accommodate new measurements of biological and ecosystem variables, and increase awareness of outputs in the form of decision support information products. Capacity building through training a new generation of observational oceanographers is also vital to ensure sustainability. Finally, greater coordination with other ocean observing networks could lead to cost sharing and increased impact within a more coordinated global ocean observing framework.
As the number of variables collected by the GO-SHIP community increases, the demand on human and financial resources becomes difficult to sustain. Multinational efforts offer the potential to share and distribute resource allocations to a wider community. This has occurred in the past. For example Australia has benefitted from United States and Japanese support to undertake tracer (CFC/SF6) observations. GO-SHIP lines in the Atlantic enjoyed support from European laboratories for variables almost exclusively measured on GO-SHIP such as transient tracers. This approach also empowers new participant nations to take the lead while receiving support from experienced international collaborators. Of course, there are organizational challenges in this approach, but the benefits of shared cost and expertise will widen the pool of countries willing, and able, to lead GO-SHIP expeditions. The opportunity to extend capabilities, facilitate knowledge exchange, build capacity and future scientific collaboration is huge.
The Irish Example
In 2016, Ireland, led by the Irish Marine Institute and National University of Ireland Galway, committed to complete the 2017 A02 GO-SHIP line on-board the RV Celtic Explorer. While a momentous task, considerable effort to showcase the importance of ocean observing to Irish decision makers and funders proved fruitful. The issue of ensuring the full complement of expertise on-board had to be addressed and the answer lay in an international cooperation. This was a great example of the Galway Statement (signed by United States, Canada and EU May 2013) in action with on-board teams from Canada, Germany, the United Kingdom, and the United States, and additional support from shore teams and experts in Denmark and France. Financial support for partner teams was found through the European Union Horizon 2020 AtlantOS and ATLAS projects, and the Canada Excellence Research Chair in Ocean Science and Technology. The international nature of the 2017 GO-SHIP A02 cruise offered an opportunity for cross-comparison of methods, data quality procedures, and exchange of technical expertise. For example, surface pCO2 was recorded along the track with the teams from Dalhousie University and the Marine Institute comparing different systems. By using independent systems with frequent multiple point calibration, the RV Celtic Explorer’s General Oceanics equilibrator system and Canadian (Dalhousie) team’s SubCTech permeable membrane system, there is added confidence in the data produced.
Building Capacity and Training the Next Generation
Global Ocean Ship-Based Hydrographic Investigations Program transects provide an ideal platform to train the next generation of observational oceanographers across the physical, chemical, biological and ecosystem disciplines. Transfer of knowledge and expertise and participation of students and early career scientists is highly encouraged. As commitment and support of international collaborations gain momentum, more opportunities will open to students from developing countries and to scientists in countries without basin and global-class research vessels.
A prime example is the South African floating university. Currently in South Africa, there is a lack of students proficient in mathematics, and by association physics, engineering, statistics, chemistry and computer science, who wish to major in the marine sciences. The majority of students who graduate from a marine science degree program have weak quantitative backgrounds and consequently, battle with understanding the core mathematical or physical dynamics behind open-ocean and coastal processes. “SEAmester” aims to mitigate this problem by introducing marine science as an applied and cross-disciplinary field to students who have shown an affinity for these core science disciplines. In doing so, a new generation of South African marine and atmospheric scientists with a far higher caliber will be trained. “SEAmester” combines traditional classroom lectures with hands-on ship-based deck activities, while providing students with an opportunity to support scientists specializing in a wide range of marine fields. The South African government’s National Development Plan has identified education, training and innovation as being at the forefront of South Africa’s long-term development, and specifically states: “Inadequate capacity will constrain knowledge production and innovation unless effectively addressed.” The central strategy behind SEAmester is not only of a training program that aligns with South Africa’s core Science and Technology objectives, but more importantly, a program designed to fill a growing gap in the capabilities of our current cohort of marine students. It aims to build critical mass within the marine sciences, so as to ensure sustained growth in this field within South Africa and beyond.
Collaborating and Coordinating With Other Observing Networks
Further efforts to consolidate surveys, for example between GO-SHIP transects and deep water data buoy mooring deployment efforts, could lead to cost sharing. There are several examples of this type of coordination in the Prediction and Research Moored Array in the Tropical Atlantic (PIRATA) program and also in Australia. GO-SHIP is an active and dynamic community and keen to strengthen existing links, build new partnerships, and coordinate more closely with other observing networks particularly those focused on biological and ecosystem variables to monitor ocean health. An example to build on is the partnership with Global Ocean Acidification Observing Network (GOA-ON), whereby GO-SHIP is explicitly identified as providing key data for open ocean observing of physico-chemical aspects of ocean acidification, and the active role of GO-SHIP in development of a marine biological and ecosystem observation methods and implementation (Boss et al., 2018). GO-SHIP is involved in the evolution of new regional scale coordinated observing systems, which will bring together the diverse communities of ocean observing networks. These initiatives include the Atlantic Ocean Blueprint, the Tropical Atlantic Observing system (TAOS) (Foltz et al., 2019), Tropical Pacific Observing System (TPOS) (Smith et al., 2019) and European Ocean Observing System (EOOS) together with existing programs such as the integrated ocean observing system (IOOS) and the integrated marine observing system (IMOS).
GO-SHIP Project Office at JCOMMOPS
The Observations Coordination Group (OCG) of JCOMM, part of the World Meteorological Organization (WMO), and UNESCO’s Intergovernmental Oceanographic Commission (IOC), coordinates sustained ocean observing networks such as GO-SHIP, Argo, Data Buoy Coordination Panel (DBCP), OceanSITES, GLOSS and the Ship Observations Team (SOT) at the international level. The JCOMM in-situ Observations Programme Support Centre (JCOMMOPS), which is hosted by Ifremer in Brest (France), maintains an information system that allows for monitoring and implementation planning within and across these networks. The JCOMMOPS metadata tools help to set up multi-national and multi-institutional GO-SHIP cruises, and monitor the targets of an ocean observing program in terms of space, time, quality and availability of the emerging data. Scientific publications based on GO-SHIP data are captured in the GO-SHIP bibliography maintained by JCOMMOPS. Beyond core GO-SHIP activities, the JCOMMOPS system allows for identifying opportunities for other networks that rely on GO-SHIP reference data (e.g., deployment of floats and drifters), or ship time in vicinity of a cruise (e.g., maintenance of a moored buoy). So far, JCOMMOPS monitoring capacity concerns cruise/platform metadata but it is planned to expand this to the observations made available in real-time and delayed-mode. This would allow JCOMMOPS to track cruise progress in real-time and optimize data flow to users.
Costing GO-SHIP, Determining Value, and Securing Sustainable Funding
Efforts to cost ocean observing networks are at an early stage of development and a standard economic methodology has yet to be determined to assess the true cost of ocean observing efforts. As part of the European Horizon 2020 Optimizing and Enhancing the Integrated Atlantic Ocean Observing Systems project (AtlantOS19) the cost of running the GO-SHIP network in the Atlantic for the period 2012–2023 was estimated at a total of about 100 million Euro. However, the report highlighted that this is a conservative number since many hidden costs exist such as costs of on-land laboratories and equipment required for pre- and post-QC parameter checks on methods. Determining the value of the GO-SHIP network has not been tackled in a quantitative manner due to the lack of economic and socio-economic methods in this area. An important starting point for a clearer definition of the value of GO-SHIP is the definition of value chains describing how the data lead to meeting a variety of end user needs.
Currently, most GO-SHIP cruises are funded through short-term commitments of direct public sector government funding, together with time limited project based research funding. The questions of how to secure sustainable funding for GO-SHIP are echoed by many other ocean observing networks, and by the emerging coordinated observation systems concept. Is a new model of funding based on multi-national voyages and/or increased participation of the private sector the path to sustainability? How can this be achieved? How would such funding models be governed to ensure that scientific independence, quality and open data access is enshrined? Could more coordination and integration of government funding be achieved with commitments that run over periods longer than national political cycles? These are questions to be addressed by GO-SHIP together with the ocean observation community as a whole, policy makers and national funders.
Summary and Recommendations
Global Ocean Ship-Based Hydrographic Investigations Program has successfully provided the necessary data for estimates of decadal trends and changes of large-scale ocean circulation, deep heat uptake and carbon inventories. The contemporaneous collection of a suite of ocean variables has shown the value in simultaneously collecting physical, biogeochemical and biological observations if we wish to fully understand and track the impacts of ocean variability and change within the Earth’s System. In the decades to come, GO-SHIP will continue to build the time-series of full-depth repeat ocean measurements capable of resolving decadal and longer time scale changes in the circulation and property storage (including heat, freshwater, oxygen, and carbon) of the global oceans. GO-SHIP will also continue to provide a means to access remote ocean areas for deployment of autonomous observing platforms, including Argo floats, surface-drifters and gliders. GO-SHIP will continue to evolve based on the findings of the previous work and emerging science requirements and technological developments. Future developments will include additional biogeochemistry and biology measurements to enable GO-SHIP to determine trends and variability in marine biogeochemistry, health, and ecosystems. These measurements will be incorporated into the sustained primary objectives of GO-SHIP. As the number of autonomous platforms increases and new sensors are developed, GO-SHIP will be increasingly relied upon as the high quality ocean reference data set required to ensure the accuracy and consistency of a number of EOVs from the increasing diverse range platform/sensors comprising the ocean observing system. While the last decade has seen the establishment of GO-SHIP as a vital component of the global ocean observing system, there is still much work to do to ensure its sustainability and effectiveness. This paper identifies some key points that GO-SHIP needs to address and progress if it is to meet the needs and expectations of the increasingly diverse user community.
Key recommendations for GO-SHIP in the next decade are:
• GOOS should endorse GO-SHIP Level 1 data as a key “surface to bottom” ocean reference data set. GO-SHIP should continue to be the provider of the high quality ocean reference data needed by autonomous platforms and other components of the observing system. GO-SHIP data should be given a unique identifier in the data system to enable users to track and identify it from other ship-based and observing platforms or sensors, and its use in (gridded) products.
• Global Ocean Ship-Based Hydrographic Investigations Program must develop guidelines to evaluate the request of additional variables to the program in order to facilitate incorporation of new variables in the sampling suite. The documentation should include the feasibility, use and importance of the measurement. The logistical issues such as extra ship time, station time, personnel, ship laboratory space, and expertise will need to be considered, as well data management systems for storage and accessibility. Also, the cost needs to be considered for all cruises, including the availability of resources for all the GO-SHIP participating nations.
• Global Ocean Ship-Based Hydrographic Investigations Program needs to focus on establishing and seeking funds for an internationally agreed and adhered to data procedures and management pathways that is still somewhat ad hoc. There should be a single mandate/requirement for each GO-SHIP data type in terms of timing, posting, and archiving, and a central data portal. A central data portal tracking and linking all component data sets is essential, including formal agreements on depositories, interoperability, and exchange. This will require the inclusion of data management costs both at the national level and contribution to international coordination within national-led funding proposals.
• The protocol and recommendation for citation of GO-SHIP data20 should be provided in prominent locations including all portals for GO-SHIP data, such that it is clearly referenced when used in publications or as reference data in calibration/validation of data from other observing systems such as Argo.
• Global Ocean Ship-Based Hydrographic Investigations Program must develop data assemblages (by section or decade) to increase the accessibility of the data to the wider community and use of all of its Level 1 observations. These data assemblages should follow standard data practices and be provided in a number of file formats that meet the users requirements.
• A modified operational and funding model should be developed to include multi-national voyages. Programs such as AtlantOS and intergovernmental agreements such as the Galway Statement have been successfully employed by GO-SHIP to increase national participation and share resources. GO-SHIP should work with national funding agencies to formalize these arrangements to increase national participation, capacity building and training of the next generation of skilled sea-going scientists and technicians.
• New models of funding based on multi-nation voyages and/or increased participation of the private sector need to be actively investigated as a means to sustainability. The questions of how to secure sustainable funding for GO-SHIP are echoed by many other ocean observing networks. This needs to be addressed by GO-SHIP together with the ocean observation community as a whole, policy makers and national funders to guarantee the existing ocean observing systems and provide investment to expand the ocean observing systems where required.
Author Contributions
BS, RW, and MK led the writing and overall content of the manuscript. GJ, LT, TT, CC, EO’R, EMcG, EB, and KK led sections of the manuscript. All other authors contributed to different sections, to manuscript revision, read, and approved the submitted version.
Funding
BS was supported by the Australian Government Department of the Environment and CSIRO through the National Environmental Science Program and CSIROs Decadal Climate Forecasting Project. RW and GJ were supported by the NOAA office of Oceanic and Atmospheric Research, including the Ocean Observations and Monitoring Division (OOMD), funding reference #100007298. PMEL Contribution Number 4864. LT was supported by the United States NSF Ocean Sciences OCE_1437015. TT and CC were supported by the EU Horizon 2020 grant agreement 633211, AtlantOS. ElM was supported by the United Kingdom NERC National Capability ORCHESTRA (NE/N018095/1) and CLASS (NE/R015953/1) projects. EO’R, EMcG, and CC were supported under the Marine Research Programme of the Irish Government.
Conflict of Interest Statement
The authors declare that the research was conducted in the absence of any commercial or financial relationships that could be construed as a potential conflict of interest.
Footnotes
- ^Significant ocean science programs and research activities are listed in Table 1. GO-SHIP data centers are identified in Table 2.
- ^http://www.go-ship.org
- ^https://www.undp.org/content/undp/en/home/sustainable-development-goals.html
- ^Climate quality is defined as measurements of quality sufficient to assess long term trends with a defined level of confidence.
- ^https://github.com/ocean-data-qc/ocean-data-qc Final datasets for all Level 1 and Level 2 measurements performed at a shore-based laboratory within 6 months of the shore based analysis (except for helium/tritium where the goal is 15-months after sample collection). Shore-side analyses in practice often do not meet these targets.
- ^https://www.oceanbestpractices.net/handle/11329/3
- ^http://www.go-ship.org/DatReq.html
- ^http://www.ioccp.org/index.php/nutrients
- ^http://www.rvdata.us/
- ^www.bco-dmo.org/
- ^http://goosocean.org/eov
- ^https://soccom.princeton.edu/
- ^https://icdc.cen.uni-hamburg.de/daten/ocean/woce-climatology.html
- ^http://icdc.cen.uni-hamburg.de/1/daten/ocean/waghc/
- ^http://woceatlas.ucsd.edu
- ^http://www.ewoce.org/
- ^www.glodap.info
- ^www.socat.info
- ^www.atlantos-h2020.eu
- ^http://www.go-ship.org/About.html
References
Aoyama, M., Ota, H., Kimura, M., Kitao, T., Mitsuda, H., Murata, A., et al. (2012). Current status of homogeneity and stability of the reference materials for nutrients in seawater. Anal. Sci. 28, 1–6.
Aoyama, M. (2018). IOCCP-JAMSTEC 2018 Inter-Laboratory Calibration Exercise of a Certified Reference Material for Nutrients in Seawater. IOCCP report number 1/2018. Yokosuka: Japan Agency for Marine-Earth Science and Technology.
Bakker, D. C. E., Pfeil, B., Landa, C. S., Metzl, N., O’Brien, K. M., Olsen, A., et al. (2016). A multi-decade record of high-quality fCO2 data in version 3 of the Surface Ocean CO2 Atlas (SOCAT). Earth Syst. Sci. Data 8, 383–413, doi: 10.5194/essd-8-383-2016
Balmaseda, M. A., Hernandez, F., Storto, A., Palmer, M. D., Alves, O., et al. (2015). The ocean reanalyses intercomparison project (ORA-IP), J. Operat. Oceanogr. 8, s80–s97, doi: 10.1080/1755876X.2015.1022329
Becker, S., Aoyama, M., Woodward, E. M. S., Bakker, K., Coverly, S., Mahaffey, C., et al. (2019). GO-SHIP Repeat Hydrography Nutrient Manual, 2019: The Precise And Accurate Determination Of Dissolved Inorganic Nutrients In Seawater; Continuous Flow Analysis Methods And Laboratory Practices. Available at: http://www.ioccp.org/images/06Nutrients/GO-SHIPRepeatHydrographyNutrientManual_October2018_Final-Draft.pdf (accessed July 10, 2019).
Böhme, L., Lovell, P., Biuw, M., Roquet, F., Nicholson, J., Thorpe, S. E., et al. (2009). Technical note: animal-borne CTD-satellite relay data loggers for real-time oceanographic data collection. Ocean Sci. 5, 685–695. doi: 10.5194/os-5-685-2009
Böhme, L., and Send, U. (2005). Objective analyses of hydrographic data for referencing profiling float salinities in highly variable environments. Deep Sea Res. II 52, 651–664. doi: 10.1016/j.dsr2.2004.12.014
Boss, E., Waite, A., Muller-Karger, F., Yamazaki, H., Wanninkhof, R., Uitz, J., et al. (2018). Beyond chlorophyll fluorescence: the time in right to expand biological measurements in ocean observing programs. Limnol. Oceanogr. Bull. 27, 89–90 doi: 10.1002/lob.10243
Boyer, T. P., Antonov, J. I., Baranova, O. K., Coleman, C., Garcia, H. E., Grodsky, A., Johnson, D. R., et al. (2013). World Ocean Database 2013, eds S. Levitus, A. Mishonov (Silver Spring, MD: NOAA).
Brown, P. J., Bakker, D. C. E., Schuster, U., and Watson, A. J. (2010). Anthropogenic carbon accumulation in the subtropical North Atlantic. J. Geophys. Res. 115:C04016
Byrne, R. H., Mecking, S., Feely, R. A., and Liu, X. (2010). Direct observations of basin-wide acidification of the North Pacific. Geophys. Res. Lett. 37:L02601.
Carter, B. R., Feely, R. A., Williams, N. L., Dickson, A. G., Fong, M. B., and Takeshita, Y. (2017). Updated methods for globally locally-interpolated estimation of alkalinity, pH, and nitrate. Limnol. Oceanogr. Methods 16, 119–131. doi: 10.1002/lom3.10232
Carter, B. R., Feely, R. A., Wanninkhof, R., Kouketsu, S., Sonnerup, R. E., Pardo, P. C., et al. (2019). Pacific anthropogenic carbon between 1991 and 2017. Glob. Biogeochem. Cycles 33, 597–617, doi: 10.1029/2018GB006154
Carton, J. A., Cunningham, S. A., Frajka-Williams, E., Kwon, Y-O., Marshall, D. P., and Msadek, R. (2014). The Atlantic overturning circulation: more evidence of variability and links to climate. Bull. Am. Meteor. Soc. 95, ES163–ES166.
Carton, J. A., and Hakkinen, S. (2011). Introduction to: atlantic meridional overturning circulation (AMOC). Deep Sea Res. II 58, 1741–1743.
CLIVAR (2018). Climate and Ocean – Variability,Predictability and Change Science Plan and Implementation Strategy. Geneva: WCRP.
de la Paz, M., García-Ibáñez, M. I., Steinfeldt, R., Ríos, A. F., and Pérez, F. F. (2017). Ventilation versus biology: what is the controlling mechanism of nitrous oxide distribution in the North Atlantic. Glob. Biogeochem. Cycles 31, 1–16.
Desbruyères, D. G., Purkey, S. G., McDonagh, E. L., Johnson, G. C., and King, B. A. (2016). Deep and abyssal ocean warming from 35 years of repeat hydrography. Geophys. Res. Lett. 43, 356–365. doi: 10.1002/2016GL070413
Deutsch, C., Emerson, S., and Thompson, L. (2005). Fingerprints of climate change in North Pacific oxygen. Geophys. Res. Lett. 32:L16604
Dickson, A. G., Afgan, J. D., and Anderson, G. C. (2003). Reference materials for oceanic CO2 analysis: a method for certification of total alkalinity. Mar. Chem. 80, 185–197. doi: 10.1016/s0304-4203(02)00133-0
Dickson, A. G. (2010). Standards for ocean measurements. Oceanography 23, 34–47. doi: 10.5670/oceanog.2010.22
Doney, S. C. (2010). The growing human footprint on coastal and open-ocean biogeochemistry. Science 328, 1512–1516. doi: 10.1126/science.1185198
Doney, S. C., Fabry, V. J., Feely, R. A., and Kleypas, J. A. (2009). Ocean Acidification: the other CO2 Problem. Ann. Rev. Mar. Sci. 1, 169–192. doi: 10.1146/annurev.marine.010908.163834
Emerson, S., Mecking, S., and Abell, J. (2001). The biological pump in the subtropical North Pacific Ocean: nutrient sources, redfield ratios, and recent changes. Glob. Biogeochem. Cycles 15, 535–554. doi: 10.1029/2000gb001320
Feely, R. A., Doney, S. C., and Cooley, S. R. (2009). Ocean acidification: present conditions and future changes in a high-CO2 world. Oceanography 22, 36–47. doi: 10.1098/rstb.2012.0442
Feely, R. A., Sabine, C. L., Lee, K., Berelson, W., Kleypas, J., Fabry, V. J., Millero, F. J. (2004). Impact of anthropogenic CO2 on the CaCO3 system in the oceans. Science 305, 362–366. doi: 10.1126/science.1097329
Foltz, G., Brandt, P., Richter, I., Rodríguez-Fonseca, B., Hernandez, F., Dengler, M., et al. (2019). Tropical atlantic observing system. Front. Mar. Sci. 6:206. doi: 10.3389/fmars.2019.00206
Frazer, E. K., Langhorne, P. J., Williams, M. J. M., Goetz, K. T., and Costa, D. P. (2018). A method for correcting seal-borne oceanographic data and application to the estimation of regional sea ice thickness. J. Mar. Syst. 187, 250–259. doi: 10.1016/j.jmarsys.2018.08.002
Friis, K., Körtzinger, A., Pätsch, J., and Wallace, D. W. R. (2005). On the temporal increase of anthropogenic CO2 in the subpolar North Atlantic. Deep Sea Res. I 52, 681–698 doi: 10.1016/j.dsr.2004.11.017
Frölicher, T. L., Joos, F., Plattner, G. K., Steinacher, M., and Doney, S. C. (2009). Natural variability and anthropogenic trends in oceanic oxygen in a coupled carbon cycle-climate model ensemble. Glob. Biogeochem. Cycles 23:GB1003.
Ganachaud, A., and Wunsch, C. (2000). Improved estimates of global ocean circulation, heat transport and mixing from hydrographic data. Nature 408, 453–456.
García-Ibáñez, M. I., Zunino, P., Fröb, F., Carracedo, L. I., Ríos, A. F., Mercier, H., et al. (2016). Ocean acidification in the subpolar North Atlantic: rates and mechanisms controlling pH changes. Biogeosciences 13, 3701–3715, doi: 10.5194/bg-13-3701-2016
Gouretski, V. (2018). World ocean circulation experiment – argo global hydrographic climatology. Ocean Sci. 14, 1127–1146, doi: 10.5194/os-14-1127-2018
Gray, A. R., Johnson, K. S., Bushinsky, S. M., Riser, S. C., Russell, J. L., Talley, L. D., et al. (2018). Autonomous biogeochemical floats detect significant carbon dioxide outgassing in the high-latitude Southern Ocean. Geophys. Res. Let. 45, 9049–9057. doi: 10.1029/2018GL078013
Groeskamp, S., Lenton, A., Matear, R., Sloyan, B. M., and Langlais, C. (2016). Anthropogenic carbon surface to interior connections. Global Biogeochem. Cycles 30, 1682–1698. doi: 10.1002/2016gb005476
Gruber, N., Sarmiento, J. L., and Stocker, T. F. (1996). An improved method for detecting anthropogenic CO2 in the oceans. Global Biogeochem. Cycles 10, 809–837. doi: 10.1029/96gb01608
Gruber, N., Clement, D., Carter, B. R., Feely, R. A., van Heuven, S., Hoppema, M., et al. (2019). The oceanic sink for anthropogenic CO2 rom 1994 to 2007. Science 363, 1193–1199. doi: 10.1126/science.aau5153
Guallart, E. F., Schuster, U., Fajar, N. M., Legge, O., Brown, P., Pelejero, C., et al. (2015). Trends in anthropogenic CO2 in water masses of the Subtropical North Atlantic Ocean. Prog. Oceanogr. 131, 21–32. doi: 10.1016/j.pocean.2014.11.006
Haentjens, N., Boss, E., and Talley, L. D. (2017). Revisiting ocean color algorithms for chlorophyll a and particulate organic carbon in the southern ocean using biogeochemical floats. J. Geophys. Res. Oceans 122, 6583–6593.
Hahn, J., Brandt, P., Schmidtko, S., and Krahmann, G. (2017). Decadal oxygen change in the eastern tropical North Atlantic. Ocean Sci. 13, 551–576 doi: 10.5194/os-13-551-2017
Hernandez-Guerra, A., and Talley, L. D. (2016). Meridional overturning transports at 30°S in the Indian and Pacific Oceans in 2002-2003 and 2009. Prog. Oceanogr. 146, 89–120. doi: 10.1016/j.pocean.2016.06.005
Hood, E. M., Sabine, C. L., and Sloyan, B. M. (Eds.) (2010). The GO-SHIP Repeat Hydrography Manual: A Collection of Expert Reports and Guidelines. IOCCP Report Number 14. Paris: SCOR.
Hooker, S. B., Van Heukelem, L., Thomas, C. S., Claustre, H., Ras, J., Schluter, L., et al. (2005). The Second SeaWiFS HPLC Analysis Round-Robin Experiment (SeaHARRE-2). Washington, DC: NASA Tech.
Huussen, T. N., Naveira Garabato, A. C., Bryden, H. L., and McDonagh, E. L. (2012). Is the deep Indian Ocean MOC sustained by breaking internal waves? J. Geophys. Res. Oceans 117:C080
Jayne, S. R., Roemmich, D., Zilberman, N., Riser, S. C., Johnson, K. S., Johnson, G. C., et al. (2017). The argo program present and future. Oceanography 30, 18–28. doi: 10.5670/oceanog.2017.213
Jenkins, W. J. (1977). Tritium-helium dating in the Sargasso Sea: a measurement of oxygen utilization rates. Science 196, 291–292 doi: 10.1126/science.196.4287.291
Jenkins, W. J. (1998). Studying thermocline ventilation and circulation using tritium and 3He. J. Geophys. Res. 103, 15817–15831 doi: 10.1029/98jc00141
Jiang, L.-Q., Feely, R. A., Carter, B. R., Greeley, D. J., Gledhill, D. K., and Arzayus, K. M. (2015). Climatological distribution of aragonite saturation state in the global oceans. Glob. Biogeochem. Cycles 29, 1656–1673 doi: 10.1002/2015gb005198
Johnson, G. C., and Gruber, N. (2007). Decadal water mass variations along 20°W in the northeastern Atlantic Ocean. Prog. Oceanogr. 73, 277–295, doi: 10.1016/j.pocean.2006.03.022
Johnson, G. C., McTaggart, K. E., and Wanninkhof, R. (2014). Antarctic bottom water temperature changes in the western South Atlantic from 1989 to 2014. J. Geophys. Res. 119, 8567–8577. doi: 10.1002/2014jc010367
Johnson, G. C., Sloyan, B. M., Kessler, W. S., and McTaggart, K. E. (2002). Direct measurements of upper ocean currents and water properties across the tropical Pacific Ocean during the 1990’s. Prog. Oceanogr. 52, 31–61, doi: 10.1016/S0079-6611(02)00021-6
Johnson, G. C., Lyman, J. M., and Purkey, S. G. (2015). Informing deep argo array design using argo and full- depth hydrographic section data. J. Atmos. Ocean. Technol. 32, 2187–2198. doi: 10.1175/jtech-d-15-0139.1
Johnson, K. S., Plant, J. N., Coletti, L. J., Jannasch, H. W., Sakamoto, C. M., Riser, S. C., et al. (2017a). Biogeochemical sensor performance in the SOCCOM profiling float array. J. Geophys. Res. 122, 6416–6436. doi: 10.1002/2017jc012838
Johnson, K. S., Plant, J. N., Dunne, J. P., Talley, L. D., and Sarmiento, J. L. (2017b). Annual nitrate drawdown observed by SOCCOM profiling floats and the relationship to annual net community production. J. Geophys. Res. 122, 6668–6683, doi: 10.1002/2017JC012839
Johnson, G. C., Purkey, S. G., and Toole, J. M. (2008). Reduced antarctic meridional overturning circulation reaches the North Atlantic Ocean. Geophys. Res. Lett. 35:L22601.
Katsumata, K., Sloyan, B. M., and Masuda, S. (2013). Diapycnal and isopycnal transports in the southern ocean estimated by a box inverse model. J. Phys. Oceanogr. 43, 2270–2287, doi: 10.1175/JPO-D-12-0210.1
Keeling, R. F., Körtzinger, A., and Gruber, N. (2010). Ocean deoxygenation in a warming world. Ann. Rev. Mar. Sci. 2, 199–229. doi: 10.1146/annurev.marine.010908.163855
Key, R. M., Kozyr, A., Sabine, C. L., Lee, K., Wanninkhof, R., Bullister, J., et al. (2004). A global ocean carbon climatology: results from global data analysis project (GLODAP). Glob. Biogeochem. Cycles 19:GB4031
Key, R. M., Tanhua, T., Olsen, A., Hoppema, M., Jutterström, S., Schirnick, C., et al. (2010). The CARINA data synthesis project: introduction and overview. Earth Syst. Sci. Data 2, 105–121. doi: 10.5194/essd-2-105-2010
Key, R. M., Olsen, A., van Heuven, S., Lauvset, S. K., Velo, A., Lin, X., et al. (2015). Global Ocean Data Analysis Project, Version 2 (GLODAPv2). Oak Ridge, TN: US Department of Energy.
Khatiwala, S., Tanhua, T., Mikaloff Fletcher, S., Gerber, M., Doney, S. C., Graven, H. D., et al. (2013). Global ocean storage of anthropogenic carbon. Biogeosciences 10, 2169–2191.
Kim, I. N., Lee, K., Gruber, N., Karl, D. M., Bullister, J. L., Yang, S., et al. (2014). Increasing anthropogenic nitrogen in the North Pacific Ocean. Science 346, 1102–1106. doi: 10.1126/science.1258396
Knap, A., Michaels, A., Close, A., Ducklow, H., and Dickson, A. (eds). (1996). Protocols for the Joint Global Ocean Flux Study (JGOFS) Core Measurements. Report Nr. 19, Paris: UNESCO.
Ko, Y. H., Lee, K., Takahashi, T., Karl, D. M., Kang, S-H., and Lee, E. (2018). Carbon-based estimate of nitrogen fixation-derived net community production in N-depleted ocean gyres. Glob. Biogeochem. Cycles 32, 1241–1252.
Körtzinger, A., Rhein, M., and Mintrop, L. (1999). Anthropogenic CO2 and CFCs in the North Atlantic Ocean—a comparison of man-made tracers. Geophys. Res. Lett. 26, 2065–2068. doi: 10.1029/1999gl900432
Kouketsu, S., Doi, T., Kawano, T., Masuda, S., Sugiura, N., et al. (2011). Deep ocean heat content changes estimated from observation and reanalysis product and their influence on sea level change. J. Geophys. Res. 116:C03012.
Kouketsu, S., and Murata, A. M. (2014). Detecting decadal scale increases in anthropogenic CO2 in the ocean. Geophys. Res. Lett. 41, 4594–4600. doi: 10.1002/2014gl060516
Kunze, E. (2017a). Internal-wave-driven mixing: global geography and budgets. J. Phys. Oceanogr. 47, 1325–1345. doi: 10.1175/JPO-D-16-0141.1
Kunze, E. (2017b). The internal-wave-driven meridional overturning circulation. J. Phys. Oceanogr. 47, 2673–2689, doi: 10.1175/JPO-D-16-0142.1
Kunze, E., Firing, E., Hummon, J. M., Chereskin, T. K., and Thurnherr, A. M. (2006). Global abyssal mixing inferred from lowered ADCP shear and CTD strain profiles. J. Phys. Oceanogr. 36, 1553–1576, doi: 10.1175/JPO2926.1
Lauvset, S. K., Key, R. M., Olsen, A., van Heuven, S., Velo, A., Lin, X., et al. (2016). A new global interior ocean mapped climatology: the 1°x1° GLODAP version 2. Earth Syst. Sci. Data 8, 325–340. doi: 10.5194/essd-8-325-2016
Le Quéré, C., Andrew, R. M., Friedlingstein, P., Sitch, S., Pongratz, J., Manning, A. C., et al. (2018). Global carbon budget 2017. Earth Syst. Sci. Data 10, 405–448.
Lombard, F., Boss, E., Waite, A. M., Vogt, M., Uitz, J., Stemmann, L., et al. (2019). Globally consistent quantitative observations of planktonic ecosystems. Front. Mar. Sci. 6:196. doi: 10.3389/fmars.2019.00196
Lumpkin, R., and Speer, K. (2007). Global ocean meridional overturning. J. Phys. Oceanogr. 37, 2550–2562. doi: 10.1175/jpo3130.1
Matear, R. J., and Hirst, A. C. (2003). Long-term changes in dissolved oxygen concentrations in the ocean caused by protracted global warming. Glob. Biogeochem. Cycles 17:1125.
McDonagh, E. L., Bryden, H. L., King, B. A., and Sanders, R. J. (2008). The circulation of the Indian Ocean at 32°S. Prog. Oceanogr. 79, 20–36.
Mecking, S., Warner, M. J., and Bullister, J. L. (2006). Temporal changes in pCFC-12 ages and AOU along two hydrographic sections in the eastern subtropical North Pacific. Deep Sea Res. I 53, 169–187. doi: 10.1016/j.dsr.2005.06.018
Menezes, V. V., Macdonald, A. M., and Schatzman, C. (2017). Accelerated freshening of antarctic bottom water over the last decade in the Southern Indian Ocean. Sci. Adv. 3:e1601426. doi: 10.1126/sciadv.1601426
Mercier, H., Lherminier, P., Sarafanov, A., Gaillard, F., Daniault, N., Desbruyères, D., et al. (2015). Variability of the meridional overturning circulation at the greenland-portugal ovide section from 1993 to 2010. Prog. Oceanogr. 132, 250–261. doi: 10.1016/j.pocean.2013.11.001
Murata, A., Kumamoto, Y., Sasaki, K., Watanabe, S., and Fukasawa, M. (2010). Decadal increases in anthropogenic CO2 along 20°S in the South Indian Ocean. J. Geophys. Res. 115:C12055.
Olsen, A., Key, R. M., van Heuven, S., Lauvset, S. K., Velo, A., Lin, X., et al. (2016). The global ocean data analysis project version 2 (GLODAPv2) – an internally consistent data product for the world ocean. Earth Syst. Sci. Data 8, 297–323. doi: 10.5194/essd-8-297-2016
Olsen, A., Lange, N., Key, R. M., Tanhua, T., Álvarez, M., Becker, S., et al. (2019). GLODAPv2.2019 – an update of GLODAPv2. Earth Syst. Sci. Data Discuss. 2019, 1–39. doi: 10.5194/essd-2019-66
Owens, W. B., and Wong, A. P. S. (2009). An improved calibration method for the drift of the conductivity sensor on autonomous CTD profiling floats by θ–S climatology. Deep Sea Res. I 56, 450–457. doi: 10.1016/j.dsr.2008.09.008
Palmer, M. D., Durack, P., Paz Chidichimo, M., Church, J., Cravatte, S. E., Hill, K. L., et al. (2019). Adequacy of the ocean observation system for quantifying regional heat and freshwater storage and change. Front. Mar. Sci. [in press]. doi: 10.3389/fmars.2019.00416
Pardo, P. C., Pérez, F. F., Khatiwala, S., and Ríos, A. F. (2014). Anthropogenic CO2 estimates in the Southern Ocean: storage partitioning in the different water masses. Prog. Oceanogr. 120, 230–242. doi: 10.1016/j.pocean.2013.09.005
Pearlman, J., Bushnell, M., Coppola, L., Karstensen, J., Buttigieg, P. L., Paerlman, F., et al. (2019). Evolving and sustaining ocean best practices and standards for the next decade. Front. Mar. Sci. 6:277. doi: 10.3389/fmars.2019.00277
Perez, F. F., Fontela, M., García-Ibáñez, M. I., Mercier, H., Velo, A., Lherminier, P., et al. (2018). Meridional overturning circulation conveys fast acidification to the deep Atlantic Ocean. Nature 554, 515–518. [in press]. doi: 10.1038/nature25493
Pickering, A., Nash, J. D., Moum, J. N., and MacKinnon, J. A., (2016). Global Patterns of Turbulence and Diapycnal Mixing from CTD-Chipods on the Global Repeat Hydrography Program. Washington, D.C: American Geophysical Union.
Pierrot, D., Neil, C., Sullivan, K., Castle, R., Wanninkhof, R., Lueger, H., et al. (2009). Recommendations for autonomous underway pCO2 measuring systems and data reduction routines. Deep Sea Res. II 56, 512–522. doi: 10.1016/j.dsr2.2008.12.005
Purkey, S. G., Smethie, W. M., Gebbie, G., Gordon, A. L., Sonnerup, R. E., Warner, M. J., et al. (2018). A synoptic view of the ventilation and circulation of antarctic bottom water from chlorofluorocarbons and natural tracers. Ann. Rev. Mar. Sci. 10, 503–327. doi: 10.1146/annurev-marine-121916-063414
Purkey, S. G., and Johnson, G. C. (2010). Warming of global abyssal and deep Southern Ocean waters between the 1990s and 2000s: contributions to global heat and sea level rise budgets. J. Clim. 23, 6336–6351. doi: 10.1175/2010jcli3682.1
Purkey, S. G., and Johnson, G. C. (2013). Antarctic bottom water warming and freshening: contributions to sea level rise, ocean freshwater budgets, and gobal heat gain. J. Clim. 26, 6105–6122. doi: 10.1175/jcli-d-12-00834.1
Purkey, S. G., Johnson, G. C., Talley, L. D., Sloyan, B. M., Wijffels, S. E., Smethie, W., et al. (2019). Continued bottom water warming and freshening in the South Pacific Ocean. J. Geophys. Res. 124, 1778–1794. doi: 10.1029/2018JC014775
Raes, E. J., Bodrossy, L., van de Kamp, J., Bissett, A., Ostrowski, M., Brown, M. V., et al. (2018). Oceanographic biome boundaries constrain microbial richness in the South Pacific Ocean. Proc. Natl. Acad. Sci. U.S.A. 115, E8266-E8275, doi: 10.1073/pnas.1719335115
Rhein, M., Rintoul, S. R., Aoki, S., Campos, E., Chambers, D., Feely, R. A., et al. (2013). Observations: ocean. In Climate Change 2013: The Physical Science Basis. Contribution of Working Group I to the Fifth Assessment Report of the Intergovernmental Panel on Climate Change. eds T. F Stocker., D. Qin, G. -K. Plattner, M. Tignor, S. K Allen (Cambridge, MA: Cambridge University Press), 255–310.
Ríos, A. F., Velo, A., Pardo, P. C., Hoppema, M., and Pérez, F. F. (2012). An update of anthropogenic CO2 storage rates in the western South Atlantic basin and the role of Antarctic Bottom Water. J. Mar. Syst. 94, 197–203. doi: 10.1016/j.jmarsys.2011.11.023
Roemmich, D., Gilson, J., Davi, R., Sutton, P., Wijffels, S., and Riser, S. (2007). Decadal spinup of the South Pacific subtropical gyre. J. Phys. Oceanogr. 37, 162–173. doi: 10.1175/jpo3004.1
Roquet, F., Charrassin, J. -B., Marchand, S., Boehme, L., Fedak, M., Reverdin, G., et al. (2011). Delayed-mode calibration of hydrographic data obtained from animal-borne satellite relay data loggers. J. Atmos. Ocean. Technol. 28, 787–801. doi: 10.1175/2010jtecho801.1
Sabine, C. L., Feely, R. A., Gruber, N., Key, R. M., Lee, K., Bullister, J. L., et al. (2004). The oceanic sink for anthropogenic CO2. Science 305, 367–371. doi: 10.1126/science.1097403
Sabine, C. L., Feely, R. A., Millero, F. J., Dickson, A. G., Langdon, C., et al. (2008). Decadal changes in pacific carbon. J. Geophys. Res. 113:C07021.
Sabine, C. L., and Tanhua, T. (2010). Estimation of anthropogenic CO2 inventories in the ocean. Ann. Rev. Mar. Sci. 2, 175–198.
Sasano, D., Takatani, Y., Kosugi, N., Nakano, T., Midorikawa, T., and Ishii, M. (2018). Decline and bidecadal oscillations of dissolved oxygen in the Oyashio region and their propagation to the western North Pacific. Glob. Biogeochem. Cycles 32, 909–931. doi: 10.1029/2017GB005876
Sasano, D., Ishii, M., Midorikawa, T., Nakano, T., Tokieda, T., and Uchida, H. (2011). Testing a new quick response oxygen sensor, “RINKO”. Papers Meteorol. Geophys. 62, 63–73. doi: 10.2467/mripapers.62.63
Schlitzer, R. (2000). Electronic Atlas of WOCE Hydrographic and tracer data now. EOS Trans. AGU 81:45. doi: 10.1029/00eo00028
Sloyan, B. M., and Rintoul, S. R. (2001). The Southern Ocean limb of the global deep overturning circulation. J. Phys. Oceanogr. 31, 143–173. doi: 10.1175/1520-0485(2001)031<0143:tsolot>2.0.co;2
Sloyan, B. M., Wijffels, S. E., Tilbrook, B., Katsumata, K., Murata, A., and Macdonald, A. M. (2013). Deep ocean changes near the western boundary of the South Pacific Ocean. J. Phys. Oceanogr. 43, 2132–2141. doi: 10.1175/jpo-d-12-0182.1
Smith, N., Kessler, W. S., Cravatte, S., Sprintall, J., Wijffels, S, Cronin, M. F., et al. (2019). Tropical pacific observing system. Front. Mar. Sci. 6:31. doi: 10.3389/fmars.2019.00031
Sonnerup, R. E., Mecking, S., and Bullister, J. L. (2013). Transit time distributions and oxygen utilization rates in the Northeast Pacific Ocean from chlorofluorocarbons and sulfur hexafluoride. Deep Sea Res. I 72, 61–71.
Sonnerup, R. E., Mecking, S., Bullister, J. L., and Warner, M. J. (2015). Transit time distributions and oxygen utilization rates from chlorofluorocarbons and sulfur hexafluoride in the Southeast Pacific Ocean. J. Geophys. Res. 120, 3761–3776. doi: 10.1002/2015JC010781
Stanley, R. H. R., Doney, S. C., Jenkins, W. J., and Lott, D. E. I. (2012). Apparent oxygen utilization rates calculated from tritium and helium-3 profiles at the Bermuda Atlantic Time-series Study site. Biogeosciences 9, 1969–1983. doi: 10.5194/bg-9-1969-2012
Stramma, L., Johnson, G. C., Sprintall, J., and Mohrholz, V. (2008). Expanding oxygen-minimum zones in the tropical oceans. Science 320, 655–658. doi: 10.1126/science.1153847
Suzuki, T., Ishii, M., Aoyama, M., Christian, J. R., Enyo, K., Kawano, T., et al. (2013). PACIFICA Data Synthesis Project. ORNL/CDIAC-159, NDP-092. Carbon Dioxide Information Analysis Center, Oak Ridge National Laboratory. Oak Ridg, TN: U.S. Department of Energy.
Takahashi, T., Sutherland, S. C., Wanninkhof, R., Sweeney, C., Feely, R. A., Chipman, D. W., et al. (2009). Climatological mean and decadal change in surface ocean pCO2, and net sea-air CO2 flux over the global oceans. Deep Sea Res. II 56, 554–577. doi: 10.1016/j.dsr2.2008.12.009
Takatani, Y., Kojima, A., Iida, Y., Nakano, T., Ishii, M., et al. (2014). Ocean acidification in the interior of the western North Pacific subtropical region, in Proceedings of the International Ocean Research. Conference, Spain, 17–21.
Takeshita, Y., Johnson, K. S., Martz, T. R., Plant, J. N., and Sarmiento, J. L. (2018). Assessment of autonomous pH measurements for determining surface seawater partial pressure of CO2. J. Geophys. Res. Oceans 123, 4003–4013. doi: 10.1029/2017JC013387
Talley, L. D., Feely, R. A., Sloyan, B. M., Wanninkhof, R., Baringer, M. O., and Bullister, J. L. (2016). Changes in ocean heat, carbon content, and ventilation: a review of the first decade of GO-SHIP global repeat hydrography. Ann. Rev. Mar. Sci. 8, 185–215. doi: 10.1146/annurev-marine-052915-100829
Talley, L. D. (2013). Closure of the global overturning circulation through the Indian, Pacific and Southern Oceans: schematics and transports. Oceanography 26, 80–97. doi: 10.5670/oceanog.2013.07
Tanhua, T., Pouliquen, S., Hausman, J., O’Brien, K., Bricher, P., de Burin, T., et al. (2019). Ocean FAIR data services. Front. Mar. Sci. [in press]. doi: 10.3389/fmars.2019.00440
Tanhua, T., Hoppema, M., Jones, E. M., Stöven, T., Hauck, J., Dávila, M. G., et al. (2017). Temporal changes in ventilation and the carbonate system in the Atlantic sector of the Southern Ocean. Deep Sea Res. Part II 138, 26–38. doi: 10.1016/j.dsr2.2016.10.004
van Heuven, S. M. A. C., Hoppema, M., Huhn, O., Slagter, H. A., and de Baar, H. J. W. (2011). Direct observation of increasing CO2 in the weddell gyre along the prime meridian during 1973–2008. Deep-Sea Res. II 58, 2613–2635. doi: 10.1016/j.dsr2.2011.08.007
Wanninkhof, R., Park, G. -H., Takahashi, T., Feely, R. A., Bullister, J. L., and Doney, S. C. (2013a). Changes in deep-water CO2 concentrations over the last several decades determined from discrete pCO2 measurements. Deep-Sea Res. I 74, 48–63. doi: 10.1016/j.dsr.2012.12.005
Wanninkhof, R., Park, G. -H., Takahashi, T., Sweeney, C., Feely, R., Nojiri, Y., et al. (2013b). Global ocean carbon uptake: magnitude, variability and trends. Biogeosciences 10, 1983–2000. doi: 10.1073/pnas.1900371116
Waterhouse, A. F., MacKinnon, J. A., Nash, J. D., Alford, M. H., Kunze, E., Simmons, H. L., et al. (2014). Global patterns of mixing from measurements of the turbulent dissipation rate. J. Phys. Oceanogr.. 44, 1854–1872. doi: 10.1175/JPO-D-13-0104.1
Waters, J. F., Millero, F. J., and Sabine, C. L. (2011). Changes in South Pacific anthropogenic carbon. Glob. Biogeochem. Cycles 25:GB4011.
Waugh, D. W., Primeau, F., Devries, T., and Holzer, M. (2013). Recent changes in the ventilation of the southern oceans. Science 339, 568–570. doi: 10.1126/science.1225411
Williams, N. L., Juranek, L. W., Johnson, K. S., Feely, R. A., Riser, S. C., Talley, L. D., et al. (2016). Empirical algorithms to estimate water column pH in the Southern Ocean. Geophys. Res. Lett. 43, 3415–3422. doi: 10.1002/2016GL068539
Keywords: GO-SHIP, ship-based observations, multidisciplinary ocean research, contemporaneous ocean observations, global ocean change and variability, health, essential ocean variables, essential climate variables
Citation: Sloyan BM, Wanninkhof R, Kramp M, Johnson GC, Talley LD, Tanhua T, McDonagh E, Cusack C, O’Rourke E, McGovern E, Katsumata K, Diggs S, Hummon J, Ishii M, Azetsu-Scott K, Boss E, Ansorge I, Perez FF, Mercier H, Williams MJM, Anderson L, Lee JH, Murata A, Kouketsu S, Jeansson E, Hoppema M and Campos E (2019) The Global Ocean Ship-Based Hydrographic Investigations Program (GO-SHIP): A Platform for Integrated Multidisciplinary Ocean Science. Front. Mar. Sci. 6:445. doi: 10.3389/fmars.2019.00445
Received: 20 November 2018; Accepted: 05 July 2019;
Published: 07 August 2019.
Edited by:
Sabrina Speich, École Normale Supérieure, FranceReviewed by:
Maciej Telszewski, Institute of Oceanology (PAN), PolandMaria Paz Chidichimo, National Scientific and Technical Research Council (CONICET), Argentina
Copyright © 2019 Sloyan, Wanninkhof, Kramp, Johnson, Talley, Tanhua, McDonagh, Cusack, O’Rourke, McGovern, Katsumata, Diggs, Hummon, Ishii, Azetsu-Scott, Boss, Ansorge, Perez, Mercier, Williams, Anderson, Lee, Murata, Kouketsu, Jeansson, Hoppema and Campos. This is an open-access article distributed under the terms of the Creative Commons Attribution License (CC BY). The use, distribution or reproduction in other forums is permitted, provided the original author(s) and the copyright owner(s) are credited and that the original publication in this journal is cited, in accordance with accepted academic practice. No use, distribution or reproduction is permitted which does not comply with these terms.
*Correspondence: Bernadette M. Sloyan, Bernadette.Sloyan@csiro.au; Rik Wanninkhof, rik.wanninkhof@noaa.gov; Martin Kramp, mkramp@jcommops.org