

Abstract
The seafloor covers some 70% of the Earth's surface and has been recognised as a major sink for marine litter. Still, litter on the seafloor is the least investigated fraction of marine litter, which is not surprising as most of it lies in the deep sea, i.e. the least explored ecosystem. Although marine litter is considered a major threat for the oceans, monitoring frameworks are still being set up. This paper reviews current knowledge and methods, identifies existing needs, and points to future developments that are required to address the estimation of seafloor macrolitter. It provides background knowledge and conveys the views and thoughts of scientific experts on seafloor marine litter offering a review of monitoring and ocean modelling techniques. Knowledge gaps that need to be tackled, data needs for modelling, and data comparability and harmonisation are also discussed. In addition, it shows how research on seafloor macrolitter can inform international protection and conservation frameworks to prioritise efforts and measures against marine litter and its deleterious impacts.
Export citation and abstract BibTeX RIS

Original content from this work may be used under the terms of the Creative Commons Attribution 4.0 license. Any further distribution of this work must maintain attribution to the author(s) and the title of the work, journal citation and DOI.
List of acronyms
| ALDFG | abandoned, lost or otherwise discarded fishing gear |
| AUV | Autonomous underwater vehicle |
| AWARE | Action with awareness regarding education (AWARE Foundation) |
| AWI | Alfred Wegener Institute |
| BIIGLE | BioImage Indexing, Graphical Labeling and Exploration |
| BITS | Baltic International Trawl Survey |
| CATAMI | Collaborative and Automated Tools for Analysis of Marine Imagery |
| CNR | Consiglio Nazionale delle Ricerche (National Research Council) |
| DSV | Deep Submergence Vehicle |
| EC | European Commission |
| ECOTAXA | A tool for the taxonomic classification of images of plankton |
| EMODnet | European Marine Observation and Data Network |
| EU | European Union |
| G7 | Group of Seven, an international forum including the seven countries with the largest advanced economies in the world according to the International Monetary Fund: Canada, France, Germany, Italy, Japan, the United Kingdom, and the United States |
| G20 | Group of 20, an international forum for the governments and central bank governors from 19 countries and the EU |
| GES | Good environmental status (within the MSFD) |
| GOC | Grande Ouverture avec Côtés (a newly designed single trawling gear promoted by MEDITS) |
| GOV | Grande Ouverture Verticale (kind of trawl net) |
| GRID | Global Resource Information Database |
| GUI | graphical user interface |
| HOV | Human occupied vehicle |
| IAS | Institute of anthropic impacts and sustainability in the marine environment |
| IBTS | International Bottom Trawl Survey |
| ICES | International Council for the Exploration of the Sea |
| IUCN | International Union for Conservation of Nature |
| IFREMER | Institut Français de Recherche pour l'Exploitation de la Mer |
| INSPIRE | INfrastructure for SPatial InfoRmation in Europe |
| JAMSTEC | Japan's Agency for Marine-Earth Science and Technology |
| JRC | Joint Research Centre |
| LITTERBASE | Online portal for marine litter from AWI |
| MBARI | Monterey Bay Aquarium Research Institute |
| MEDITS | Mediterranean International Trawl Survey |
| MITgcm | Massachusetts Institute of Technology General Circulation Model |
| MSFD | Marine Strategy Framework Directive |
| Mt | Million metric tons |
| mwd | metres of water depth |
| NASA | National Aeronautics and Space Administration (USA) |
| NS-IBTS | North Sea International Bottom Trawl Survey (from table 1) |
| OGCM | Ocean General Circulation Model |
| OSPAR | Convention for the Protection of the Marine Environment of the North-East Atlantic (formerly Oslo and Paris Conventions) |
| PANGAEA | Data Publisher for Earth & Environmental Science (a digital data library and a data publisher for Earth system science, which services are generally open for archiving, publishing, and re-usage of data) |
| PAPARA(ZZ)I | Program for Annotation of Photographs And Rapid Analysis (of Zillions and Zillions) of Images |
| RecoMIA | Recommendations for marine image annotation |
| RF | random forests (a type of machine-learning algorithm) |
| ROI | region of interest (in imagery) |
| ROMS | Regional Ocean Modeling System |
| ROV | Remotely Operated Vehicle |
| RSC | Regional Sea Convention |
| SCUBA | Self-Contained Underwater Breathing Apparatus (equipment used to breathe underwater) |
| SI | International System of Units |
| SOV | Soviet (from table 1) |
| SQUIDLE | A centralised web-based framework for management, exploration and annotation of marine imagery |
| TUC | Towed Underwater Camera |
| TV | Trawl vessel (from table 1) |
| TVL | Trawl vessel large (from table 1) |
| TVM | Trawl vessel medium (from table 1) |
| TVS | Trawl vessel small (from table 1) |
| UN | United Nations |
| UNEA | United Nations Environmental Assembly |
| UNEP | United Nations Environment Program |
| US | United States (of America) (from table 1) |
| USBL | ultra-short baseline transponders |
| VARS | Video Annotation and Reference System |
| WHOI | Woods Hole Oceanographic Institute |
1. Introduction
The leakage of human waste into the ocean, whether directly from ships and other maritime platforms or from land, is affecting the ocean and its ecosystems. Large quantities of waste, including an estimated 8 Mt of plastics from land alone in 2010 (Jambeck et al 2015), enter the oceans every year. The overall figure for plastic waste leakage has been recently updated by Borrelle et al (2020) to 19–23 Mt for all aquatic ecosystems in 2016. Yet, global annual waste generation is projected to jump from 2.0 billion tons in 2016 to ca. 3.4 billion tons over the next 30 years, with plastics accounting for ∼12% (≈ 242 Mt) of this refuse (Kaza et al 2018). Other modelled predictions range from 20–53 to 90 Mt a year, depending on scenarios, of plastic emissions to the world's aquatic ecosystems by 2030 (Borrelle et al 2020). The amount of plastics entering the environment is thus likely to increase significantly (Geyer et al 2017), even under ambitious system change management scenarios (Lau et al 2020). Still, we currently do not know where 99% of the plastic debris that made its way into the oceans is (van Sebille et al 2015). Given that approximately half of the plastics produced is heavier than seawater (Engler 2012), a large proportion can be expected to sink directly to the ocean floor, which would constitute a major sink (Woodall et al 2014). Even initially buoyant litter is expected to eventually settle to the seafloor after suffering alterations through a variety of physical, physicochemical, biochemical and biological processes (Kukulka et al 2012, Tubau et al 2015, Besseling et al 2017, Katija et al 2017, Kooi et al 2017, Porter et al 2018, de Haan et al 2019, Wieczorek et al 2019, Tekman et al 2020, van Sebille et al 2020). In the absence of light, a steady low temperature and comparatively low-energy regime (except in shallow coastal areas), plastic items on the seafloor can be assumed to be stable, though breakdown may occur at poorly known rates (Napper and Thompson 2019). Thus, there is mounting evidence that quantities of litter on the seafloor are growing continuously (Tekman et al 2017, Gerigny et al 2019).
Marine litter (or marine debris) is described as 'any persistent, manufactured or processed solid material discarded, disposed of or abandoned in the marine and coastal environment' (UNEP 2005). This includes plastic material leakage from diverse pathways including those of terrestrial (e.g. rivers, coastal landfills) or marine (e.g. loss of fishing gear, direct garbage dumping) origins. While marine litter occurs in a continuous size spectrum from nanoparticles to items many metres in dimension, size categories have been defined for monitoring purposes. The size class >25 mm is referred to as macrolitter, being the fraction that can be monitored by visual census and collected in bottom trawls. However, litter also enters the environment as very small particles, the so-called microlitter or microplastics (≤ 5 mm), which is emitted in this size or derived from fragmentation of larger plastic items. This review focuses on large debris (i.e. macrolitter) on the seafloor.
Litter on beaches raises awareness of the extent of litter pollution to the general public, however the seafloor is out of sight to most of society, even at short distances from the shore. Reports of benthic accumulation areas support the hypothesis that the seafloor represents an ultimate sink for all materials lost and discarded unless intercepted by beaches (but see Lebreton et al 2019, Pham et al 2020). Indeed, 8000 litter items km−2 (Tubau et al 2015) and 20 000 items km−1 (Pierdomenico et al 2019) have been estimated to sit on the deep seafloor in the Mediterranean Sea. These figures could be even larger in other areas, for which no data exist. Vast areas of the seafloor remain to be mapped and many species have yet to be discovered (Ramirez-Llodra et al 2010). The assessment of the abundance, distribution, and effects of marine litter on the ocean floor is therefore challenged by our limited knowledge of this environment.
In general terms, sources of seafloor litter are commonly classified as either land- or sea-based. Sea-based sources of marine litter include mostly merchant shipping and fisheries-related activities but also cruise and leisure shipping, aquaculture, military fleets and oil and gas exploration and production. Land-based sources involve those related to activities along the shoreline and riverbanks, such as landfills, littering and inefficient waste management. They may also include wind transport of light litter. Land-sourced litter can be a major fraction of total litter in coastal waters (figures 1(a)–(d)), which flow from distant inland sources through riverine and aeolian transport. Extreme events such as heavy rainfalls, river floods, sewage overflow, coastal storms, hurricanes and tsunamis can carry large amounts of debris to beaches and coastal waters in a matter of a few hours or days, part of which subsequently spreads seawards and settles to the seafloor (Galgani et al 2000, Thiel et al 2013, Galgani 2015, Maximenko et al 2018, Murray et al 2018). Seafloor litter can harm marine organisms of all sizes by various mechanisms, including entanglement, smothering and ingestion (Kühn et al 2015). Although many observations have been made, the pathways, distribution and true extent of the harm of litter on biota on the seafloor are largely unknown.

Figure 1. Land-sourced litter paving erosive channels in the Messina Strait, Central Mediterranean Sea (a)–(d). Plastics are the dominant component amidst a noticeable diversity of litter types and objects shown in the pictures. The images were taken during fall 2016 at 415 (a), 550 (b) and (c), and 575 (d) mwd. All scale bars are 20 cm. Photographs taken with POLLUX III ROV, courtesy of M Pierdomenico and D Casalbore from the CNR, and F Chiocci from the University of Rome La Sapienza, Italy.
Download figure:
Standard image High-resolution imageTargets and standards such as those of the MSFD (European Commission 2008) of the EU, resolutions and decisions of the UNEA (several years), declarations of the G7 and G20 assemblies, and agreements of the RSCs, have recognised the need for action to minimise marine litter. Resulting activities include the EU Directive on the Reduction of the Impact of Certain Plastic Products on the Environment (European Union 2019), the revision of the EU Port Reception Facilities Directive (European Commission 2018), the UN Global Partnership against Marine Litter (www.unenvironment.org/explore-topics/oceans-seas/what-we-do/addressing-land-based-pollution/global-partnership-marine), an aggravation of multiple-polymer plastic exports under the Basel Convention, and Regional Action Plans against Marine Litter. For planning, prioritisation and monitoring of the effectiveness of measures, these schemes rely on scientifically sound quantitative assessments of litter and its impacts on different marine environments and their inhabitants. In this respect, it is important to keep in mind that seafloor litter is often investigated opportunistically, and relies on methodologies used to address research questions that do not focus on marine litter (e.g. fish stock assessments, which yield physical samples as by-catch in bottom trawls). Similarly, camera footage obtained by (un-)manned vehicles and other devices, originally designed for other ecological or geological purposes, is also used to quantify benthic pollution. In operational terms, different tools are employed at different depths (Galgani et al 2013b).
The paragraphs above underline the need for larger and more standardised datasets and procedures providing more information for more robust decision making on the protection and management of marine ecosystems. One major reason for focusing on seafloor marine macrolitter is that there are fewer studies on this litter class compared to studies on smaller size classes and on floating or beached debris. Marine litter seafloor research should move towards a harmonised monitoring approach at large spatial and temporal scales. Given the widespread and cumulative character of seafloor macrolitter and the distinct observation and collection methodologies involved, this paper focuses on (a) providing a synthesis of current knowledge on seafloor macrolitter, and (b) performing a methodological review from where lessons for future work could be extracted.
2. Marine litter: boosted scientific production and databases
With the rising awareness of marine litter, an increasing number of studies have been undertaken spurring a surge of publications in the last decade (figure 2). Data on marine litter have been derived mostly from national programs for MSFD implementation, Regional seas monitoring programs, project-related surveys, and research activities at large. The number of studies specifically focussing on seafloor litter is, however, still rather minor. In 2019 it represented less than 1/4 of all studies on marine litter, microplastics excluded (figure 2(a)), and about 1/7 of all studies on marine litter, microplastics included (figure 2(b)). Furthermore, not all information is readily accessible, as at present there is no common reporting template for seafloor litter.
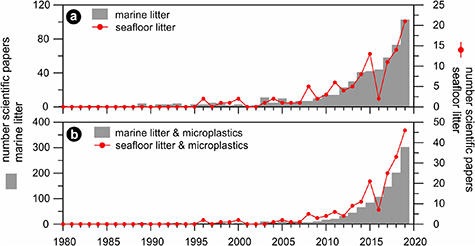
Figure 2. (a) Number of peer-reviewed papers on marine litter and microplastics (left axis, grey bars, from 0 to 120) either beached, floating or on the seafloor, and on seafloor litter (right axis, red curve, from 0 to 25) published between 1980 and 2019 extracted from Scopus. Search terms in title, abstract or keywords included 'marine litter' or 'macrolitter' or 'marine debris', and 'sea surface' or 'beach' or 'float*' or '*floor' or 'deep sea', but not 'microplastic*'. Amongst the latter, only the terms '*floor' or 'deep sea' are considered in the right axis. (b) Same searches including 'microplastic*' (left axis, grey bars, from 0 to 400; and right axis, red curve, from 0 to 50). The asterisks (*) mean that every word including the search term with asterisk has been considered in the search (e.g. '*floor' vs. 'seafloor' or 'sea-floor'). Beware of differential scaling of the two ordinates.
Download figure:
Standard image High-resolution imageAttempts to compile available information on marine litter at the global scale, including seafloor litter, have been made on the AWI's online portal LITTERBASE (https://litterbase.awi.de/; Bergmann et al 2017), which pools data from peer-reviewed publications and provides analyses and maps of litter distribution and impacts. They show that all ocean basins contain litter (figure 3(a)–(d)). While plastics account globally for 75% of marine debris, on the seafloor they comprise 62%. LITTERBASE also shows that despite the recently increasing research effort, the spatial coverage of data is still limited and highly unbalanced. For example, until 2019 there was only one study available for the whole of the Indian Ocean seafloor (Woodall et al 2015) and less than a handful of studies published on the South Atlantic and Southeast Pacific. The degree of pollution in the vast expanse of the open oceans is also largely unknown as most research focuses on coastal areas, European seas, North America, and the Western Pacific.
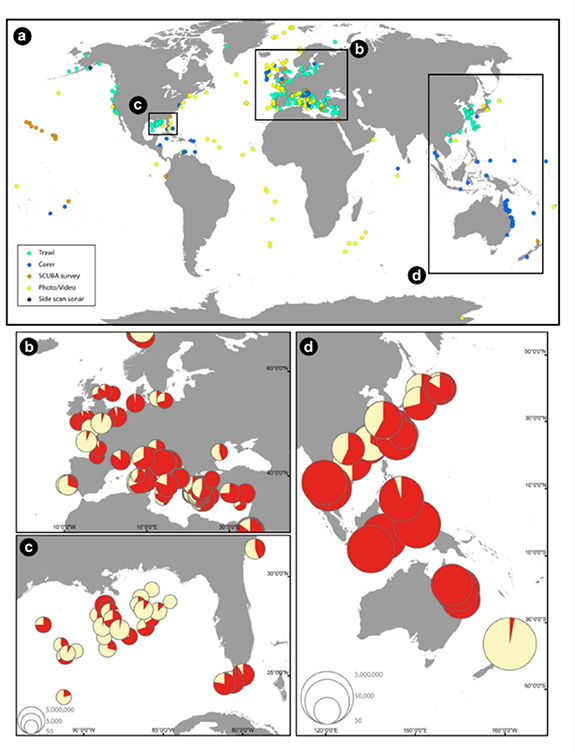
Figure 3. Global distribution of seafloor litter (a) after assessment from different methods (see legend in the upper map lower left corner). Regional maps display seafloor litter densities and the share of plastics (red sections of pie charts) in (b) the NE Atlantic Ocean and the Mediterranean Sea, (c) the Gulf of Mexico, and (d) the Western Pacific Ocean. Seafloor litter densities in (b)–(d) are given as items km−2. Scale for (b) and (c) in the lower left corner of (c). Maps are based on data extracted from LITTERBASE as of September 2019.
Download figure:
Standard image High-resolution imageJAMSTEC established the Deep-sea Debris Database (www.godac.jamstec.go.jp/catalog/dsdebris/e/; Chiba et al 2018), which provides access to geo-referenced imagery of litter mostly from the deep Pacific Ocean taken during the institute's many submersible dives since the 1980s. Regional initiatives and project-based databases provide useful data portals. For example, the EMODNet Chemistry portal for marine data is currently compiling project data on benthic litter at the European scale (www.emodnet.eu/emodnet-chemistry-litter-data-maps-first-release). Another good example is the MBARI video annotation database including records from 1989 onwards (Schlining et al 2013). Citizen science is also a growing component, as shown by the Dive Against Debris program of the AWARE Foundation, which relies on SCUBA divers (AWARE Foundation 2015; Consoli et al 2020a). While expanding the spatial and temporal scales of knowledge, initial instruction and quality control of such data is essential (see section 6.2)
3. Litter typology
Litter can be classified according to a variety of criteria including size, material type, item description or use. The classification of litter results from a number of conventions made for practical reasons. While there is need to report litter in SI units, i.e. through weight and number, associated information on the precise material composition is rarely available. The longest dimension of items is often used to describe litter size, but often does not provide a complete picture. The size of some litter objects can be inferred from their identification (e.g. 0.5 l beverage bottle), and often the use of size-range classes can provide information as a rough estimate to litter mass. However, depending on the size ranges used, it can result in large uncertainties and non-comparable data if standardised protocols are not used, as is often the case. Very recently, Koelmans et al (2020) have provided a method for accurate interchange between number, volume, and mass concentrations of microplastics using probability density functions. It would be worth exploring if such a method could also work for marine macrolitter or, at least, for some macrolitter types (e.g. macroplastics).
Size classes and the terms used to refer to them are not currently standardised. The terms, macro-, meso- and microlitter are defined respectively as objects larger than 25 mm, which are visible from greater distances; items between 25 and 5 mm, requiring specific methods for standardised sampling; and particles smaller than 5 mm (MSFD GES Technical Subgroup on Marine Litter 2011) and were applied in scientific papers (e.g. Haseler et al 2018, Cowger et al 2020) and citizen science protocols (e.g. Baleta et al 2017). Megalitter has also been used for very large items such as shipwrecks or containers, however others such as Mordecai et al (2011) proposed a semi-quantitative size scale for litter objects: (a) small for objects <10 cm, (b) medium for litter of 10–50 cm, and (c) large for litter >50 cm.
For trawl-sampled seafloor litter (see section 6.2), six size classes based on the litter item area have been proposed with upper limits at 25, 100, 400, 2500, 10 000 and >10 000 cm2 (Galgani et al 2013b), where the small class size is determined by the mesh size of the net. It will be important to select and agree on litter classes that are compatible across different types of environments and sampling methodologies. The direct weighing of litter sampled on the seafloor is impractical due to its wet weight, while litter monitored by visual observation cannot be weighed. In addition to standardised size classes, it may be useful to follow a common scheme allowing the semi-quantification of litter masses, enabling comparable survey data across locations and habitats
While there are only rough size categories (2.5–50 cm as one class) in current use for several beach litter monitoring schemes, for an updated beach macrolitter protocol and for floating macrolitter it is recommended to be classified in size ranges of 2.5–5, 5–10, 10–20, 20–30 and 30–50 cm, and larger than 50 cm (Galgani et al 2013b, Fleet et al 2020). So far, this situation prevents data comparison across habitats, surveys, and geographic locations, including the seafloor.
Litter types are described according to categories related to their constituent material (i.e. synthetic polymer, metal, glass/ceramic, paper, processed wood, rubber, chemicals), their use and source (fisheries, construction, packaging), and individual description (e.g. bottle, bag, sheet, net, rope), which may be specified further (e.g. beverage bottle, oil bottle, rope diameter <1 cm). Analysing seafloor macrolitter data from 146 publications and 822 locations in LITTERBASE shows that plastics are the dominant category in terms of number of items (62%), followed by 'fisheries'-related materials (10%, also including synthetic polymers), metal (8%), glass/ceramics (ca. 4%), textiles (2%) and paper (<1%). By contrast, plastic items accounted for 75%–84% of macrolitter on beaches (https://litterbase.awi.de/; Addamo et al 2017). Polymer types of plastic debris are typically not described in routine monitoring, which compromises comparisons with microlitter monitoring, for which such data are often available.
In European regional seas, seabed macrolitter classifications and protocols for seafloor litter trawling are available for the Mediterranean Sea and Black Sea from MEDITS (Fiorentino et al 2013), and for the NE Atlantic Ocean and the Baltic Sea from OSPAR/ICES/IBTS (ICES 2012). The reference lists of material types (category) and item classes (subcategory) adopted by these two major initiatives are substantially different. MEDITS has nine main categories and 29 subcategories, whereas OSPAR/ICES/IBTS utilises six main categories and 39 subcategories (Galgani et al 2013b). This is particularly relevant because the unambiguous identification of litter items and their attribution to sources are critical for the development of litter input reduction measures and evaluation of their efficiency.
In order to overcome problems of non-comparability of data a Joint list of Litter Categories has been developed in the context of the MSFD, in collaboration with RSCs (Fleet et al 2020). This hierarchical list provides nine litter material categories (artificial polymer materials, cloth/textile, glass/ceramics, metal, paper, processed wood, rubber, food waste, chemicals), and also uses subcategories and different description levels for specific litter types. In addition, the list provides specific item descriptions, including different bottle sizes and uses, and rope diameters such that monitoring data can be analysed in relation to litter management (European Union 2019). Such large-scale monitoring schemes do not fulfil all requirements of scientifically sound quantification. However, there must be trade-offs due to practicalities in opportunistic sampling and resource efficiency. It is important to acquire the data necessary to assess the efficiency of waste management.
4. Seafloor litter pathways and occurrences
Once in the marine environment, most litter items may quickly spread along the shoreline and offshore before eventually sinking to the seabed (Ebbesmeyer and Ingraham 1994, Aliani et al 2003, Tubau et al 2015, Gutow et al 2018, van Sebille et al 2020). This is especially true for the light portion, mainly made of lightweight plastics (see section 3). Littoral drift currents, general and mesoscale ocean circulation, and high-energy processes like dense shelf water cascading drive offshore transport from coastal areas, leading to basin-scale dispersal (Mordecai et al 2011, Cózar et al 2014, 2015, Reisser et al 2014, Tubau et al 2015, van den Beld et al 2017, van Sebille et al 2020).
Macrolitter dispersal and accumulation depend on object type, composition, density and hydrodynamic behaviour. For instance, heavy bottom trawl fishing gear will remain in position on the ground where it got stuck, lost or was discarded, with rare subsequent mobilisation, if any. Smaller items may also be intercepted by emergent epifauna (Parga Martínez et al 2020). Light litter items, such as some plastics, are characterised by diverse compositions and properties, including specific weight as well as fragmentation and degradation patterns. Those with a density higher than seawater may sink to the bottom directly whereas lower-density plastic may remain suspended for variable periods of time. These low-density items can also sink by aggregation, biological action, ballasting, biofouling and hydrodynamic processes (Zettler et al 2013, Kühn et al 2015, de Haan et al 2019, Wieczorek et al 2019, Tekman et al 2020).
Despite the paucity of information, there is an increasing awareness that the seafloor and, in particular, the deep seafloor is a major sink for marine litter (Galgani 2015, Lebreton et al 2019, Egger et al 2020, Kaandorp et al 2020). Seafloor litter occurs in all marine basins, including their most remote regions (Dayton and Robilliard 1971, Woodall et al 2015, Parga Martínez et al 2020, Ryan et al 2020, Kaladharan et al 2020, Selvam et al 2021). Available data show considerable pollution by single-use items, like many plastic objects and beverage cans, and also ALDFG (Galgani et al 2000, Ramirez-Llodra et al 2013, Pham et al 2014, Tubau et al 2015, Woodall et al 2015, Alvito et al 2018, Cau et al 2018, Angiolillo 2019, Pierdomenico et al 2019, Amon et al 2020). Litter has been found in polar and subpolar regions (Dayton and Robilliard 1971, Lenihan et al 1990, Nel and Nel 1999, Schulz et al 2010, Ivar Do Sul et al 2011, Bergmann and Klages 2012, Parga Martínez et al 2020) and also in the deepest ocean parts, such as the Mariana Trench where a plastic bag was filmed at ca. 10 900 m depth (Chiba et al 2018). Deep-water ROV surveys have shown that in some areas litter abundance numerically exceeds that of macrobiota (Tubau et al 2015, Pierdomenico et al 2019) whereas in other areas trawl surveys have found megafaunal biomass to be similar to the total litter weight (Cau et al 2018).
Submarine physiography, geomorphological heterogeneity, and seabed type play a crucial role in the distribution of seafloor litter. This applies to relief-forming features at various scales (Pham et al 2013, Bo et al 2014, Angiolillo et al 2015, Cau et al 2017). Some submarine canyons acting as conduits for dense water masses from the continental shelf to the deep sea (Canals et al 2006, Pusceddu et al 2013, Schlining et al 2013) behave as vectors for low-density marine litter, which then accumulates in the deepest canyon reaches (Tubau et al 2015). More generally, irrespective of their origin, dimension and location, seafloor depressions promote litter accumulation (Galgani et al 2000). Rocky submarine canyons and seamounts are habitats where fishing gear easily becomes entangled (Galgani et al 2018b). An aggravating circumstance is that most modern fishing gears, irrespective of the size and species targeted, can persist in the marine environment for decades to centuries whilst ghost fishing (see section 5) (Kaiser et al 1996, Brown and Macfadyen 2007). Materials such as nylon, a polyamide, and, especially, a new generation of ultra-resistant polymers such as Dyneema, an ultra-high molecular weight polyethylene (Dyneema 2008, Vlasblom 2018; https://usarope.net/why-choose-dyneema-rope-vs-steel-wire-rope-for-heavy-duty-rigging/) used in fishing gear and other marine applications, are suspected to degrade very slowly where oxygen is scarce and light absent, such as the deep marine environment, even though robust data on degradation rates of synthetic polymers in the natural environment are still lacking (Ward and Reddy 2020). When specific landforms (i.e. canyons and seamounts) occur close to the coastline, they generally become spots for (artisanal) fisheries. This leads to the deployment of longlines, trammel nets, cages, fish aggregation devices and other gear, and their inevitable loss (Lastras et al 2016; Consoli et al 2020b). Also, fishermen deliberately use deep sections of submarine canyons to dump useless fishing gear and other items such as oil drums or ropes, damaging vulnerable habitats (Tubau et al 2015). In turn, large litter items and piles of litter have a strong trapping capability for other litter types, such as plastics, resulting in the formation of 'litter hotspots' (Tubau et al 2015). Man-made structures emerging from the seabed, including wrecks, also favour litter trapping (Brown and Macfadyen 2007, Mordecai et al 2011).
Once on the seabed or in the sub-seabed, litter is subject to a variety of human activities, such as dredging or bottom trawling. These activities may remobilize litter items (secondary dispersal), likely enhancing further degradation and fragmentation. Bottom trawling, for instance, may remobilise low-density litter, which is then also subject to burial by sediment flows and resettling sedimentary particles (Tubau et al 2015). Although this has yet to be confirmed, our current knowledge on bottom trawling-induced deep-water sediment transport is indicative of the potential magnitude of the phenomenon (Puig et al 2012). Also waste-dumping sites, including warfare material, toxic substances, wrecks and other types of anthropogenic material on the seafloor, should be located and mapped for proper accounting and impact assessment such as habitat alteration or leakage of associated chemicals (e.g. Missiaen and Henriet 2002, Czub et al 2018, Bełdowski et al 2019). The removal of seafloor litter, a management option currently under debate, needs to be assessed on a case-by-case basis, judging the benefits of cleaning against the damages caused by such interventions, which also have to be safe and cost-effective (Da Ros et al 2016, Madricardo et al 2020).
5. Interaction of marine biota with seafloor litter
Because of its wide distribution, durability and low biodegradability, marine litter can affect marine life in numerous ways, thus threatening biodiversity and the natural environment (Laist 1987, 1997, Yoshikawa and Asoh 2004, Lee et al 2006, Bo et al 2014). Direct and indirect interactions between marine biota and seafloor litter (figures 4(a)–(d)), such as entanglement, formation of artificial substrata for settling, covering/smothering of biota, transport vector of xenobionts, ingestion as well as pathogenic and toxicological impacts have been recorded from the world's ocean. Wounding, secondary infections, amputation, movement restrictions, impaired predator avoidance, exhaustion, suffocation and reduced foraging ability seriously affect entangled animals (Laist 1997). Charismatic animals such as cetaceans, seals, sea turtles, and marine birds have received most attention by researchers and the media, as they are clearly hindered in their ability to move, feed, and breathe when entangled. On the seafloor, sessile erect invertebrates, such as fragile and long-lived corals and sponges, and motile benthopelagic species likely are most affected by entanglements (Colmenero et al 2017, de Carvalho-souza et al 2018, Galgani et al 2018b). Nearly a third of the specimens of two sponge species in the deep Arctic Ocean had entangled plastic debris in them, which might have effects at the population level (Parga Martínez et al 2020). ALDFG may cause damage to species of conservation concern and to structuring species as well as sensitive habitats for a long time after reaching the bottom (Donohue et al 2001, Yoshikawa and Asoh 2004, Chiappone et al 2005, Bauer et al 2008, Heifetz et al 2009, Orejas et al 2009, Madurell et al 2012, Pham et al 2013, 2014, Bo et al 2014, Fabri et al 2014, Angiolillo et al 2015, Consoli et al 2018). Abrasion due to friction caused by moving or entangled gears on organisms like corals causes a progressive removal of their tissue, making them more vulnerable to parasite or bacterial infections and fouling organisms, eventually leading to the death of colonies (Bavestrello et al 1997, Bo et al 2014, Angiolillo et al 2015, Deidun et al 2015). A recent study in reef areas of the Gulf of Mannar, in southeast India, found that 34% of the corals in contact with debris, mainly made of abandoned fishing nets, suffered from tissue loss, and other 47.56% were fragmented (Patterson Edward et al 2020). Based on skeletal characteristics, morphology and size, colonies can be found with broken branches, entirely removed, crushed or with the soft tissue scraped off the branches, and rarely overgrown completely (Bo et al 2014, Angiolillo 2019). The finding of isolated and damaged or entangled colonies or species usually forming dense populations may indeed be considered an indication of a lost ecosystem (Bo et al 2014, 2015). Derelict traps and nets attract and entrap mobile organisms such as crabs, octopuses and fish that die from stress, injury or starvation, as they cannot escape. The odour of their carcasses in turn attracts further organisms starting a process called ghost fishing (Matsuoka et al 2005, Erzini et al 2008, Kühn et al 2015).

Figure 4. Litter interactions with marine life. (a) Lost bottom trawl net lying on bathyal mud at about 500 mwd at Cap de Creus Canyon (Northwestern Mediterranean Sea) with organisms using it as shelter or hideout. The fish is a greater forkbeard (Phycis blennoides), the cnidarian a coloured tube anemone (Cerianthus membranaceus), and the crustacean a Bathynectes maravigna. There is also an unidentified dead fish. The green laser dots are 15 cm apart. Photograph taken with Liropus II ROV by GRC Geociències Marines, Universitat de Barcelona, Spain (modified from Tubau et al 2015). (b) Car tire collected during MEDITS experimental trawl surveys at 74 m depth, from the northern coast of Sardinia (Central Western Mediterranean Sea). The tire is covered with fouling and encrusting fauna, with the presence of a highly visible squid egg laying (Loligo spp.), and also the Porifera Clathria spp. and the bryozoan Miriapora truncata. Photograph by Università di Cagliari, Italy. (c) Brittlestar (Ophiura sp.) and glove in a soft bottom covered up by these organisms at 502 mwd off Miyagi prefecture, in the Pacific Ocean, east of Japan. Photograph taken with Hyper-Dolphin ROV by JAMSTEC, Japan. (d) Yellow gorgonian Eunicella cavolini colonies entangled by lost ropes and net on the seafloor at Gulf of Naples (Mediterranean Sea) at 150 m depth. Photograph taken with Pollux ROV by ISPRA, Italy. All scale bars are 15 cm.
Download figure:
Standard image High-resolution imageAt least 693 marine species are known to interact with marine debris globally (Gall and Thompson 2015), 17% of which are included in the IUCN Red List. Shortly after UNEP and GRID-Arendal (2016) reported that 92 species of invertebrates, 89 of fish, 83 of birds, 38 of mammals and all species of sea turtles suffered wounding or death due to entanglement in marine debris. In a more recent review focusing on shallow and deeper water rocky reef habitats, de Carvalho-souza et al (2018) recorded 418 reef species belonging to various taxa (Porifera, Cnidaria, Platyhelminthes, Mollusca, Annelida, Arthropoda-Crustacea, Echinodermata, Chordata) and more than 36 389 individuals associated with marine litter, also noticing that entanglement and ghost catches by derelict fishing gear represented the main impact on marine biota in these environments. The portal LITTERBASE even recorded a total of 2248 taxa (status 2018) that were globally affected by entanglement, ingestion, colonisation and other interactions with litter. Benthic/demersal taxa accounted for 43% of these. Lamb et al (2018) estimated that 11.1 billion plastic items could be entangled in coral reefs across the Asia-Pacific region. Further, a recent review of litter impact on reef systems of the Mediterranean Sea identified 78 impacted taxa (Angiolillo and Fortibuoni 2020).
The most noticeable impacts of litter on soft-bottom environments are smothering and the introduction of artificial substrata. Litter items such as car tires (figure 4(b)), cans, glass bottles, nets (figure 4(d)), longlines, and bigger objects like bins or wrecks increase habitat heterogeneity as they provide new hard substrata for encrusting and sessile organisms and vagile fauna in environments otherwise dominated by soft sediments (Watters et al 2010, Mordecai et al 2011, Bergmann and Klages 2012, Angiolillo 2019). Derelict nets and longlines are frequently colonised by polychaetes, hydroids, encrusting sponges, tunicates, bryozoans, corals and zoanthids (Fabri et al 2014, Tubau et al 2015, Cau et al 2017). Even if these artificial substrata seem to enhance local diversity, they actually interfere with life on the seabed, altering the natural environment and community structure (figures 4(a)–(d) Saldanha et al 2003, UNEP 2009, Ioakeimidis et al 2015, Gündoğdu et al 2017, Angiolillo 2019). Seafloor waste may also favour the settlement of non-indigenous species (Mordecai et al 2011), which can use litter objects as a transport vehicle for dispersal by bottom currents (Kiessling et al 2015, Kühn et al 2015). Once settled in a new habitat, populations of alien species may grow, subsequently outcompeting resident species (Barnes et al 2009, Kühn et al 2015).
Litter items covering the body surface of emergent epifauna could interfere with filter-feeding, decrease water exchange, respiration, and reproduction (Kühn et al 2015). It has been shown that plastic debris smothering corals can lead to shading, damage, anoxic conditions, transfer of adhered toxins and pathogens and thereby providing a foothold for disease (Lamb et al 2018). Litter lying on the seafloor hinders biogeochemical exchange processes at the sediment-water interface leading to anoxia and food-deprivation of sediment inhabiting biota and alters benthic community composition (Uneputty and Evans 1997, Mordecai et al 2011, Smith 2012, Green et al 2015).
A growing number of marine organisms are known to ingest litter of almost all sizes (de Stephanis et al 2013, Wright et al 2013, Kühn et al 2015, Werner et al 2016). Organisms ingest litter deliberately when they mistake it for prey (Cole et al 2011, Wright et al 2013, Romeo et al 2015, 2016), accidentally while they are feeding on other prey (Thompson et al 2004, Van Cauwenberghe et al 2013, Fossi et al 2014), when they are hunting on shoals (Romeo et al 2015, Battaglia et al 2016), or as a result of secondary ingestion (debris already ingested by prey). Seabirds, fish, and copepods are actually attracted to the odour of plastics, probably as a result of infochemicals on litter acquired in the photic zone (Savoca et al 2016, 2017, Procter et al 2019). These processes may also play a role for benthic communities but our hitherto scarce knowledge focuses largely on the ingestion of small sized plastics (e.g. Renzi and Blašković 2020 and references therein), and demersal fish (e.g. Kühn et al 2020 and references therein). Ingested items may be fragmented, compacted and excreted or stored, but in any case they can cause physical and mechanical damage, such as abrasion and obstruction, inflammation and blockage of feeding appendages or filters (Cole et al 2011, de Stephanis et al 2013, Wright et al 2013, Li et al 2016, Pedà et al 2016, Cau et al 2020), or lead to malnutrition and pseudo-satiation resulting in reduced food intake (Kühn et al 2015, Romeo et al 2016). However, crustaceans, for example the Norway lobster Nephrops norvegicus, may be able to shed small plastic debris during moulting (Welden and Cowie 2016). Indigestible debris may accumulate in digestive tracts and affect individual fitness with consequences for reproduction and survival (Kühn et al 2015). This could have more pronounced effects on deep-sea biota, which often inhabit food-limited environments.
Marine litter may also represent a direct and indirect vehicle for the introduction and release of chemical substances into the marine environment and the organisms inhabiting it. The degradation of metals, paints, plastics and other materials can result in the release of toxic chemicals (UN 2013). Some xenobiotics, such as persistent organic pollutants, heavy metals, radioactive substances, pesticides, herbicides, and pharmaceuticals are resistant to degradation and deep waters and sediments have been suggested as the final sink for such pollutants with long term consequences on environmental health (Ramirez-Llodra et al 2011, Salvadó et al 2013, Jamieson et al 2017). These chemicals could become available to organisms (Rochman et al 2014), enter cells and cause sub-lethal and chronic effects (Teuten et al 2009). Transfer of pollutants from ingested plastic debris to benthic biota has been recently demonstrated for the clam Scrobicularia plana, the amphipod Talitrus saltator, N. norvegicus, and the coral Stylophora pistillata (Devriese et al 2017, O'Donovan et al 2018, Scopetani et al 2018, Aminot et al 2020). Moreover, they can enter food webs and potentially lead to bioaccumulation and biomagnification of toxins, although this is still under debate (Koelmans et al 2016, Saley et al 2019).
Overall, the available data show different interactions and effects according to the characteristics of the seabed, associated organisms and the observational methods applied (figures 4(a)–(d)). Existing records provide an indication of relative sampling effort in different marine regions rather than an accurate view of the number of affected species and their exposure to marine litter, with the vast majority of records coming from the Pacific and Atlantic oceans, and the Western Mediterranean Sea (de Carvalho-souza et al 2018). The extent of litter effects on deep-sea habitats and their fauna is still poorly known, despite a growing number of studies in the last decade have shed some light on this issue (Ramirez-Llodra et al 2013, de Carvalho-souza et al 2018, Angiolillo 2019) (figure 2). This also highlights the need for a standard methodology for assessments of litter–habitat–wildlife interactions and impacts to compare data across different locations and time.
6. Methods of seafloor litter monitoring
Unlike beach litter, which is readily accessible, and floating litter, which can be identified and monitored by simple and low-cost methods (Gutow et al 2018), the quantification of seafloor litter comes with a range of technical challenges, which rise with increasing water depth and remoteness of the study area.
Methodologies for the quantification of seafloor litter can be divided into those involving the collection of litter and those relying on in situ observations, either directly by humans or by using cameras mounted on a variety of platforms. Furthermore, different methodologies are required for shallow-water and deep-sea research.
In this section we describe and discuss the three main methodologies for seafloor litter assessments, data formats and management issues and end with a discussion of current and future possibilities and limitations to be overcome by model projections (see section 7). We critically consider achievements to date and the state-of-the-art technology for each main methodology, identify needs and propose steps for further progress, and try to anticipate what the future will bring in that field.
6.1. Shallow-water surveys
In shallow waters, SCUBA divers or snorkelers can make direct observations or conduct still image or video transects using weighted lines or by moving directly between waypoints. These surveys can cover small areas of seafloor in great detail, potentially focusing on accumulations of litter in hydrodynamic traps associated with seafloor unevenness, such as rocky outcrops or coral reefs (Katsanevakis and Katsarou 2004, Bauer et al 2008, Abu-Hilal and Al-Najjar 2009). They enable direct observation of litter–biota interactions (Katsanevakis and Katsarou 2004, Kipson et al 2015, Sheehan et al 2017, Nunes et al 2018, Patterson Edward et al 2020), collection of physical samples for inspection (Sheehan et al 2017), manipulation experiments (Parrish and Kazama 1992, Katsanevakis et al 2007, Baeta et al 2009) and spontaneous adaptation of surveys if interesting processes or features are observed as well as the involvement of citizen scientists (Bauer-Civiello et al 2018; Consoli et al 2020a). However, the depth and area that can be covered by such surveys are limited by air supply, field conditions (water turbidity, temperature) and safety considerations. The typical maximum depth of such surveys is 20–40 m and quantities recorded ranged from 11.0 to 24.2 items km−2 in the North Sea and 3.1–10.4 items km−2 in the Baltic Sea (Kammann et al 2018). The integration of litter observation as additional parameter in on-going surveys for other purposes, such as biodiversity assessments, may provide cost-effective monitoring. As on the deeper seafloor, TUCs and (mini-)ROVs or underwater drones can be employed, with the advantage that these can be low cost platforms and vehicles with a limited depth rating. ROVs and TUCs are touched upon in more detail in section 6.3.1.
6.2. Trawl surveys: outcomes, strengths and weaknesses
Numerous studies on the distribution and composition of seafloor litter have made use of standardised trawl surveys designed for large-scale fish stock assessments (figure 4(b)). Many European countries record litter items in catches as part of other environmental monitoring activities, e.g. the ICES IBTS (Moriarty et al 2016) and the MEDITS (Bertrand et al 2002a, Fiorentino et al 2013). For MEDITS, a common protocol in line with the requirements of the MSFD was established in 2013 for the voluntary collection marine litter data (Fiorentino et al 2013). Therefore, systematic litter data collection from bottom trawling monitoring is rather recent, especially when compared to bottom fishing records (Kirby 2004, Thurstan et al 2010, Sampson 2011) or even some monitoring efforts on the status of specific benthic habitats (Ardizzone et al 2006).
While early studies of marine litter were mostly snapshots of occurrence on the seafloor (Jewett 1976, Feder et al 1978, Bingel et al 1987, June 1990, Galil et al 1995), systematic spatially distributed investigations using trawls, which allowed the determination of sources and accumulation were first published in 2000 (Galgani et al 2000, Moore and Allen 2000). Driven by the cost-efficiency of on-going trawl programs, standardised monitoring protocols have therefore produced time series allowing trend analyses for the last ∼20 years (Schulz et al 2015, Maes et al 2018) and have helped to identify seafloor litter sources not only generically but also in terms of geographically defined source regions (Wei et al 2012, Ramirez-Llodra et al 2013, Ioakeimidis et al 2015, Neves et al 2015, Lopez-Lopez et al 2017, García-Rivera et al 2017, 2018, Kammann et al 2018, Urban-Malinga et al 2018). Inspection of the physical samples caught in the nets enables source allocations in some cases. Litter densities reported from trawl surveys range from 50 to 289 items km−2 on the French continental shelf and canyons of the Mediterranean Sea (Gerigny et al 2019), to 2840 items km−2 in the northern Gulf of Mexico and 0–1835 items km−2 in the North and Irish seas (Maes et al 2018).
Despite all the progress reported above, some issues in trawl surveys remain. For instance, some litter, especially that which is low-density could easily be transported from one location to another by the action of bottom currents or bottom fishing gear, leading to highly dynamic scenarios. The use of trawls originally designed for fish stock assessments likely underestimates the total litter abundance and distorts these data, as small items can pass through the net mesh (Watters et al 2010). In addition, bottom trawls are not always in constant contact with the seabed and can get temporarily stuck on bottom features and also stay on the seafloor for some time prior to recovery. Therefore, trawls are considered semi quantitative sampling gears for benthos (Eleftheriou and Moore 2005), which should also apply to litter assessments. Acoustic devices can improve the accuracy of area swept estimates, helping to measure sampling effort.
Another aspect is that trawl surveys cannot be used in several areas due to the risk of catching and bringing up unexploded munition dumped during and after wars in years 1918–80. Globally, it is estimated that around 1 Mt of chemical weapons lie on the ocean floor (Curry 2016) and these pose another risk both for marine and human life (Greenberg et al 2015). Regionally, e.g. in the North Sea and Baltic Sea, the amount of conventional and chemical munitions is estimated to 1.3 millions and 385 000 tons, respectively (Bełdowski et al 2019). Although dropped bombs, grenades, torpedoes, land mines and other ammunition types are now widely distributed across the seafloor (Bełdowski et al 2016), specific dumpsites are generally known and can be avoided (Szarejko and Namieśnik 2009, OSPAR Commission 2010, Noack 2018, Miętkiewicz 2020). Thus in unexplored depths of known war regions visual (and acoustic) surveys should be the first option.
A wide range of types of trawling gears have been used to sample seabed litter (table 1) and it is also well established that different gear types have a different catch efficiency and sample areas (Fiorentini et al 1999, Bertrand et al 2002b, Kammann et al 2018). EMODnet Chemistry registered 13 different types of trawling gears used for data collection (www.emodnet-chemistry.eu/welcome), whereas ICES describes 52 bottom-touching gear types (https://vocab.ices.dk/?ref=2) (table 1). These different gears were designed to be efficient to survey different components of marine life and ground types (e.g. muddy, sandy or rocky beds, shallower or deeper).
Table 1. Gears used in IBTSs as identified by ICES (left column, https://vocab.ices.dk/?ref=2) and those in the EMODnet database (right column, www.emodnet-chemistry.eu/welcome). The overall design, mesh size and operational/technical details for each gear type could influence litter catchability. Most acronyms are spelt out in the corresponding row. Other acronyms are: GOC; GOV; SOV, from Soviet, only used by the Russian Federation between 1976 and 1982 in the NS-IBTS survey; TV; TVL; TVM; TVS. See also the list of acronyms at the end of the paper.
| ICES (52) | EMODNET (13) | |
|---|---|---|
| 1 | AAL—Bottom trawl net Aalhopser | – |
| 2 | ABD—Aberdeen 18 ft trawl | – |
| 3 | BAK—Baka trawl | Baka trawl |
| 4 | BMT—Beam trawl | Beam trawl |
| 5 | BOT—Bottom trawl | Bottom trawl |
| 6 | BOX—Boris 'Goshawk' box trawl | – |
| 7 | BT2—Beam trawl 2 m | – |
| 8 | BT3—Beam trawl 3 m | – |
| 9 | BT4—Beam trawl 4 m | – |
| 10 | BT4A—4 m beam trawl, aft | 4 m beam trawl, aft |
| 11 | BT4AI—4 m beam trawl, aft -in Irish Sea q3 BTS | 4 m beam trawl, aft—in Irish Sea q3 BTS |
| 12 | BT4P—4 m beam trawl, port | – |
| 13 | BT4S—4 m beam trawl, starboard | – |
| 14 | BT6—Beam trawl 6 m | – |
| 15 | BT7—7 m beam trawl | 7 m beam trawl |
| 16 | BT8—8 m beam trawl | 8 m beam trawl |
| 17 | CAR—Bottom trawl FGAV019 | – |
| 18 | CHP—Cod hopper | |
| 19 | COM—Commercial trawl with sprat bag | – |
| 20 | DBT—Danish bottom trawl | – |
| 21 | DT—Russian bottom trawl | – |
| 22 | ESB—Estonian small bottom trawl | – |
| 23 | GOS—GOV small | – |
| 24 | GOV—GOV trawl | GOV trawl |
| 25 | GRT—Granton (otter) trawl | – |
| 26 | H12—Herring bottom trawl 120 feet | – |
| 27 | H18—Herring bottom trawl 180 feet | – |
| 28 | H20—Herring ground trawl (HG20/25) | – |
| 29 | HAK—Hake-4 m (bottom trawl) | – |
| 30 | HOV—High opening bottom trawl | – |
| 31 | HT—Herring bottom trawl | – |
| 32 | INT—Industrial trawl | – |
| 33 | JDT—Jackson trawl, modified otter trawl | – |
| 34 | LBT—Latvian bottom trawl | – |
| 35 | LCT—Lithuanian cod trawl | – |
| 36 | NCT—Norwegian Campell trawl 1800/96 | Norwegian Campell trawl 1800/96 |
| 37 | P20—Herring bottom trawl (P20/25) | – |
| 38 | PAR—Pair trawl | – |
| 39 | PHT—Portuguese high headline trawl | – |
| 40 | PORB—Porcupine baka | Porcupine baka |
| 41 | RAPIA—Modified beam trawl with a rigid mouth | – |
| 42 | ROT—Rock hopper otter trawl | – |
| 43 | SON—Sonderborg trawl | – |
| 44 | SOV—SOV-NET | – |
| 45 | TV-3—Bottom trawl TV-3 930# | – |
| 46 | TVL—Large TV trawl | Large TV trawl |
| 47 | TVM—Bottom trawl TV-3-280 x 80 | – |
| 48 | TVS—Small TV trawl | Small TV trawl |
| 49 | US4—US 4 Seam 3 Bridle | – |
| 50 | VIN—Vinge trawl | – |
| 51 | W2A—Western IIA (otter trawl) | – |
| 52 | Y36—Yankee #36 (bottom trawl) | – |
| – | – | GOC 73 bottom trawl |
The high diversity of gear types used among regions, programs and studies seriously hampers cross comparisons of litter quantity based on data obtained opportunistically from such programs. For instance, figures 5 and 6 illustrate how different countries in Europe have used different gears across their fleet for the 2006–2019 period, and which gears are used in different geographical areas, respectively. In order to standardise this method, MEDITS promotes the use of a newly designed single trawling gear, GOC 73, in all surveys (https://cobmedits2012.wordpress.com/goc-73/).
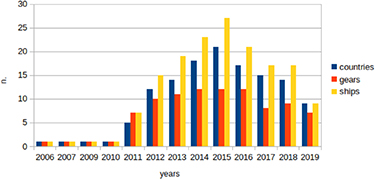
Figure 5. Number of countries, gears and ships reporting data on seafloor litter in Europe from 2006 to 2019. Countries include Belgium, Croatia, Denmark, Estonia, France, Germany, Greece, Ireland, Italy, Latvia, Lithuania, Montenegro, Norway, Poland, Portugal, Romania, Slovenia, Spain, Sweden, The Netherlands, United Kingdom (England) and United Kingdom (Scotland). Data for 2019 are still incomplete (worked out from www.emodnet-chemistry.eu).
Download figure:
Standard image High-resolution image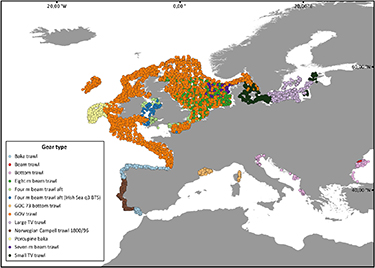
Figure 6. Geographical distribution of operations of different trawling gears providing data on seafloor litter in Europe during the 2006–2019 period (modified from www.emodnet-chemistry.eu).
Download figure:
Standard image High-resolution imageAlthough trawl-based litter data could be reported as items km−2, g km−2, items haul−1 or g haul−1, litter quantities are usually referred to in terms of haul or hour. This further renders comparisons between studies difficult. Commonly, weight is only provided when there are many small pieces too numerous to count (figures 7(a)–(d)). How to deal with outliers (Fleet et al 2020) and identifying the geostatistical methods best suited to the observed frequency distributions are further questions of crucial importance. Recent studies stepped forward to model-based predictions of seafloor litter densities using trawl data (Lopez-Lopez et al 2017, Gutow et al 2018). Such approaches can be regarded as advantageous low-cost methods to identify litter hotspots and locations representative of the background situation, however these have to be groundtruthed and monitored on a long-term basis in order to produce time series of seafloor litter and enable trend analyses. Furthermore, the disturbance of seafloor habitats by trawling is often considerable and therefore trawling to monitor and survey litter must deserve appropriate consideration.
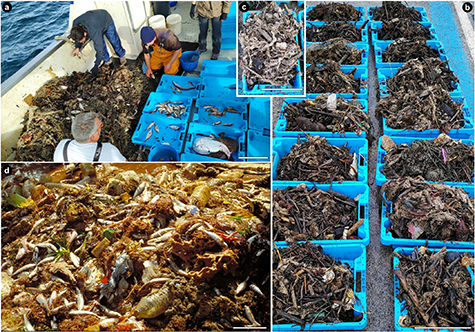
Figure 7. Trawling for litter. (a), (b) and (c) Massive litter catch after a 20 min tow at about 60 mwd in 2019 off the northern coast of Catalonia, Spain. Note the large disproportion in between litter and fish in (a). A large part of the litter catch consisted of cleansing wipes and sanitary towels followed by plastics and textiles as shown in (b) and (c). Photographs by GRC Geociències Marines, Universitat de Barcelona, Spain. (d) Seafloor litter caught in 1995 after a 15 min tow, at 40 mwd off the city of Marseille, France. Abundant plastic items appear mixed with vegetal fragments and fish. Recent surveys (Gerigny et al 2019) have shown that densities in the area have not changed for the last 25 years. Photograph by IFREMER, France. All scale bars are 30 cm.
Download figure:
Standard image High-resolution imageSome of the limitations of trawl surveys are difficult to overcome (e.g. the changing nature of the seafloor, the low-catchability of highly mobile light-weight litter) but there are many improvements that, if implemented, would lead to more robust datasets. They range from agreeing on using specific litter-catching gear following calibration tests; applying standardised protocols when trawling for litter, and also when counting, weighing and classifying litter catches; and reporting conventions. ICES (2011, 2012) did develop standardised monitoring protocols of bottom trawl surveys for the North and Baltic seas, and for the North-East Atlantic, which have been used since 2011, however trawl gear differs between marine regions, because of different substrate types and fish stocks. Most importantly, the use of seafloor non-ploughing gear vs. ploughing gear deserves attention. Dederer and Schulz (2016) found significant differences in the catchability of benthic litter when comparing beam trawls, otter trawls and non-ploughing fishing gear used for cod. In Europe at least, this issue can be considered only in a top-down directive, possibly as a detailed protocol for Descriptor 10 (marine litter) of the MSFD. Clearly, method harmonisation should be given urgent prioritisation.
6.3. Visual surveys: outcomes, strengths and weaknesses
Significant advances in underwater image technology have provided new opportunities to observe and study the marine environment in a wide range of research disciplines, from geology to animal behaviour at different spatial and temporal scales (Durden et al 2017, Parga Martínez et al 2020) and for habitat mapping programmes (Bo et al 2011, Buhl-Mortensen and Buhl-Mortensen 2017). Seafloor imagery is increasingly being used to study the abundance and distribution of debris on the seafloor as well as its interactions with marine organisms (figures 4(a), (c) and (d), and figures 8(a)–(d)) (see section 5).

Figure 8. Seafloor litter images obtained with ROV or HOV in a variety of submarine settings. (a) Accumulation of natural and artificial debris, including ropes and plastic fragments, on a large fine mesh net lying on the seafloor at 497 mwd in the Pacific Ocean off eastern Japan. Natural debris mainly consist of whitish sea urchin carcasses. Sea stars, sea anemones, gastropods, a swimming shark and other non-identified organisms can also be observed. Photograph taken with Hyper-Dolphin ROV by JAMSTEC, Japan. (b) Accumulation of plastic items at 715 mwd in La Fonera Canyon floor (Northwestern Mediterranean Sea) including plastic fragments in different stages of degradation, a water bottle and a supermarket basket on a Brissopsis lyrifera sea urchin field. Photograph taken with Liropus II ROV by GRC Geociències Marines, Universitat de Barcelona, Spain (modified from Tubau et al 2015). (c) Solitary plastic bag on the bottom of the Calypso Deep, the deepest place of the Mediterranean Sea, found at 5109 mwd in 2020. Photograph taken with Limiting Factor DSV HOV, courtesy of Caladan Oceanics. (d) Large metal barrel found at 1545 mwd in the floor of Cap de Creus Canyon, where a Munida tenuimana shelters. Photograph taken with Liropus II ROV by GRC Geociències Marines, Universitat de Barcelona, Spain (modified from Tubau et al 2015). All scale bars are 15 cm.
Download figure:
Standard image High-resolution image
There are strengths and weaknesses in using image-based systems for litter quantification. Advantages depend on the specifications of the platform used, are that in situ imagery can be obtained from all depths and landscapes, including those that are not accessible to bottom trawls, together with the capability to obtain precise geo-referencing of each litter item. In addition, these methods allow small-scale observations, which are important, for example, to identify litter–biota interactions (figures 4(a), (c) and (d)) (Mordecai et al 2011, Parga Martínez et al 2020) and accumulation areas (figures 8(a), (b)) (Tubau et al 2015). Furthermore, if properly operated, image-based systems are harmless to benthic organisms.
Two potentially significant disadvantages of the image-based approach to seafloor litter quantification are, first, that the minimum size of litter that can be identified depends on the resolution achievable by the cameras and, second, that only seabed-exposed litter can be observed (figure 8). Items covered by sediments, or entrained within seagrasses, coral reefs or fine-scale rocky structures cannot be detected. Physically sampling and bringing litter items for onboard examination also is severely limited, as it represents additional operations that are potentially complex (e.g. to minimise entanglement of the camera platform) and volume-limited for most platforms and strategies used for video surveys. One way of partially minimising this limitation is placing litter samples within seabed lift boxes that are subsequently released to the sea surface for final recovery.
On a general level, seafloor-imaging surveys may easily underestimate litter items, especially when a significant proportion of them are buried, blended within accumulations of litter formed by mixtures of land- and marine-sourced litter items and natural debris 'hotspots' (Tubau et al 2015). In addition, some objects could be hardly identified by conventional imagery, e.g. white fragments, which may easily be confused with shell fragments.
6.3.1. Platforms for image acquisition of marine litter
6.3.1.1. Remotely operated vehicles (ROVs)
Early on, ROVs used for science were often work-class, industry vehicles that were retrofitted for scientific purposes (Dawe et al 1998). Institutions such as IFREMER in France, JAMSTEC in Japan, and MBARI and WHOI in the USA, were the first ocean research organisations to design and develop purpose-built scientific ROVs (Newman and Robison 1992). The early development of scientific ROVs led to many usage standards that are still fundamental today (Newman and Robison 1992, Chaffey et al 1993, Newman and Stakes 1994). While technologies have changed and retrofitting commercial ROVs is once again in fashion, several key concepts have stood the test of time, including:
- Cameras and lighting capabilities offering high image resolution and scene visualisation. Several cameras are used to provide scientists and ROV pilots multiple views of the scene surrounding the ROV.
- Variety of core sensors that include at the very least position, depth, temperature, salinity and oxygen and the ability to host more sensors.
- Video, still imaging, and data logging systems are time-synced so that data logged from sensors and imagery are continuously correlated.
- Universally adopted sampling devices (i.e. push cores, detritus samplers, suction pumps).
ROVs have proven useful in detecting litter occurrences, types and arrangements, and patterns of depth and areal distribution (Miyake et al 2011, Ramirez-Llodra et al 2011, Schlining et al 2013, Pham et al 2014, Ioakeimidis et al 2015, Tubau et al 2015). In addition, ROVs have been utilized to sample microplastics in deep-sea sediments and observe mechanisms for their transport into the deep ocean (Van Cauwenberghe et al 2013, Woodall et al 2014, Katija et al 2017). ROVs offer many of the same opportunities for litter observation (figures 4(a), (c) and (d) and 8(a), (b) and (d)) as HOVs (see further down) but have additional advantages including extended bottom time, lower costs, less health and safety considerations, improved in situ visualisation of the environment, and the ability of the entire science team to participate at once, in real time, even from onshore via telepresence. This is why, currently, ROVs are the most widely used platforms for seafloor litter monitoring at depths beyond those reachable by SCUBA diving. ROV-based surveys provided litter density estimates ranging between 1200 and 7100 items km−2 off the Ryukyu Islands, NW Pacific Ocean (Shimanaga and Yanagi 2016), 1100 items km−2 in Portuguese submarine canyons (Mordecai et al 2011), and 8090–15 057 items km−2 in deep submarine canyons of the NW Mediterranean Sea (Tubau et al 2015). But the highest densities ever reported in the global ocean are the 121 000–1.3 million items km−2 found in Messina Strait submarine canyons in between the southern tip of the Italian Peninsula and Sicily (Pierdomenico et al 2019). Quantities are often presented as number of items km−1 (i.e. along track), which makes comparison with data presented as number of items km−2 difficult (Pham et al 2014). In addition, the width of the observations is sometimes not indicated and therefore comparison with other studies becomes difficult.
In addition to large-scale surveys, ROVs can be used to assess litter–fauna interactions (see section 5), for manipulated field experiments, and, through combination of data with parameters measured by other sensors (e.g. current velocity), deduce processes underlying litter abundance. The longer-term fate and integrity of litter on the seafloor can also be studied via repeated visits of litter items (Carr 1988). The collection of physical samples via suction devices enables inspection and source determination as well as assessment of degradation and fouling processes (Taylor et al 2014; Meyer‐Kaiser et al 2019).
A drawback of using work-class ROVs for such survey work, however, is that they often require large control rooms, special winches, and large teams comprising engineers and several pilots per shift. This is a particular concern for ROV work on small research vessels. Luckily, modular designs and semi-automated tasks have allowed reducing otherwise large operating teams to a minimum (e.g. www.argomaris.com/tecno_en.html).
For obtaining quantitative estimates of the abundance of seafloor litter, ROVs are typically equipped with lasers (figure 4(a)). Paired camera-mounted lasers with a known distance between them are regularly used to estimate transect width. Also the size and shape of objects that pass between the lasers with an orientation perpendicular to the camera can be measured accurately (Davis and Tusting 1991, Dunlop et al 2015). Then image processing can be applied to detect the laser points and calculate the pixel-to-cm ratio (Schoening et al 2015). By using a 4 or 3 point laser system, accurate size and area measurements can be made throughout the field of view and a perspective grid can be generated and superimposed over the image (Davis and Tusting 1991). Alternatively, calibrated stereo camera systems can be used to provide accurate length and volume calculations throughout the visual field, without regard to orientation of the objects to the camera (Dunlop et al 2015, Boutros et al 2015). Stereo camera systems may be particularly useful in areas with highly uneven terrain where vehicle positioning is often suboptimal.
Quantitative data can be collected using video transects or still images from ROVs. In video transects the area surveyed can be calculated with known or estimated transect widths (field of view) and lengths via transect start/end latitude and longitude (Barry and Baxter 1993, Adams et al 1995, Lundsten et al 2009, Kuhnz et al 2014). Again, the type of ROV determines the availability and accuracy of navigational data. Some ROVs do not provide this information and scientists are forced to use the ship's position for ROV transect start and end locations, which reduces the accuracy of transect length measurements as ROVs usually move off the theoretical track. Other ROVs, such as MBARI's ROVs Doc Ricketts and Ventana provide very accurate navigation from USBL sampled at 2 s intervals. Likewise, many ROVs cannot hold constant altitude, speed and camera focus, and these limitations affect the quality of the quantitative data that is collected. More advanced ROVs will have automated precision navigation capabilities.
Motion blur, an artefact of poor camera quality, lighting and vehicle speed, also affects the ability to use the video data for quantitative analysis of seafloor litter. Photographs from still image cameras or video frame grabs can also be used as pseudo-quadrats if the area of the image can be calculated by using a calibrated laser system (see above), a pair of calibrated laser lines (Dias et al 2015), or by using camera altitude above the seafloor and logged camera parameters (Durden et al 2016). Barry and Baxter (1993) and Durden et al (2016) discuss methodologies for assessing ROV's capability and developing ideal sampling strategies for acquiring ecological data that are of similar relevance for quantifying seafloor litter data.
6.3.1.2. Autonomous underwater vehicles (AUVs)
The past two decades have seen a steady increase in the use of AUVs in a variety of ocean studies, including physical oceanography, ocean chemistry, collecting high-resolution midwater video transects, and high-resolution seafloor mapping and imaging (Caress and Kirkwood 2001, Kirkwood et al 2001, Caress et al 2008, Chadwick et al 2010, Harvey et al 2012, Pennington et al 2016, White et al 2016, Clague et al 2017, Robison et al 2017), including searching for seafloor litter as illustrated by Ruhl (2013) in the Porcupine Abyssal Plain. In general, AUVs can reduce survey costs by lowering the number of support staff required and increase survey times, with the ability to be deployed from small, cost effective support ships. AUVs are pre-programmed to collect data for given sets of spatio-temporal parameters. For example, MBARI uses Dorado (Sibenac et al 2002) AUVs to collect 1 m resolution multibeam sonar data with mission durations of up to 18 h. Most AUVs are outfitted with forward-looking sonars that allow for detection and avoidance of approaching obstacles (Martin et al 2013). Using downward or oblique facing cameras and strobe packages, AUVs can take overlapping images of the seafloor at set intervals matched with vehicle speed such that complete photographic coverage of a swath of seafloor can be achieved (Singh et al 2004a, Martin et al 2013). These images can then be used individually as pseudo-quadrats, or with photogrammetry software to render georeferenced 3D reconstructions and mosaics of the seafloor (Williams et al 2010, Dunlop et al 2015, Durden et al 2016). AUVs can operate in the most extreme environments, including great depths and even under polar ice (Kunz et al 2008, Wulff et al 2016). For all the advantages of AUVs, at least one drawback is the lack of real-time monitoring. When errors occur with data collection, it is often not noticed until a mission is completed and the data have been reviewed that a failure becomes apparent.
Key components for successful collection of image data using AUVs include slow and constant vehicle speed, low altitude survey capabilities (2–5 m above the seabed), a high-resolution camera and lighting system that can illuminate the seafloor, and video or still cameras that capture images in relatively rapid succession, especially if seafloor mosaics are desired as these require ∼50% overlap per frame (Singh et al 2004a). Like ROVs, AUVs are outfitted with a variety of sensors that track and log location, depth, altitude, oxygen concentration, temperature and other parameters (Singh et al 2004b). Likewise, imagery, whether still or video, should be time-synced so that for each image/video frame, sensor data can be correlated. Stereo imaging AUVs have also been developed to survey benthic communities down to 800 m water depth (Williams et al 2010, Ling et al 2016). As mentioned for ROVs, calibrated stereo images can improve the accuracy of measured objects, calculated volumes, and the area of the visual field photographed (Dunlop et al 2015, Boutros et al 2015, Durden et al 2016).
6.3.1.3. Human occupied vehicles (HOVs)
Guided imaging of seafloor litter can be made by HOVs (Galgani et al 1996, Debrot et al 2014, Rodríguez and Pham 2017, Chiba et al 2018), which have also been employed to locate derelict fishing gear (Sutherland 1983, Carr and Cooper 1987, Stevens et al 2000). Litter quantities of 2700 items km−2 and 26 items km− 1 were detected off the ABC Islands in the Dutch Caribbean (Debrot et al 2014) and in the Faial-Pico Passage, Azores Archipelago (Rodríguez and Pham 2017), respectively. As deep seafloor exploration platforms, HOVs seem to have lost the race with ROVs and AUVs because of a number of reasons, of which a major one is avoiding risks for humans. Like other platforms, HOVs are limited to an operational depth defined by their constructional characteristics, but they are also limited in bottom time. Submersibles can be used to carry out vertical or oblique video transects of the seafloor, with litter items logged after each transect. These tend to be limited to a few hundred metres length. HOVs can be paused during a given transect and cameras focused and/or vehicle position modified to best image pieces of litter, or to observe the interactions between litter and organisms in detail (see section 5). HOV-supported imagery could be pivotal in determining the state and local impacts of litter accumulations or ghost fishing (Carr and Cooper 1987), although risk of entanglement for the HOV is of paramount concern. Additionally, the repositioning capability of HOVs can provide different viewing angles allowing investigating specific situations in more detail than from vertically facing cameras on some other platforms. For instance, litter within areas of complex seafloor topography or litter interactions with organisms often are more easily spotted from HOVs than from other platforms (figure 8(c)).
6.3.1.4. Towed underwater cameras (TUCs)
TUCs are another method for imaging seafloor litter. They are diverse in construction, but the majority of systems in operation take video and/or still images of the seafloor below and astern of the survey ship, and can operate for unlimited periods of time, receiving power and transferring the collected data via the winch cable in real time. Simple, easy to use and not requiring a large team to operate, towed cameras can collect extended swathes of data easily and have been used to obtain data on seafloor litter in a variety of settings (Schulz et al 2010, van den Beld et al 2017, Buhl-Mortensen and Buhl-Mortensen 2017, Parga Martínez et al 2020). TUC-based surveys have provided litter density estimates ranging between 279 items km−2 in the Norwegian Sea and 813–6717 items km−2 in the deep Arctic Ocean (Buhl-Mortensen and Buhl-Mortensen 2017, Parga Martínez et al 2020). Commonly the camera systems on such devices face vertically downward and film the seafloor from a height of 1–3 m. The field of view of the camera, its height above the seafloor and the course of the deploying vessel determine the region of the seafloor imaged. They are the most cost effective means for seafloor image exploration, in terms of initial and maintenance cost, survey speed and coverage and can be used from various sizes of ships. Flying and bottom contacting camera sleds hold the advantage that they can achieve large coverage in a fraction of time that would be required by ROVs. However, the field of view of camera sleds is limited due to the close proximity of the camera to the seabed, they lack manoeuvrability, and there is a high risk for collision in rough terrains. Towed and flying camera sleds hold the same advantages, but image scaling is harder to achieve due to the varying distance of the camera to the seabed during rough sea conditions and due to changes in bottom topography. However, this can be overcome by logging of altitude and lasers in the field of view as a size reference (Bergmann and Klages 2012).
6.3.2. Image handling: analysis, processing, annotation, management and tailoring
The application of imaging and video technology to detect, identify and quantify different kinds of litter in marine environments leads to large amounts of image and video data that must be archived, analysed and evaluated. The basic issue of archiving is addressed by publicly funded international databases such as PANGAEA (www.pangaea.de) or other national non-profit organisations. Different software systems for manual image and video annotation have been developed in the last 10 years, and most of them are available as open source. One example is the VARS for analysing video and images from a variety of platforms (Schlining and Jacobsen Stout 2006). A GUI front end and a database backend make VARS data entry, retrieval and long-term storage possible (Schlining and Jacobsen Stout 2006). Other very popular examples for manual image or ROI annotation are SQUIDLE, CATAMI, PAPARA(ZZ)I (Marcon and Purser 2017), ECOTAXA (Picheral et al 2017), BIIGLE (Ontrup et al 2009, Langenkämper et al 2017), and VARS (Schlining and Jacobsen Stout 2006). A review is provided in Gomes-Pereira et al (2016). Some systems have a particular focus (e.g. plankton classification in ECOTAXA) and some systems are designed more or less for general purpose such as VARS and BIIGLE2Go (Zurowietz et al 2019), and BIIGLE 2.0 (Langenkämper et al 2017), which is used for the litter time-series at HAUSGARTEN observatory (Tekman et al 2017). A very important feature of these tools is the implementation of hierarchical catalogues or dictionaries. The ability to apply the hierarchical relationships of categories allows for classification and searches on various levels of abstraction. For example, annotators may manually enter observations at the greatest detail, but they may wish to conduct a survey that utilises data at the material level because it is more meaningful to identify sources. This hierarchical system has, for instance, been employed by Schlining et al (2013) where litter was identified at a specific level (e.g. plastic crisp bag) but it could be queried for at a higher level (i.e. plastic, metal, wood, glass) so that various litter observations in MBARI's VARS database could be retrieved for further analysis at various levels of detail (Schlining et al 2013). Since the annotation of litter in images and videos has started recently, no standards for annotation catalogues and best practice protocols have been defined yet. Thus, experiences and recommendations like the RecoMIA guidelines (Schoening et al 2016) should be considered to increase efficiency and effectiveness in future projects.
Computational object detection aims at the detection and outlining of objects of interest in the images and has great potential to make image annotation more efficient and effective. Usually not much knowledge about litter exists prior to a visual inspection. In addition, many different classes of litter are of interest, all of them featuring different visual properties (size, shape, colour, texture) and a considerable intra-class variance. Thus, a system that marks and outlines general ROIs could be a helpful assistance for manual annotation done by human expert observers. For the purpose of object detection an algorithm inspects all pixels (or groups of neighbouring pixels) in one image and decides upon the degree of novelty, level of interest, or usefulness.
One way of object detection is based on learning a background model from observations (i.e. images/video). If the feature contrast between one pixel (group) and the background model (e.g. describing the seafloor) is strong enough, an object of interest is detected and marked in the image. Examples for such approaches can be found in Edgington et al (2003), Cline et al (2008), Möller et al (2016) and others. Recently, deep-learning algorithms have led to new approaches for the problem of object detection in benthic image data (Zurowietz et al 2018). As the success of such approaches depends on the availability of sufficient training data, citizen science-based object detection results have also been tested for training such deep networks as well (Langenkämper et al 2019).
Lessons are to be learnt from machine learning applications, neural and Bayesian networks, and similar innovative methods that have started being used for quick and automated processing of aerial or satellite images for beach and floating litter (Franceschini et al 2019, Gonçalves et al 2020).
6.3.3. Development needs for image-based monitoring
It is essential that image-based monitoring is harmonised so that results from different surveys made with different cameras can be compared. Despite the mentioned technological breakthroughs and software tools that can make the process of data annotation more efficient, other aspects of image interpretation have to be considered as well. Large-scale and temporal trend assessments of marine litter require agreed reporting units, validated data (i.e. image annotation accuracy) and a defined set of metadata and dictionaries (see above). These enable the use of harmonised datasets for data analysis and also inform about potential non-compatibility of data in order to avoid erroneous interpretations. Agreed coding and interoperability of databases both from the information technologies side and the content description including metadata sets are essential. At present, given the heterogeneity of data sources and collecting protocols, the available information is so variable that its integration for large-scale and trend assessments is still challenging. In Europe, the necessity of developing a collection system for compiling all the data in order to facilitate further analysis in the frame of the MSFD has been already recognised (Galgani et al 2013a, Molina Jack et al 2019). The creation of a comprehensive database portal system requires further efforts of homogenisation of existing formats (Galgani et al 2018a), in-line with data regulations such as INSPIRE and the needs of environmental protection frameworks. At international level beyond the EU there is currently no agreed database format for enabling future large-scale assessments. This should be part of a global Integrated Marine Debris Observing System (Maximenko et al 2019) including modelling support in order to assess litter pathways and trends at large scale (see section 7).
Acoustic surveys for mapping of larger litter items could potentially help to fill knowledge gaps. For example, in the Gulf of the Farallones side scan sonars detected 55 gallon drums (Karl et al 1994) and the same approach has also been useful to locate and retrieve large derelict fishing nets or pots (Havens et al 2011, Sullivan et al 2019). Also, a full-coverage multibeam bathymetric mapping survey in the Venice lagoon showed average densities of 7.5 items km−2 with highest levels in the Grand Canal near Venice and Chioggia (1161 items km−2) (Madricardo et al 2019). Another approach to assess litter on the seafloor, could be the use of hyperspectral camera technology, an approach that has been suggested for remote sensing of plastic debris floating at the ocean surface (Goddijn-Murphy et al 2018) and currently used for habitat surveys as well as sub-sea pipeline and archaeological inspection (Johnsen et al 2016). The method relies on a richer colour spectrum than afforded by the limited red-green-blue colour spectrum of the human eye or conventional cameras. Deployed from ROVs or towed platforms, it could for instance shine light on unidentifiable small white fragments that are hard to see on the seafloor and improve polymer or material classification. First trials were promising such that optical fingerprints may be used for automatic classification of plastic debris by computer algorithms (Nornes 2015).
7. Modelling quantities and pathways of seafloor litter: wishes and reality
Given the challenging character of collecting seafloor observations, it seems reasonable assuming that seafloor litter inventories will always remain under-sampled if based solely on sea-going activities. Hence, modelling is needed to interpret and spatially extend in situ observations so that future field research can be guided and potential hotspot and accumulation areas identified. Models on marine litter come in many varieties, from very simple budget-style mathematical equations (Koelmans et al 2017, Lebreton et al 2019) to full-blown simulations of plastic dispersion based on fine-resolution outputs from OGCMs (Lebreton et al 2018, Mountford and Morales Maqueda 2019, Onink et al 2019, Wichmann et al 2019). Regional approaches for surface macrolitter modelling are becoming available (Macias et al 2019, Miladinova et al 2020). All models, however, aim to represent a subset of reality (not the full reality) and that they start with assumptions simplifying the mathematical equations governing the problem (Hardesty et al 2017).
Models on transport and accumulation of marine litter rely on two sets of governing equations: those of the ocean flow and those of the litter items, of which transport-easing lightweight plastics are a large part on the seafloor, though possibly less than on beaches and floating at the sea surface. The first set is relatively well understood from the principles in the physical laws of fluids, and after decades of development the skill of hydrodynamic models that simulate ocean flow is fairly good. OGCMs with global coverage that resolve all flow above 1/12° are now routinely built, run and compared to observations from satellites and in situ measurements. Data from these simulations over time scales of decades is available publicly (Law Chune et al 2019), although the sheer amount of storage space needed to store these runs (tens of Terabytes) is often a challenge to cope with. The latest generation of global circulation models has even finer resolution (for example the new 1/100° global MITgcm run at NASA) and is able to resolve not only the currents but also tides and waves.
Advanced codes also exist to simulate the transport of virtual particles within this modelled ocean flow, in the so-called Lagrangian framework (van Sebille et al 2018), with the focus on plastics for obvious reasons. There are also models in the Eulerian framework, as illustrated by Mountford and Morales Maqueda (2019). However, the main difficulty lies in making these virtual particles 'behave like plastics' (van Sebille et al 2020). This is because the governing equations of plastic behaviour are far less known than those of the ocean flow. It is for example unclear how plastic particles in the real ocean fragment, how their density changes due to weathering and biofouling, or how they are mixed down in the water column and onto beaches by breaking waves. While efforts are underway to capture these biogeophysical and chemical effects on the plastic particle properties in models (e.g. in the OceanParcels framework) (Lange and van Sebille 2017), observational data to constrain these processes are severely lacking. Systematic collection of information on polymer type and, subsequently, density, would be helpful to understand plastic dynamics and density changes in the marine environment.
Furthermore, like any model, models of marine litter require initial conditions. For litter transport and dispersal models, these initial conditions are the amounts, the locations where and the times when plastics enter the oceans. While considerable effort is made to create data sets of plastic sources (Jambeck et al 2015, Lebreton et al 2017), many models (Maximenko et al 2012, Onink et al 2019, Steri et al 2020) assume, for simplicity, a uniform starting distribution of plastic over the global ocean. The lack of good data on when and where plastic enters the ocean (sources), combined with the limited understanding on the biogeophysical and chemical changes of plastic items in the ocean (Bond et al 2018), means that models typically focus on resolving relative patterns rather than absolute magnitudes of the distribution of marine plastics. Therefore, in order to obtain an inventory (e.g. an absolute distribution) of marine plastics, the models will need to be combined with observational data.
To do this, the spatial patterns of accumulation (convergence and divergence) from models can be regressed onto the observations to nudge the model solutions to the observations. In essence, the unitless spatial patterns that come out of modelling are hence combined with the sparse observations that do have units. However, even for the surface ocean (where the amount of observations is relatively high and OGCMs typically have highest skill), the correlations between observations and models are not very good. van Sebille et al (2015) showed that in the North Atlantic the correlation between observations and models is essentially zero. Furthermore, the final inventory depends strongly on which model is used, with, in some regions, a disagreement of more than a factor of 100 between different models. Likely, this is mostly an issue with the sources, although missing physical processes might also play a role in this discrepancy (Onink et al 2019).
Combining models and observations for seafloor plastic will be even more difficult than for the surface ocean. This is both because the processes that govern the sinking of plastic from the surface to the deep sea are very poorly understood (Katija et al 2017, Kooi et al 2017, Choy et al 2019, Tekman et al 2020), and also because the OGCMs typically have far less skill in the deep ocean than near the ocean surface. Most models work with fixed layers (so-called z-models) and the thickness of these layers typically increases from a few metres near the surface to tens to hundreds of metres in the abyssal ocean (Griffies et al 2000). This means that bathymetric features such as deep canyons and seamounts are very poorly represented in these models (Ramos-Musalem and Allen 2020), and that near-bottom flows are not resolved. Even the bottom Ekman layer, with a thickness of about 50 m, is often not well resolved in these fixed-layer models.
Another class of models exist (known as sigma-models) where the layers follow the terrain. These models, of which the so-called ROMS is the most prominent example, resolve the deep ocean flow much better. Even though these models are seldom run at global scale, they might be very useful tools at the local to regional scales they are designed for Jalón-Rojas et al (2019a). Nevertheless, these sigma-layer models are probably the most promising route for global-modelling of the transport of seafloor plastics. Plastics modelling can learn lessons in this respect from biologists studying the dispersion and connectivity of biota between hydrothermal vents (Vic et al 2018). While typically run at scales of a few hundred kilometres, the transport of biotic material between different hydrothermal vent fields can now be modelled with high accuracy, including the effect of breaking tidal waves on steep topography.
Yet, even with perfect hydrodynamic models, it will still be challenging to combine models and observations in order to obtain an inventory of seafloor litter. One reason for this is that the spatial heterogeneity of litter including plastics on the seafloor is likely much higher than on the surface ocean, although this might be challenged if it could be further demonstrated that some seafloor features, such as submarine canyon axes, behave as light litter concentrators (Tubau et al 2015). Would spatial heterogeneity be high, the number of observations needed will, therefore, be even higher than at the ocean surface. This poses certainly a challenge to the seafloor observation community.
A different approach, independent of hydrodynamic models, is that by Gutow et al (2018) who used Maximum entropy (Maxent) and RF to predict the distribution of seafloor litter in the southern North Sea as a function of bottom trawling intensity, distance to major shipping route, water depth, distance to coast, and bottom shear stress. Maxent was applied to presence data only whereas RF used presence/absence data. The models were not able to confirm any correlation between the occurrence of litter on the seafloor and any of the selected environmental variables. Accordingly, the authors were not able to clearly identify factors that sculpt the distribution of seafloor litter nor were they able to predict litter distribution. Notwithstanding, the results indicated that bottom shear stress was the most influential variable whereas trawling intensity was less important though the great majority of litter items originated from fisheries. The authors suggested that seafloor litter in the shallow shelf sea region of the southern North Sea is subject to intense post-deposition near-bottom dispersal.
The paragraphs above highlight the urgent need for quantitative assessments, which will help increase the amount of valuable background information that could be used for future model development, groundtruthing and also to satisfy some critical needs such as comparable information on litter quantity or property information such as e.g. buoyancy, shape and size (Kooi and Koelmans 2019). Actually, this touches the core aim of this paper: critically pointing to the elements that could help moving forward.
In short, modelling can be a very useful tool to complement, extrapolate and interpret sparse observations of seafloor litter (Jalón-Rojas et al 2019b), but a major effort is needed to create models that accurately resolve the near-bottom flow on a multiplicity of scales (from global to regional and local) and that incorporate realistic sinking of plastic items (Egger et al 2020). Whereas lessons can be learned from the community that models the connectivity of deep hydrothermal vents, the much larger spatial scales and longer time scales are complications unique to seafloor litter. Furthermore, it is still unclear exactly which type of observations of seafloor litter are most needed to constrain the models. Despite these drawbacks, an effort should be made soon to identify and fully incorporate modelling views and needs when defining future seafloor litter observation protocols and procedures, and also the much-needed Joint Litter Category List (Fleet et al 2020). Alternative approaches, such as the one by Gutow et al (2018) can also provide valuable insight. It is time to move forward from the current, essentially descriptive era to an era of in depth understanding and forecasting capabilities regarding seafloor litter.
8. Final recommendations
Although the number of studies on seafloor macrolitter has increased over the past decade, it lies still far behind the number undertaken in other environments and size classes (figure 2). One major drawback is that campaigns providing data on seafloor macrolitter were initially designed for other purposes. Two main methods have been used: bottom trawling and imagery, which have confirmed the seafloor as a major sink for marine litter. Nevertheless, due to limited survey efforts, it can be assumed that some major accumulation areas, e.g. in the deep sea, have yet to be identified. However, surveys have shown that in some locations litter concentrations reach densities comparable to landfills on land (figure 1) and warrant reflections on specific policy needs for minimisation and, whenever possible, remediation. Mapping of hotspot areas is therefore an urgent need. Likewise, the assessment of trends in the deep sea and in remote areas, such as the Polar Regions, needs to start in order to provide warnings and, eventually, invert trends. Furthermore, the assessment of different litter types, such as fishing gear, household litter, shipping-derived litter, construction and historical dumping requires specific approaches. The reduction of litter input through measures based on the identification of sources is a priority and eventual in situ removal activities must be carefully assessed.
The growing interest in marine litter, and its inclusion in legislative environmental protection frameworks, has led to an increase in the availability of monitoring and seafloor litter occurrence data. Still, due to methodological constraints, data are often not comparable. There is an urgent need to solve practical problems that prevent achieving a monitoring coverage that would support the needed policy implementation. This includes identification of litter pathways, sources and accumulation areas, and then monitoring their evolution over time in order to assess temporal trends and measure's effectiveness. International frameworks providing policy tools and large-scale agreements for action against marine litter require scientifically sound data for comparable assessments and prioritisation of efforts.
Newer methodologies, such as high-resolution ROV and AUV imaging, are being more widely employed but they also demand agreements on protocols and data formats in order to provide comparable data. Internationally agreed protocols should provide a common litter typology (Fleet et al 2020), size limits and ranges, survey transects and conduction parameters, methodologies for survey area quantification and other provisions for harmonised monitoring. For instance, defining the lower size limit of a particular method is essential but challenging. Automated analysis methods including image analysis through machine learning model development and analysis of large image data sets shall provide future opportunities for rapid, large-scale identification and monitoring of debris accumulation. The confluence of data from different survey types and data sources needs agreement on data units, formats, and consistent mandatory metadata. The management of such data, including the ingestion of data from different sources, as well as data accessibility and ownership, coding of data elements and mapping remains challenging and should be addressed immediately.
Modelling developments could provide crucial insight to understand litter transport and accumulation on the seabed, but this will first require understanding the basics of litter behaviour (especially plastics) in the water column and near the sea floor. The ROMS in particular might prove especially useful at the local to regional-scales. There are probably lessons to learn from other modelling approaches such as those targeting organism distribution, dispersal and connectivity across habitats on the seafloor. However, the diversity of spatial and time scales, often very large, unique to seafloor litter, poses additional challenges to modelling.
The establishment of agreed baseline concentration values for seafloor litter in its enormous variety is among the challenges towards an efficient protection of the sea and in particular deep-sea environments. For policy implementation, the development of threshold values for seafloor litter is being discussed (e.g. by the EU MSFD Technical Group on Marine Litter) and requires quantitative knowledge about seafloor litter abundance. In conclusion, a better understanding of the seafloor environment in order to properly assess the effects of human pressures, with the ultimate aim of mitigate them, is sorely needed to preserve the health of the ocean for future generations.
Acknowledgments
Recognizing the need to expand the focus of seafloor investigations, the significance of seafloor macrolitter, and the potential benefits of moving towards harmonised litter monitoring at large scale, the European Commission Joint Research Centre and the Alfred-Wegener-Institut, Helmholtz-Zentrum für Polar- und Meeresforschung organised a dedicated workshop. Discussions amongst experts in that field allowed identifying topics, needs, and possible ways forward towards better assessments of seafloor litter. This paper provides the outcome from that workshop, which was held in Bremerhaven, Germany, on the 30 and 31 of May 2018. Authors are grateful to Martina Pierdomenico and Daniele Casalbore from the National Research Council (CNR), and Francesco Chiocci from the University of Rome La Sapienza, Italy, for providing the pictures in figure 1, and to Caladan Oceanics for providing the picture in figure 8(c). Thanks are also given to J L Casamor and J Beerman for working out some of the figures. MC and ASV acknowledge support from Red BAMAR (ref. CGL2016-81854-REDT), a research network on marine litter sponsored by the Spanish Government; IDEM project (Implementation of the MSFD to the DEep Mediterranean Sea, agreement number 11.0661/2017/750680/SUB/ENV.C2), of the Directorate General for Environment of the EC; and CRG on Marine Geosciences (ref. 2017 SGR 315) of Generalitat de Catalunya autonomous government. EvS was supported by the European Research Council (ERC) under the European Union's Horizon 2020 research and innovation programme (Grant agreement 715386). TM acknowledges Estonian Environmental Investment Center projects 15425 (Marine litter in the small islands of Estonia) and 13382 (Monitoring of seafloor litter in coastal sea of Estonia, development of methodology and assessment for MSFD reporting). LW acknowledges support from Nekton, a not-for-profit research foundation and a UK registered charity. We sincerely value the comments of two anonymous reviewers, who improved an earlier version of this paper. This publication is Eprint ID 52860 of the Alfred-Wegener-Institut Helmholtz-Zentrum für Polar- und Meeresforschung.
Data availability statement
The data that support the findings of this study are available upon reasonable request from the authors.