Marine and Coastal Hazard Assessment for Three Coastal Oil Rigs
 Antonio Olita*†
  Leopoldo Fazioli† Costanza Tedesco Simone Simeone Andrea Cucco Giovanni Quattrocchi
  Alberto Ribotti Angelo Perilli
  Federica Pessini Roberto Sorgente
- Institute for the Study of Anthropic Impacts and Sustainability in Marine Environment, National Research Council (CNR-IAS) Oristano Section, Torregrande, Italy
A forecasting and hazard assessment system for oil dispersion from Italian oil rigs was set up within the framework of a national research project. The system is based on 3D hydrodynamic, mesoscale resolving models providing forcing fields for a Lagrangian module of oil dispersion and slick evolution (oil transport and transformation). The tool provides,daily, the outputs of numerical simulations of possible oil spills from extraction platform sites. In this work we present the results for the 3 platforms closest to the Italian coast. Aside the operational usage, the numerical outputs are also stored and adopted to compute statistics of the slick distributions in the coastal and marine areas of interest. The hazard was assessed by means of two different indices (Hazard Index and Occurrence Index) based on the operational system outputs, for the estimation of the hazard at sea (marine hazard or aerial hazard). As short forecasts (2 days long) often do not allow the oil to reach the coast, an extra set of long-period simulations has been performed in order to compute a third Hazard Index (Coastal Hazard Index) suitable to estimate the hazard along the shorelines. The adopted methodology allowed, as a whole, to assess both coastal and marine oil spill hazard due to oil spill extraction activities. The indices constitute a basic informative layer on which the environmental risk could be also evaluated, once opportunely combined with coastal vulnerability and sensitivity layers.
1. Introduction
Hazard and Risk, in the common language and in scientific communication also (Christensen et al., 2003), can be fuzzy words, often used mutually to indicate some generic danger that can affect and impact resources of interest (environment, human activities, economy, public health, private goods, etc.). On the contrary risk assessment literature neatly discriminate between the two concepts (e.g., Adams, 1995; Crichton, 1999; Eiser et al., 2012; Olita et al., 2012a). Hazard is a possible adverse event or threat that would negatively impact any biotic or abiotic part of the system under consideration (e.g., for instance the ecosystem).
On the other side, the risk can be defined as the probability of loss, where such loss can be both in quality (quality of the environment, quality of life, quality of the waters) and quantity (money, biodiversity, health, usable coast, and land). This risk definition always implies an associated uncertainty, linked to the probability that the adverse event (the hazard, as above) would actually occur.
In the middle, between hazard and risk, there is the concept of exposure or vulnerability (Gundlach et al., 1978; Castanedo et al., 2009), i.e., the part/aspect of the system that can be eventually affected by the hazard took in consideration. In facts, the vulnerability represents the sensitivity to a given hazard and is related to the hazard nature and to the kind of risk (e.g., environmental, societal, public-health) that is subject to evaluation. While one can describe hazard in an objective way, as it can be associated to the probability that an adverse event would occur, the vulnerability can be assessed almost only through an expert-based evaluation, i.e., some skilled people has to assess how much a given area/environment/humankind aspect can be negatively affected by a given hazard: the risk is therefore the combination of such two information layers, hazard and vulnerability, the former easier to be computed quantitatively. It is interesting to notice that the risk can change as soon as it is described and quantified (Olita et al., 2012a) and results disseminated; in fact, as an example, the dissemination of the risk evaluation results can change the stakeholder awareness, which is a factor that could and should take part of the vulnerability assessment. In the present paper we focus our attention to the hazard estimation related to potential oil spills occurring at sea, due to extraction activities.
Oil spill Hazard, subject of the present work, can be assessed in several ways. One of the most popular and effective methods, adopted in the last years for oil spill related issues, is the use of modeling tools (Nelson and Grubesic, 2018, for a recent review) to produce simulated data on which perform statistics for hazard (risk) estimations. Such statistics often just concern the oil densities on coastal elements i.e., the density of stranded oil weighted on a discrete (cells, nodes, coastal stretches) coastal line (e.g., Olita et al., 2012a; Sepp Neves et al., 2015). In other cases the objective is to assess the hazard in the marine area, i.e., to observe where it is most probable that adverse events would occur. We consider that, in different circumstances, both kind of hazard maps would represent relevant information for final users of such products (i.e., local public institutions devoted to pollution prevention and mitigation actions). The methodological approach here adopted allows to estimate both the marine and the coastal hazard. In the next section we briefly describe the methodology. In section 3, we show results about hazard estimation, while section 4 summarizes the entire work and draws the conclusions.
2. Methods
Figure 1 shows the location of the three extraction platforms that were chosen as test cases for studying the hazard distribution in marine and coastal environment because of their proximity with the coast.
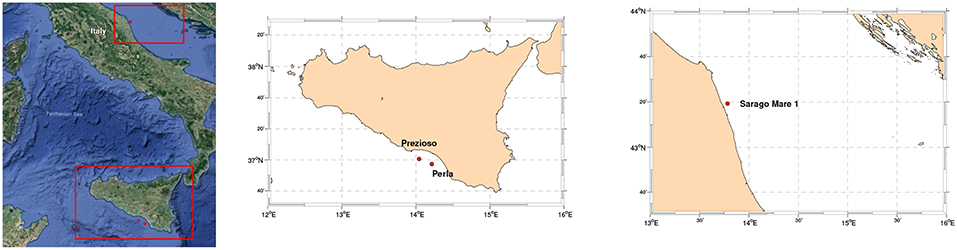
Figure 1. Localization of the three extraction platforms object of study (Left) in the Italian seas; Zoom in the Sicily Strait (Central, Prezioso and Perla platforms) and in the Adriatic Sea (Right, Sarago Mare platform).
In order to estimate marine and coastal hazard, we performed statistics on different sets of data produced by different numerical simulations, operational, and standalone, respectively, hereafter described.
2.1. Numerical Systems
The system for the production of hazard indices encompasses different parts:
a) a numerical model for hydrodynamics
b) a lagrangian model, feed by the hydrodynamic fields produced by the numerical model, to simulate the fate of the oil
c) geo-statistics on the lagrangian model outputs
d) mapping in GIS environment.
For what concerns the Sicily Channel platforms, the numerical oceanographic model is based on the Princeton Ocean Model (POM; Blumberg and Mellor, 1987) implementation in the Sicily Channel and Tyrrhenian sea, fully described in Ribotti et al. (2019). This implementation is the evolution of the oceanographic prediction tool already validated and described in Olita et al. (2007), Sorgente et al. (2011), Olita et al. (2012b), and Fazioli et al. (2016).
In the operational implementation (functional to the project objectives), daily 5−days forecasts are produced and hourly fields are stored to feed the oil slick module (MEDSLIK-II, De Dominicis et al., 2013a,b). Forty-eight hours long forecasts of oil spill fate (dispersion and weathering processes) are then produced using standard oil types, location and quantities fully described in Ribotti et al. (2019).
Such outputs are stored in a digital archive to build the database (1 year of data from January 2017 to January 2018). This dataset allowed to compute the statistical indices described in the following subsection that estimate the hazard for the marine area around the dispersion site co-located with oil rigs. The hazard estimates are therefore related to a 2-days window of possible oil dispersion.
On the other hand, the standalone implementation of the system allowed to perform longer simulation of oil dispersion by using daily hydrodynamic fields, which were in turn produced by a 1−year long hindcast. In this implementation the model received surface forcing from a set of 1st day atmospheric forecasts, the same used for the operational implementation and described in Ribotti et al. (2019), while boundaries data consisted in the Analyses (i.e., simulations assimilating observations) of the Mediterranean Forecasting System (MFS, Tonani et al., 2009) retrieved via the Copernicus Marine Environment Monitoring Service. Based on the daily outputs, 7−days long oil dispersion simulations have been performed with a frequency of 15 days for the entire year, then obtaining twenty four 7−days long simulations for each extraction platform. This simulation setup allowed the oil to reach the coast and to have a robust database to build statistics on coastal densities of beached oil.
Operating the statistics from two different set of simulations could be avoided if the operational run would simulate more than 48 h. By the way, having a daily operational system forecasting 7 days of oil spill is extremely demanding from the computational point of view as well as for what concerns the data storage. So, we opted for such a compromise (i.e., a short forecast for operational system and a longer run for the standalone simulation) in order to estimate the three proposed indices.
Simulated oil initial conditions were the same as described in Ribotti et al. (2019). For what concerns the system for the Adriatic platform, the only differences with the Sicilian implementation stand in the numerical model providing the hydrodynamics fields forcing the lagrangian oil module; for the Adriatic oil rigs the outputs of the above cited MFS, in its last version at 1/24 of degree of resolution, were used to drive the oil spill model.
Geo-statistics to determine oil densities and probabilities for the discretized marine/coastal cells are performed in MATLABTM and QGIS.
Finally mapping was also performed, for marine and coastal hazard rispectively, in MATLABTM and QGIS environment. For every map produced, a GIS-compatible and geo-referenced format was generated.
2.2. Hazard Indices
Two different indices were used to describe marine hazard: the Hazard Index (HI) takes into account the oil densities for each given contaminated cell; the second, Occurrente Index (OI), just takes into account the percentage of occurrence of the contaminant for a given cell, thus describing the probability that a cell is contaminated, disregarding the relative quantity of the oil. Cells are defined as squares of 300 m of side (90000 m2), that is a resolution twice the original resolution of the oil module output (150 m of side, 22500 m2). The indices, respectively named Hazard Index (HI) and Occurrence Index (OI), for each mesh of the grid, are computed as follows,
where x is the 48-h averaged concentration at a given cell ij and n is the number of forecast cycles (i.e., 365 days in our case study). For HI we applied a filter of the 99th of percentile to exclude the long tails of the distributions, mainly due to numerical issues, then the index was once again normalized to obtain final values ranging between 0 and 1 (dimensionless).
where y is the number of times a given cell is contaminated at least once within a forecast cycles and for the entire cycles series (n is the number of forecast cycles as in Equation 1)
On the other hand, coastal hazard was computed discretizing the coastline (GSHHS database, Wessel and Smith, 1996). We realized two versions of the index, discretizing the coastline respectively in cells of 150 m of side and 2km of side. This second version is here presented and shown, in virtue of its better graphic readability.
For every cell, the Coastal Hazard Index (CHI) was computed by using a similar formula as for Equation (1). So,
where X is the averaged 7−days concentration recorded for a given cell and m is the number of 7−days simulations performed (twice per month for a whole year, i.e., 24 simulations per site).
Differently by the previous two indices, for the coastal index the term of Equation (3) is the absolute maximum, taking in consideration all the simulations (not separately). This means that CHI quantities are comparable in absolute terms between Sicily and Adriatic estimates.
3. Hazard Maps
In the following subsection we present the maps for marine and coastal hazards, expressed through the three indices described above. Concerning marine hazard, for each separated source, a single map was generated, while for coastal hazard we computed index/map for the two platforms of the Sicily coast as the two Sicilian sources generate coastal densities that can be easily superimposed each other in a single map.
3.1. Marine Hazard
Figures 2–4 represent the Hazard maps for Sarago Mare (Adriatic Sea), Prezioso (Sicily Channel), and Perla (Sicily Channel) platforms, respectively. Left panels represent the HI while right panels represent the OI for a 48 h window.
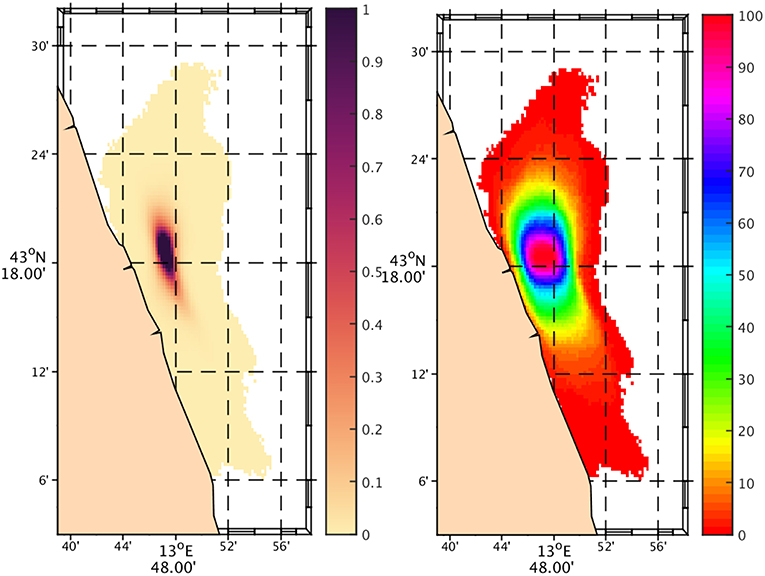
Figure 2. Sarago Mare platform, Adriatic Sea. (Left) 48 h Hazard Index, HI; (Right) 48 h Occurrence Index, OI.
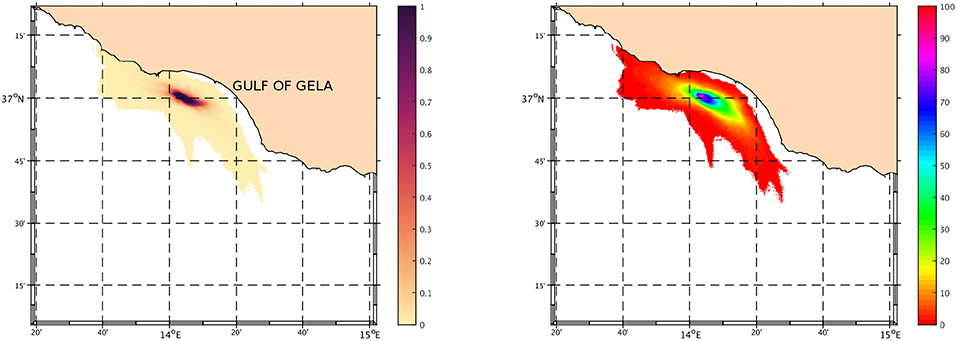
Figure 3. Prezioso platform, Sicily Channel. (Left) 48 h Hazard Index, HI; (Right) 48 h Occurrence Index, OI.
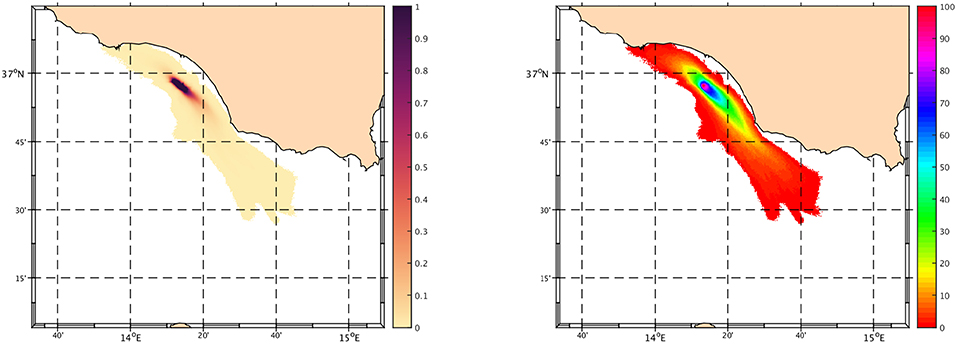
Figure 4. Perla platform, Sicily Channel. (Left) 48 h Hazard Index, HI; (Right) 48 h Occurrence Index, OI.
It is evident that, for the Adriatic platform, 48 h are largely sufficient for oil to reach a large extent of the coast in a probabilistic sense. The coast potentially impacted by hydrocarbons, within 2 days and due to a possible accident occurring at the extraction site, is about 30km long.
The shape of the patch is elongated meridionally as it follows the main current (West Adriatic Current, WAC, e.g., Poulain, 2001) flowing soouthward along the western Adriatic coast, fed by the Po river outflow.
Coastal occurrences for Sicily platforms are less evident within the 48 h window. Also in this case, the shape of the hazard cloud is quite elongated, due to the dominant current flowing along southern Sicily coast (the Atlantic Ionian Stream, AIS, e.g., Robinson et al., 1999). In particular, due to the local circulation and to the position of the oil rigs, the oil eventually released by both Sicilian platforms impacts the northern coast of the gulf (Gela gulf). On the other hand, the south-eastern side of the same gulf is impacted only by the oil released by Perla platform. Occurrence at western coast seems to be favored by counter-current forcing, i.e., when supposedly the oil patch is pushed westward by a coastal counter-current flowing in opposite direction to the AIS and/or by easterly winds in regimes of low currents.
3.2. Coastal Hazard
Coastal Hazard Indices, computed as above described, are shown in Figures 5, 6. The underlying set of simulations (1 year, bimonthly, 7days long simulations) allows the oil to reach a larger portion of coast and in a larger percent of the released quantities, in respect with the 48 h set of simulations. For the Adriatic it is evident that a 7days dispersion duration (168 h) implies that the possible contamination would potentially interest more than 120km of coast (climatological averages); this in respect to about 30km of coast potentially subject to contamination in the 48 h dispersion scenario. Highest hazard values are reached, as expected, in the area facing the potential pollution source, slightly southward in respect to the release point. This because the presence of the WAC that flows North-to-South along the western Adriatic coast in a large part of the year.
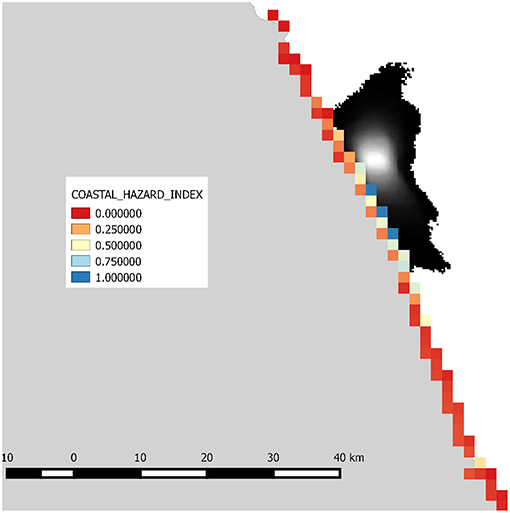
Figure 5. Coastal Hazard Index for the Adriatic platform. In order to compare the extension of the hazard distribution, the shape of the marine OI is also represented in black-to-white. CHI is dimensionless and in the range 0 − 1.
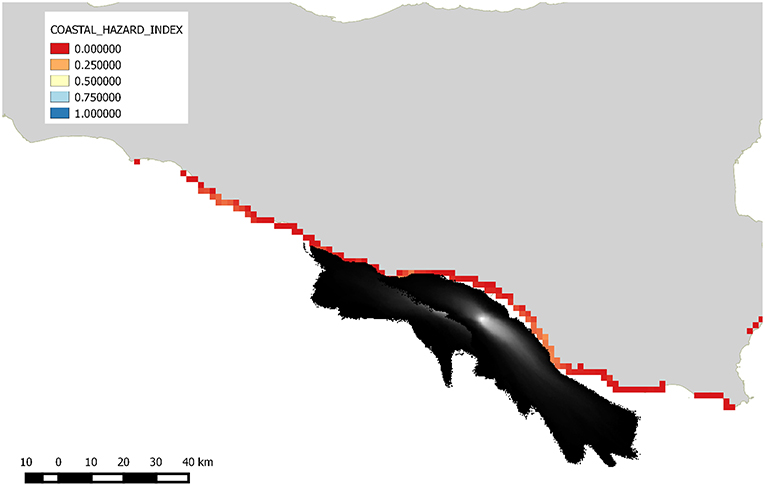
Figure 6. Coastal Hazard Index for the Sicily platforms. In order to compare the extension of the hazard distribution, the shape of the marine OI is also represented in black-to-white. CHI is dimensionless and in the range 0 − 1.
For the two Sicilian platforms the coast contaminated by the 7days set of simulations is more than 210km long, almost the double than the one contaminated for the Adriatic. The CHI values are lower than those recorded for the Adriatic. Areas with higher values are located in the western and eastern margins of the Gela gulf, coinciding with the headlands.
Comparing the potentially affected coast with the short-term scenario, for Sicily the contaminated coast in the 48 h set is about 50km; 90km if (taking in mind the limitations of the hydrodynamic model characterized by a spatial resolution of about 2km) we consider the oil at less than 4km (2 grid meshes) from the coast as stranded. In examining the results this consideration is relevant, as such an approximation determines that the entire Gela gulf coastline would risk to be contaminated even in the 2-days scenario (and not just in the long lasting dispersion scenario).
4. Summary and Conclusions
In this paper we present a system for the evaluation of the hazard related to potential oil spill occurring at coastal platform sites. We applied methods and metrics at three different oil extraction rigs. The three rigs operate in the Italian seas, one in the Adriatic Sea and two in the Sicily Channel. The hazard evaluation knowingly neglects all the aspects related to industrial hazard and risk; we focused our attention to the hazard related to the physical characteristics of the system environment, i.e., the oil rigs position, the wind regime, the hydrodynamics, the wave regime (parameterized within oil transport module), the duration of the oil dispersion. All these elements contribute to build the (environmental) hazard, that describe a possible source of damage for a given portion of our (eco-)system. The risk assessment would encompass the evaluation of sensitive parts of the system (coasts, fauna, beaches, submerged meadows, society, economy etc.), whose set we can call vulnerability of the system. We skipped in this paper the vulnerability and risk aspects, as we realized that the accurate evaluation and description of the hazard would deserve to be treated separately, also considering the complexity linked to terminology and concepts inherent to the risk assessment literature (Christensen et al., 2003).
Our approach is based in reproducing a set of particle trajectories simulating oil spill behavior at sea, through the coupling of numerical finite differences modeling of the hydrodynamics (3D) with a lagrangian module for oil dispersion and transformation.
Such combination is implemented operationally in order to produce a statistical set of short term forecasts that is used as data-base for computation of two short-term hazard indices that estimate the aerial hazard, i.e., the hazard in the marine environment surrounding the potential dispersion point (the oil platform).
Two short term indices were produced, based on a 48 h simulations database. The first index, HI, represents the area where oil is more concentrated. As expected this occurs near to the source of the oil and concentration decrease with space in a non-gaussian distribution (Olita et al., 2012a; Sepp Neves et al., 2015, 2016), being it strongly influenced by current regimes. The second index, OI, shows the same area with a different distribution of values, that represents the probability for a given cell to be contaminated, disregarding the concentration.
On one hand we consider this 48 h based information very relevant for emergencies management purposes, as it was shown many times that rapidity of monitoring and intervention in the post-accident phases is crucial to contrast pollution in an efficient and effective way (Kirby and Law, 2010). On the other hand, these two indices, given the short term simulations 48 h on which they are based, do not allowed us to properly estimate the coastal hazard.
For this reason we elaborated a third index (CHI) that is referred to the stranded oil along coast and can be useful to estimate how the hazard can be distributed along a coastline. To compute such an index, statistics were performed using as database a set of 7−days long dispersion simulations; a duration that, based on knowledge and on sensitivity tests, was proven to sufficiently strand particles at coast and also is compatible with the above cited rapidity of intervention requirement. For this index, we were also interested to compare the relative level of hazard between the Sicilian and Adriatic case. To do this, we normalized the local indices to be directly comparable. In front of a minor extension of coast contaminated, largest hazard values of the CHI are reached in the Adriatic coast. This probably because the lower currents (for instance, Poulain, 2001, found maximum values for WAC not exceeding 0.20cm/s in this Adriatic area, while the maximum for WAC are found in the Southern Adriatic) determine a reduced oil dispersion by advection (along the coast and/or offshore) and thus an increased possibility that oil patches would be entrapped in coastal cells or captured by coastal counter-currents and thus beached by winds and waves. In Sicily, the AIS, dominating the circulation of the southern Sicily coast, rapidly moves southeastward the oil particles, determining a decreased probability that large quantities of oil would concentrate in a single cell/area. Simulated maxima for AIS reach and exceed 0.30cm/s in this area, values also reported in literature (Sorgente et al., 2011). This means that, with respect to the Adriatic case, lower values of the CHI are found in the stretch of coast just facing the extraction site, in favor of a larger stretch of coast potentially interested by a contamination.
We think that both kind of products (coastal and marine hazard indices) can be useful to plan and optimize the anti-pollution resources, by the actors involved in prevention and mitigation actions. Further, they can provide the basic layer to evaluate the risk, once the sensitivity and vulnerability layers are assessed.
Finally, results emphasize the relevance of a prompt intervention (in case of accident) to reduce as much as possible the consequences and the future costs for mitigation and reduction of the impacts.
Data Availability
The datasets generated for this study are available on request to the corresponding author.
Author Contributions
AO developed the idea, wrote the paper, computed the hazard indices and produced the images. LF implemented the operational systems on which the two marine indices are based. CT performed the long-term simulation for the coastal index and contributed to Figure 1. RS coordinated the project and the research within. SS contributed to the GIS implementation of the indices and to the discussion of the results. AC and GQ contributed to the numerical system development and in revising the manuscript. All the Authors contributed in revising and discussing the manuscript.
Funding
The work is supported by the project SOS Piattaforme e Impatti Offshore (Servizio Di Previsione Numerica Della Dispersione Di Idrocarburi Dalle Piattaforme Petrolifere Del Canale Di Sicilia E Medio/Basso Adriatico), funded by the Italian Ministry of the Environment and Protection of Land and Sea Executive Agreement prot. m_amte. PNM.REGISTRO UFFICIALE.U.000939.17-01-2017 of 17.01.2017.
Conflict of Interest Statement
The authors declare that the research was conducted in the absence of any commercial or financial relationships that could be construed as a potential conflict of interest.
Acknowledgments
Authors would like to thank Mrs. Monica Pinna, Mr. Filippo Angotzi, Dr. Andrea Pes, Dr. Gennaro Oliva, and Dr. Fabio Antognarelli for technical and administrative support provided for the project.
AO and LF would also like to thank the direction and personnel of the Institute of Atmospheric Sciences and Climate, their new affiliation, for the great reception received.
AO especially thanks the autonomous movement of Precari Uniti CNR (P.U.) that succeed (finally and fighting a long and big battle, still ongoing) to overcome the precarious condition of thousands of not-so-young researchers at National Research Council, he included. Thousands of other (worthy) colleagues are still fighting to achieve the same objective.
AO also especially thanks the personal project CUMULONIMBUS - Change Under Mostly Unknown Limits Operates New Ideas May Be Underpinning State.
References
Blumberg, A., and Mellor, G. (1987). “A description of a three-dimensional coastal ocean circulation model,” in Coastal Estuarine Science; Three-dimensional Coastal Ocean Models, ed N.S. Heaps (Washington, DC: American Geophysical Union), 1–16.
Castanedo, S., Juanes, J., Medina, R., Puente, A., Fernandez, F., Olabarrieta, M., et al. (2009). Oil spill vulnerability assessment integrating physical, biological and socio-economical aspects: application to the cantabrian coast (bay of biscay, spain). J. Environ. Manage. 91, 149–159. doi: 10.1016/j.jenvman.2009.07.013
Christensen, F. M., Andersen, O., Duijm, N. J., and Harremoës, P. (2003). Risk terminology–a platform for common understanding and better communication. J. Hazard. Mater. 103, 181–203. doi: 10.1016/S0304-3894(03)00039-6
Crichton, D. (1999). “Chapter The Risk Triangle,”in Natural Disaster Management, ed J. Ingleton (London: Tudor Rose), 102–103.
De Dominicis, M., Pinardi, N., Zodiatis, G., and Archetti, R. (2013a). Medslik-ii, a lagrangian marine surface oil spill model for short-term forecasting–part 2: Numerical simulations and validations. Geosci. Model Dev. 6, 1871–1888. doi: 10.5194/gmd-6-1871-2013
De Dominicis, M., Pinardi, N., Zodiatis, G., and Lardner, R. (2013b). Medslik-ii, a lagrangian marine surface oil spill model for short-term forecasting–part 1: Theory. Geosci. Model Dev. 6, 1851–1869. doi: 10.5194/gmd-6-1851-2013
Eiser, J. R., Bostrom, A., Burton, I., Johnston, D. M., McClure, J., Paton, D., et al. (2012). Risk interpretation and action: a conceptual framework for responses to natural hazards. Int. J. Disaster Risk Reduc. 1, 5–16. doi: 10.1016/j.ijdrr.2012.05.002
Fazioli, L., Olita, A., Cucco, A., Tedesco, C., Ribotti, A., and Sorgente, R. (2016). Impact of different initialisation methods on the quality of sea forecasts for the sicily channel. J. Oper. Oceanogr. 9(Suppl. 1):s119–s130. doi: 10.1080/1755876X.2015.1114804
Gundlach, E. R., Ruby, C. H., Hayes, M. O., and Blount, A. E. (1978). The Urquiola oil spill, La Coruña, Spain: impact and reaction on beaches and rocky coasts. Environ. Geol. 2, 131–143. doi: 10.1007/BF02430667
Kirby, M. F., and Law, R. J. (2010). Accidental spills at sea–risk, impact, mitigation and the need for co-ordinated post-incident monitoring. Mar. Pollut. Bull. 60, 797–803. doi: 10.1016/j.marpolbul.2010.03.015
Nelson, J. R., and Grubesic, T. H. (2018). Oil spill modeling: risk, spatial vulnerability, and impact assessment. Prog. Phys. Geogr. Earth Environ. 42, 112–127. doi: 10.1177/0309133317744737
Olita, A., Cucco, A., Simeone, S., Ribotti, A., Fazioli, L., Sorgente, B., et al. (2012a). Oil spill hazard and risk assessment for the shorelines of a mediterranean coastal archipelago. Ocean Coast. Manage. 57, 44–52. doi: 10.1016/j.ocecoaman.2011.11.006
Olita, A., Dobricic, S., Ribotti, A., Fazioli, L., Cucco, A., Dufau, C., et al. (2012b). Impact of sla assimilation in the sicily channel regional model: model skills and mesoscale features. Ocean Sci. 8, 485–496. doi: 10.5194/os-8-485-2012
Olita, A., Sorgente, R., Natale, S., Gaberšek, S., Ribotti, A., Bonanno, A., et al. (2007). Effects of the 2003 european heatwave on the central mediterranean sea: surface fluxes and the dynamical response. Ocean Sci. 3, 273–289. doi: 10.5194/os-3-273-2007
Poulain, P.-M. (2001). Adriatic sea surface circulation as derived from drifter data between 1990 and 1999. J. Mar. Syst. 29, 3–32. doi: 10.1016/S0924-7963(01)00007-0
Ribotti, A., Antognarelli, F., Cucco, A., Falcieri, M. F., Fazioli, L., Ferrarin, C., et al. (2019). An operational marine oil spill forecasting tool for the management of emergencies in the italian seas. J. Mar. Sci. Eng. 7:1. doi: 10.3390/jmse7010001
Robinson, A. R., Sellschopp, J., Warn-Varnas, A., Anderson, L. A., and Lermusiaux, P. F. J. (1999). The atlantic ionian stream. J. Mar. Syst. 20, 129–156.
Sepp Neves, A., Pinardi, N., and Martins, F. (2016). It-osra: applying ensemble simulations to estimate the oil spill risk associated to operational and accidental oil spills. Ocean Dynam. 66, 939–954. doi: 10.1007/s10236-016-0960-0
Sepp Neves, A. A., Pinardi, N., Martins, F., Janeiro, J., Samaras, A., Zodiatis, G., et al. (2015). Towards a common oil spill risk assessment framework–adapting iso 31000 and addressing uncertainties. J. Environ. Manage. 159, 158–168. doi: 10.1016/j.jenvman.2015.04.044
Sorgente, R., Olita, A., Oddo, P., Fazioli, L., and Ribotti, A. (2011). Numerical simulation and decomposition of kinetic energy in the Central Mediterranean: insight on mesoscale circulation and energy conversion. Ocean Sci. 7, 503–519. doi: 10.5194/os-7-503-2011
Tonani, M., Pinardi, N., Fratianni, C., Pistoia, J., Dobricic, S., Pensieri, S., et al. (2009). Mediterranean forecasting system: forecast and analysis assessment through skill scores. Ocean Sci. 5, 649–660. doi: 10.5194/os-5-649-2009
Keywords: hazard, oil spill, pollution, Mediterranean, risk, coast, marine, currents
Citation: Olita A, Fazioli L, Tedesco C, Simeone S, Cucco A, Quattrocchi G, Ribotti A, Perilli A, Pessini F and Sorgente R (2019) Marine and Coastal Hazard Assessment for Three Coastal Oil Rigs. Front. Mar. Sci. 6:274. doi: 10.3389/fmars.2019.00274
Received: 11 February 2019; Accepted: 07 May 2019;
Published: 28 May 2019.
Edited by:
Juan Jose Alava, University of British Columbia, CanadaReviewed by:
George Zodiatis, University of Cyprus, CyprusBaoquan Li, Yantai Institute of Coastal Zone Research (CAS), China
Copyright © 2019 Olita, Fazioli, Tedesco, Simeone, Cucco, Quattrocchi, Ribotti, Perilli, Pessini and Sorgente. This is an open-access article distributed under the terms of the Creative Commons Attribution License (CC BY). The use, distribution or reproduction in other forums is permitted, provided the original author(s) and the copyright owner(s) are credited and that the original publication in this journal is cited, in accordance with accepted academic practice. No use, distribution or reproduction is permitted which does not comply with these terms.
*Correspondence: Antonio Olita, antonio.olita@cnr.it
†Present Address: Antonio Olita, Institute of Atmospheric and Climate Sciences, National Research Council (CNR-ISAC) Cagliari Section, Cagliari, Italy
Leopoldo Fazioli, Institute of Atmospheric and Climate Sciences, National Research Council (CNR-ISAC) Cagliari Section, Cagliari, Italy