Spatial Distribution of Atmospheric Aerosol Physicochemical Characteristics in the Russian Sector of the Arctic Ocean

Abstract
:1. Introduction
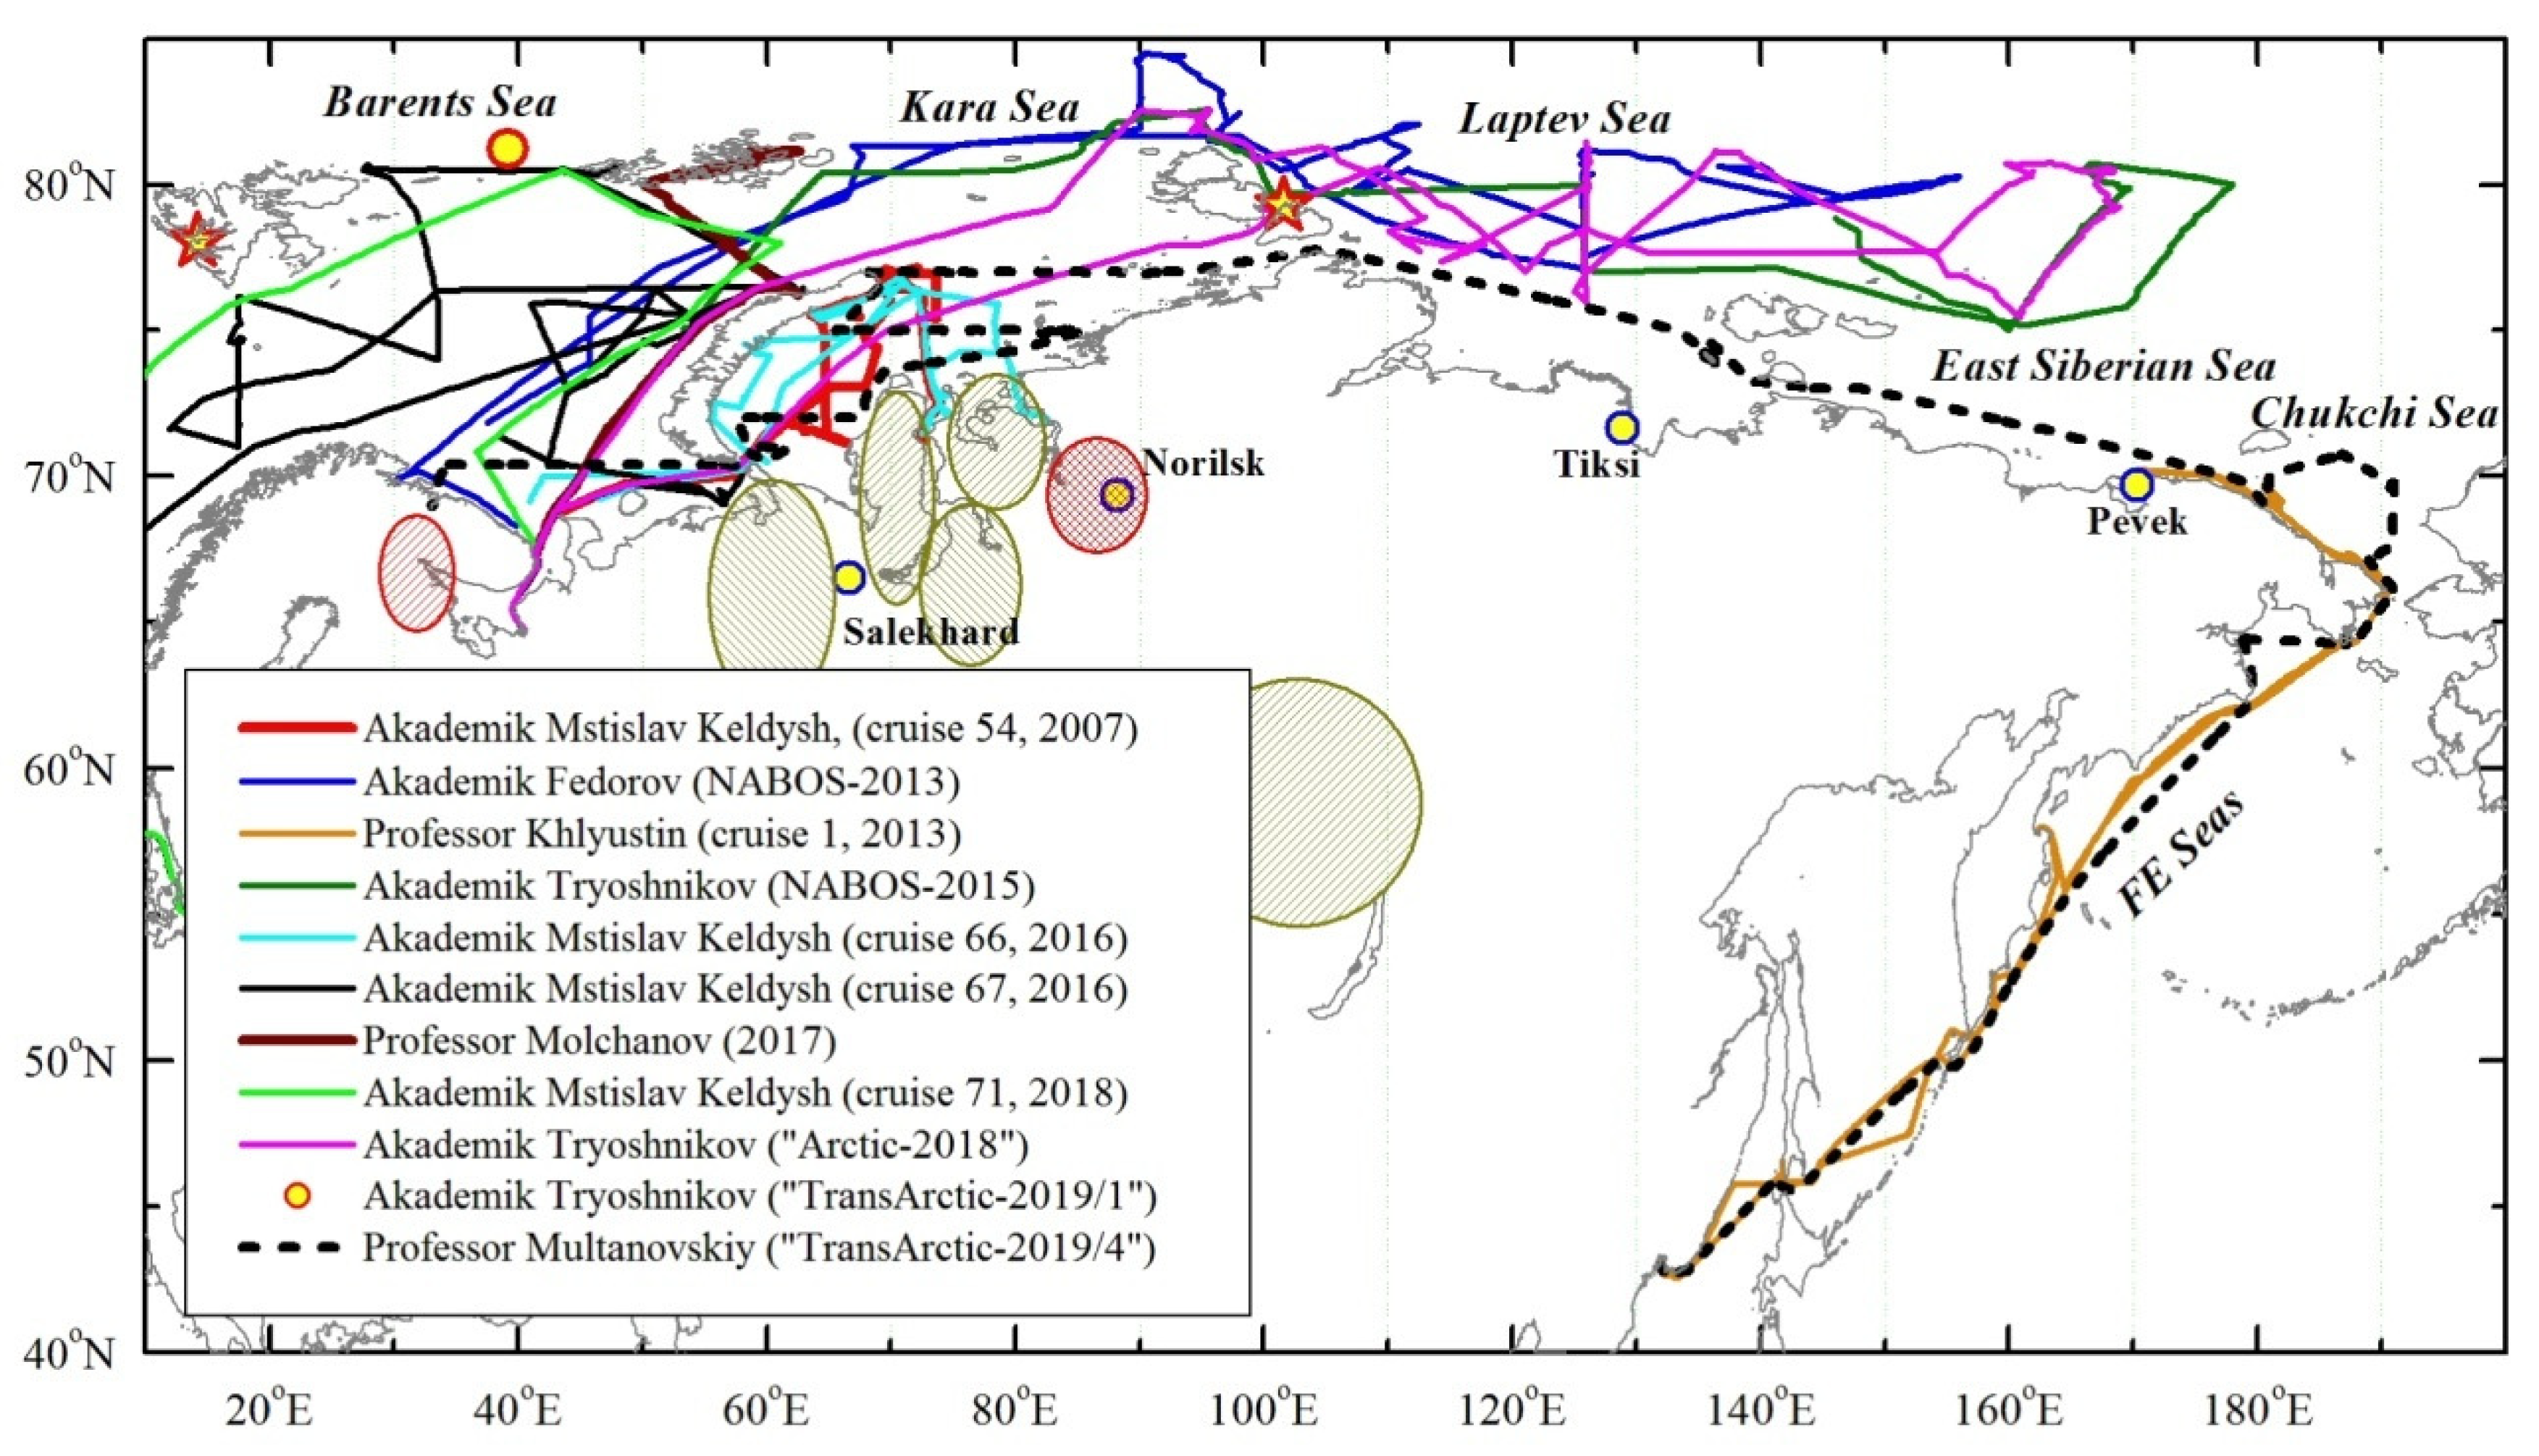
2. Characterization of Expedition Measurements
- Mass concentration of absorbing substance (black carbon, MBC) in the aerosol composition;
- Number concentration of aerosol particles with radii r = 0.15–5 µm (NA);
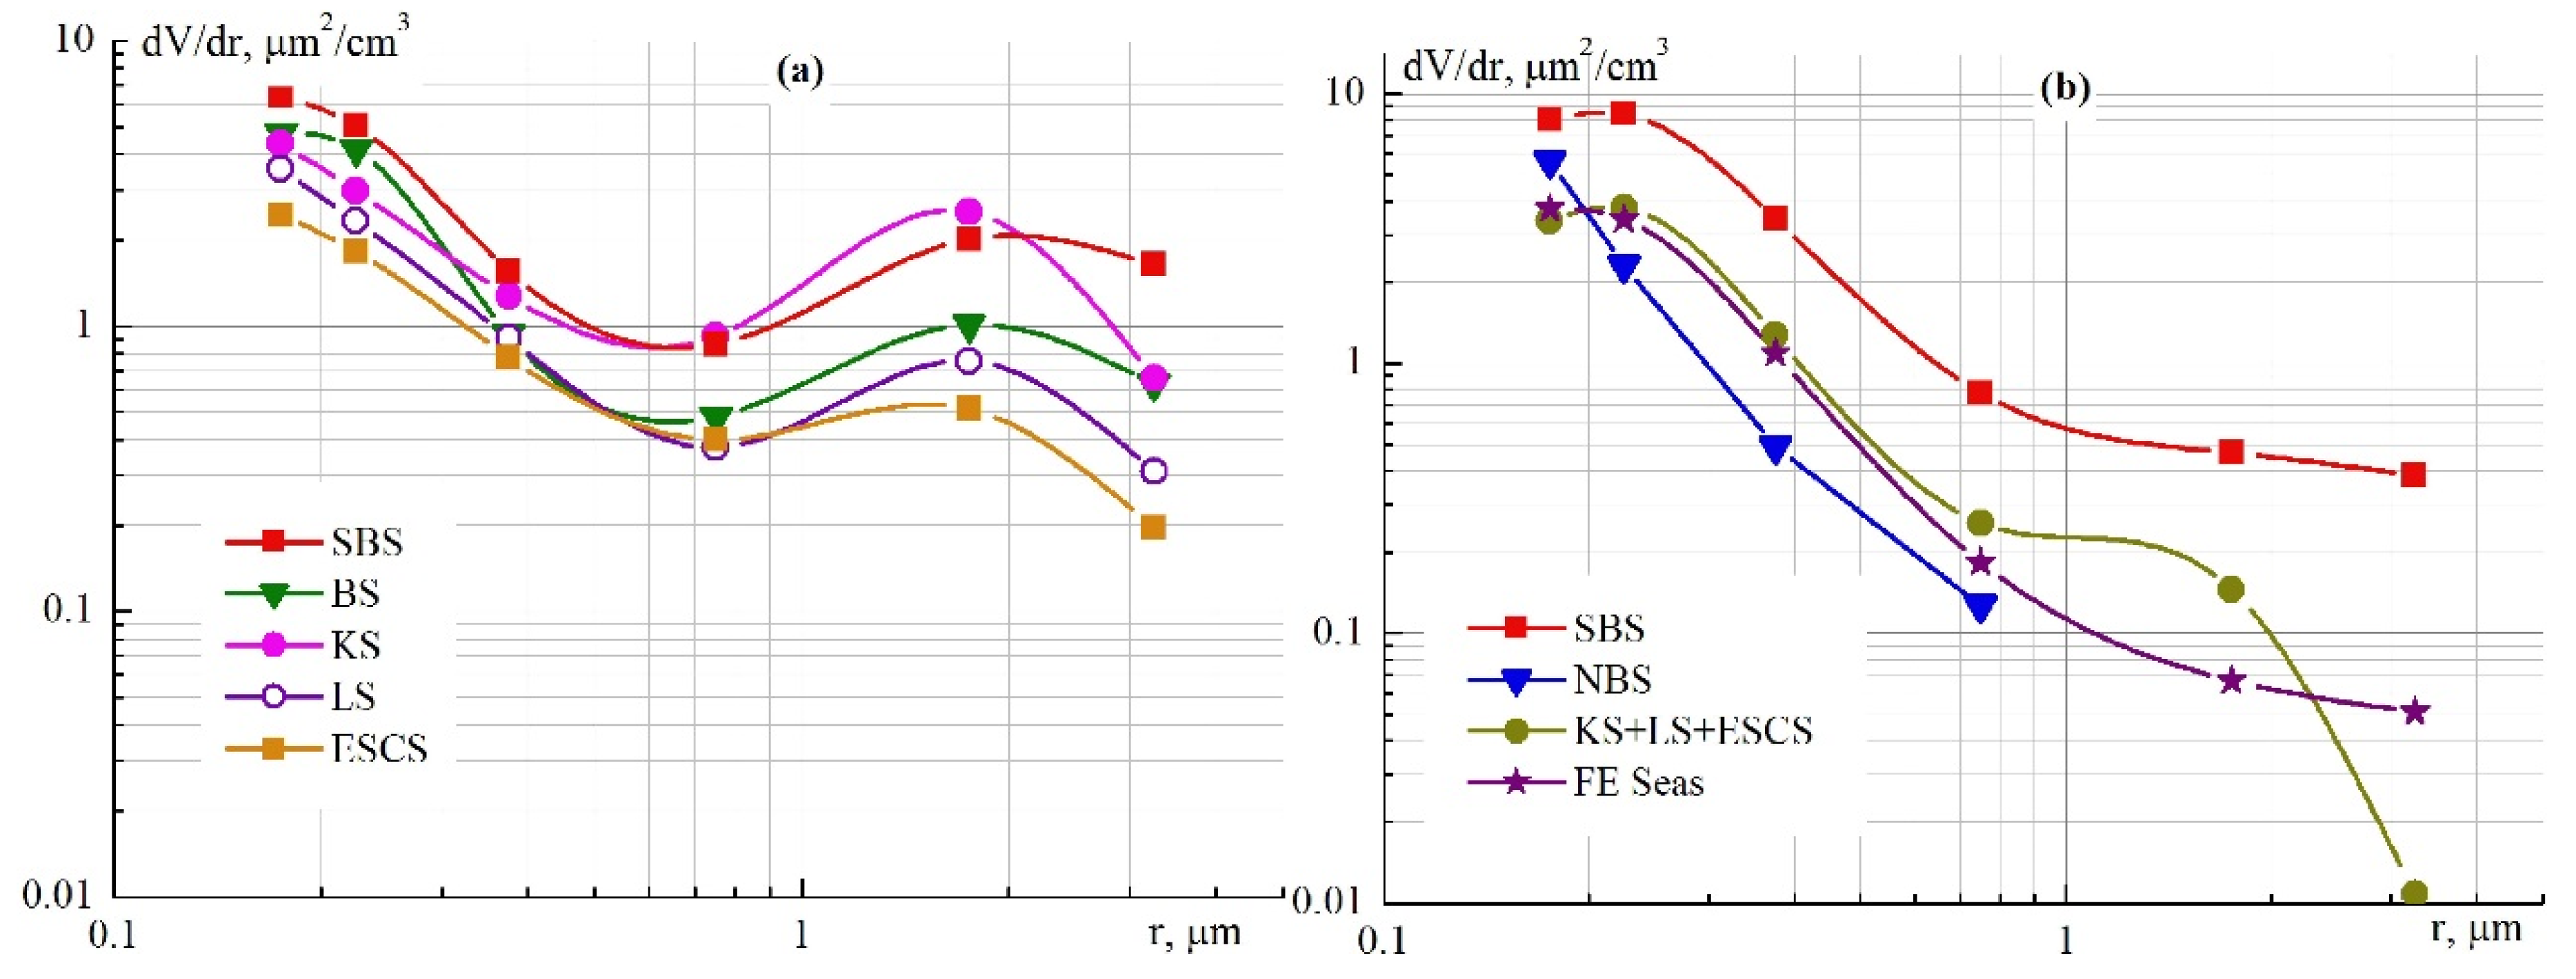
- Volume particle distribution functions (dVi/dRi) = 4/3·π·ri3·dNi, where dNi and ri are the number concentrations of particles and average radii for the ith size interval;
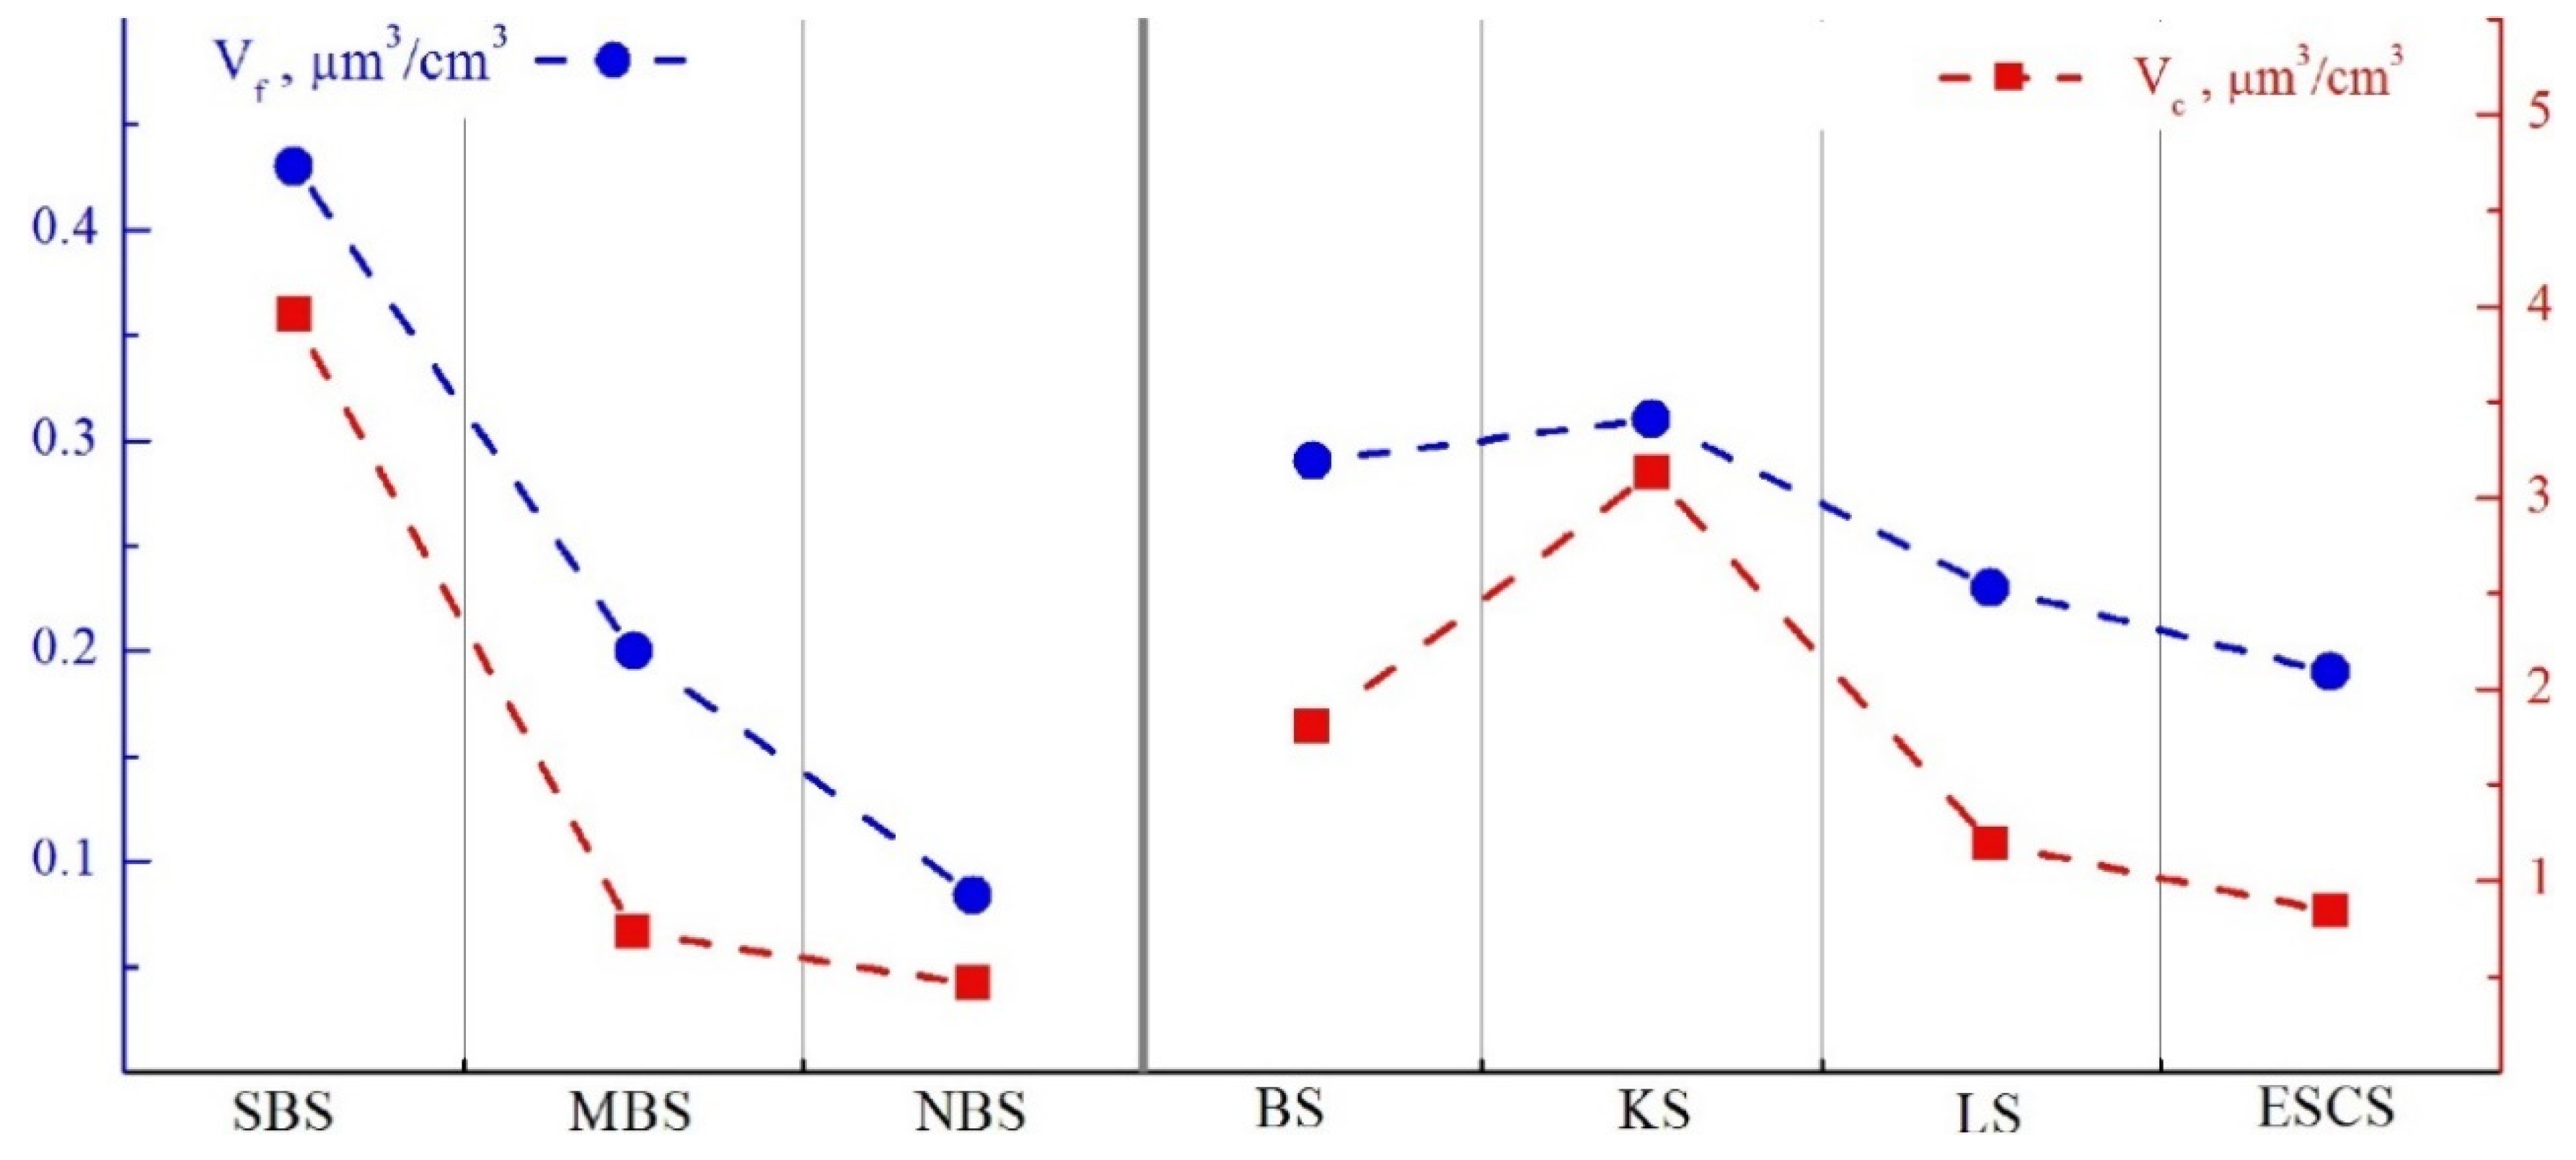
- Volumes of particles in the fine and coarse fractions of aerosol (Vf and Vc), which were calculated from the formula V = Ʃ 4/3·π·ri3·dNi for the radius ranges 0.15–0.5 and 0.5–5 µm, respectively;
- AOD of the atmosphere τa(λ) in the wavelength range of 0.34–2.14 µm and parameters of the Ångström formula α, β;
- Fine and coarse components of AOD (the coarse component τc was found from minimal AOD values in the spectral range of 1.24–2.14 µm, and the fine component was estimated for the wavelength of 0.5 µm as the residual depth [33]: ).
3. Discussion of Results
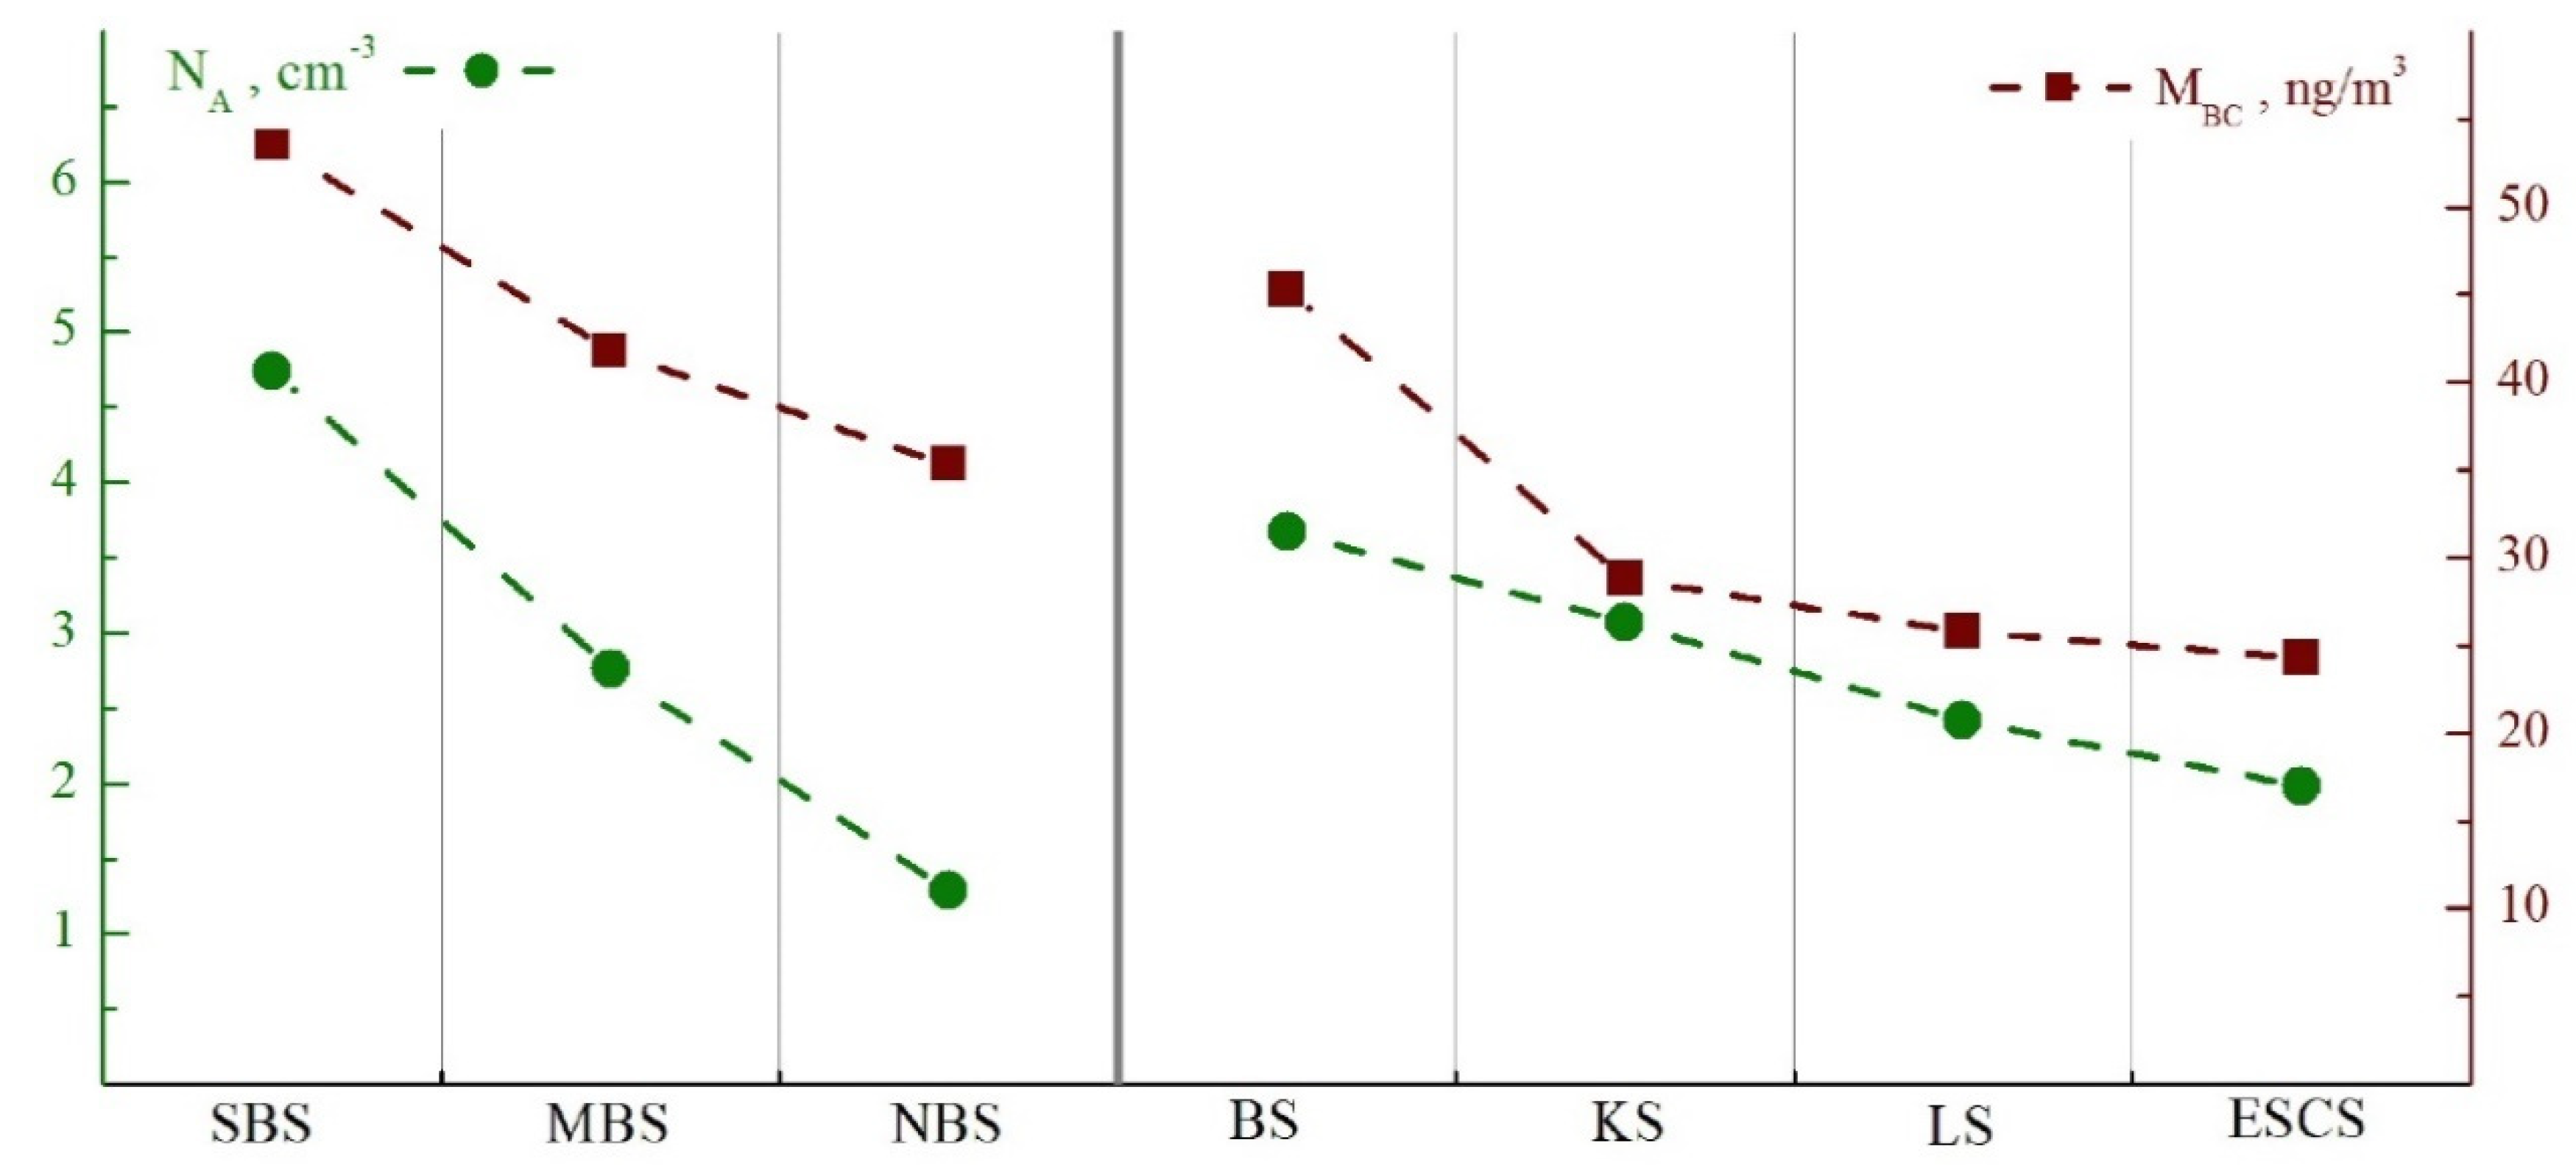
3.1. Average Spatial Distribution of Aerosol Optical and Microphysical Characteristics over the Arctic Ocean
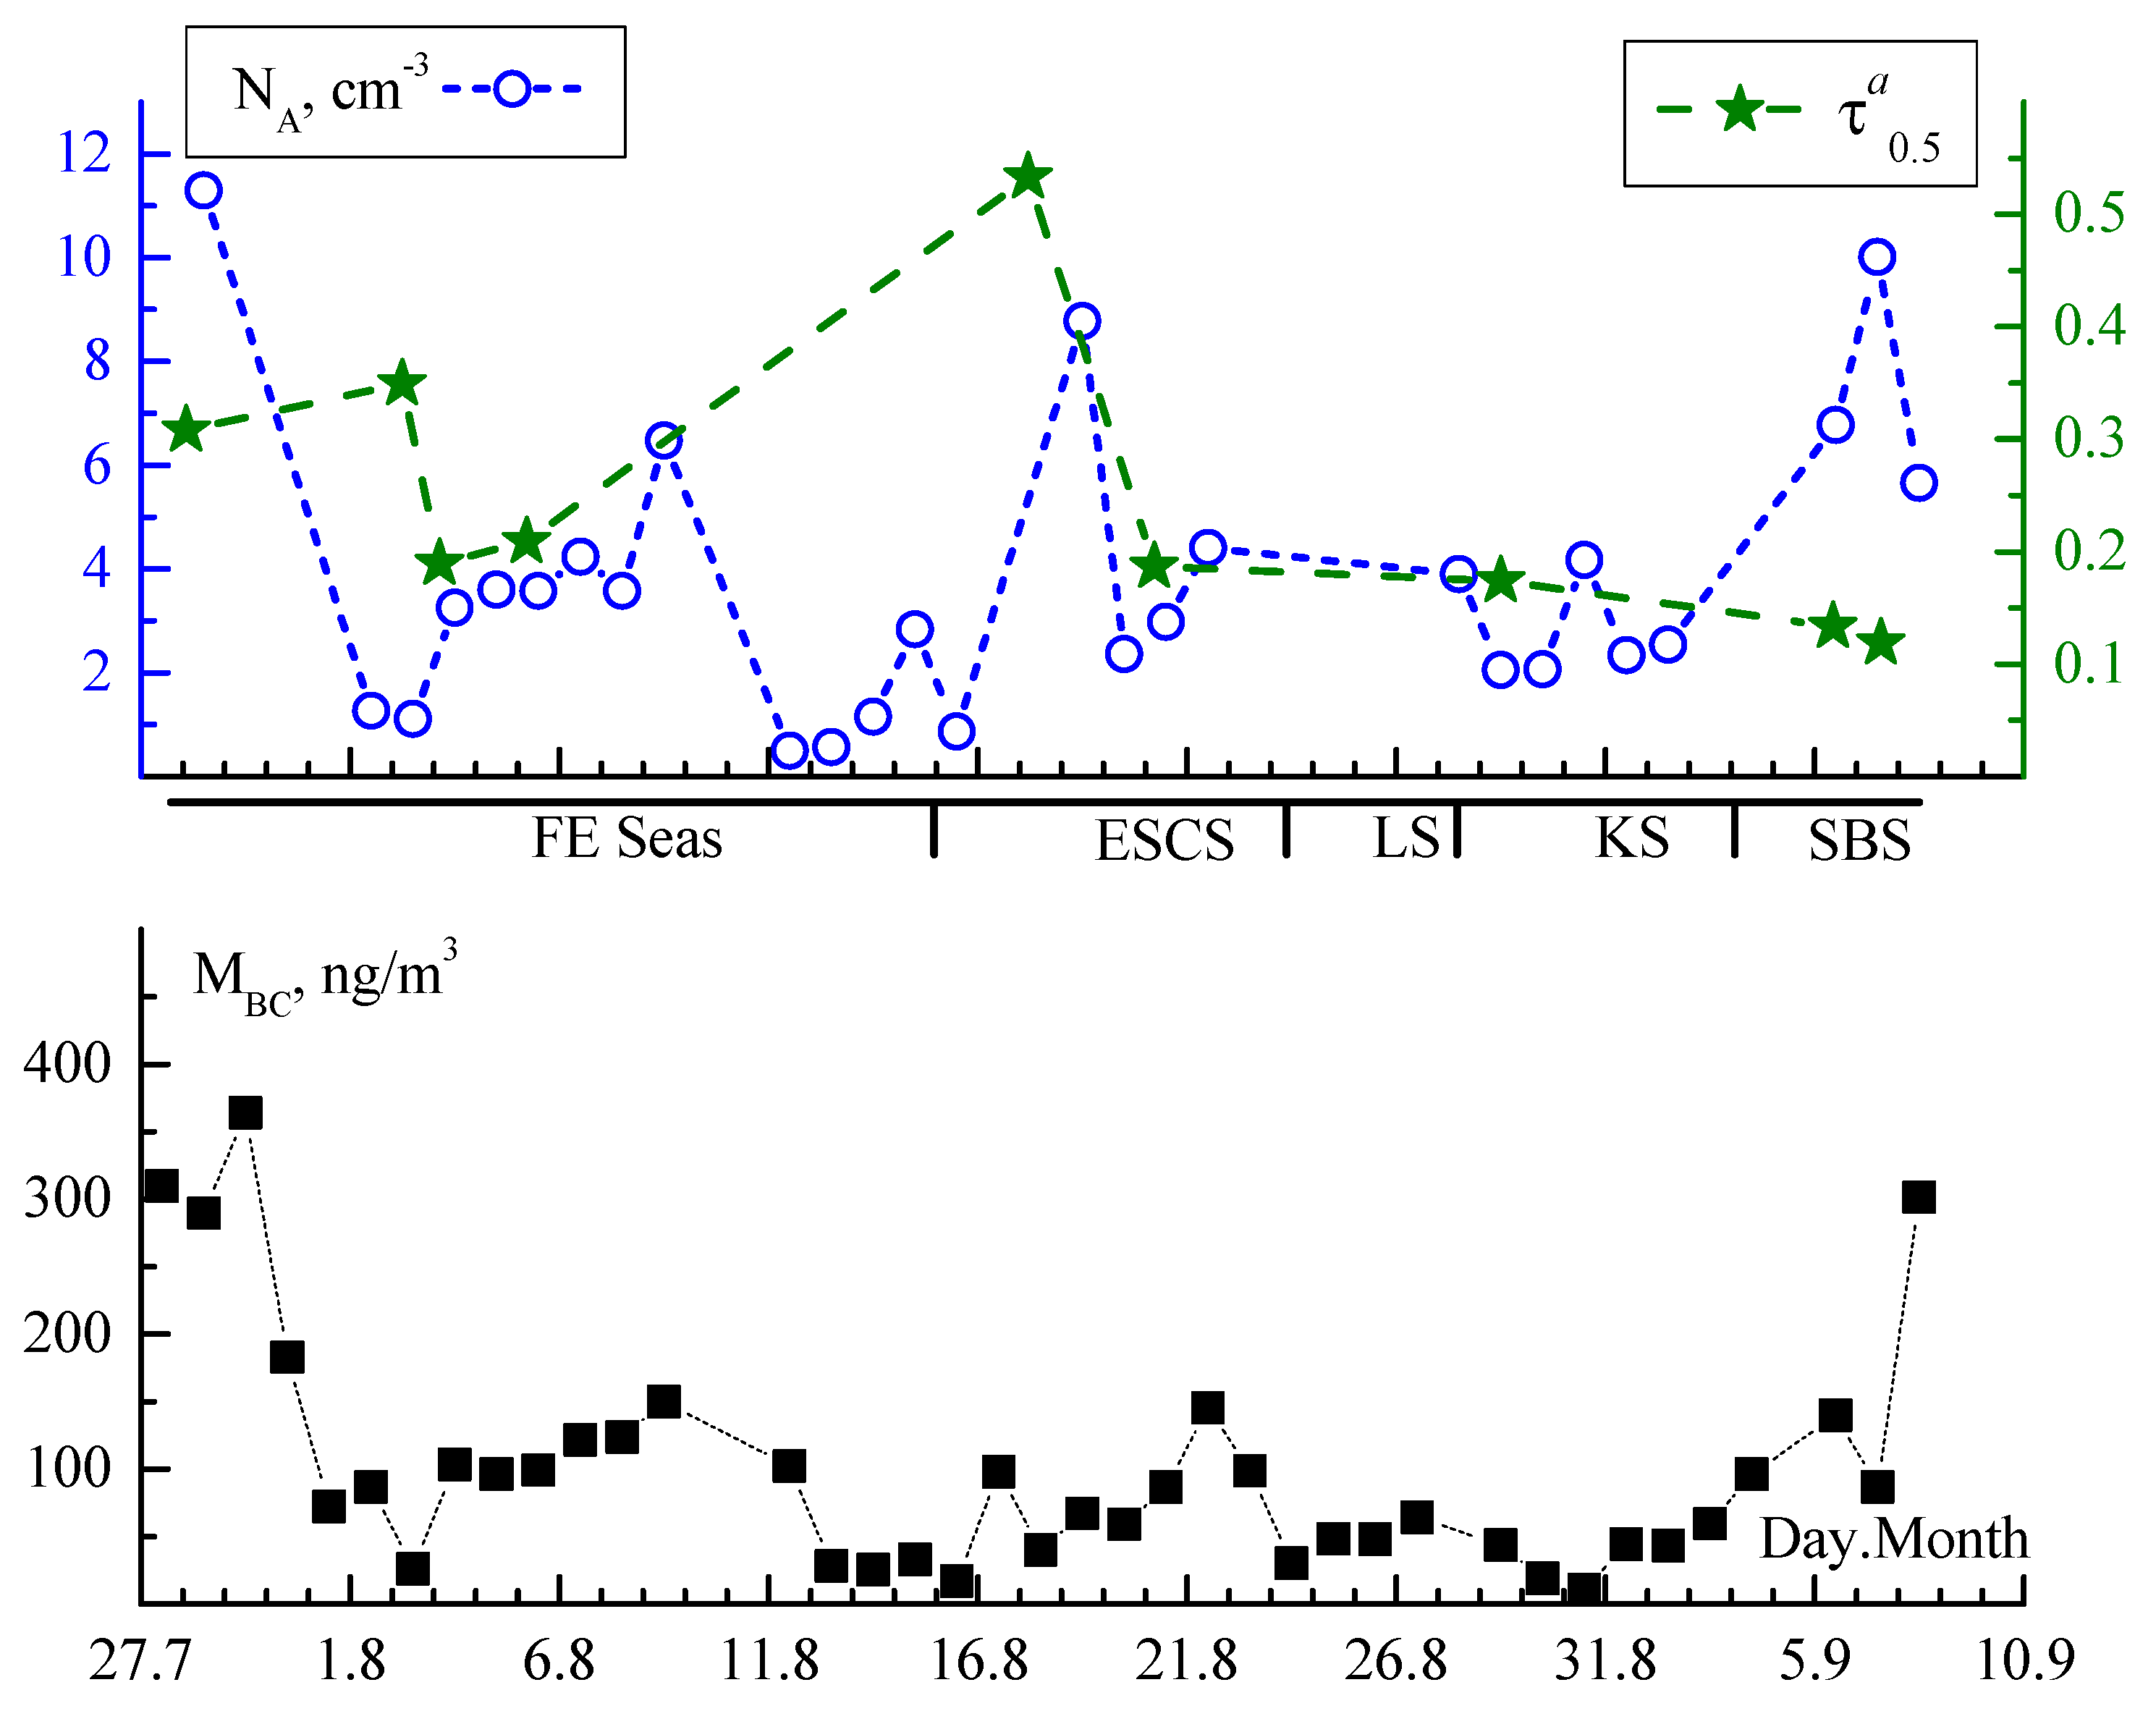
3.2. Optical and Microphysical Characteristics of Aerosol in the Expeditions “TransArctic–2019”
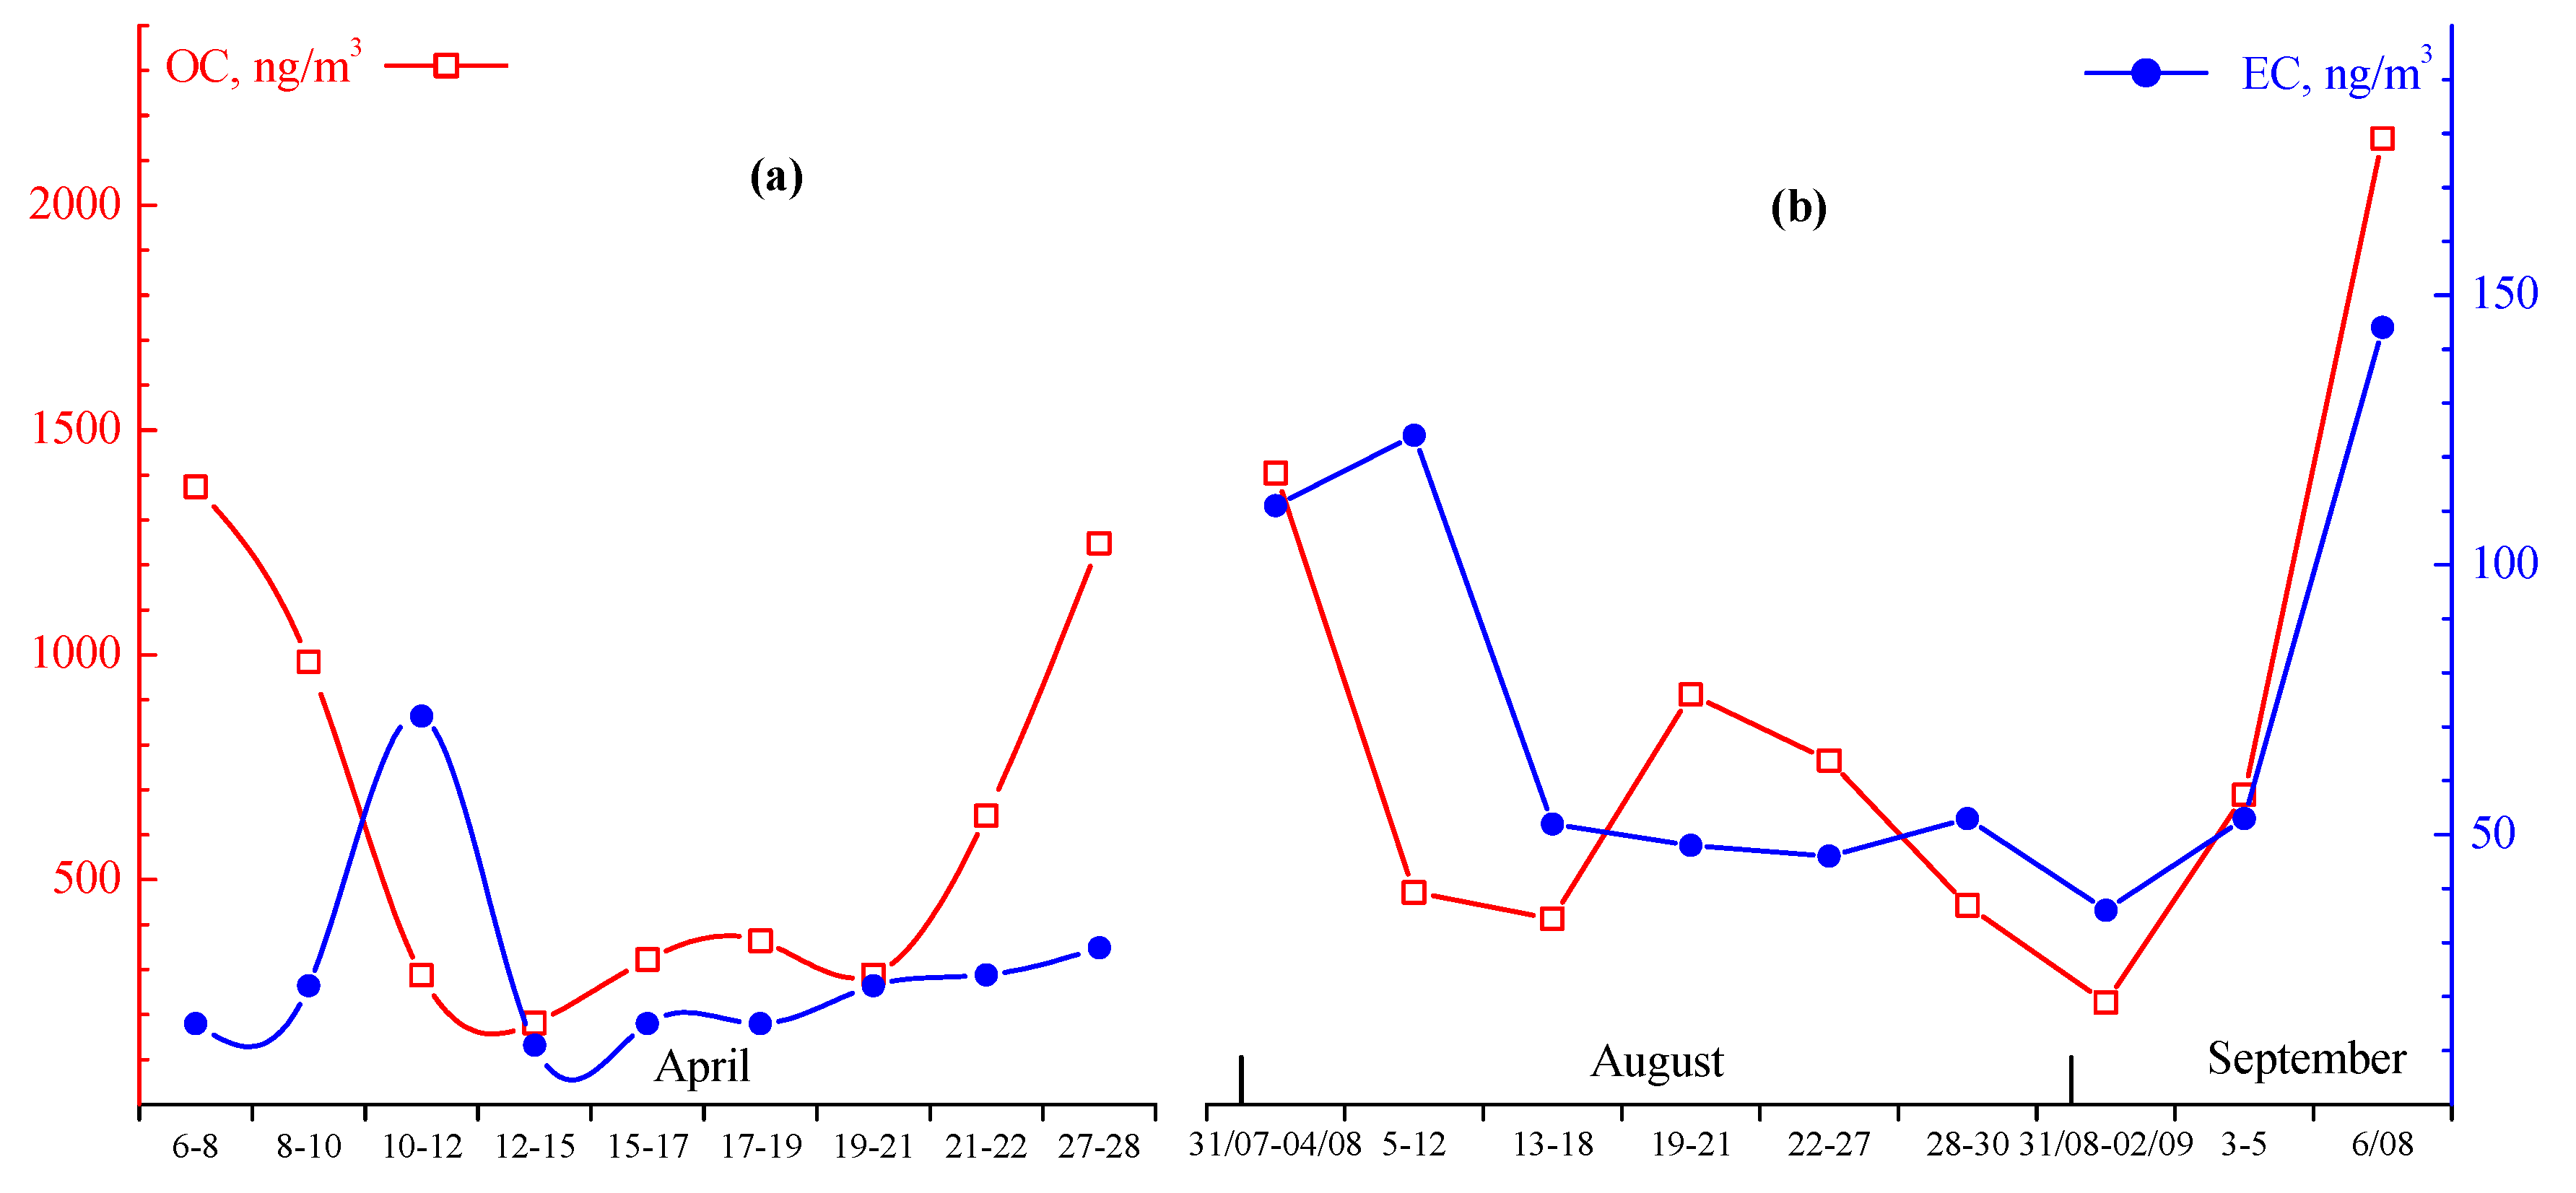
3.3. Chemical Composition of Aerosol Samples along the Route of “TransArctic–2019” Expeditions
4. Conclusions
Author Contributions
Funding
Acknowledgments
Conflicts of Interest
References
- IPCC. Climate Change 2013: The Physical Science Basis, Intergovernmental Panel on Climate Change; Intergovernmental Panel on Climate Change: Geneva, Switzerland, 2013; p. 1552. [Google Scholar]
- Kondratyev, K.Y.A.; Ivlev, L.S.; Krapivin, V.F.; Varotsos, C.A. Atmospheric Aerosol Properties, Formation Processes, and Impacts: From Nano–to Global Scales; Springer/PRAXIS: Chichester, UK, 2006. [Google Scholar]
- Stohl, A. Characteristics of atmospheric transport into the Arctic troposphere. J. Geophys. Res. 2006, 111. [Google Scholar] [CrossRef]
- Wang, Q.; Jacob, D.J.; Fisher, J.A.; Mao, J.; Leibensperger, E.M.; Carouge, C.C.; Le Sager, P.; Kondo, Y.; Jimenez, J.L.; Cubison, M.J.; et al. Sources of carbonaceous aerosols and deposited black carbon in the Arctic in winter–spring: Implications for radiative forcing. Atmos. Chem. Phys. 2011, 11, 12453–12473. [Google Scholar] [CrossRef] [Green Version]
- Shaw, G.E. The Arctic haze phenomenon. Bull. Am. Meteor. Soc. 1995, 76, 2403–2414. [Google Scholar] [CrossRef]
- Quinn, P.; Shaw, G.; Andrews, E.; Dutton, E.G.; Ruoho–Airola, T.; Gong, S.L. Arctic haze: Current trends and knowledge gaps. Tellus 2007, 59, 99–114. [Google Scholar] [CrossRef] [Green Version]
- Tomasi, C.; Kokhanovsky, A.A.; Lupi, A.; Ritter, C.; Smirnov, A.; Mazzola, M.; Stone, R.S.; Lanconelli, C.; Vitale, V.; Holben, B.N.; et al. Aerosol remote sensing in polar regions. Earth Sci. Rev. 2015, 140, 108–157. [Google Scholar] [CrossRef] [Green Version]
- Stone, R.S.; Anderson, G.P.; Shuttle, E.P.; Andrews, E.; Loukachine, K.; Dutton, E.G.; Schaaf, C.; Roman, M.O., III. Radiative impact of boreal smoke in the Arctic: Observed and modeled. J. Geophys. Res. 2008, 113. [Google Scholar] [CrossRef]
- Bond, T.C.; Doherty, S.J.; Fahey, D.W.; Forster, P.M.; Berntsen, T.; DeAngelo, B.J.; Flanner, M.G.; Ghan, S.; Kärcher, B.; Koch, D.; et al. Bounding the role of black carbon in the climate system: A scientific assessment. J. Geophys. Res. Atmos. 2013, 118, 5380–5552. [Google Scholar] [CrossRef]
- Kokhanovsky, A.; Tomasi, C. Physics and Chemistry of the Arctic Atmosphere; Kokhanovsky, A., Tomasi, C., Eds.; Springer Polar Sciences: Berlin/Heidelberg, Germany, 2020; p. 717. [Google Scholar] [CrossRef]
- Asmi, E.; Kondratyev, V.; Brus, D.; Laurila, T.; Lihavainen, H.; Backman, J.; Vakkari, V.; Aurela, M.; Hatakka, J.; Viisanen, Y.; et al. Aerosol size distribution seasonal characteristics measured in Tiksi, Russian Arctic. Atmos. Chem. Phys. 2016, 16, 1271–1287. [Google Scholar] [CrossRef] [Green Version]
- Popovicheva, O.; Diapouli, E.; Makshtas, A.; Shonija, N.; Manousakas, M.; Saraga, D.; Uttal, T.; Eleftheriadis, K. East Siberian Arctic background and black carbon polluted aerosols at HMO Tiksi. Sci. Total Environ. 2019, 655, 924–938. [Google Scholar] [CrossRef]
- Sakerin, S.M.; Golobokova, L.P.; Kabanov, D.M.; Kalashnikova, D.A.; Kozlov, V.S.; Kruglinsky, I.A.; Makarov, V.I.; Makshtas, A.P.; Popova, S.A.; Radionov, V.F.; et al. Measurements of physicochemical characteristics of atmospheric aerosol at research station Ice Base Cape Baranov in 2018. Atmos. Ocean. Opt. 2019, 32, 511–520. [Google Scholar] [CrossRef]
- Vinogradova, A.A.; Vasileva, A.V. Black carbon in air over northern regions of Russia: Sources and spatiotemporal variations. Atmos. Ocean. Opt. 2017, 30, 533–541. [Google Scholar] [CrossRef]
- Vinogradova, A.A.; Titkova, T.B.; Ivanova, Y.A. Episodes with anomalously high black carbon concentration in surface air in the region of Tiksi station, Yakutiya. Atmos. Ocean. Opt. 2019, 32, 94–102. [Google Scholar] [CrossRef]
- Zhuravleva, T.; Nasrtdinov, I.; Vinogradova, A. Direct radiative effects of smoke aerosol in the region of Tiksi station (Russian Arctic): Preliminary results. Atmos. Ocean. Opt. 2019, 32, 296–305. [Google Scholar] [CrossRef]
- Ferrero, L.; Sangiorgi, G.; Perrone, M.G.; Rizzi, C.; Cataldi, M.; Markuszewski, P.; Pakszys, P.; Makuch, P.; Petelski, T.; Becagli, S.; et al. Chemical composition of aerosol over the Arctic Ocean from summer ARctic EXpedition (AREX) 2011–2012 cruises: Ions, amines, elemental carbon, organic matter, polycyclic aromatic hydrocarbons, n–Alkanes, metals, and rare Earth elements. Atmosphere 2019, 10, 54. [Google Scholar] [CrossRef] [Green Version]
- Stohl, A.; Klimont, Z.; Eckhardt, S.; Kupiainen, K.; Shevchenko, V.P.; Kopeikin, V.M.; Novigatsky, A.N. Black carbon in the Arctic: The underestimated role of gas flaring and residential combustion emissions. Atmos. Chem. Phys. 2013, 13, 8833–8855. [Google Scholar] [CrossRef] [Green Version]
- Sakerin, S.M.; Bobrikov, A.A.; Bukin, O.A.; Golobokova, L.P.; Polkin, V.V.; Polkin, V.V.; Shmirko, K.A.; Kabanov, D.M.; Khodzher, T.V.; Onischuk, N.A.; et al. On measurements of aerosol–gas composition of the atmosphere during two expeditions in 2013 along Northern Sea Route. Atmos. Chem. Phys. 2015, 15, 12413–12443. [Google Scholar] [CrossRef] [Green Version]
- Schevchenko, V.P.; Kopeikin, V.M.; Evangeliou, N.; Lisitzin, A.P.; Novigatsky, A.N.; Pankratova, N.V.; Starodymova, D.P.; Stohl, A.; Thomson, R. Atmospheric black carbon over the north Atlantic and Russian arctic seas in summer–autumn time. Khimiya Interesakh Ustoichivogo Razvitiya 2016, 24, 441–446. [Google Scholar] [CrossRef] [Green Version]
- Shevchenko, V.P.; Kopeikin, V.M.; Novigatsky, A.N.; Malafeev, G.V. Black carbon in the atmospheric boundary layer over the North Atlantic and the Russian Arctic seas in June–September 2017. Oceanology 2019, 59, 692–696. [Google Scholar] [CrossRef]
- Popovicheva, O.B.; Evangeliou, N.; Eleftheriadis, K.; Kalogridis, A.C.; Sitnikov, N.; Eckhard, S.; Stohl, A. Black carbon sources constrained by observations in the Russian High Arctic. Environ. Sci. Technol. 2017, 51, 3871–3879. [Google Scholar] [CrossRef] [PubMed]
- Radionov, V.F.; Kabanov, D.M.; Polkin, V.V.; Sakerin, S.M.; Izosimova, O.N. Aerosol characteristics over the Arctic seas of Eurasia: Results of measurements in 2018 and average spatial distribution in the summer–autumn periods of 2007–2018. Probl. Arktiki Antarkt. Probl. Arctic Antarct. 2019, 4, 405–421. (In Russian) [Google Scholar] [CrossRef] [Green Version]
- Cavalli, F.; Facchini, M.C.; Decesari, S.; Mircea, M.; Emblico, L.; Fuzzi, S.; Ceburnis, D.; Yoon, Y.J.; O’Dowd, C.D.; Putaud, J.P.; et al. Advances in characterization of size–resolved organic matter in marine aerosol over the North Atlantic. J. Geophys. Res. 2004, 109, 24215. [Google Scholar] [CrossRef]
- Xie, Z.; Blum, J.D.; Utsunomiya, S.; Ewing, R.C.; Wang, X. Summertime carbonaceous aerosols collected in the marine boundary layer of the Arctic Ocean. J. Geophys. Res. 2007, 112, 2306. [Google Scholar] [CrossRef] [Green Version]
- Engvall, A.C.; Krejci, R.; Ström, J.; Treffeisen, R.; Scheele, R.; Hermansen, O.; Paatero, J. Changes in aerosol properties during spring–summer period in the Arctic troposphere. Atmos. Chem. Phys. 2008, 8, 445–462. [Google Scholar] [CrossRef] [Green Version]
- Massling, A.; Nielsen, I.E.; Kristensen, D.; Christensen, J.H.; Sorensen, L.L.; Jensen, B.; Nguyen, Q.T.; Nojgaard, J.K.; Glasius, M.; Skov, H. Atmospheric black carbon and sulfate concentrations in Northeast Greenland. Atmos. Chem. Phys. 2015, 15, 9681–9692. [Google Scholar] [CrossRef] [Green Version]
- Zhang, Y.; Zhang, Q.; Cheng, Y.; Su, H.; Kecorius, S.; Wang, Z.; Wu, Z.; Hu, M.; Zhu, T.; Wiedensohler, A.; et al. Measuring the morphology and density of internally mixed black carbon with SP2 and VTDMA: New insight into the absorption enhancement of black carbon in the atmosphere. Atmos. Meas. Tech. 2016, 9, 1833–1843. [Google Scholar] [CrossRef] [Green Version]
- Sakerin, S.M.; Zenkova, P.N.; Kabanov, D.M.; Kalashnikova, D.A.; Lisitzin, A.P.; Makarov, V.I.; Polkin, V.V.; Popova, S.A.; Simonova, G.V.; Chankina, O.V.; et al. Results of studying the physicochemical characteristics of atmospheric aerosol in 71th cruise of RV “Akademik Mstislav Keldysh”. Atmos. Ocean. Opt. 2020, 33, 470–479. [Google Scholar] [CrossRef]
- Manual AZ–10: Research and Production Division “ECO–INTECH”, Moscow. 2010. Available online: http://www.eco-intech.com/img/AVimg/Brochure/AZ10.pdf (accessed on 5 April 2014).
- Kozlov, V.S.; Shmargunov, V.P.; Panchenko, M.V. Modified aethalometer for monitoring of black carbon concentration in atmospheric aerosol and technique for correction of the spot loading effect. Proc. SPIE 2016, 10035, 1003530. [Google Scholar] [CrossRef]
- Sakerin, S.M.; Kabanov, D.M.; Rostov, A.P.; Turchinovich, S.A.; Knyazev, V.V. Sun photometers for measuring spectral air transparency in stationary and mobile conditions. Atmos. Ocean. Opt. 2013, 26, 352–356. [Google Scholar] [CrossRef]
- Sakerin, S.M.; Andreev, S.Y.U.; Kabanov, D.M.; Nikolashkin, S.V.; Prakhov, A.N.; Radionov, V.F.; Turchinovich, Y.U.S.; Chernov, D.G.; Holben, B.N.; Smirnov, A. On results of studies of atmospheric aerosol optical depth in arctic regions. Atmos. Ocean. Opt. 2014, 27, 517–528. [Google Scholar] [CrossRef]
- Gorchakov, G.I.; Yemilenko, A.S.; Sviridenkov, M.A. One parameter model of aerosol at the surface. Izv. Acad. Sci. USSR Atmos. Ocean. Phys. 1981, 17, 27–34. [Google Scholar]
- Panchenko, M.V.; Kozlov, V.S.; Pol’kin, V.V.; Terpugova, S.A.; Tumakov, A.G.; Shmargunov, V.P. Retrieval of optical characteristics of the tropospheric aerosol in West Siberia on the basis of generalized empirical model taking into account absorption and hygroscopic properties of particles. Atmos. Ocean. Opt. 2012, 25, 46–54. [Google Scholar]
- Makarov, V.I.; Koutsenogii, K.P.; Koutsenogii, P.K. Daily and seasonal changes of organic and inorganic carbon content in atmospheric aerosol Novosibirsk region. J. Aerosol Sci. 1999, 30, S255–S256. [Google Scholar] [CrossRef]
- Piminov, P.A.; Baranov, G.N.; Bogomyagkov, A.V.; Berkaev, D.E.; Borin, V.M.; Dorokhov, V.L.; Karnaev, S.E.; Kiselev, V.A.; Levichev, E.B.; Meshkov, O.I.; et al. Synchrotron Radiation Research and Application at VEPP–4. Phys. Procedia 2016, 84, 19–26. [Google Scholar] [CrossRef]
- Cheng, M.-D. Geolocating Russian sources for Arctic black carbon. Atmos. Environ. 2014, 92, 398–410. [Google Scholar] [CrossRef]
- Myhre, C.L.; Toledano, C.; Myhre, G.; Lihavainen, H. Regional aerosol optical properties and radiative impact of the extreme smoke event in the European Arctic in spring 2006. Atmos. Chem. Phys. 2007, 7, 511–534. [Google Scholar] [CrossRef] [Green Version]
- Stohl, A.; Berg, T.; Burkhart, J.F.; Fjǽraa, A.M.; Forster, C.; Herber, A.; Hov, Ø.; Lunder, C.; McMillan, W.W.; Oltmans, S.; et al. Arctic smoke–record high air pollution levels in the European Arctic due to agricultural fires in Eastern Europe in spring 2006. Atmos. Chem. Phys. 2007, 7, 511–534. [Google Scholar] [CrossRef] [Green Version]
- Markowicz, K.M.; Pakszys, P.; Ritter, C.; Zielinski, T.; Udisti, R.; Cappelletti, D.; Mazzola, M.; Shiobara, M.; Xian, P.; Zawadzka, O.; et al. Impact of North American intense fires on aerosol optical properties measured over the European Arctic in July 2015. J. Geophys. Res. Atmos. 2016, 121, 14487–14512. [Google Scholar] [CrossRef] [Green Version]
- Pakszys, P.; Zielinski, T. Aerosol optical properties over Svalbard: A comparison between Ny–Ålesund and Hornsund. Oceanologia 2017, 59, 431–444. [Google Scholar] [CrossRef]
- Bond, T.C.; Streets, D.G.; Yarber, K.F.; Nelson, S.M.; Woo, J.H.; Klimont, Z. A technology–based global inventory of black and organic carbon emissions from combustion. J. Geophys. Res. 2004, 109, 14203. [Google Scholar] [CrossRef] [Green Version]
- Cheng, Y.K.; He, K.B.; Duan, F.K.; Du, Z.Y.; Zheng, M.; Ma, Y.L. Ambient organic carbon to elemental carbon ratios: Influence of the thermal–optical temperature protocol and implications. Sci. Total. Environ. 2014, 468–469, 1103–1111. [Google Scholar] [CrossRef] [PubMed]
- Kutsenogii, K.P. Aerosols of Siberia; Novosibirsk, Publishing House of the SB of the RAS: Novosibirsk, Russia, 2006; p. 548. (In Russian) [Google Scholar]
- Finlayson–Pitts, B.J.; Livingston, F.E.; Berko, H.N. Ozone destruction and bromine photochemistry at ground level in the Arctic spring. Nature 1990, 343, 622–625. [Google Scholar] [CrossRef]
- McConnell, J.C.; Henderson, G.S.; Barrie, L.; Bottenheirn, J.; Niki, H.; Langford, C.H.; Templeton, E.M.J. Photochemical bromine production implicated in Arctic boundary–layer ozone depletion. Nature 1992, 355, 150–152. [Google Scholar] [CrossRef]
- Pratt, K.A.; Custard, K.D.; Shepson, P.B.; Douglas, T.A.; Pöhler, D.; General, S.; Zielcke, J.; Simpson, W.R.; Platt, U.; Tanner, D.J.; et al. Photochemical production of molecular bromine in Arctic surface snowpacks. Nat. Geosci. Lett. 2013, 6, 351–356. [Google Scholar] [CrossRef]


| Stage 1: Drift in the ice RV Akademik Tryoshnikov | Stage 4: Cruise of the RV Professor Multanovskiy | |||||
|---|---|---|---|---|---|---|
| North of the Barents Sea | South of the Barents Sea | Kara Sea | Laptev Sea | East Siberian and Chukchi Sea | Far East Seas | |
| Number of hours | 38–495–0 | 5–21–35 | 2–46–87 | 0–0–0 | 8–74–117 | 12–131–168 |
| Number of days | 9–23–0 | 2–3–3 | 1–7–7 | 0–0–0 | 2–8–8 | 4–17–17 |
| RVs Expeditions | Barents Sea (BS) | Kara Sea (KS) | Laptev Sea (LS) | East Siberian and Chukchi Sea (ESCS) | Total for the Expedition |
|---|---|---|---|---|---|
| Akademik Mstislav Keldysh (cruise 54, September–October 2007) | 0–5–5 | 0–27–27 | 0–0–0 | 0–0–0 | 0–30–30 |
| Akademik Fedorov (NABOS–2013, August–September) | 0–9–9 | 0–9–9 | 1–19–19 | 1–5–5 | 2–27–27 |
| Professor Khlyustin (cruise 1, July– September 2013) | 0–0–0 | 0–0–0 | 0–0–0 | 0–13–12 | 0–13–12 |
| Akademik Tryoshnikov (NABOS–2015, August–October) | 0–11–11 | 0–22–21 | 1–12–12 | 0–13–13 | 1–51–50 |
| Akademik Mstislav Keldysh (cruise 66, July–August 2016) | 2–5–5 | 18–35–34 | 0–0–0 | 0–0–0 | 20–38–37 |
| Akademik Mstislav Keldysh (cruise 67, August–October 2016) | 12–39–38 | 0–0–0 | 0–0–0 | 0–0–0 | 12–39–38 |
| Professor Molchanov (July 2017) | 7–12–12 | 0–0–0 | 0–0–0 | 0–0–0 | 7–12–12 |
| Akademik Mstislav Keldysh (cruise 71, July–August 2018) | 1–7–7 | 0–0–0 | 0–0–0 | 0–0–0 | 1–7–7 |
| Akademik Tryoshnikov (“Arctic–2018”, August–September) | 1–4–4 | 1–8–8 | 4–22–21 | 2–12–12 | 8–40–39 |
| Total by seas (2007–2018) | 23–92–91 | 19–101–99 | 6–53–52 | 3–43–42 | 51–257–252 |
| Characteristics | Barents Sea (BS) | Kara Sea (KS) | Laptev Sea (LS) | ESC Seas (ESCS) | Arctic Ocean |
|---|---|---|---|---|---|
| MBC, ng/m3 | 45.3 ± 67.5 | 28.8 ± 27.9 | 25.8 ± 34.0 | 24.3 ± 36.3 | 32.1 ± 44.1 |
| NA, cm−3 | 3.67 ± 3.14 | 3.07 ± 3.45 | 2.42 ± 3.48 | 1.98 ± 2.80 | 2.95 ± 3.36 |
| Vf, µm3/cm3 | 0.29 ± 0.29 | 0.31 ± 0.43 | 0.23 ± 0.36 | 0.19 ± 0.29 | 0.28 ± 0.37 |
| Vc, µm3/cm3 | 1.80 ± 3.78 | 3.13 ± 6.15 | 1.19 ± 2.21 | 0.84 ± 1.36 | 2.14 ± 4.69 |
| 0.080 ± 0.051 | 0.057 ± 0.046 | 0.082 ± 0.077 | 0.037 ± 0.012 | 0.068 ± 0.052 | |
| 0.051 ± 0.048 | 0.024 ± 0.023 | 0.063 ± 0.072 | 0.018 ± 0.006 | 0.040 ± 0.044 | |
| τc(≈β) | 0.029 ± 0.021 | 0.033 ± 0.025 | 0.019 ± 0.014 | 0.019 ± 0.011 | 0.028 ± 0.021 |
| α | 1.00 ± 0.46 | 0.35 ± 0.23 | 0.84 ± 0.37 | 0.74 ± 0.47 | 0.72 ± 0.48 |
| Characteristics | Stage 1 | Stage 4 | ||||
|---|---|---|---|---|---|---|
| NBS | SBS | KS | LS | ESCS | FE Seas | |
| MBC, ng/m3 | – | 179 ± 133 | 39 ± 30 | 34 ± 31 | 74.1 ± 56.5 | 108 ± 93 |
| NA, cm−3 | 2.01 ± 1.10 | 8.62 ± 2.65 | 2.83 ± 1.60 | – | 4.17 ± 3.52 | 3.26 ± 3.64 |
| Vf, µm3/cm3 | 0.16 ± 0.09 | 0.85 ± 0.26 | 0.27 ± 0.16 | – | 0.38 ± 0.34 | 0.30 ± 0.35 |
| 0.067 ± 0.036 | 0.128 ± 0.021 | 0.174 ± 0.013 | – | 0.360 ± 0.188 | 0.264 ± 0.077 | |
| 0.045 ± 0.031 | 0.092 ± 0.029 | 0.149 ± 0.005 | – | 0.315 ± 0.174 | 0.217 ± 0.071 | |
| τ c(≈β) | 0.022 ± 0.011 | 0.036 ± 0.012 | 0.025 ± 0.008 | – | 0.045 ± 0.014 | 0.047 ± 0.021 |
| α | 1.23 ± 0.38 | 0.99 ± 0.09 | 1.19 ± 0.06 | – | 1.14 ± 0.12 | 1.25 ± 0.13 |
| Stage 1 | Stage 4 | ||||||
|---|---|---|---|---|---|---|---|
| Characteristics | NBS (n = 9) | SBS (n = 2) | KS (n = 2) | LS (n = 1) | ESCS (n = 2) | ASAO | FE Seas (n = 2) |
| OC, ng/m3 | 632 ± 458 | 1460 ± 989 | 420 ± 146 | 833 | 735 ± 337 | 629 ± 269 | 999 ± 633 |
| EC, ng/m3 | 25 ± 19 | 98 ± 64 | 45 ± 12 | 46 | 50 ± 2.9 | 47 ± 8 | 118 ± 9.1 |
| PM, µg/m3 | 3.3 ± 1.8 | 21.9 ± 17 | 7 ± 0.1 | 13 | 10.8 ± 2.5 | 9.7 ± 2.9 | 11.5 ± 1.8 |
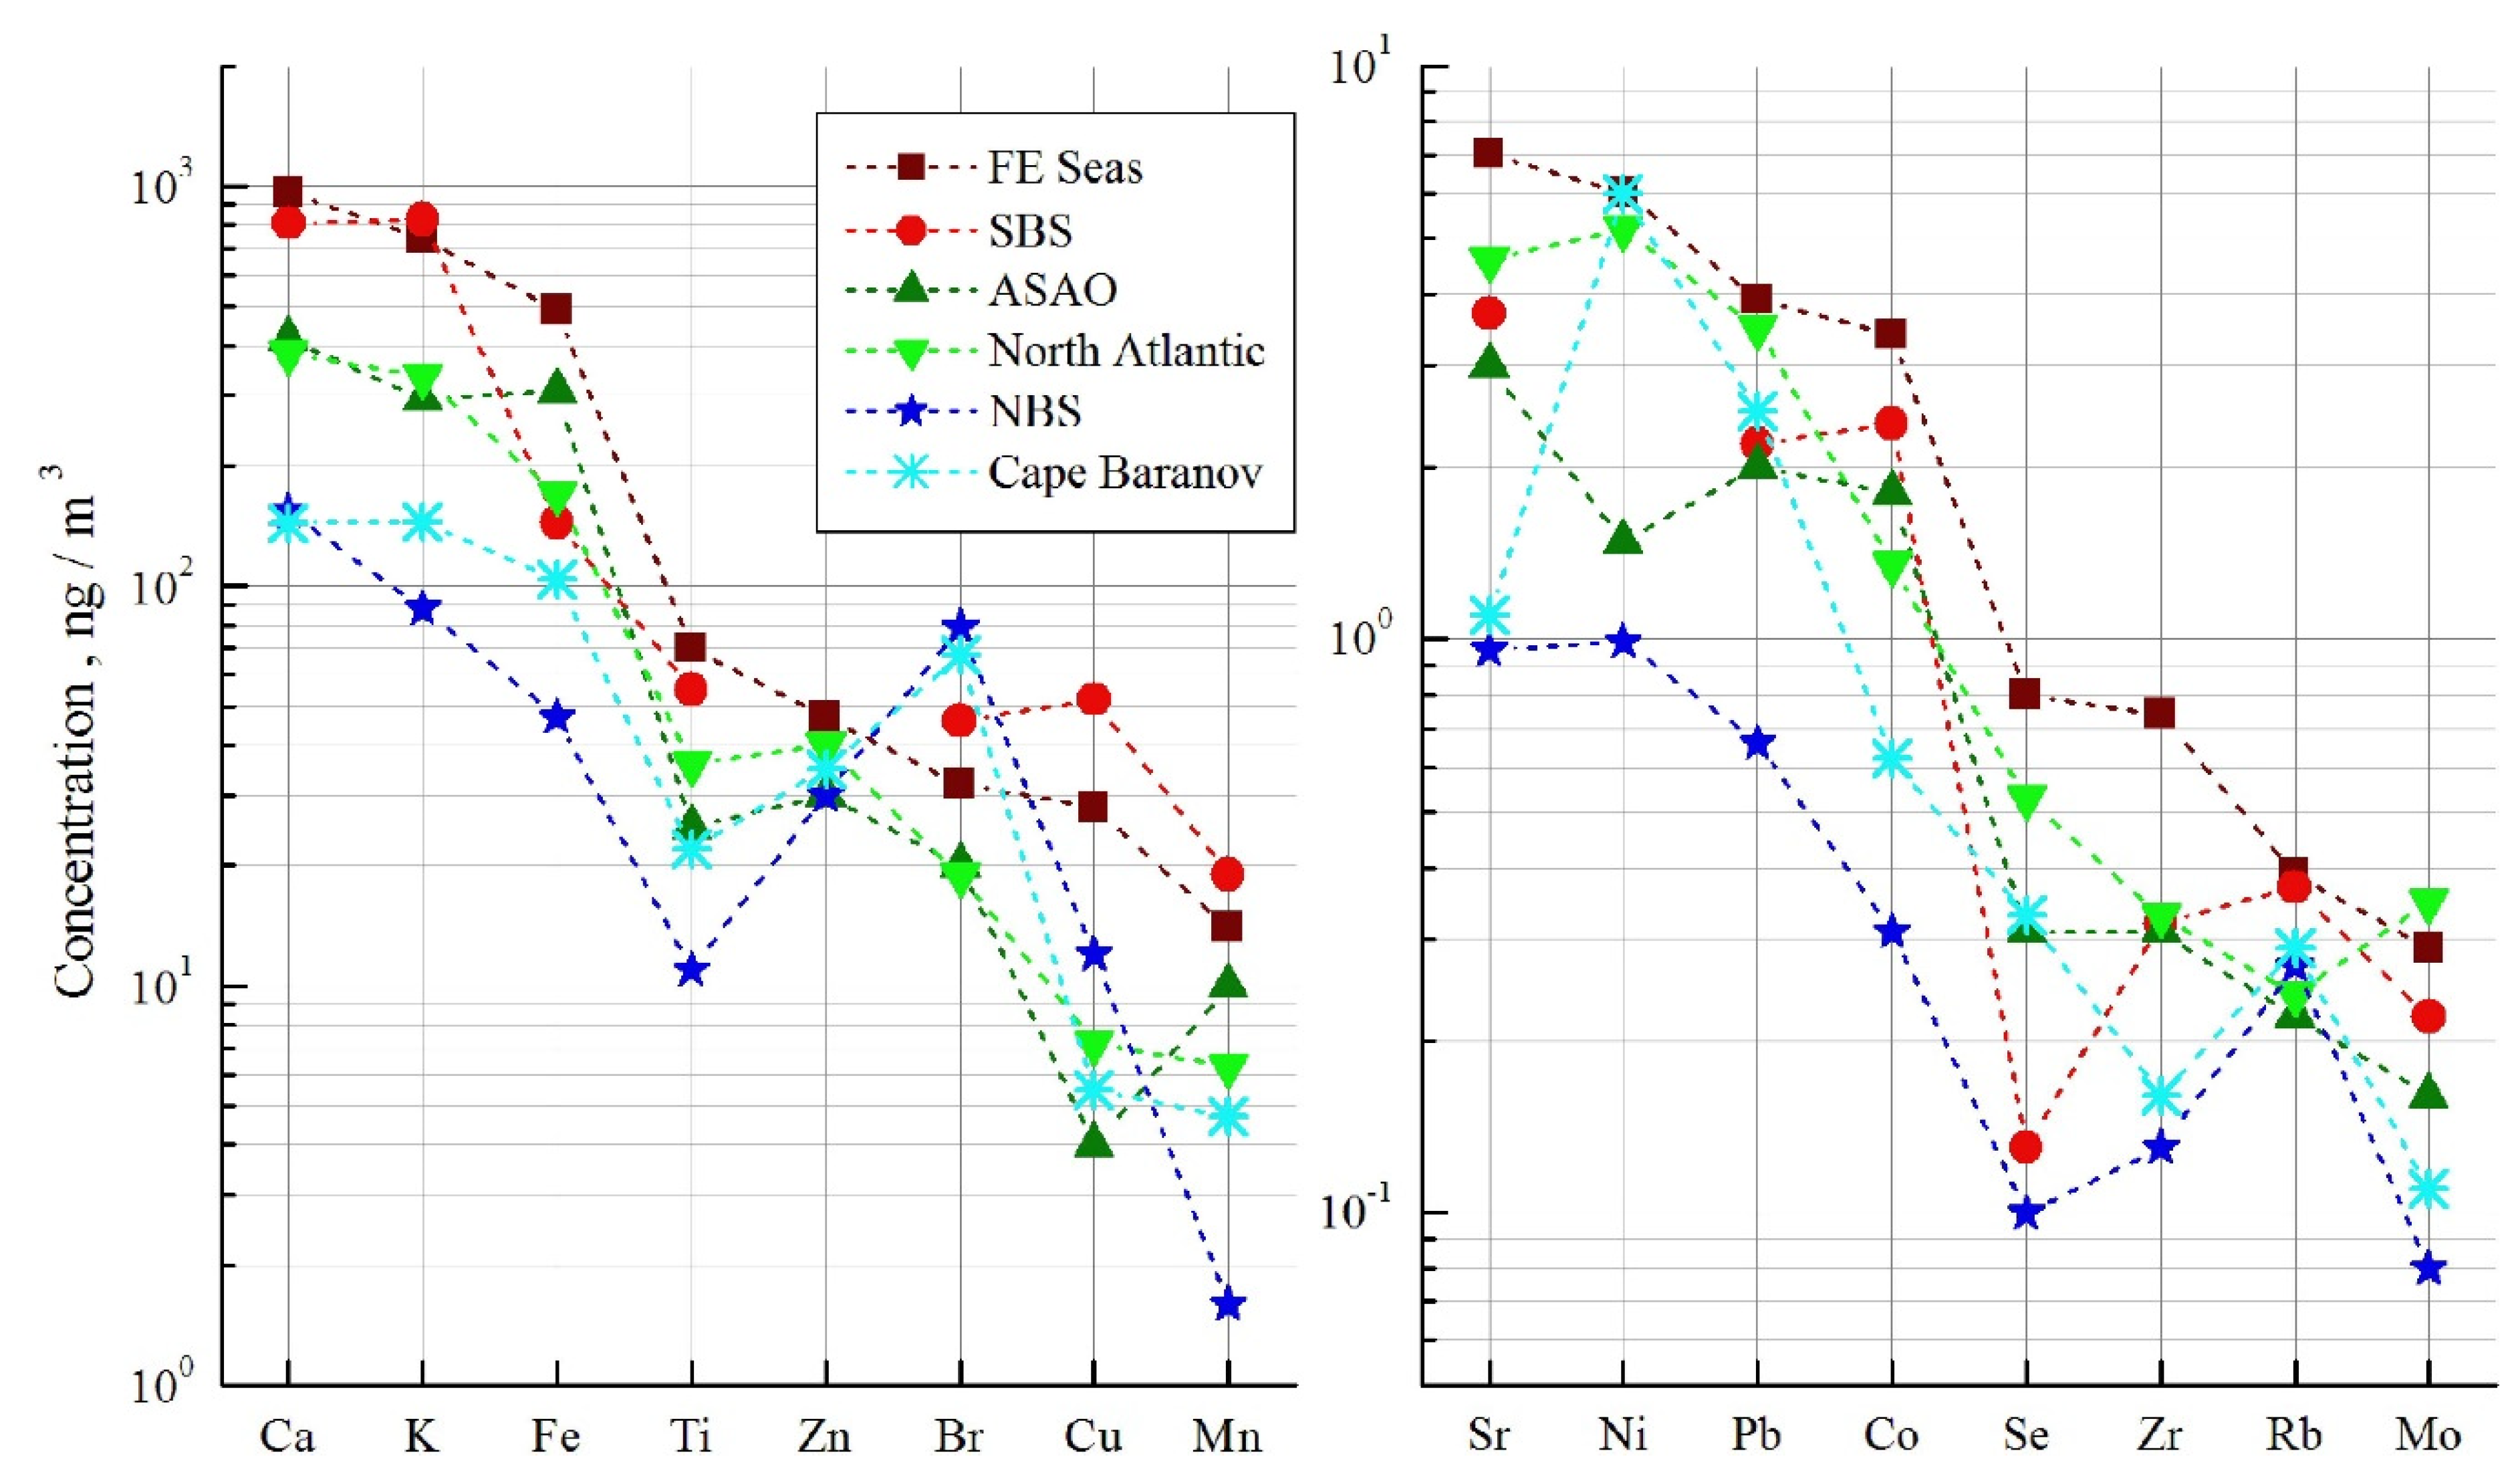
| Elements | NBS (n = 9) | ASAO (n = 5) | SBS (n = 2) | FE Seas (n = 2) |
|---|---|---|---|---|
| Ca | 154 ± 140 | 414 ± 272 | 808 ± 534 | 965 ± 708 |
| K | 88 ± 47 | 294 ± 178 | 824 ± 478 | 742 ± 745 |
| Fe | 47 ± 34 | 308 ± 287 | 144 ± 85 | 490 ± 32 |
| Zn | 30 ± 13 | 30 ± 9.1 | n.d. | 47 ± 34 |
| Br | 79 ± 44 | 20 ± 9.1 | 46 ± 22 | 32 ± 28 |
| Ti | 11 ± 4.0 | 25 ± 13 | 55 ± 55 | 70 ± 97 |
| Cu | 12 ± 8.0 | 3.6 ± 1.4 | 52 ± 17 | 28 ± 7.1 |
| Mn | 1.6 ± 0.80 | 10 ± 8.8 | 19 ± 8.0 | 14 ± 6.2 |
| Sr | 0.96 ± 0.60 | 3.0 ± 1.4 | 3.7 ± 1.9 | 7.1 ± 6.0 |
| Co | 0.31 ± 0.16 | 1.8 ± 1.2 | 2.4 ± 1.3 | 3.4 ± 0.1 |
| Pb | 0.66 ± 0.91 | 2.0 ± 1.1 | 2.2 ± 2.1 | 3.9 ± 2.0 |
| Ni | 0.99 ± 0.46 | 1.5 ± 1.9 | n.d. | 6.0 ± 7.2 |
| Se | 0.10 ± 0.05 | 0.31 ± 0.23 | 0.13 ± 0.09 | 0.80 ± 0.55 |
| Rb | 0.27 ± 0.21 | 0.22 ± 0.13 | 0.37 ± 0.23 | 0.39 ± 0.29 |
| Zr | 0.13 ± 0.18 | 0.31 ± 0.35 | 0.32 ± 0.39 | 0.74 ± 0.87 |
| Nb | 0.05 ± 0.03 | 0.07 ± 0.03 | 0.24 ± 0.17 | 0.21 ± 0.17 |
| Mo | 0.08 ± 0.06 | 0.16 ± 0.03 | 0.22 ± 0.20 | 0.29 ± 0.17 |
Publisher’s Note: MDPI stays neutral with regard to jurisdictional claims in published maps and institutional affiliations. |
© 2020 by the authors. Licensee MDPI, Basel, Switzerland. This article is an open access article distributed under the terms and conditions of the Creative Commons Attribution (CC BY) license (http://creativecommons.org/licenses/by/4.0/).
Share and Cite
Sakerin, S.M.; Kabanov, D.M.; Makarov, V.I.; Pol’kin, V.V.; Popova, S.A.; Chankina, O.V.; Pochufarov, A.O.; Radionov, V.F.; Rize, D.D. Spatial Distribution of Atmospheric Aerosol Physicochemical Characteristics in the Russian Sector of the Arctic Ocean. Atmosphere 2020, 11, 1170. https://doi.org/10.3390/atmos11111170
Sakerin SM, Kabanov DM, Makarov VI, Pol’kin VV, Popova SA, Chankina OV, Pochufarov AO, Radionov VF, Rize DD. Spatial Distribution of Atmospheric Aerosol Physicochemical Characteristics in the Russian Sector of the Arctic Ocean. Atmosphere. 2020; 11(11):1170. https://doi.org/10.3390/atmos11111170
Chicago/Turabian StyleSakerin, Sergey M., Dmitry M. Kabanov, Valery I. Makarov, Viktor V. Pol’kin, Svetlana A. Popova, Olga V. Chankina, Anton O. Pochufarov, Vladimir F. Radionov, and Denis D. Rize. 2020. "Spatial Distribution of Atmospheric Aerosol Physicochemical Characteristics in the Russian Sector of the Arctic Ocean" Atmosphere 11, no. 11: 1170. https://doi.org/10.3390/atmos11111170