
Abstract
To emphasize the relationship between the pre-seismic geomagnetic signals and Vrancea seismicity, in this work it is hypothesized that before an earthquake initiation, the high stress reached into seismogenic volume generates dehydration of the rocks and fracturing processes followed by release of electric charges along the faulting systems, which lead to resistivity changes. These changes were explored on September 2016 by the normalized function Bzn obtained from the geomagnetic data recorded in ULF range (0.001–0.0083 Hz). A statistical analysis was also performed to discriminate on the new Bzn* time series a pre-seismic signature related to the Mw5.7 earthquake. Significant anomalous behavior of Bzn* was identified on September 21, with 3 days prior to the onset of the seismic event. Similar information is provided by registrations of the magnetic and electron concentration variations in the ionosphere over the Vrancea zone, by Swarm satellites, 4 days and 1 day before the earthquake.
Introduction
In the last few decades on the ground-based observations, more data regarding the existence of the electromagnetic precursors related to the earthquakes have been accumulated (Biagi et al. 2011; Fraser-Smith et al. 1990; Fenoglio et al. 1995; Han et al. 2015; Hattori et al. 2013; Hayakawa and Fujinawa 1994; Huang 2011; Johnston 1997; Kopytenko et al. 1994; Nagao et al. 2002; Stanica and Stanica 2010, 2011, 2012; Stanica et al. 2015; Uyeda et al. 2011; Uyeda 2013, 2015; Varotsos 2005). The satellite observations over the seismic areas indicate changes of the ionosphere state before the earthquakes (Błęcki et al. 2010, 2011; Hayakawa et al. 2011; Parrot 1995; Parrot et al. 2015). Even if all the above works have presented a posteriori observations related to the different pre-seismic signatures, their very optimistic results, together with the theoretical models of fracture induced electromagnetic phenomena (Rabinovitch et al. 2007; Hunt et al. 2007), laboratory experiments on the rock samples (Freund 2000; Freund et al. 2006), ionosphere state observation by the vertical magnetic component (Ernst et al. 2010), the correlation of resistivity variations and geodynamic processes (Bataleva et al. 2013) and very long time electromagnetic data acquisition, processing and analysis realized for a unique and very active seismic zone in Romania, offer a great advantage in emphasizing useful information regarding the possible interrelations between the Vrancea’s earthquakes generation and geomagnetic signature. Thus, in this work, we focused on the geomagnetic methodology able to identify in the ultra-low frequency (ULF) range a pre-seismic anomalous signal related to the Mw5.7 earthquake triggered on September 24, 2016, and to bring strong arguments in favor of the need to asses such information, daily, on the institute website (http://www.geodin.ro), as it is shown in Fig. 1, with the aim to promote an international scientific co-operation.

Daily mean distribution of the geomagnetic parameters Bzn and Bzn* presented on the Institute of Geodynamics of the Romanian Academy website (photo image captured on September 28, 2016). White vertical bar is Bzn; red vertical bar is standard deviation (SD); red full circle is earthquake; the ratio 5.7/92 km is earthquake magnitude/hypocentre depth; blue vertical bar is Bzn*abs (abs means absolute value); red dashed line is threshold for anomaly; red vertical arrow indicates the pre-seismic signal occurrence; the explanation of the parameter Bzn and Bzn* will be done below
Methodology, data processing and analyzing
An earthquake of Mw5.7 struck the Vrancea zone, Romania, on September 24, 2016 at 02:11:20 local time (LT). The epicenter was located at the geographic coordinates 45.710N and 26.620E, with a focal depth at 92 km and, about 150 km NE of Bucharest, as it was determined by the Euro-Mediterranean Seismic Centre (http://www.emsc-csem.org). Although this earthquake was moderate, it was felt in Bucharest and generated panic to a certain extent through its inhabitants, being intensively mediated on the TV “Breaking News”, as seismologists systematically claimed a possible imminence of a large earthquake, based on the recurrence rate of about 40 years, on the analogy of the previous two earthquakes incidence of Mw7.7 on November 10, 1940 and Mw7.5 on March 4, 1977, respectively.
Basic concept of the geomagnetic precursor
It was demonstrated by Word et al. (1970) that for a 2D geoelectric structure, the vertical component (Bz) of the geomagnetic field is produced mainly by the horizontal magnetic component perpendicular to strike (\({\text{B}} \bot\)) and, as a consequence, the normalized function (Bzn) having the form:
should be time invariant and it becomes unstable due to the geodynamic processes related to the intermediate-depth seismicity, being associated with the resistivity changes along the good conducting pass in the lithosphere (Stanica and Stanica 2011), according to the relation (2):
where \(\rho_{\parallel }\) is resistivity parallel [Ωm] to the geoelectric strike, ρz is vertical resistivity [Ωm] and f is frequency [Hz].
Consequently, the existence of a 2-D structure gives rise to normalized function Bzn that has the magnitude proportional to the intensity of the geomagnetic component perpendicular to the geoelectric strike, which is in turn determined by the electric field concentrations released in pre-seismic conditions and propagated along the strike, due to the torsion process of the Vrancea’s seismogenic volume (Stanica et al. 2004; Stanica and Stanica 2012).
To fulfill the conditions imposed by relation (1), the Geodynamic Observatory Provita de Sus (GOPS) is placed on the Carpathian electrical conductivity anomaly (CECA), at about 100 km westwards of the seismic active Vrancea zone (Fig. 2). This conductivity anomaly is generated by a 2D geoelectric structure (Pinna et al. 1993; Stanica et al. 1999) and it was identified in the ULF range (0.001–0.0083 Hz), on the basis of the magnetotelluric dimensionality parameters skewness and strike (Stanica and Stanica 2010).

Map with crustal (black dots) and intermediate (read dots) earthquakes in Vrancea zone. Carpathian Electrical Conductivity Anomaly (yellow dashed line); epicenter of M5.7 earthquake (yellow star); Geodynamic Observatory Provita de Sus (blue star)
According to relation (3), the ULF range (0.001–0.0083 Hz) may be associated with the intermediate-depth earthquakes interval (60–180 km) where possible geomagnetic signals are generated. This supposition is based on the electromagnetic skin depth relation, which in this study is equated with penetration depth of the electromagnetic field into the Earth and can be approximated as:
where p is the penetration depth (m), σ is conductivity (S/m) and f is frequency (Hz).
If in relation (3) it is assumed that the Earth’s lithosphere has an average conductivity of about 10−2 S/m and f = 0.001 Hz (minimum value in ULF range), then the geomagnetic signal generated in Vrancea’s seismogenic volume, at about 160 km depth, can reach to the GOPS.
To identify the distance for pre-seismic signal detection, depending on the earthquake magnitude, we used the Morgunov and Malzev (2007) relation:
where R* is epicentral distance and M is earthquake magnitude.
In particular, for the Mw5.7 earthquake that occurred on September 24, the epicentral distance R* ≈ 380 km. As the distance between GOPS and the earthquake epicenter is about 100 km (Fig. 2), the condition for pre-seismic signal detection imposed by relation (4) is fulfilled.
Satellite observations
The registrations performed by the Swarm satellites over Vrancea zone, before the M5.7 earthquake, are used as an additional information about variations in the ionosphere. Swarm is a constellation of three satellites to measure the Earth’s magnetic field and identify the sources of its variations originated from core, ionosphere, magnetosphere, mantle, crust and as well as the oceans. This mission consists of the three identical Swarm satellites (A, B, and C), which were launched on 22 November 2013 into a near-polar orbit. Swarm A and C form the lower pair of satellites flying side by side (1.4° separation in longitude) at an altitude of about 470 km (inclination angle is equal to 87.30°), whereas Swarm B is cruising at higher orbit of about 520 km (inclination angle is equal to 87.75°). They are equipped with a set of six identical instruments—absolute scalar magnetometer, vector field magnetometer, star tracker, electric field instrument, GPS receiver, and accelerometer. Further, we use data from vector field magnetometer to study magnetic field variations and Langmuir probe (being a part of electric field instrument) to provide the representation of the main filed.
The magnetometers installed on-board of Swarm satellites measure main magnetic field with sampling rate 50 Hz (3 components and absolute value). On this way, we are looking for the ionosphere effects associated with seismic activity, that are mainly seen in the variations of the electromagnetic fields in very broad frequency range from fraction of Hz up to several Hz (Olsen et al. 2013).
Geomagnetic and satellite data processing and analysis
Geomagnetic data
The ground-based monitoring system used for this study is installed at GOPS (Fig. 2) and consists of: (1) data logger (MAG-03 DAM) and a three-axes fluxgate magnetic sensor (MAG-03MS), both used for the geomagnetic time series (B⊥ and Bz) collection with a sampling rate of 60 s; (2) Computer with programs dedicated to the data acquisition, storage and daily transfer, via internet cable, to Bucharest at the Institute of Geodynamics of the Romanian Academy (IG-RA).
The automatic system installed at IG-RA is composed by: (1) Computer (server) used to receive and storage daily the geomagnetic data records; (2) work-station with specific programs for data processing, analysis and display on the institute webpage.
In this study, the daily mean distributions of the Bzn and Bzn* with their standard deviation (SD) are analyzed on the span of time 01–30 September 2016, by the following procedures:
-
FFT Band-pass filtering (BPF) analysis in the ULF range was applied to Bzn time series, for two successive time windows of 1024 samples, with about 30% overlapping on 1440 data acquired each day (Table 1; Fig. 3);
Table 1 B⊥, Bz, Bzn and Bzn (FFT-BPF) time series obtained for 20 min on September 22, 2016, Bzn mean and Bzn (FFT-BPF) mean are daily averaged values Fig. 3 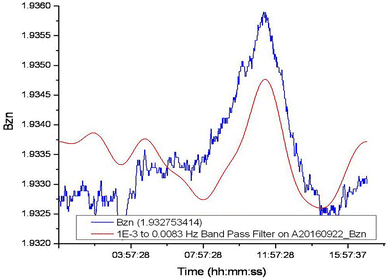
FFT Band-pass filtering (red line) applied on Bzn time series (blue line) for a time windows of 1024 samples recorded on September 22, 2016
-
Statistical analysis based on the standardized random variable has been used to discriminate the pre-seismic anomalous intervals as follows:

where \(X\) is daily mean value of Bzn, \(\overline{X}\) is mean value of Bzn obtained for 30 consecutive days before \(X\), \(\overline{Y}\) is mean value of SD obtained for 30 consecutive days before \(X\), \({\text{Bzn*}}\) is threshold for anomaly using SD.
On this way, it is expected to eliminate seasonal variation of the normalized function Bzn and to discriminate with high accuracy the pre-seismic geomagnetic signature related to the seismic event.
A very important element of the initial stage of interpretation is to ascertain that the geomagnetic component Bz is not of external origin, i.e., it is not an over-ground effect of ionosphere currents. We verified it on the basis of records from two magnetic observatories belonging to the INTERMAGNET network: Surlari (Romania) and Tihany (Hungary).
We divided the Bz component variations into the internal (induction) and external parts (Ernst and Jankowski 2005; Ernst et al. 2010). It is worth noting that the external part of Bz variations is often much bigger than the induction (internal) one.
Such a situation is shown in Fig. 4, from which it is also evident how important it is to take into account and analyze the external part Bze in the study of pre-seismic processes.

Twelve-hour time series from Magnetic Observatory Surlari. Bz is total vertical component; Bzi is internal (induced) part of vertical component; Bze is external part of vertical component
In Fig. 5, we present 5-day simultaneous time series of the horizontal geomagnetic components B x and B y and the external part of Bz (denoted Bze) recorded at the observatories Surlari and Tihany, where it is clearly emphasized that changes of Bze in the both observatories are negligible (< 3 nT), which makes it sure that Bz used in relation (1) is not of external origin, and the anomalous behavior of the Bzn may be interpreted as the earthquake precursor.

Five-day simultaneous time series from Magnetic Observatories Surlari and Tihany. B x S and B y S are horizontal components for at Surlari; B x T and B y T are horizontal components from Tihany; Bze S is external part of vertical component from Surlari; Bze T is external part of vertical component from Tihany
Satellite data
The registrations performed by the Swarm satellites limits our studies only to very low frequencies called ULF (ultra-low frequencies up to single Hz) and ELF (extra low frequencies). The magnetic vector is measured with a frequency of 50 Hz, what gives theoretically the possibility to study variations up to 25 Hz, but the filter inside the instrument limits this range to 15 Hz.
Next problem of our studies is related to the extremely small values of these variations (typically fraction of nT) in comparison with the main geomagnetic field measured in tens thousands of nT. Their observation requires sensitive magnetometers and carefully selected methods of signal analysis. The use of the vector field magnetometer on board Swarm, intended for observation of the main geomagnetic field, requires application of special filtering techniques.
Steps distinguished in the data processing chain are as follows:
-
1.
δBi residuals retrieval from the measured signal for three B components;
-
2.
FFT transformation applied to the δBi residuals;
-
3.
Generation of time–frequency spectrograms for δBi along the orbit in the frequency range up to 25 Hz;
-
4.
Integration of lightning’s database with derived Swarm δBi spectra.
In the δBi residuals retrieval procedure, a second-order polynomial approximation is applied to set of 1024 samples of the VFM waveform measurements. Also, non-linear least squares method and the Levenberg–Marquardt algorithm are used to provide the representation of the main filed. Thus, δBi is obtained as a difference between measured signal and computed best fit. In the next step FFT is applied, giving power spectrum for each component and intensity of the B field residuals, in the frequency range up to 25 Hz. The FFT window is 1024 samples wide, advanced by 256 samples for overlapping.
Results and discussion
The continuous monitoring of the Bzn and Bzn* time series realized in the last 10 years at GOPS has shown small variability related to their normal trend observed in non-geodynamic conditions and has emphasized consistent anomalies some days before the onset of the seismic event.
To have a comprehensive view on the applied methodology, in this work the daily mean distributions of the Bzn and Bzn* obtained in September 2016, in correlation with Mw5.7 earthquake, are presented in Figs. 6 and 7.

Daily mean distribution of Bzn and SD on September 2016. Blue line is Bzn; red vertical bar is SD; red star is earthquake; the ratio 5.7/92 km is earthquake magnitude/hypocentre depth, in km

Daily mean distribution of the Bzn* and earthquakes magnitude obtained on September 2016. Blue bar is Bzn*abs; red full circle is earthquake; the ratio 5.7/92 km is earthquake magnitude/hypocentre depth in km; red dashed line is threshold for anomaly using SD
In Fig. 6, there is a significant anomalous domain of minimum, extended on the interval September 19–September 26, with values ranging from 1.933 to 1.942, easily identifiable on the Bzn distribution. This abnormal change of Bzn may be associated with the increasing magnitude of B⊥ (see relation 1) which is basically controlled by the electric charges released and propagated along the CECA, prior the onset of the seismic event, as the result of high stress reached in seismogenic volume (Stanica and Stanica 2012).
The Bzn* time series, displayed in absolute value (Bzn*abs) on the same time interval as Bzn, is shown in Fig. 7. On the Bzn* anomaly, extended on the interval September 21–25, a pre-seismic geomagnetic signature corresponding to a magnitude greater than 5·SD (red dashed line) is emphasized starting with 3 days before the onset of the Mw5.7 earthquake on September 24.
The analysis of the ULF/ELF emissions and electron density in the ionosphere in the vicinity of the earthquake epicenter has been performed for 4 days, on the time interval September 20–23 and 1 day before the Vrancea earthquake. A very weak effect of increasing of the intensity and variations of the electron density has been registered close to the epicenter. For these days, the disturbances registered by Swarm are presented below in details.
Figure 8 shows the part of orbit of the Swarm B satellite during observations on September 20. The color of the dots corresponds to the intensity of the magnetic field variations in the determined point. The enhancement of the intensity is seen in the closest vicinity part to the epicenter.

The part of Swarm B orbit related to the flight over Vrancea zone on September 20. The color of the dots on the orbit line corresponds to the intensity of the magnetic field variations
In Fig. 9 are shown the spectra of the magnetic field variations and changes of the electron concentration in the vicinity (around 600 km) of the Vrancea earthquake epicenter 4 days before this event. The variations of the electron density are seen in time interval between 08:17 and 08:19UT. The satellite flown by, in this time, a distance of about 900 km. The variations of the magnetic field were present during this entire interval. The effect shown in this case is very weak in comparison to the effect reported from DEMETER registration (Parrot et al. 2006; Błęcki et al. 2010), but clearly seen. The spectra have a maximum in the lowest part of the frequency range and correspond to the range below the oxygen ions O+ gyro-frequency which is of the order of 34 Hz. It can be associated with Alfven waves.

The spectra of the magnetic field variations (upper panel) and electron concentration registered by Swarm B satellite in the vicinity of the Vrancea zone on September 20
Figure 10 presents spectra of the magnetic field variations and electron concentration taken on September 23 (1 day before the discussed earthquake) from half orbit crossing the Vrancea zone. One can see strong effects associated with high latitude regions (auroral oval, ionospheric through) in comparison with the weak variations in the vicinity (distance about 500 km) of the epicenter. The closest vicinity was at 16:04UT. The disturbances are seen around 16:04 to 16:05UT.

The same as in Fig. 9, but for the September 23 and taken for entire half orbit crossing area in vicinity of the Vrancea zone. White line represents the position of the satellite
The weakness of the variations seen by Swarm satellites in comparison to reported after DEMETER mission can be related to the smaller effects in the magnetic field than in electric measured by DEMETER, the earthquake was also weaker and may be the local conditions not amplified the electromagnetic effect.
Conclusions
In this paper, we have investigated the ULF geomagnetic data recorded on September 2016 to find a possible pre-seismic signal associated with Mw5.7 earthquake occurred on September 24. On this interval of analysis, a very clear and unusual anomaly of minimum, extended from September 19 to September 26, has been detected on the Bzn distribution. The new Bzn* time series, obtained after applying a statistical analysis based on Eq. 5, indicates that the variability of Bzn is not at random one, this being a significant and reliable anomalous pre-seismic effect associated with Mw5.7 earthquake. The both results suggest that the pre-seismic anomalous behavior of the Bzn and Bzn*, emphasized by Figs. 6 and 7, was triggered with 3 days before the onset of the seismic event. Complimentarily, the analysis of external part of the vertical geomagnetic field, recorded in the observatories Surlari and Tihany, demonstrated that vertical component (Bz) recorded at GOPS is of internal origin and, consequently, the pre-seismic anomalous signatures observed in the Bzn time series may be interpreted as the earthquake precursor. The measurements originated from Swarm satellites also indicate some disturbances of the magnetic field and electron concentration over Vrancea zone with 3 days before the Mw5.7 earthquake, but the effect was rather small because the earthquake was weaker.
References
Bataleva EA, Batalev VYu, Rybin AK (2013) On the correlation of crustal conductivity variations and geodynamic processes. Izvestya. Phys Solid Earth 3:105–113
Biagi PF, Maggipinto T, Righetti F, Loiacono D, Schiavulli L, Ligonzo T, Ermini A, Moldovan IA, Moldovan AS, Buyuksarac A, Silva HG, Bezzeghoud M, Contadakis ME (2011) The European VLF/LF radio network to search for earthquake precursors: setting up and natural/man-made disturbances. Nat Hazards Earth Syst Sci 11:333–344. https://doi.org/10.5194/nhess-11-333-2011
Błęcki J, Parrot M, Wronowski R (2010) Studies of the electromagnetic field variations in ELF frequency range registered by DEMETER over the Sichuan region prior to the 12 May 2008 Earthquake. Int J Remote Sens 31:3615–3629. https://doi.org/10.1080/01431161003727754
Błęcki J, Parrot M, Wronowski R (2011) Plasma turbulence in the ionosphere prior to earthquakes, some remarks on the DEMETER registrations. JAES 41:450–458. https://doi.org/10.1016/j.jseaes.2010.05.016
Ernst T, Jankowski J (2005) On the plane wave approximation of the external geomagnetic field in the regional induction study. Izv Phys Solid Earth 41(5):363–370
Ernst T, Jankowski J, Nowozynski K (2010) A new magnetic index based on the external part of vertical geomagnetic variation. Acta Geophys 58(6):963–972. https://doi.org/10.2478/s11600-010-0014-9
Fenoglio MA, Johnston MJS, Bierlee JD (1995) Magnetic and electric fields associated with changes in high pore pressure in fault zones: application to the Loma Prieta ULF emissions. J Geophys Res 100:12951–12958
Fraser-Smith AC, Bernardi A, Mc Gill PR, Ladd ME, Halliwell RA, Villard OG Jr (1990) Low frequency magnetic field measurements near the epicenter of the M 7.1 Loma Prieta earthquake. Geophys Res Lett 17:1465–1468
Freund F (2000) Time-resolved study of charge generation and propagation in igneous rocks. J Geophys Res B 105:11001–11019
Freund FT, Takeuchi A, Lau RWS (2006) Electric currents streaming out of stressed igneous rocks—a step towards understanding pre-earthquake low frequency EM emissions. Phys Chem Earth 31:389–396
Han P, Hattori K, Xu G, Ashida R, Chen CH, Febriani F, Yamaguchi H (2015) Further investigation of geomagnetic diurnal variation associated with the 2011 off the Pacific coast of Tohoku earthquake (Mw 9.0). J Asian Earth Sci 114:431–434. https://doi.org/10.1016/j.jseas.2015.02.022
Hattori K, Han P, Huang Q (2013) Global variation of ULF geomagnetic fields and detection of anomalous changes at a certain observatory using reference data. Electr Eng Jpn 182:9–18. https://doi.org/10.1002/eej.22299
Hayakawa M, Fujinawa AY (1994) Electromagnetic phenomena related to the earthquake prediction. Terra Scientific Pub Comp, Tokyo
Hayakawa M, Hobara Y, Ohta K, Hattori K (2011) The ultra-low-frequency magnetic disturbances associated with earthquakes. Earthq Sci 24:523–534. https://doi.org/10.1007/s11589-011-0814-2
Huang Q (2011) Retrospective investigation of geophysical data possibly associated with the Ms8.0 Wenchuan earthquake in Sichuan, China. J Asian Earth Sci 41:421–427. https://doi.org/10.1016/j.jseaes.2010.04.014
Hunt A, Gershenzon N, Bambakidis G (2007) Pre-seismic electromagnetic phenomena in the framework of percolation and fractal theories. Tectonophysics 431:23–32. https://doi.org/10.1016/j.tecto.2006.05.02
Johnston MJS (1997) Review of electric and magnetic fields accompanying seismic and volcanic activity. Surv Geophys 18:441–475. https://doi.org/10.2183/pjab.86.257
Kopytenko YA, Matiashvili TG, Voronov PM, Kopytenko EA (1994) Observation of electromagnetic ultra-low frequency lithospheric emission in the Caucasian seismically active zone and their connection with earthquakes. In: Hayakawa M, Fujinawa AY (eds) Electromagnetic phenomena related to earthquake prediction. Terra Scientific Pub Comp, Tokyo, pp 175–180
Morgunov VA, Malzev SA (2007) A multiple fracture model of pre-seismic electromagnetic phenomena. Tectonophysics 431:61–72. https://doi.org/10.1016/j.tecto.2006.05.030
Nagao T, Enomoto Y, Fujinawa Y, Hata M, Hayakawa M, Huang Q, Izutsu J, Kushida Y, Maeda K, Oike K, Uyeda S, Yoshino T (2002) Electromagnetic anomalies associated with 1995 Kobe earthquake. J Geodyn 33:401–411
Olsen N, Friis-Christensen E, Floberghagen R, Alken P, Beggan CD, Chulliat A, Doornbos E, Teixeira da Encarnacao J, Hamilton B, Hulot G, van den Ijssel J, Kuvshinov A, Lesur V, Lühr H, Macmillan S, Maus S, Noja M, Olsen PEH, Park J, Plank G, Püthe C, Rauberg J, Ritter P, Rother M, Sabaka TJ, Schachtschneider R, Sirol O, Stolle C, Thebault E, Thomson AWP, Tøffner-Clausen L, Velimsky J, Vigneron P, Visser PN (2013) The Swarm satellite constellation application and research facility (SCARF) and Swarm data products. Earth Planets Space 65:1189–1200. https://doi.org/10.5047/eps.2013.07.001
Parrot M (1995) Use of satellites to detect seismo-electromagnetic effects. Adv Space Res 15:27–35
Parrot M, Berthelier JJ, Lebreton JP, Sauvaud JA, Santolik O, Blecki J (2006) Examples of unusual ionospheric observations made by the DEMETER satellite over seismic regions. Phys Chem Earth 31:486–495
Parrot M, Berthelier JJ, Blecki J, Brochot JY, Hobara Y, Lagoutte D, Lebreton JP, Němec F, Onishi T, Pinçon JL, Píša D, Santolík O, Sauvaud JA, Slominska E (2015) Unexpected events recorded by the ionospheric satellite DEMETER. Surviv Geophys 36:483–511. https://doi.org/10.1007/s10712-015-9315-5
Pinna E, Soare A, Stanica D, Stanica M (1993) Carpathian conductivity anomaly and its relation to deep substratum structure. Acta Geod Geophys Montan 27(1):35–45
Rabinovitch A, Friend D (2007) A possible source of fracture induced electromagnetic radiation. Tectonophysics 431:15–21. https://doi.org/10.1016/j.tecto.2006.05.027
Stanica D, Stanica DA (2010) Constraints on correlation between the anomalous behaviour of electromagnetic normalized functions (ENF) and the intermediate depth seismic events occurred in Vrancea zone (Romania). Terr Atmos Ocean Sci 21:675–683. https://doi.org/10.3319/TAO.2009.09.09.01(T)
Stanica D, Stanica DA (2011) Anomalous pre-seismic behaviour of the electromagnetic normalized functions related to the intermediate depth earthquakes occurred in Vrancea zone, Romania. Nat Hazards Earth Syst Sci 11:3151–3156. https://doi.org/10.5194/nhess-11-3151
Stanica D, Stanica DA (2012) Earthquakes precursors. In: D’Amico S (ed) Earthquake research and analysis, statistical studies, observations and planning. InTech Open Access Publisher. ISBN 978-953-51-0134-5, pp 79–100. https://doi.org/10.5772/2461
Stanica M, Stanica D, Marin-Furnica C (1999) The placement of the Trans-European Suture Zone on the Romanian Territory. Earth Planets Space 51:1073–1078
Stanica D, Stanica M, Piccardi L, Tondi E, Cello G (2004) Evidence of geodynamic torsion in Vrancea zone (Eastern Carpathians). Rev Roum Gephys 48:15–19
Stanica DA, Stanica D, Vladimirescu N (2015) Long-range anomalous electromagnetic effect related to M9 Great Tohoku earthquake. Earth Sci 4(1):31–38. https://doi.org/10.11648/j.earth.20150401.13
Uyeda S (2013) On earthquake prediction in Japan. Proc Jpn Acad Ser B 89:391–400
Uyeda S (2015) Current affairs in earthquake prediction in Japan. J Asian Earth Sci 114:431–434. https://doi.org/10.1016/j.jseas.2015.07.006
Uyeda S, Nagao T, Kakogawa M (2011) Earthquake prediction and precursor. Encycl Solid Earth Geophys 5:168–178. http://dx.doi.org/10.107/978-90-481-8702-7_4
Varotsos P (2005) The physics of seismic electric signals. TERRAPUB, Tokyo
Word RD, Smith HW, Bostick FX Jr (1970) An investigation of the magnetotelluric tensor impedance method. Electronics Research Center, University of Texas, Austin, p 78712
Acknowledgements
This work has been supported by the Joint Research Project between the Romanian Academy and Polish Academy of Sciences. The authors thank to the Institute of Geodynamics of the Romanian Academy for making geomagnetic data available to the user community and ESA for access to data from Swarm satellites. Some results presented in this paper are based on data collected at Magnetic Observatories. We thank the national institutes that support them and the INTERMAGNET for promoting high standards of magnetic observatory practice. This work was partially supported within statutory activities No 3841/E-41/S/2017 and Grant NCN 2014/15/B/ST10/00789 of the Ministry of Science and Higher Education of Poland.
Author information
Authors and Affiliations
Corresponding author
Rights and permissions
Open Access This article is distributed under the terms of the Creative Commons Attribution 4.0 International License (http://creativecommons.org/licenses/by/4.0/), which permits unrestricted use, distribution, and reproduction in any medium, provided you give appropriate credit to the original author(s) and the source, provide a link to the Creative Commons license, and indicate if changes were made.
About this article

Cite this article
Stanica, D.A., Stanica, D., Błęcki, J. et al. Pre-seismic geomagnetic and ionosphere signatures related to the Mw5.7 earthquake occurred in Vrancea zone on September 24, 2016. Acta Geophys. 66, 167–177 (2018). https://doi.org/10.1007/s11600-018-0115-4
Received:
Accepted:
Published:
Issue Date:
DOI: https://doi.org/10.1007/s11600-018-0115-4