1. Introduction
Differential interferometric synthetic aperture radar (DInSAR) is a well-established technique used for measuring the Earth’s surface displacements, applicable in a variety of physical and anthropogenic and engineering processes, as well as for geologic and tectonic studies. Advances in SAR interferometry have enabled the monitoring of the temporal variations of deformation phenomena with the processing of multiple SAR acquisitions. Seismology [
1,
2,
3,
4], natural geohazard monitoring [
5,
6,
7], ground water hydrology [
8], and structural engineering [
9] are some of the fields for which DInSAR provides valuable insights. Many techniques have been developed for multitemporal interferometry [
10,
11,
12,
13,
14,
15,
16,
17,
18], with persistent scatterers interferometry (PSI) [
10] and small baseline subset (SBAS) [
11] being the most widely used methods for time-series analysis. PSI identifies persistent scatterers that are stable over the long time intervals of the SAR images [
10,
13], whereas SBAS focuses on the small baseline differential interferograms to minimize spatial decorrelation [
11,
15], which is an inherent noise source. A detailed and thorough review of PSI methods, including SBAS, can be found in Crosetto et al. [
19].
Since the late 20th century, the ESA’s ERS tandem pioneering mission, followed by the ENVISAT mission from 2002 to 2012, significantly contributed to Earth sciences and hugely impacted our understanding of the Earth’s geodynamic processes. Sentinel-1, the recent Copernicus mission, which succeeded the ENVISAT sensor in April 2014, consists of the Sentinel-1A and Sentinel-1B constellation of two satellites. Sentinel mission started a new era in Earth observation, with a short revisit frequency (six days) and wide spatial coverage—two key parameters that enable continuous monitoring of the Earth’s surface serving in a variety of long time-series applications. The processing of C-band data from the extremely dense archive of the Sentinel-1 sensor involves several challenging aspects. First, a large amount of storage space is required for the analysis of time-series of Sentinel-1 single look complex (SLC) data volumes. Second, computational efficiency is critical for the intensive PSI pipeline. To address the above limitations, several services have been developed to provide software tools for multitemporal interferometry processing, analyzed by El Kamali et al. [
20]. Parallel small baseline subset (P-SBAS) [
21,
22,
23] is an automated processing chain for time-series analysis with Sentinel-1 SLC images, which operates in the Geohazards Exploitation Platform (GEP). GEP, which is part of the Thematic Exploitation Platforms, is a cloud-based service, providing users a variety of processing services for mapping ground deformation. P-SBAS is a parallelized version of the SBAS algorithms, which enable the generation of Sentinel-1 interferometric wide-swath (IWS) time-series and mean velocity maps. LiCSBAS [
24] is another open-source SAR interferometry software package for time-series analysis of Sentinel-1 data. Multitemporal Interferometric SAR (InSAR) processing in the LiCSBAS processing chain is performed with interferograms generated with the LiCSAR [
25]-automated Sentinel-1 InSAR processor. Atmospheric corrections are implemented with the Generic Atmospheric Correction Online Service for InSAR (GACOS) [
26].
Several nationwide InSAR mapping services have been developed. Time-series data for Italy are available via the Italian Special Plan of Remote Sensing of the Environment. The SAR data of both ascending and descending imaging geometries from 1992 to 2016 were analyzed with the use of multitemporal SAR techniques. Displacement information is available to the users upon request [
27]. The InSAR Norway project provides national-scale deformation mapping using Sentinel-1 SAR data of both ascending and descending imaging geometries. Time-series data from 2015 to 2019 are freely available to the public through this platform [
28]. BodenBewegungsdienst Deutschland (BBD), the German mapping service, provides ground motion maps, validated with the GNSS time-series, which are available to the public [
29]. Sentinel-1 data of ascending and descending tracks from 2014 to 2019 were processed by the German Aerospace Center (DLR). TRE ALTAMIRA and Geomatic Ventures Limited (GVL) [
30] performed a ground deformation mapping over the United Kingdom, analyzing more than 7000 and 2000 Sentinel-1 images, respectively. Finally, nationwide InSAR projects, not yet available online, is the Danish mapping service. The Danish nationwide deformation monitoring [
31] provides time-series of Sentinel-1 data starting from 2014 and will be free and fully available to the users. In this context, the present study offers a totally new nationwide ground displacement calculation over Greece. It enriches the existing observatories of related geohazardous phenomena at the global level, and paves the way for conducting new research and deriving new knowledge on well-known or unknown geophysical activities.
The main objective of this study was to construct an automated parallelized processing chain that is dedicated to multisensor time-series InSAR analysis of Sentinel-1, ERS, ENVISAT, TerraSAR-X, COSMO-SkyMed, and ALOS data. The processing chain known as parallel-PSI (P-PSI) was developed by the Center of Earth Observation Sciences and Remote Sensing BEYOND of the National Observatory of Athens and valuably enriches the existing GeObservatory portal of BEYOND. P-PSI is the main engine for InSAR processing of GeObservatory and is triggered on-demand by users to execute an efficiently distributed PSI chain for any area of interest globally, thus creating historical databases, which in turn enrich our understanding of the impact of geophysical and anthropogenic activities. The uniqueness of P-PSI is its parallelization of time-consuming processing steps for time-series SAR data analysis, providing algorithmic interventions to existing PSI software packages and creating a single, fully automated end-to-end processing pipeline.
This approach allowed us to apply P-PSI with Sentinel-1 in a national-scale project to cover the entire mainland of Greece, mapping displacements relative to various tectonic and anthropogenic activities over an area of 110,496 km2, with the prospect of extending to the Greek islands to all of Greece. Hereinafter, we refer to this as the InSAR Greece ground motion monitoring project. This unprecedented mapping of ground deformation rates for the entire country is revealing new knowledge on different spatial and temporal scales and for different types of processes.
InSAR Greece product provides information on numerous sites’ deformation due to natural and anthropogenic activities. In a preliminary and by no means an exhaustive analysis, both large-scale events and small-scale sites were identified that reflect the added value of the results of the study of all possible deformation events. For instance, besides the identification of large-scale land subsidence events affecting entire plains areas, several isolated ground water depression cones, extending only for some hundreds of meters, on industrial or agricultural sites were also verified. Thus, this work has a considerable scientific impact, spurring new studies motivated by previously unknown deformation signals that were detected via InSAR Greece.
This paper is organized as follows:
Section 2 provides an overview of the P-PSI processing system, including data access and a description of the individual parallelized processing steps.
Section 3 focuses on performance benchmarking of P-PSI to understand the level of improvement achieved in terms of processing time. In
Section 4, we implement P-PSI for InSAR Greece and report the results obtained.
Section 5 discusses specifically selected and indicative, among thousands, interesting observations that were returned by InSAR Greece in more detail. This highlights the value of InSAR Greece for developing new research referring to many different case studies depicted by the returned ground displacement observations. The section also underlines the efficiency of the P-PSI technique in detecting different ground deformation mechanisms, such as landslides, subsidence due to aquifer exploitation, or mining activities, structural failures, etc.
Section 6 provides our concluding remarks.
2. P-PSI and InSAR Greece Processing Pipeline
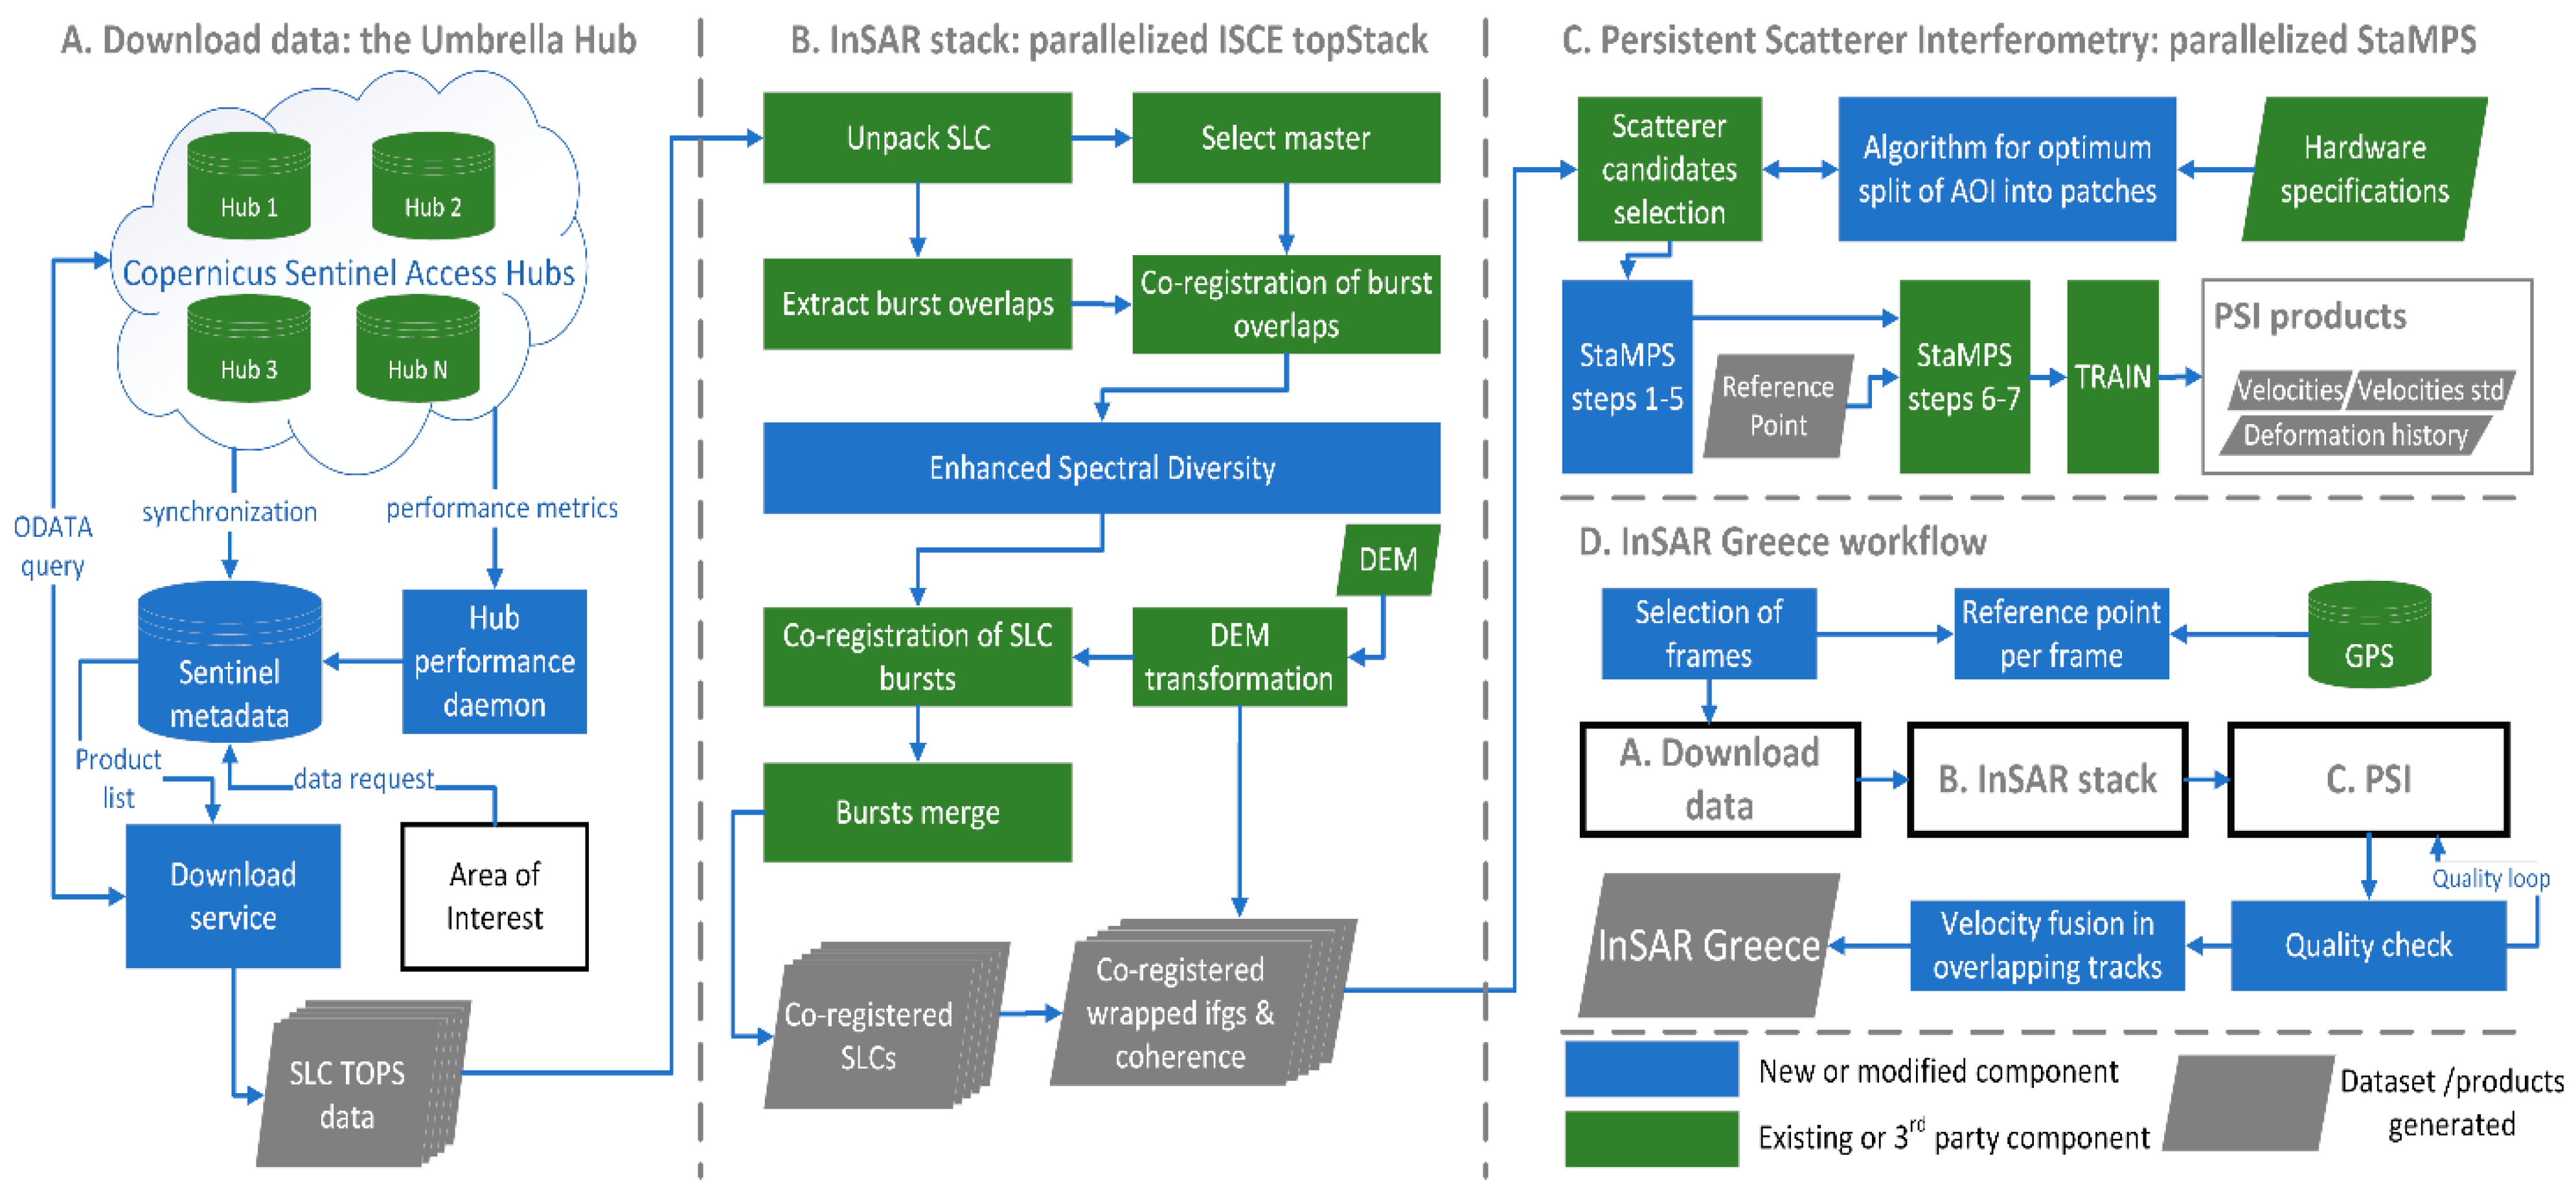
In
Figure 1, we present a high-level workflow of the end-to-end P-PSI processing chain. There are four main building blocks for creating InSAR Greece final product: The first block is the Umbrella Hub (
Figure 1A), an inhouse API that was developed and made open and freely available through the Hellenic Mirror Site. The interface connects to different Copernicus Sentinel access hubs and mirror sites and automatically retrieves the PSI-appropriate Sentinel-1 data for a user-defined area of interest. The data are then fed to the parallelized InSAR Scientific Computing Environment (ISCE2,
Figure 1B) with its topsStack processor [
32,
33] for creating a stack of coregistered single look complex (SLC) datasets. The SLC stack is then used for PSI analysis (
Figure 1C) with a parallelized implementation of the stanford method for persistent scatterers (StaMPS) [
13], a process that produces ground velocities and deformation histories for the persistent scatterers (PSs) that have been detected. StaMPS Steps 6 and 7 were performed manually and iteratively to compensate for unwrapping errors by removing interferograms where phase jumps were visually identified. The open-source Toolbox for Reducing Atmospheric InSAR Noise (TRAIN) [
34] was employed instead of atmospheric filtering in Step 8 of StaMPS software. The tropospheric phase delay correction was performed by implementing a phase-based linear correction on interferograms produced for PS processing. Finally, Blocks A to C are repeated for different, adjacent Sentinel-1 orbits to map the entire country and deliver InSAR Greece (
Figure 1D).
Simply installing software on a system that supports parallelization, like multicore systems, server clusters, high-performance computers, or cloud infrastructure, does not automatically improve the performance through the exploitation of the parallelization [
35], unless the software was natively designed to use multiple resources. We often need to rewrite all or part of the programs, which were written for sequential processing with different methods and algorithms that are compatible with the different architectures for parallelized or distributed processing.
In developing P-PSI, we considered several factors for efficiently adapting the software for parallelization. Firstly, we considered parallelization interventions that can be implemented not only on multicore systems but also on multiserver clusters and cloud platforms using distributed computing techniques, as proposed in Lee et al. [
36]. Secondly, we focused on implementing parallelization with prioritizing the time-bottleneck and the most demanding processing tasks that do not exploit parallel resources in the original version of the software. Finally, we avoided large-scale fundamental changes within the original open-source code that would complicate readaption and the use of future improved versions of ISCE2 and StaMPS.
Thus, we focused on data-parallel problems where the key is the balanced split of the data into smaller chunks that are processed by the same program in multiple parallel instances [
37], and on task-level parallelism, where it was possible to run processes concurrently. A fundamental task to be solved is the problem decomposition [
38], to split the computations to be performed into a set of tasks for concurrent execution defined by the task-dependency graph. We identified which parts of the processing could be invoked in parallel, which parts needed to remain sequential, and the prerequisites of each task to redesign the workflow and apply parallelization where possible, maintaining the correct order of the execution of tasks [
39].
The result was P-PSI, a light and reusable software that is available to the user community. As a benchmark, before applying the P-PSI parallelization, the processing with nonoptimized software for large areas (e.g., for an entire Sentinel-1 frame) and for a long temporal period (>100 stacked images) would need more than two weeks running on the installation on our local multicore server. The P-PSI system, which optimizes the workflow of steps exploiting the multicore architecture, provides improved performance, returning its products with an estimated overall speed-up of five times faster processing for the same input data. In a twin experiment, we also deployed part of the P-PSI workflow on the Ellip cloud platform with a multinode Hadoop environment. The processing times showed similar gains as our local server implementation.
2.1. Umbrella Hub for Sentinel Data Access
The Umbrella Hub is an innovative prototype application programming interface (API) solution that was developed by the BEYOND Center to allow quick, federated access to Sentinel-1A and 1B SLC data that feed the interferometric processing chain. It resolves the issue for obtaining proper and timely access to the data and avoids multiple data searches due to the fragmentation characterizing the Copernicus ground segment. The Umbrella Hub is also accessible as a standalone API through the Hellenic Mirror Site. Currently, there are several Copernicus hubs that provide access to Sentinel data. These include the core Copernicus hubs, such as Open Access Hub (formerly SciHub), the four data and information access services (DIAS) hubs, ApiHub, and the Cop Hub. The European Space Agency (ESA), to allow complimentary access to Sentinel data and/or to specific data products or distribution channels, has established the National Collaborative Ground Segments initiative. There are 23 National collaborative ground segments, indicatively the HNSDMS (Greece), the CODE-DE (Germany), the FinHub (Finland), and PEPS (France).
The main issue with this fragmented data access is that the available hubs have different data offers. This affects parameters, such as the availability of different missions and different products per sensor, the geographic coverage, the maximum concurrent downloads allowed, the data rolling policy, i.e., the time span of the data archive, etc. In addition to the data offer variability, the hubs perform differently in terms of several key performance indicators (KPIs), including download speed, query response times, operational availability, and product latency (i.e., the difference between sensing time and the time it becomes available to download in a specific hub). In practice, even for the same hub, there is intraday and intraproduct variability in terms of KPIs.
To evaluate the performance of the different Copernicus hubs, we conducted a benchmarking exercise. The KPI measurements were extracted with scripts written in Python that represent a user in the cloud using the pan-European data network for research and education (GÉANT) backbone network. The user polled the hubs for a three-month duration, in a continuous fashion, on a daily basis, and on specific schedules for each type of measurement. The measurements were collected using an InfluxDB database. Alongside InfluxDB, we used a Grafana instance to dynamically visualize the measured data.
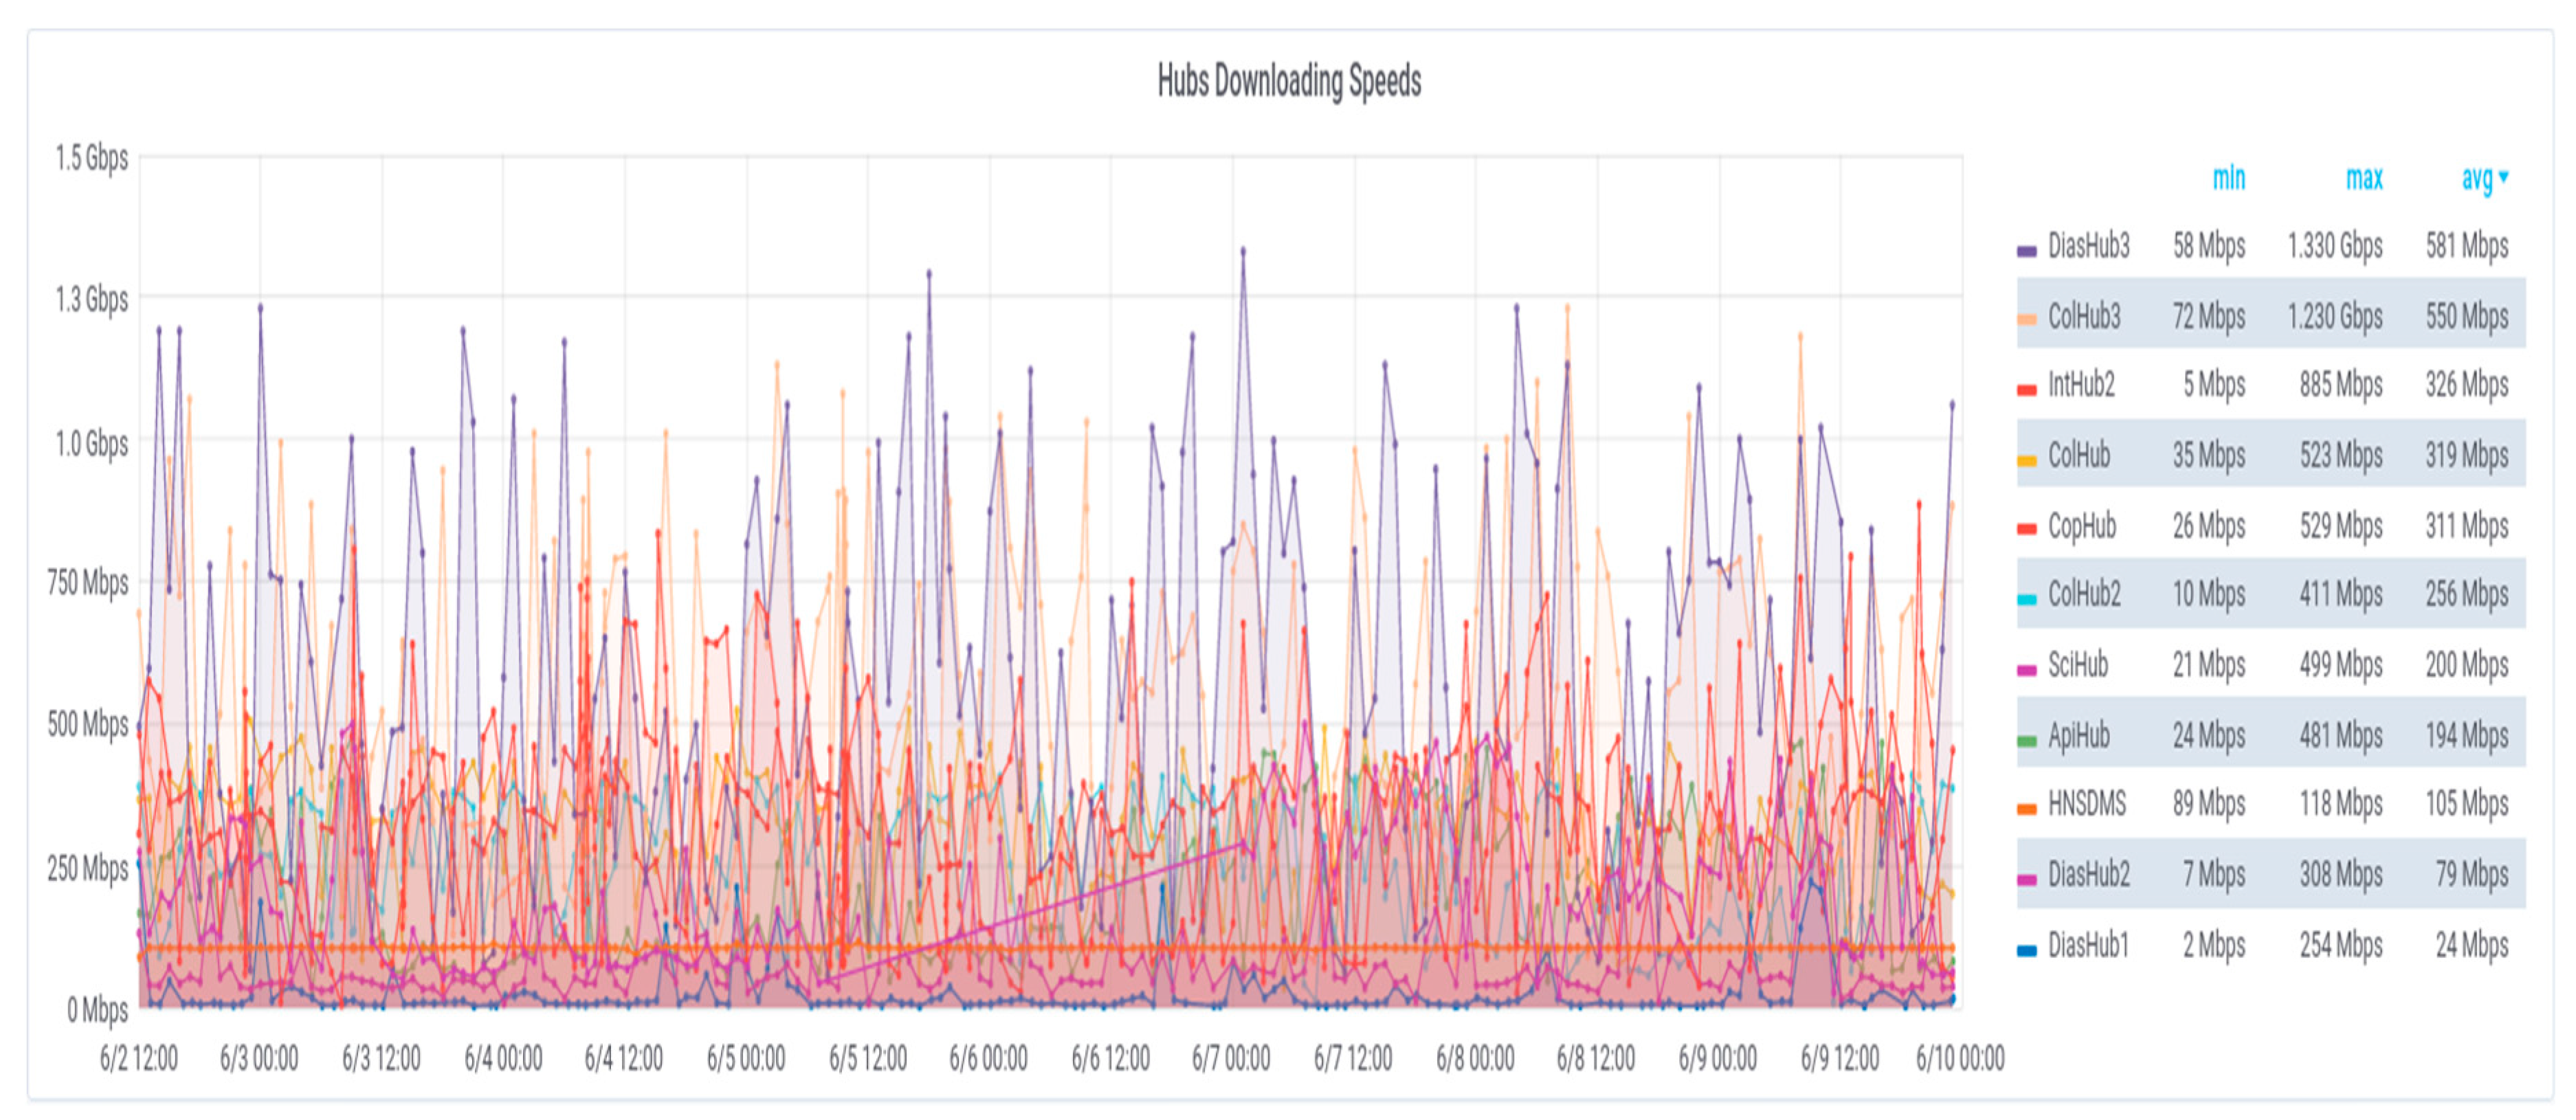
Figure 2 shows the variability encountered when measuring the download speed from the different hubs that participated in the benchmark. The experiment was run by submitting an OpenSearch request to each hub to fetch a list of the most recent 100 products based on their ingestion date. From those 100 products, each time, one product was selected randomly and downloaded. During the product download, another request was performed to retrieve the checksum of the downloaded product. Without any loss of generalization and for visualization purposes, we only show one week of data for this experiment. The average download speed ranged from 24 to 581 Mbps. Similar variations on different scales were observed for the other KPIs that were monitored. Notably, these measurements were raw, and no attempt was made to consider the location of the user, the network route followed, etc.
To cope with this HUB performance variability and to ensure the robust operations of P-PSI, we developed an umbrella application to manage access to Sentinel data (
Figure 1A). First, we synchronized metadata from all connected hubs and keep this metadata database constantly updated. In this way, we register the access source for each available Sentinel-1 product. In parallel, we monitor the performance of the hubs at regular, customizable, intervals, including availability, response time, and download speed. When P-PSI is triggered for a specific area of interest then an initializer process creates a product download list, considering the Sentinel-1 data availability from the metadata database and interferometry feasibility criteria, such as orbit number, descending or ascending track, footprint overlap, etc. The data in the list of Sentinel-1 products are then transparently downloaded by several hubs, depending on product availability. If the same product exists in more than one hub, then the hub performance criteria that are locally stored (e.g., response time and real-time bandwidth of the link) are used to select the best-performing hub. The front-end of the Umbrella Hub application is based on the Data Hub Software of the European Space Agency and incorporates OpenData and OpenSearch APIs.
The main advantage of linking federated Copernicus Sentinel hubs is the enhanced timeliness and reduced lead times for accessing Sentinel products. This solution provides access to a single hub instead of looking across several Sentinel hubs to find all the available and appropriate products, while providing access to all Sentinel mission data with no geographic restrictions. Finally, by exploiting hub diversity, there is less performance variability, creating a more robust fully automatic processing chain that relies on the availability of its inputs.
2.2. Distributed Processing
2.2.1. Parallelization of ISCE2 Components
Creating the coregistered stack of the SLCs using the ISCE2 topsStack processor (
Figure 1B) requires 10 steps, which are organized in respective sets of commands. ISCE2 topStack creates a set of commands for each step that is easy to execute as a batch job. As any potential dependencies are well understood and considered, parallelizing the run of those commands in a multicore or multinode cluster environment is straightforward. Thus, we implemented a coarse-grained easy task-level parallelization [
37,
40] for concurrently running the processes that do not have any workflow dependencies between them.
We first parallelized the most time-consuming processes that did not exploit parallel resources. The enhanced spectral diversity (ESD) step (
Figure 1B) uses the coregistered stack burst overlaps generated from the previous step to generate the differential overlap interferograms and uses them for estimating azimuth misregistration [
33]. The commands engaged in this set do not exploit parallel resources and they depend only on the completion of the previous step. Thus, we implemented parallelization engaging all commands in parallel up to the number of available CPUs in this case.
The azimuth misregistration for national-scale ground coverage tends to be a linear ramp because it directly corresponds to the orbit state. The estimation of the orbital error and the removal of phase ramps was performed using StaMPS by estimating and directly subtracting the linear ramp in the final velocity map product. However, the literature review showed that an approach for orbital error correction over fast decorrelating areas, which is worth considering in further future developments of the processing chain, was proposed by Tian et al. [
41]. According to this approach, orbital error correction is performed using frequency (DFT)- and spatial domain (ADP-Poly)-based methods on each interferogram separately before feeding the time-series pipeline.
Next, the coregistration of SLC bursts step (
Figure 1B) takes the geometrical offsets as the input together with the misregistration time-series for precise coregistration of each burst SLC calculated in previous steps. The processing commands of this step call a subprocess that invokes all the available cores of a multicore system by design. However, this step consumes a significant amount of processing time; therefore, it was prioritized for optimization. We used a similar approach as for ESD step parallelization, and measured a significant gain (a doubled processing speed) from the nested parallelism, which meant that a non-negligible part of the code was still running sequentially.
2.2.2. Parallelization of StaMPS Components: Patch Split Algorithm
The option to split the input data (coregistered SLC stack) into data chunks called patches was embedded in StaMPS (
Figure 1C); it was originally developed by the StaMPS team to prevent memory overflows [
42]. Even though the patches are produced by cutting the initial interferogram area into equal pieces of mapped areas creating a sort of a uniform grid, the sizes of the respective chunks of data are significantly unequal because of the variable number of PSs included in each patch. The latter is a function of land use/land cover. Patches containing urban areas include many more PSs compared to patches dominated by forested or agricultural areas.
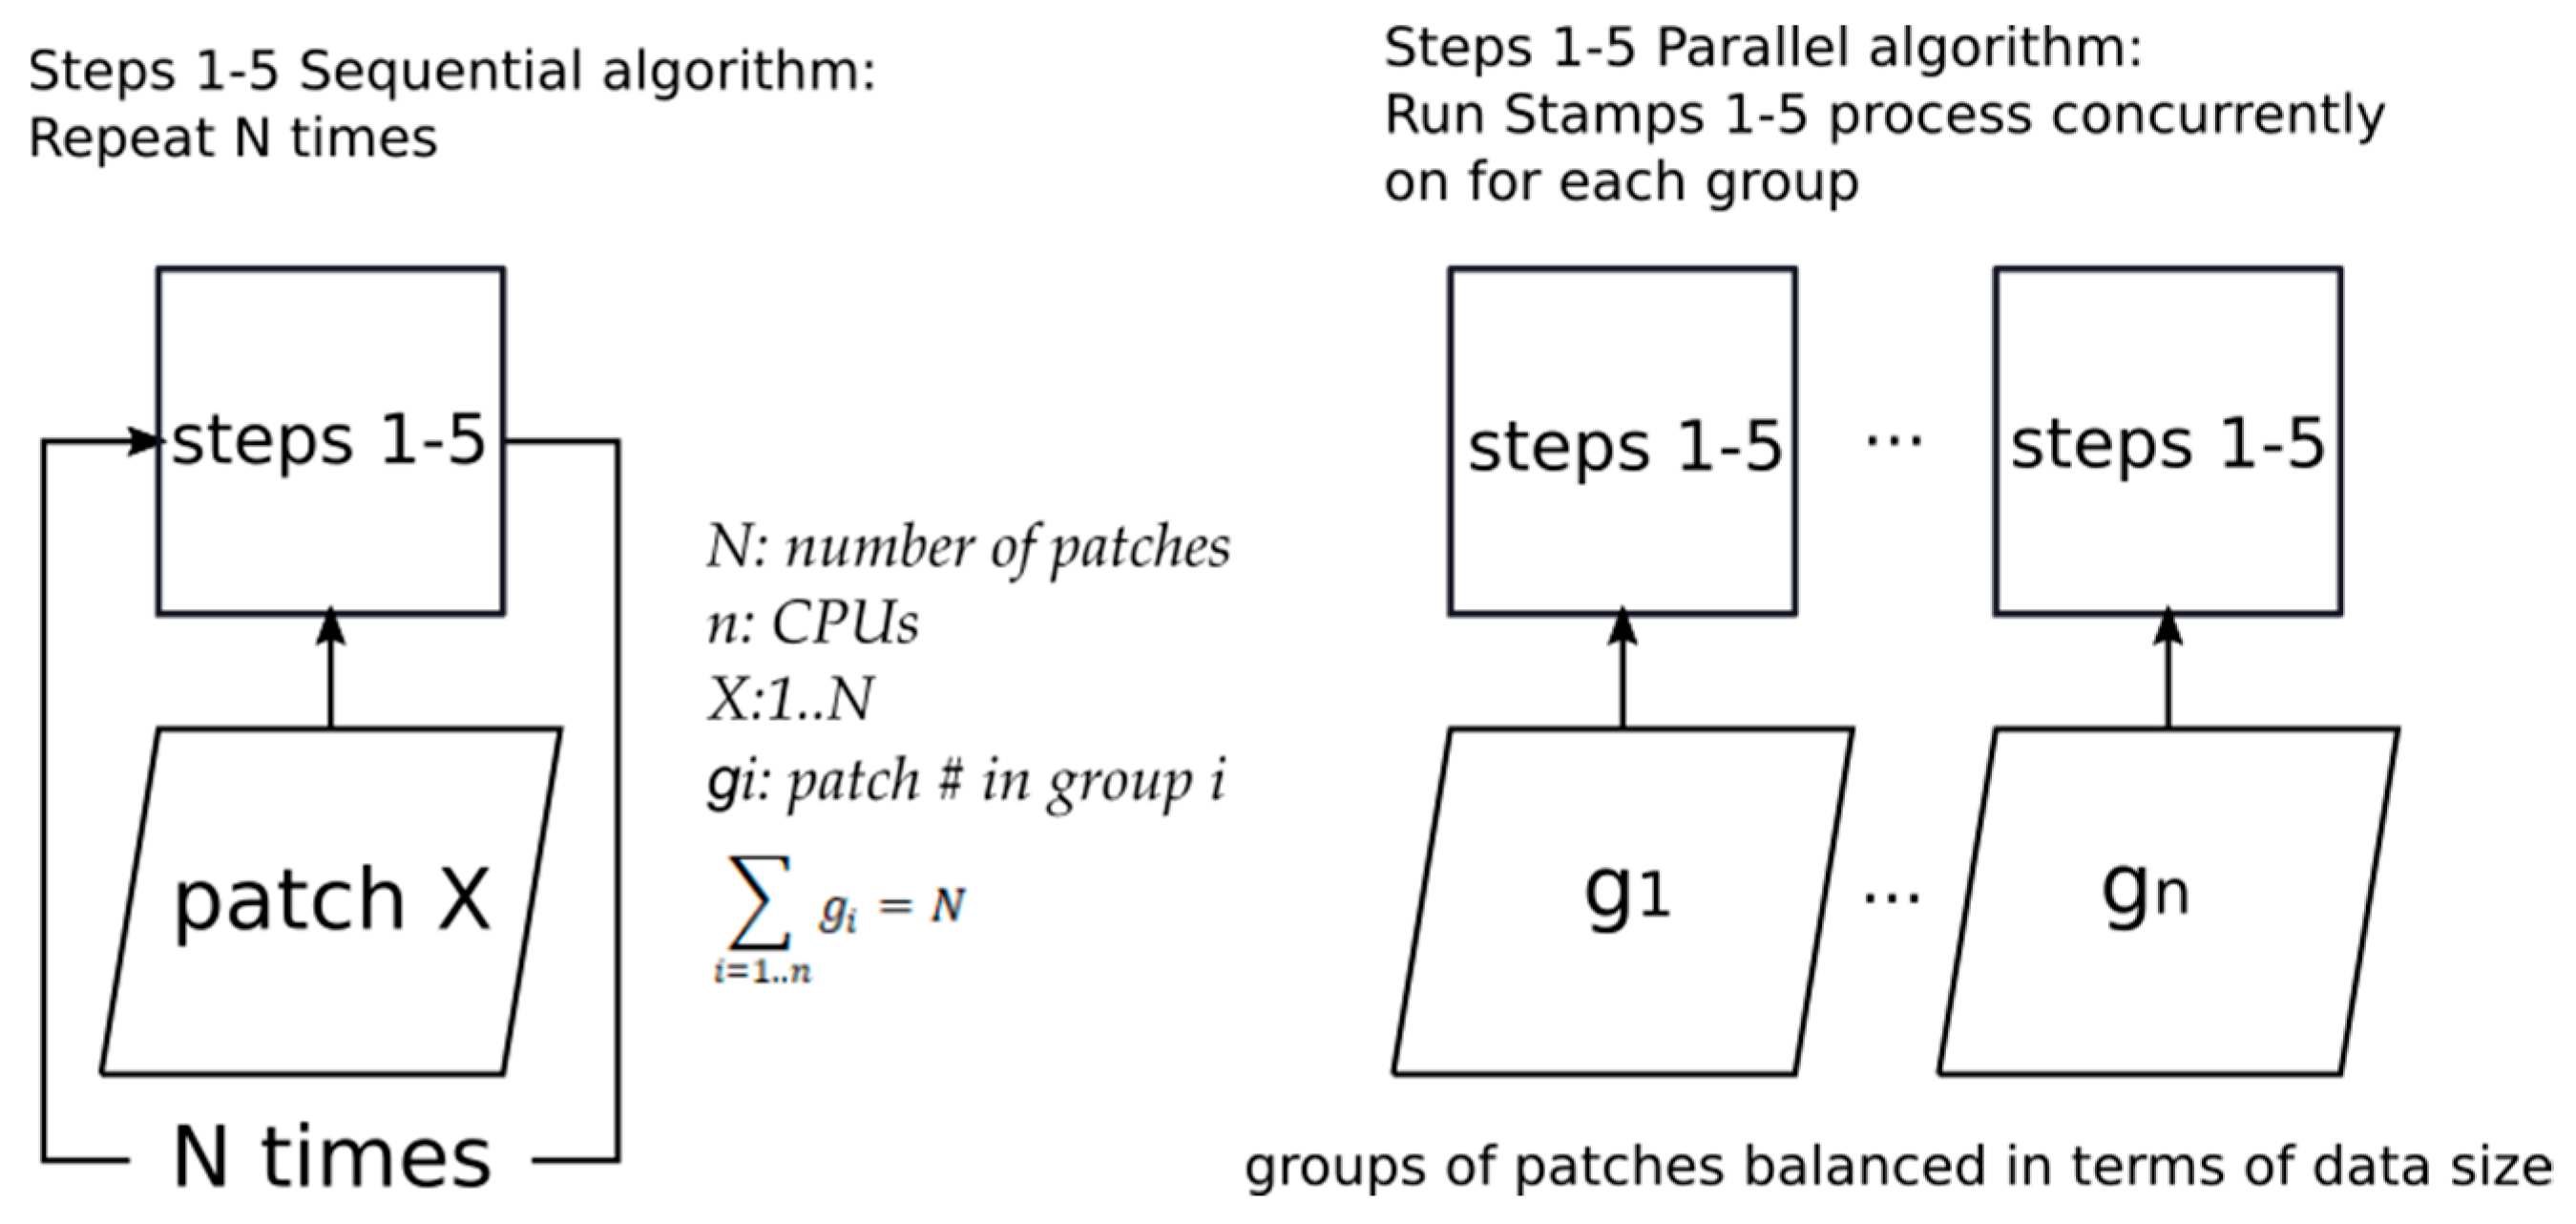
To optimize the parallelization, we had to counteract these inequalities. To do so, we developed a new algorithm that forms n groups of chunks (for n CPUs) having as balanced sums of PS points as possible (
Figure 3). This is a new method for creating the patches, moving from the current StaMPS implementation that uses a uniform grid to a non-uniform grid implementation targeting an optimized balance of data chunk (patch) sizes. Our algorithm starts from an initial patch split as in the standard StaMPS implementation, and then proceeds to consider the number of available CPUs, the user-defined number of output patches, and the CORINE [
43] -based land use/land cover of the processed area to create a new patch distribution.
We also implemented a more simplified algorithm that forms n groups of chunks with a balanced number of chunks, ignoring the expected number PS points of each chunk. However, even the first optimum algorithm that balances the number of PSs in each group that will be processed with StaMPS 1–5 cannot form equally balanced groups in terms of data size for each processing unit (PU) because of the initial split inequalities.
2.2.3. Parallelization of StaMPS Components: Preparation of Patches
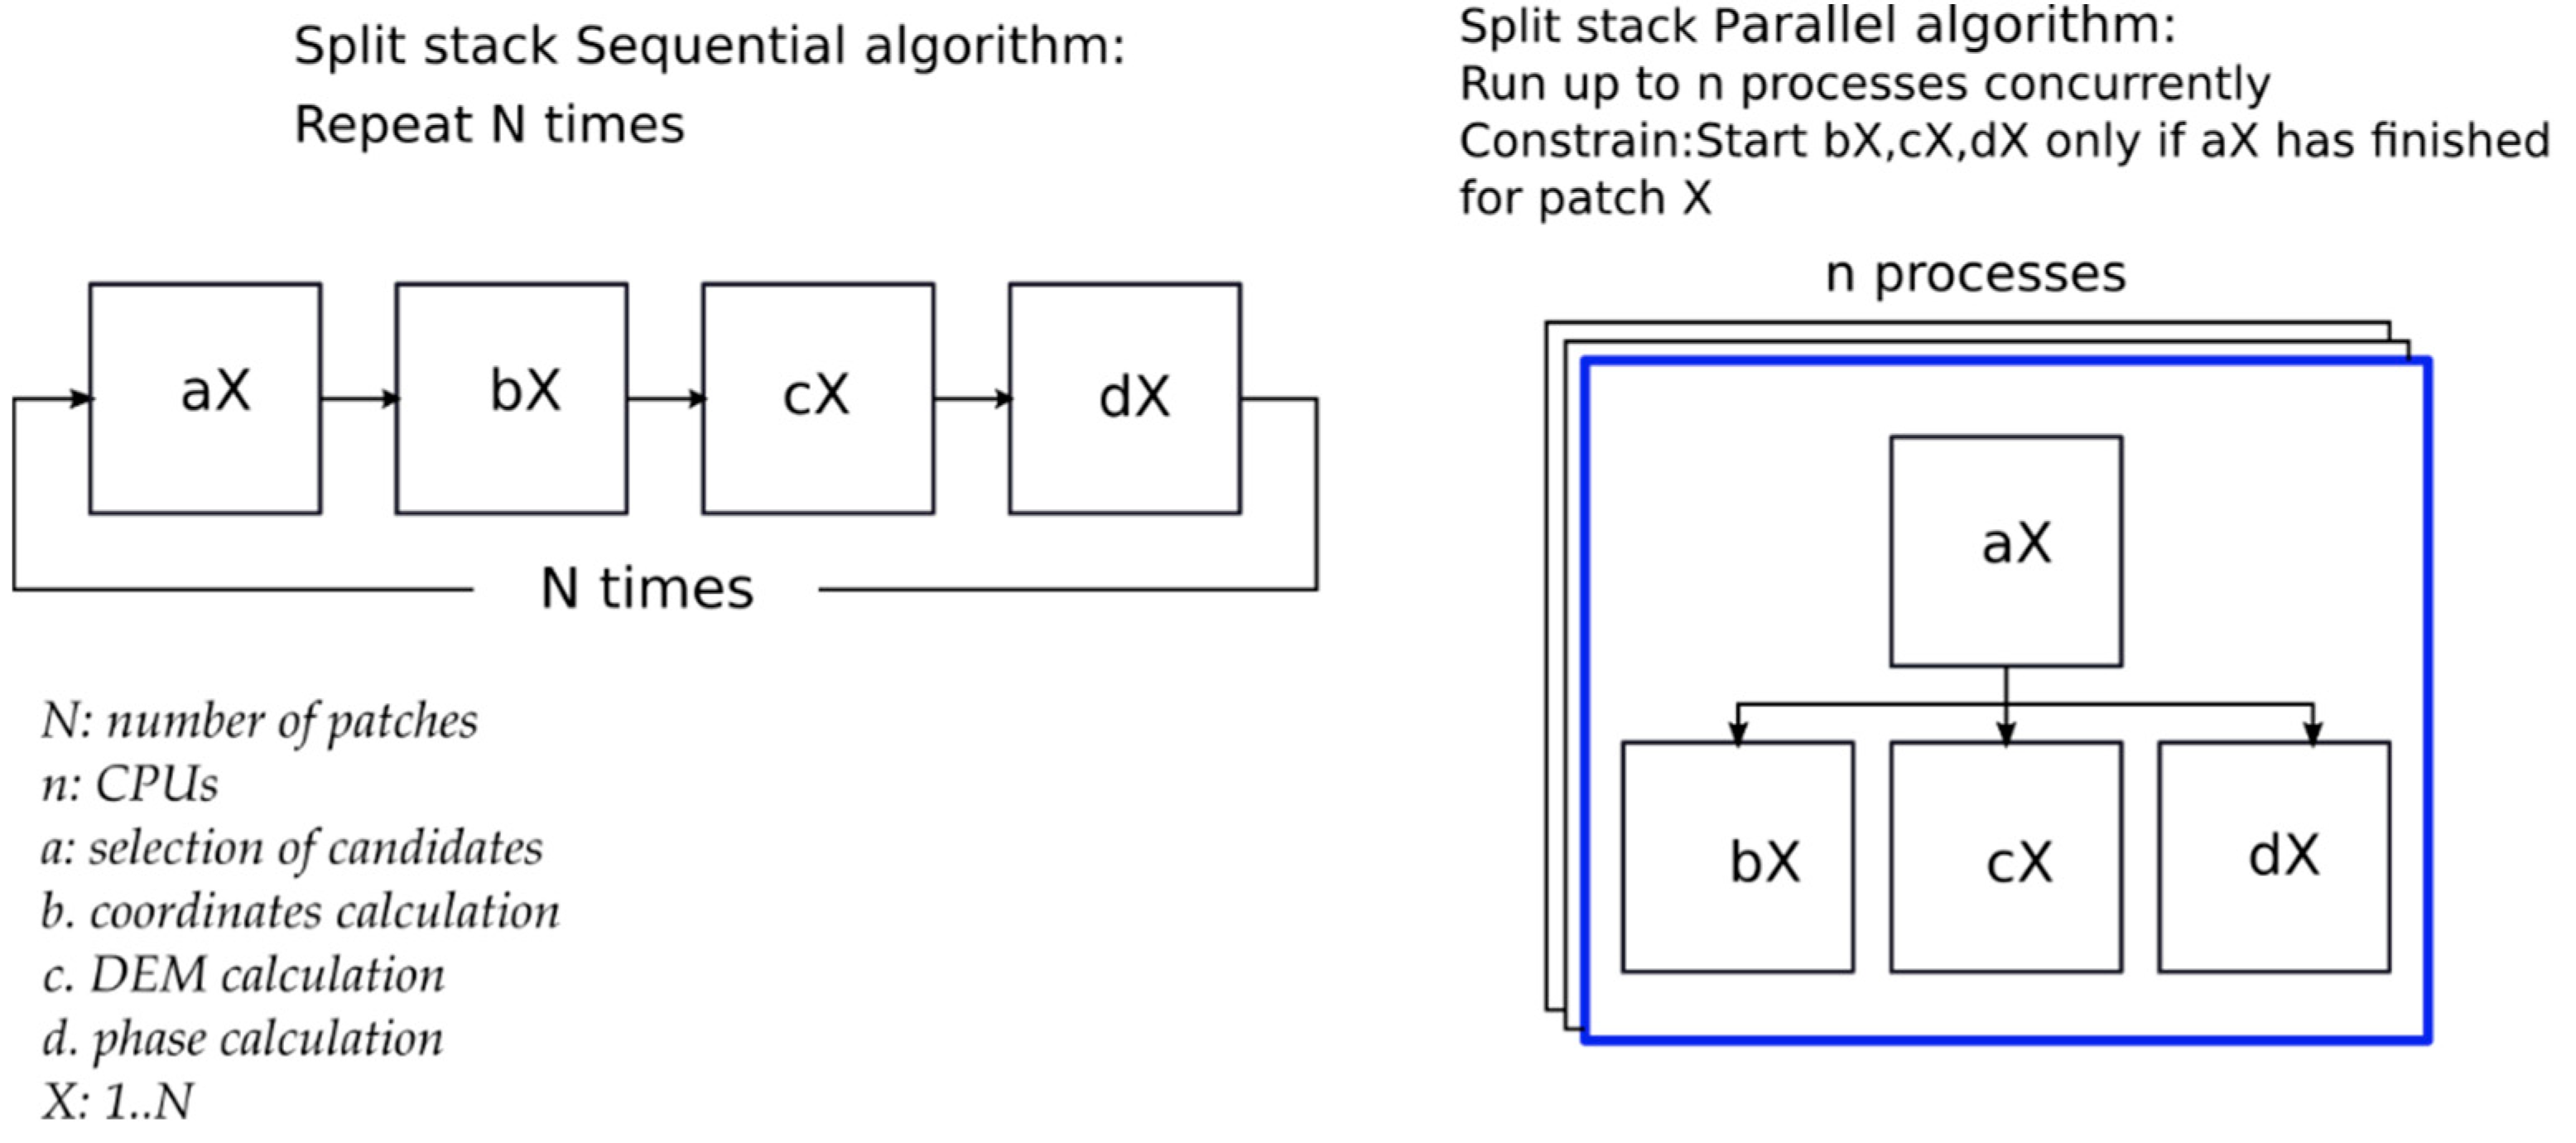
After the definition and calculation of the patches’ coordinates to create the chunks (patches) of data files that will input to the StaMPS 1–5 process steps, a process named mt_extract_cands was executed sequentially for each patch (
Figure 1C and
Figure 4). This process consists of four subprocesses (
a. selection of candidates,
b. coordinate calculation,
c. Digital Elevation Model (DEM) calculation,
d. phase calculation) that are executed sequentially. From our analysis we found that the successful execution of subprocess
a for a chunk is a prerequisite for running
b, c, and
d, on the same chunk. However,
b,
c, and
d subprocesses for each chunk can run concurrently. Additionally, the processing chain of the four subprocesses for each patch can run independently for each chunk. Based on the previous analysis, we developed a task-level coarse-grained parallelization algorithm [
37,
40] that implements a parallel workflow of processing (
Figure 4).
2.2.4. Parallelization of StaMPS Components: StaMPS 1–5 Core Processing
In the parallelized StaMPS (
Figure 1C), the processing steps, Steps 1 to 5, can be managed as a data-parallel problem [
37]; thus, we applied a medium-grained parallelization in this case [
40] to run the same process concurrently on balanced partitions of data.
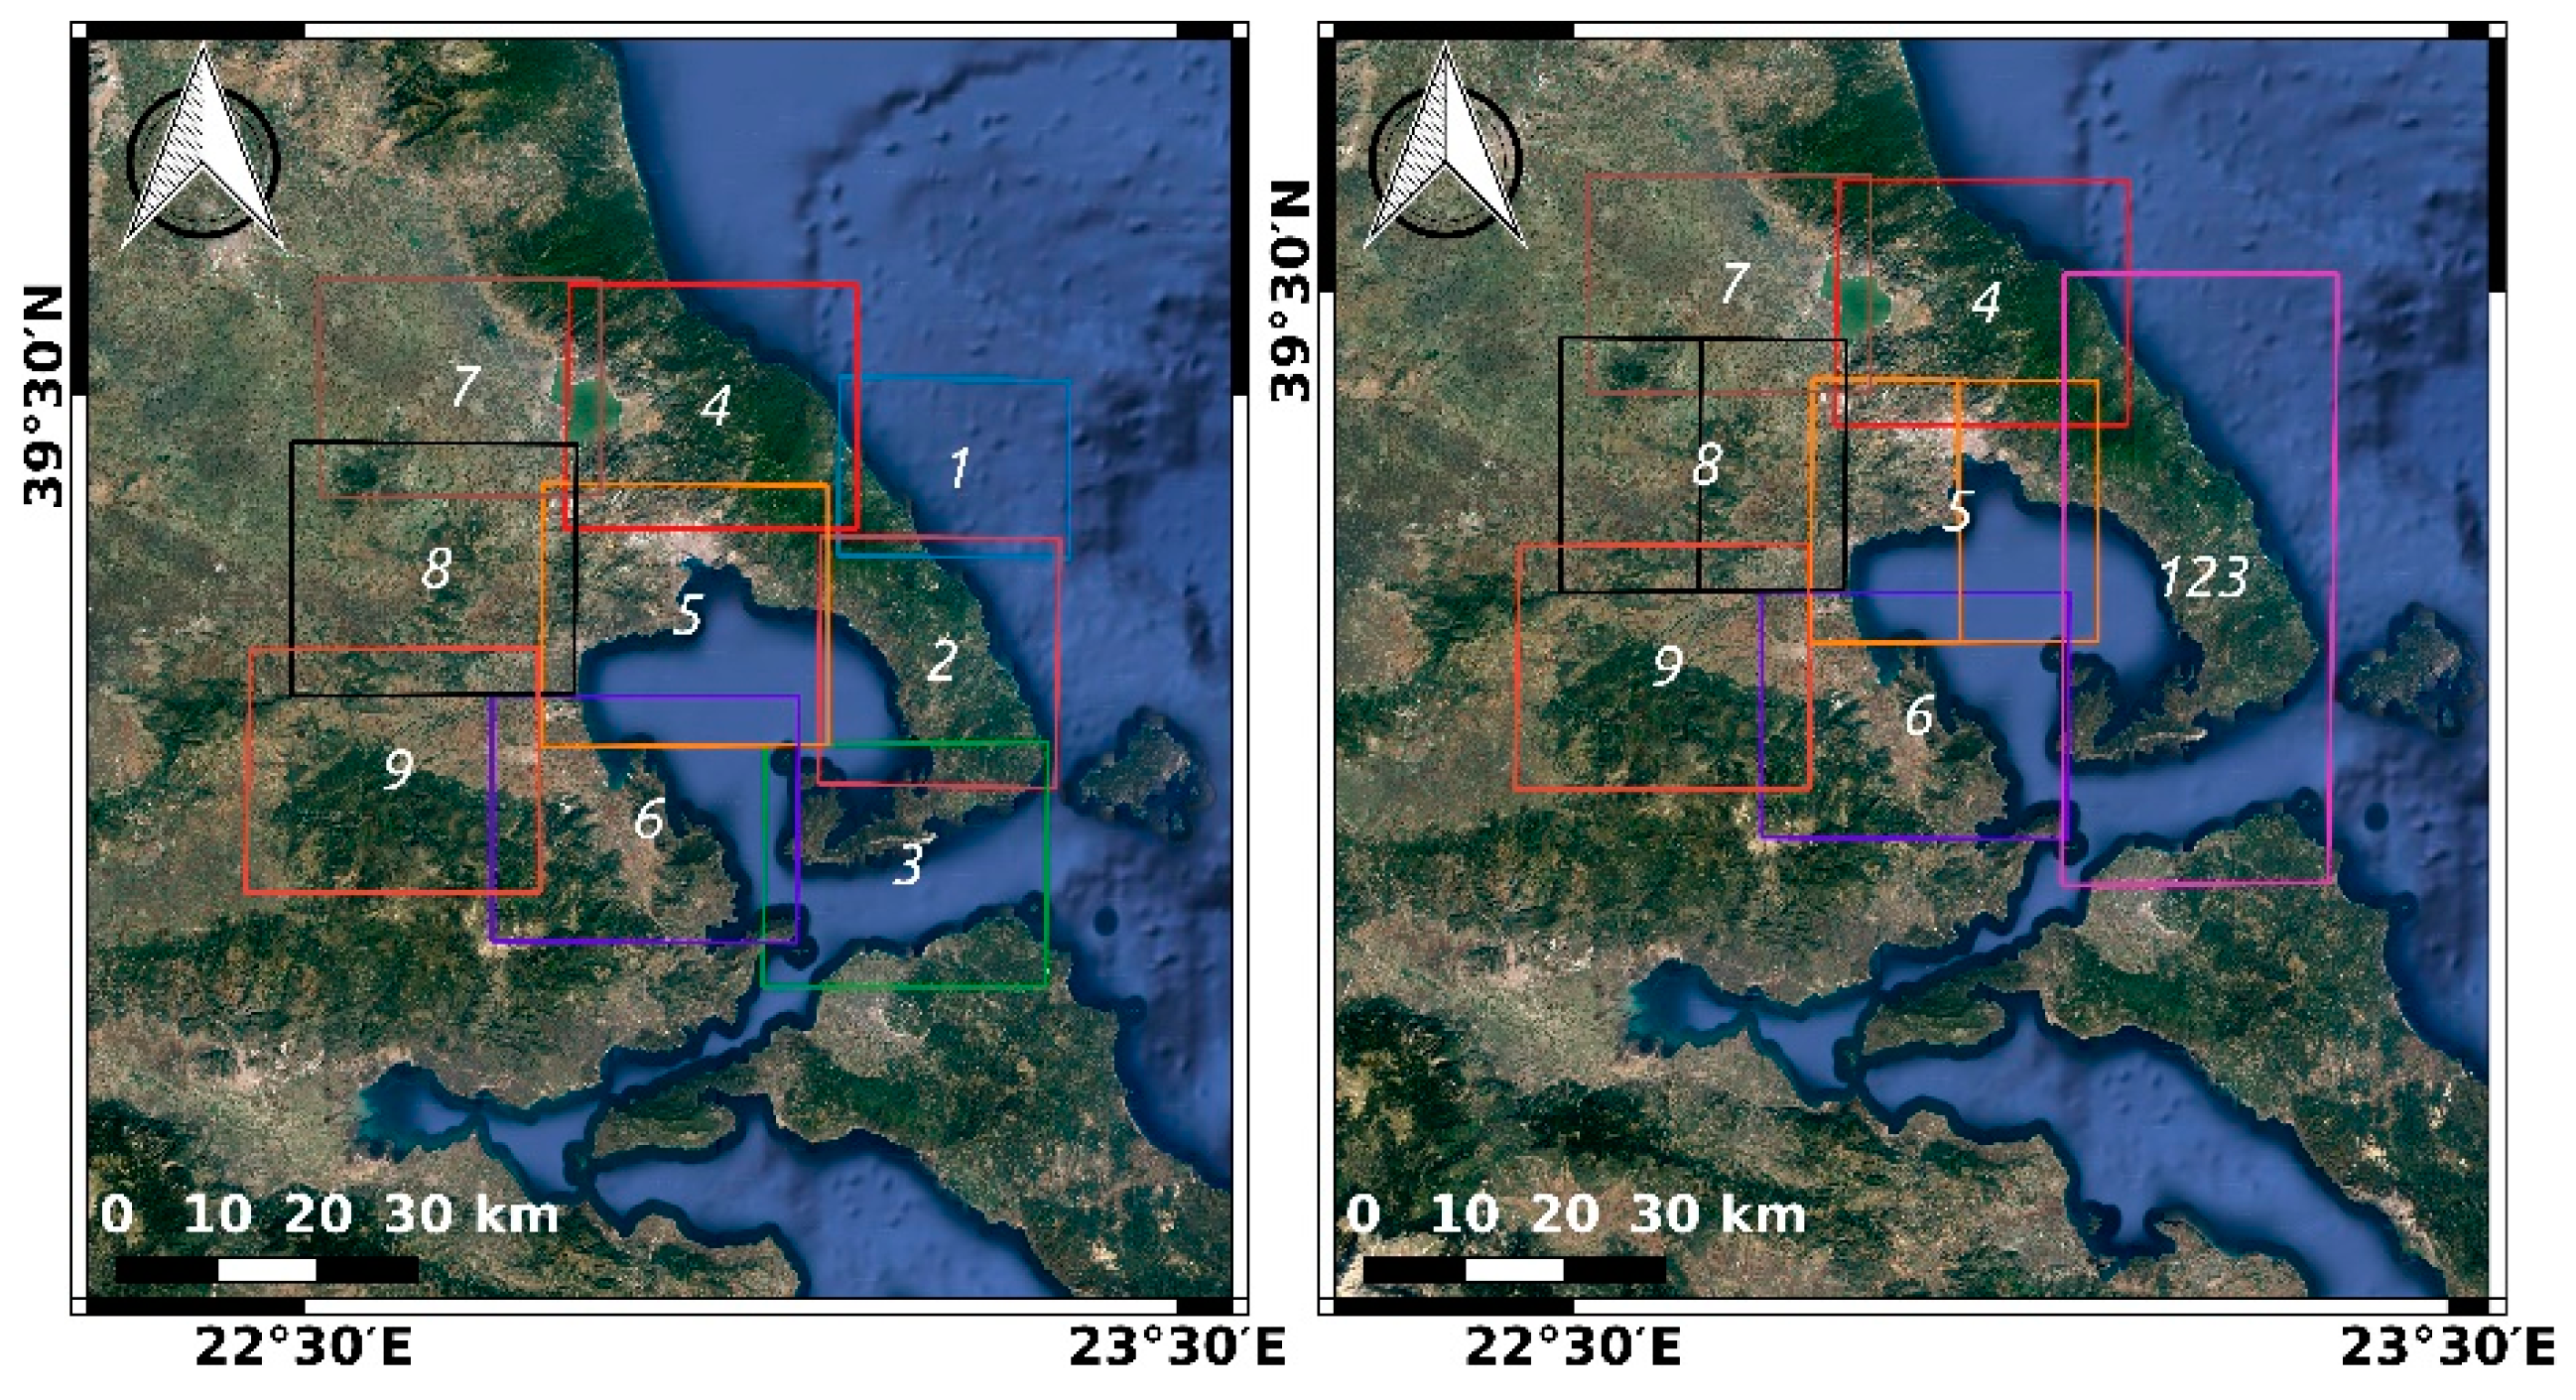
We tested our algorithms (non-uniform patches split fed to StaMPS 1–5 core processing) given a specific test case in Volos, Greece, to assess the performance improvement compared with the traditional uniform patch split. The non-uniform split of patches shown in
Figure 5 (right) forms nine chunks (patches) with more balanced data sizes (PS points) than the nine chunks formed by the uniform split on the left. We achieved that by doubling the split resolution above urban areas where the number of PS points is expected to be significantly higher than in the surrounding nonurban areas. We also discovered that it is possible to feed to the main process of StaMPS 1–5 with the coordinates of the non-uniform patches and be recognized and processed correctly by the program as in the case of uniform patches.
In this specific small-scale example, the processing time (
Figure 1C, pillar only) for the nine-patch with nine CPUs with the initial uniform split was 48 min, whereas for the more balanced nine-patch split, 40 min was required. The cause of the improved processing time was the difference between the maximum numbers of PS points in a patch in the two cases. The patch with the maximum number of PSs in the non-uniform approach contained 20% fewer points compared to that in the uniform grid approach.
2.3. Technical Implementation
For the parallelization of the processing tasks, we avoided changing the open-source code of ISCE2 and StaMPS pipelines or implementing algorithms that would change the main workflow of the original software to maintain compatibility with future editions of the software. We used Python for launching and controlling the parallel processes because it is supported by many libraries for parallel programming and provides all the necessary tools for the implementation of coarse- and medium-grained parallelization [
40] that we were targeting here.
We implemented and tested parallelized StaMPS on two different computing environments. For our first implementation on a local powerful server, we preferred to use the MATLAB (MathWorks
®, Natick, MA, USA) engine for Python [
44] as StaMPS is written, to a large extent, in MATLAB [
45] and because the MATLAB engine for Python has the option to start multiple instances asynchronously. With this approach, we gained direct access through the workspace (the memory space) of MATLAB for each process, exchanging data information and controlling the parallel execution without needing to change the MATLAB code. The drawback is the delay when invoking multiple MATLAB engines. This delay is, however, a very small percentage of the total processing time gained by parallelizing the StaMPS processes.
Our second implementation of parallelized StaMPS was on the Ellip platform used by NextGEOSS, Europe’s Earth Observation data hub and portal of services. There, we used the developer tools provided by the administrator of the platform: the ciop API interface dedicated to Hadoop workflows. This implementation distributed the processing of each group of patches to individual nodes of the Hadoop platform as opposed to the individual CPUs used in the local server implementation.
Comparing the performance of the two implementations, we observed that for both environments, the processing time gains from the parallelization using the same processing units were similar (CPUs = Hadoop nodes). The implementation on the Ellip platform, however, required more time because of the constrained development environment and the frequent need for support from the platform’s service desk. In addition, since an application is adapted to the system’s framework for parallelization, the scalability is easy on Ellip, like on any similar high-performance computing system, but it is limited and controlled by the platform owners. Finally, an important advantage, in some cases for Ellip and similar systems’ architecture, is the potential of having distributed processing with independent storage and memory resources apart from CPUs on the system’s nodes [
36].
For the implementation of the rest of the processes on the multicore environment, we used the Python subprocess library. This library provides the necessary functions to initiate instances of Operating System-executable programs, and it is ideal for cases for which we do not need to exchange messages between the processes. Each process launched with this approach directly acquires system resources according to its programming from the OS and is not bound by the constraints of Python Global Interpreter Lock (GIL) for multithreading [
46,
47,
48].
Finally, the entire P-PSI pipeline, since it is based on existing open-source projects ISCE2 and StaMPS, is also open-source. We have made the P-PSI code available in GitHub (
https://github.com/AlexApostolakis/P-PSI) for reuse by other scientists in the field, with the sole obligation to cite this manuscript. We will keep this repository updated with new material, training manuals, and algorithmic adaptations.
3. P-PSI Performance Assessment
For assessing the performance of our P-PSI algorithms, we used two metrics: speed-up and efficiency. We estimated both by running several experiments using a common dataset and a varying number of PUs to assess the improvement as a function of the available computing resources. Speed-up
and efficiency
are defined respectively as
where
is the execution time of the (best) original sequential, algorithm,
is the execution time of our parallel algorithm, and
p is the number of PUs exploited. The closer
is to
p and
is to one, the better the performance of the parallel processing implementation [
37,
39]. For a perfect parallelization efficiency, the processing time is improved by a factor equal to the PUs used.
The server on which we ran the experiments with our software pipeline was a multicore system equipped with two Intel Xeon E5-2630 (Intel, Santa Clara, CA, USA) with 10 cores, each double-threaded, and 128 GB of RAM. The OS installed was Linux OpenSUSE 42.3. Thus, the system had 20 hyperthreaded physical cores available, corresponding to 40 virtual cores. We avoided pushing the benchmarks using more than 20 CPUs because of the parallelization uncertainty of the hyperthreaded cores [
40].
For the benchmark dataset, we selected an area of interest of about 2500 km
2 in central Greece (
Figure 5) and a stack of 30 Sentinel-1 images. This area is about 1/20 of an entire Sentinel-1 tile and we processed the 10 of the 27 Sentinel-1 image bursts, which included those intersecting the cropped area. The area includes diverse land cover types: small cities, rural areas, and dense forests; hence, the density of the PS points was medium to low.
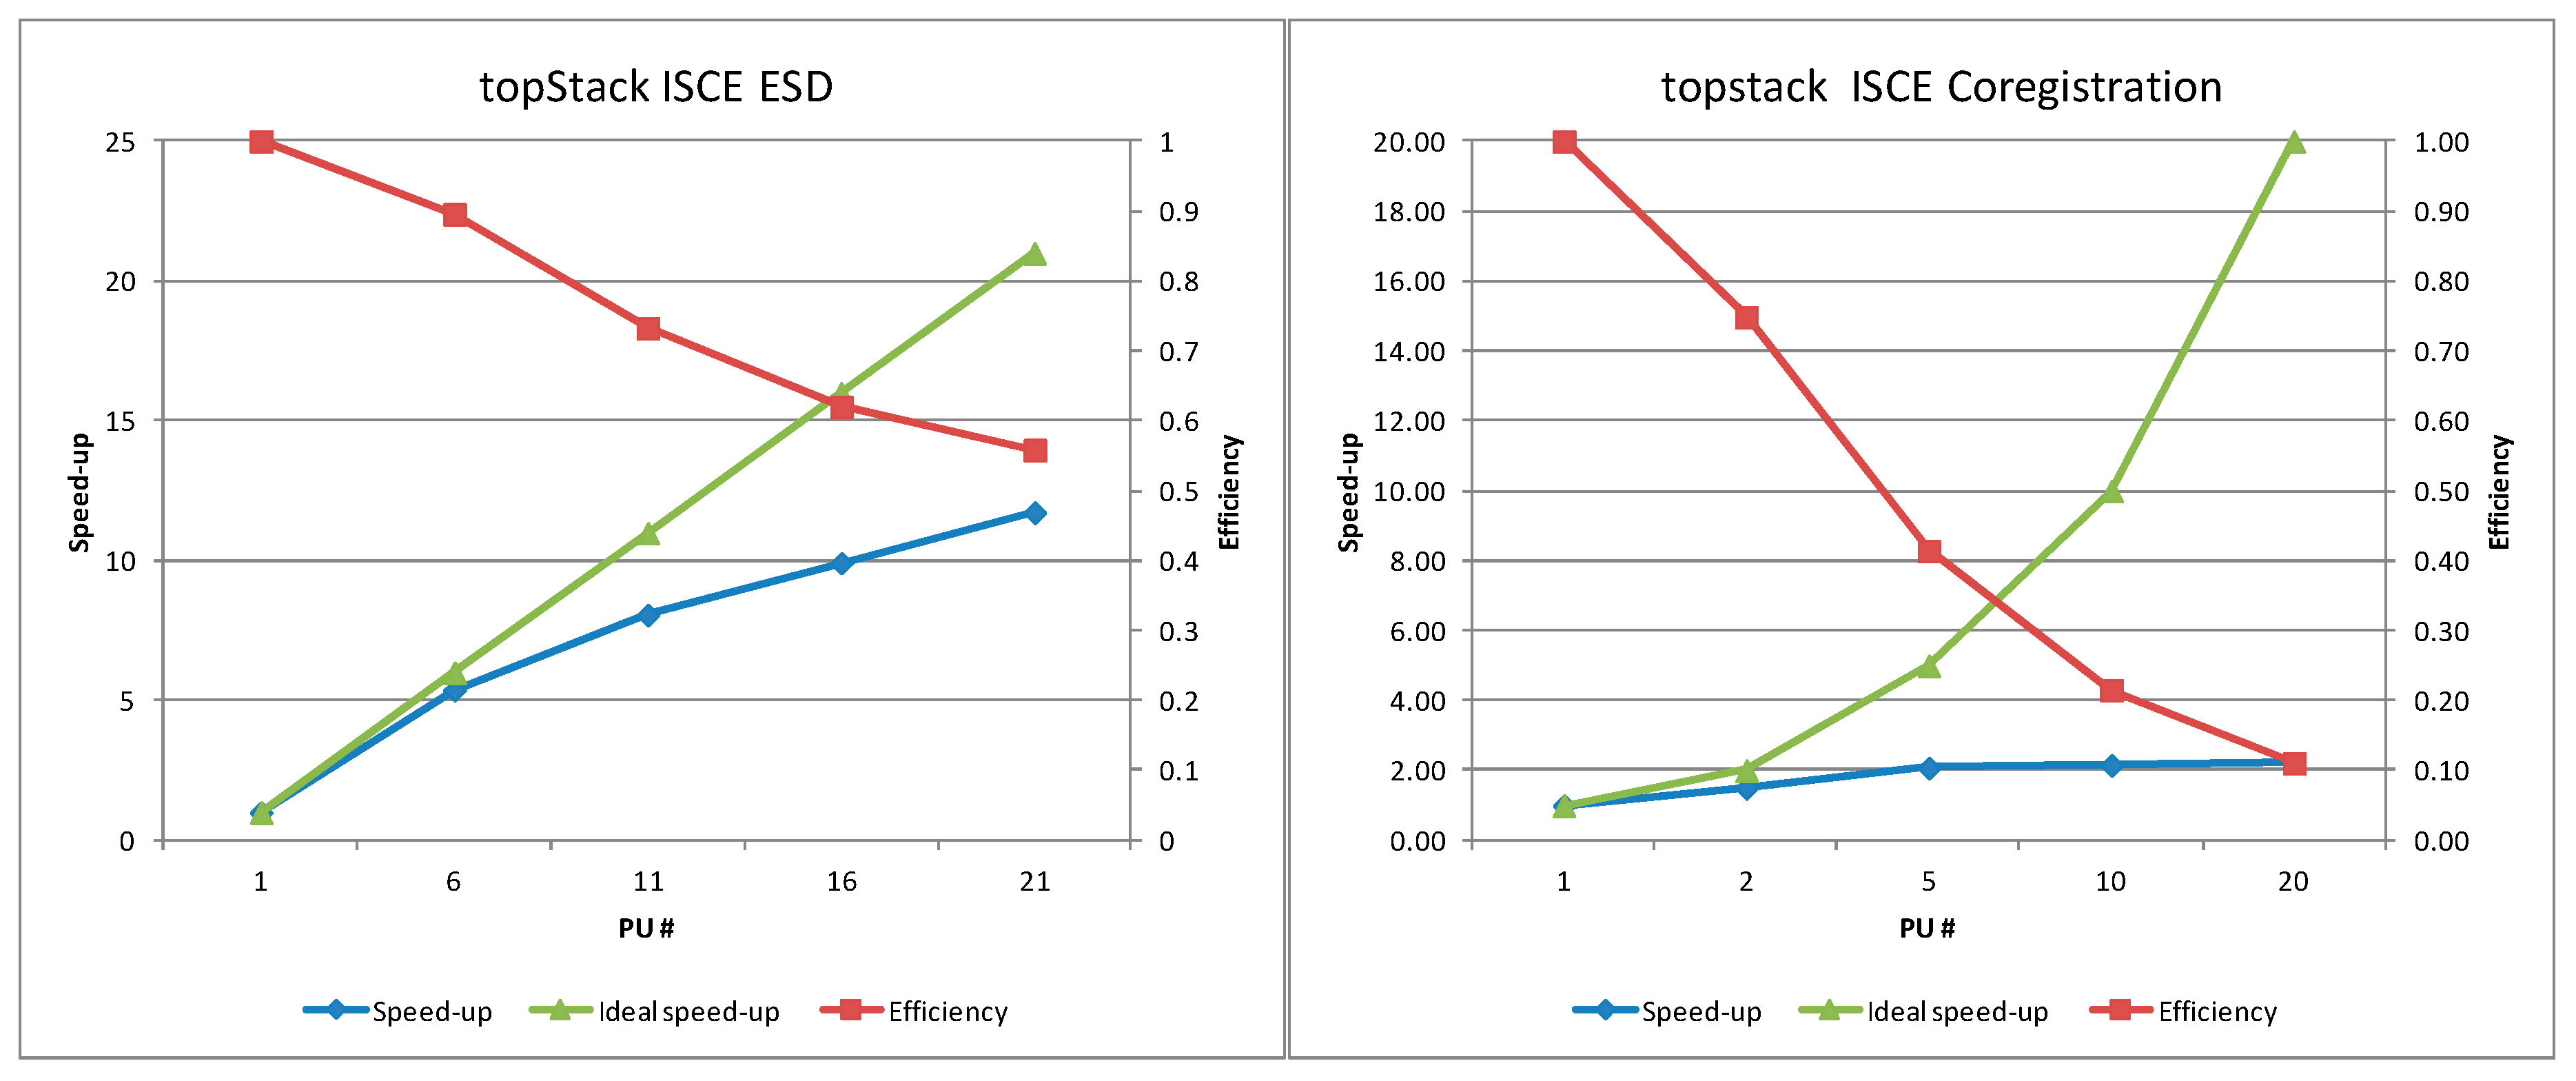
The results showed that we sped up the individual processes on which we applied parallelization from 2 to 15 times, depending on the specific process. From
Figure 1B, we are able to achieve a speed-up of up to 12 for 20 PUs (
Figure 6, left) as opposed to a speed-up of 20 in the ideal case. This is an excellent improvement given that we applied coarse-grained parallelization with minimal interventions, in line with our initial strategy.
In the case of the coregistration step of topStack ISCE2 (
Figure 6, right), we achieved a lower speed-up (~2). This was expected due to this step already exploiting the multicore environment by design. Even though the speed-up is not impressive, the absolute processing time gain is important since this process is responsible for roughly 30% of the entire processing time on the conventional, nonparallelized, benchmark PSI runs (
Table 1).
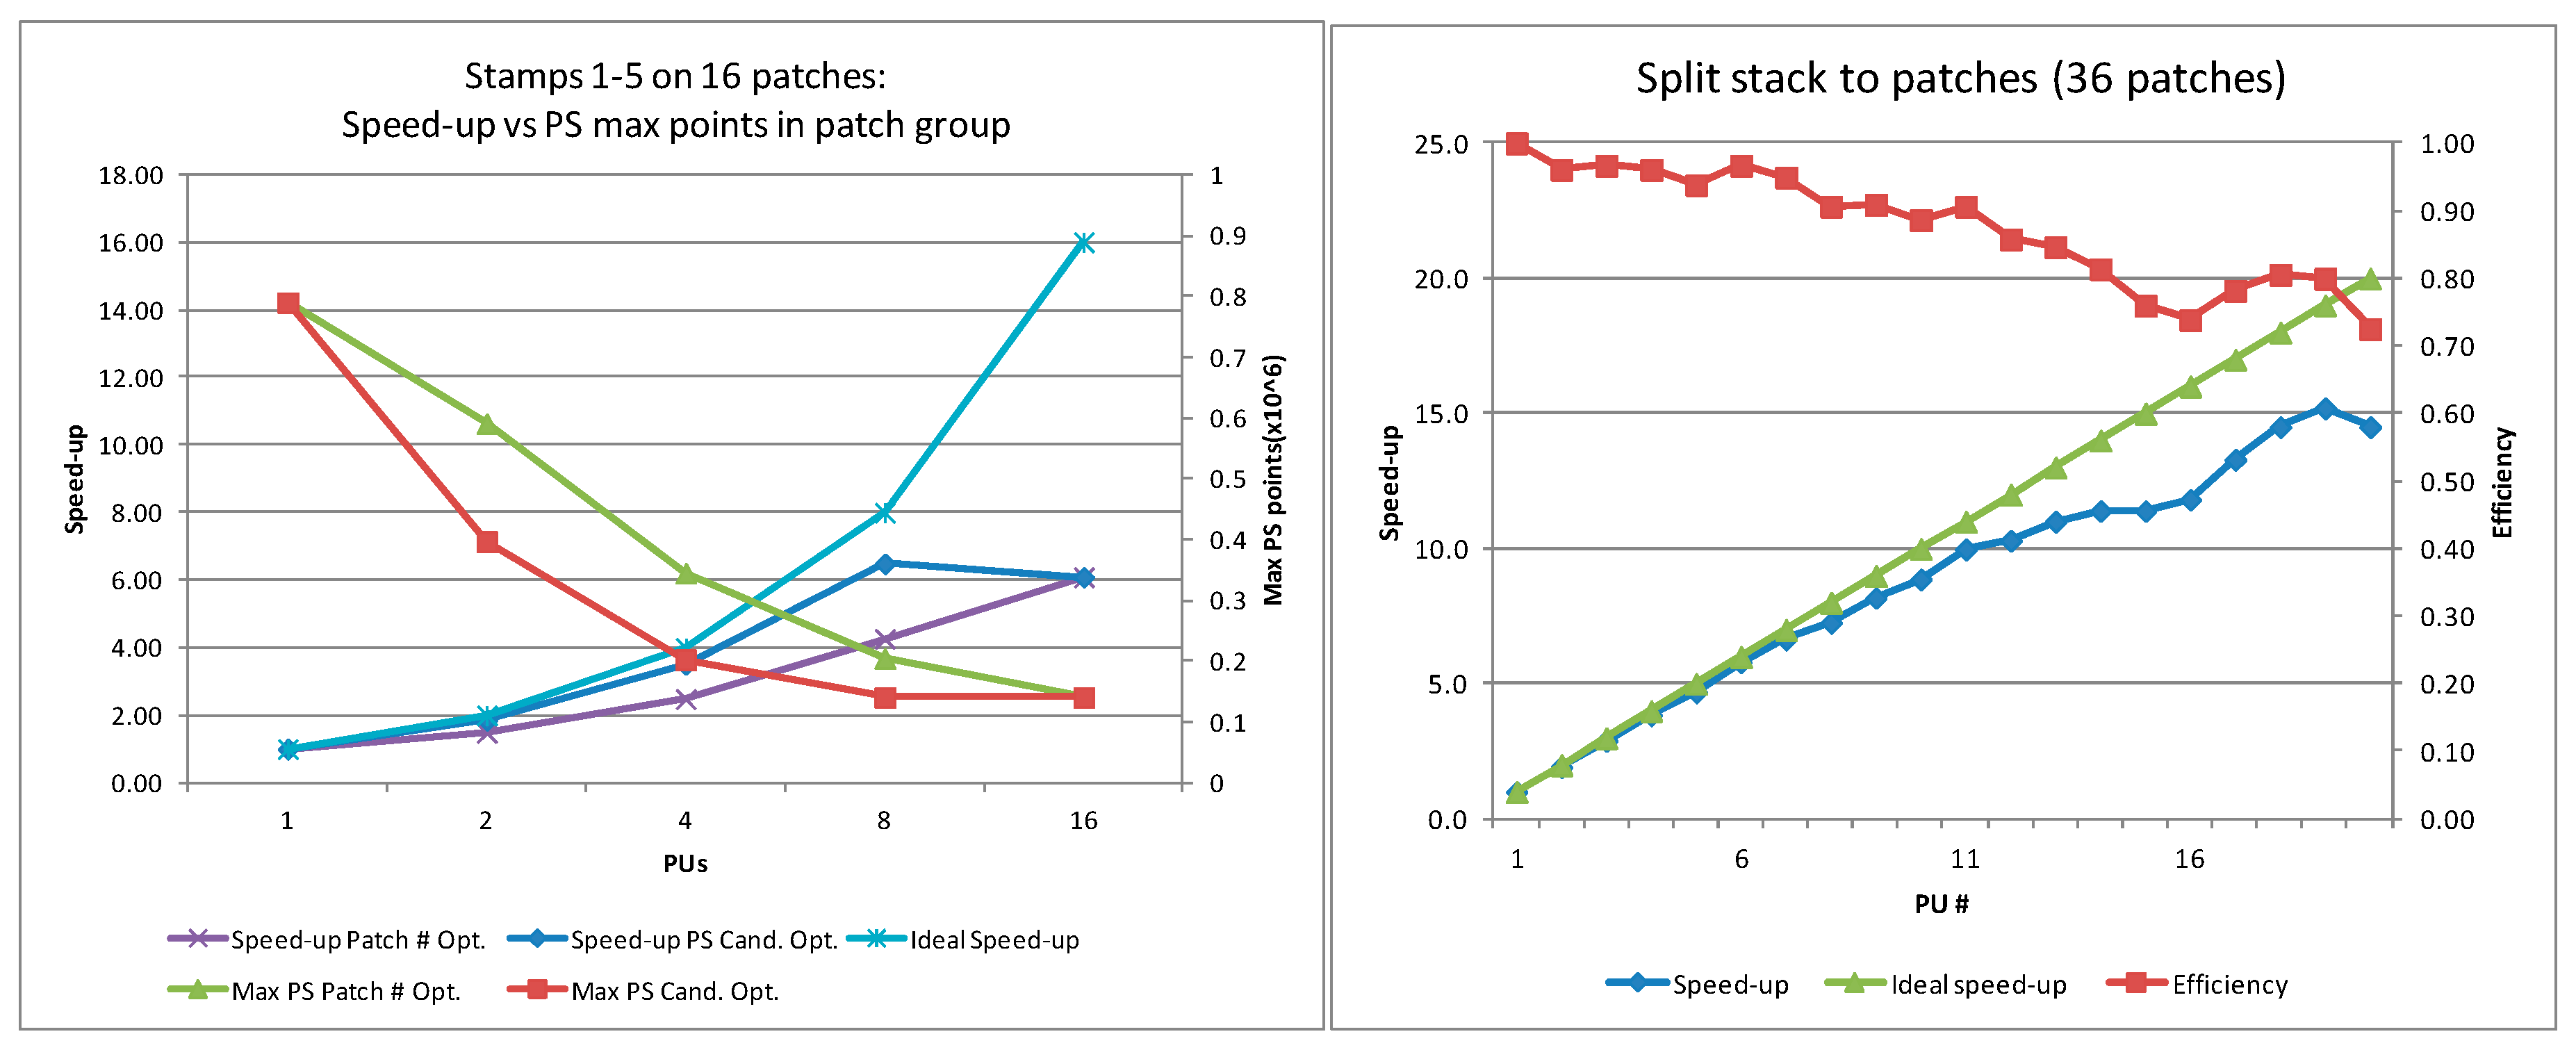
For StaMPS 1–5, the simpler parallelization, where the number of patches that will be processed in each CPU core is balanced, achieves a speed-up from two to six times (
Figure 7, left, marked as Patch # Opt.). The algorithm that balances the number of PSs achieves a further 50% increase in the speed-up, on average (left in
Figure 7, marked as PS Cand. Opt.). However, the benefit in the speed-up for these two approaches is largely dependent on the expected PS density per chunk. This is shown again in
Figure 7 (left), for which the total numbers of patches to be processed is set to 16. The benefit of using 16 as opposed to eight PUs fades since the driving factor for the processing time is the expected maximum number of PSs in a patch. Whereas the maximum number of PSs in a patch for eight PUs was ~0.18 × 10
6 for the patch balancing algorithm as opposed to ~0.14 × 10
6 for the PS balancing algorithm, for 16 PUs for both algorithms, the maximum number of PSs per patch was ~0.13 × 10
6. Thus, they both achieved the same speed-up (~6) as this is the bottleneck. Notably, the algorithm can be further enhanced if we create the non-uniform grid from scratch using a priori information on the land cover and do not rely on the initial patch split performed by StaMPS.
Considering the patch preparation algorithm in
Figure 4, the speed-up achieved increases almost linearly with the number of PUs (
Figure 7, right), which aer very close to the ideal speed-up curve. Indicatively, for preparing 36 patches using 20 cores, we achieved a speed-up of 14.5 with respect to the conventional PSI patch preparation algorithm.
The speed-up for the end-to-end processing chain on the benchmark data set in comparison to the nonparallelized run was calculated as ~2.6 (
Table 1), indicating that the processing speed was about triple the speed on the nonparallelized version. In reality, this means that for the specific exercise, the conventional open-source ISCE2–StaMPS pipelines need roughly 800 min to conclude; when employing our P-PSI, the pipeline finished in slightly over 300 min. Notably, this improvement is hardware-dependent, which in our case corresponds to the 20 hyperthreaded physical cores available for the benchmark exercise. From the benchmark figures in this section, we can deduce that for topStack ISCE2 ESD, split stack to patches, and StaMPS 1–5 parallelized processes, we can further decrease processing time if more processing cores are available.
To estimate the overall processing chain speed-up for a full Sentinel-1 frame, it is important to understand how the processing time percentage of the total processing time for some processes significantly differs when different stacks of images are processed. The main cause of these differences is the ISCE2 topStack processing time being proportional to the number of the stacked images and the number of bursts processed for each image, whereas the StaMPS processing time is mostly proportional to the number of PS points, which depends on the size of the area and the type of the land cover.
We therefore calculated by approximation that for a stack of 100 images covering an entire Sentinel-1 tile, which includes large urban areas with PS points that would be three times denser than in the benchmark area, the processing time would be about five times faster than before parallelization interventions (
Table 2). This means a reduction in the total processing time from 15 to approximately three days. This is a huge difference for projects like InSAR Greece, where we wish to estimate line-of-sight (LOS) velocities for an entire country that is covered by multiple Sentinel-1 frames. The same applies to the potential to update these velocities in the future to include new Sentinel-1 acquisitions and provide dynamic monitoring at a national scale.
4. InSAR Greece Results
The effectiveness of the P-PSI chain was successfully tested on an unprecedented national-scale project that was built around the massive processing of more than 800 Sentinel-1 (A and B), interferometric wide-swath (IW) descending satellite pass SLC images, spanning from 2015 to 2019, covering the entire mainland of Greece.
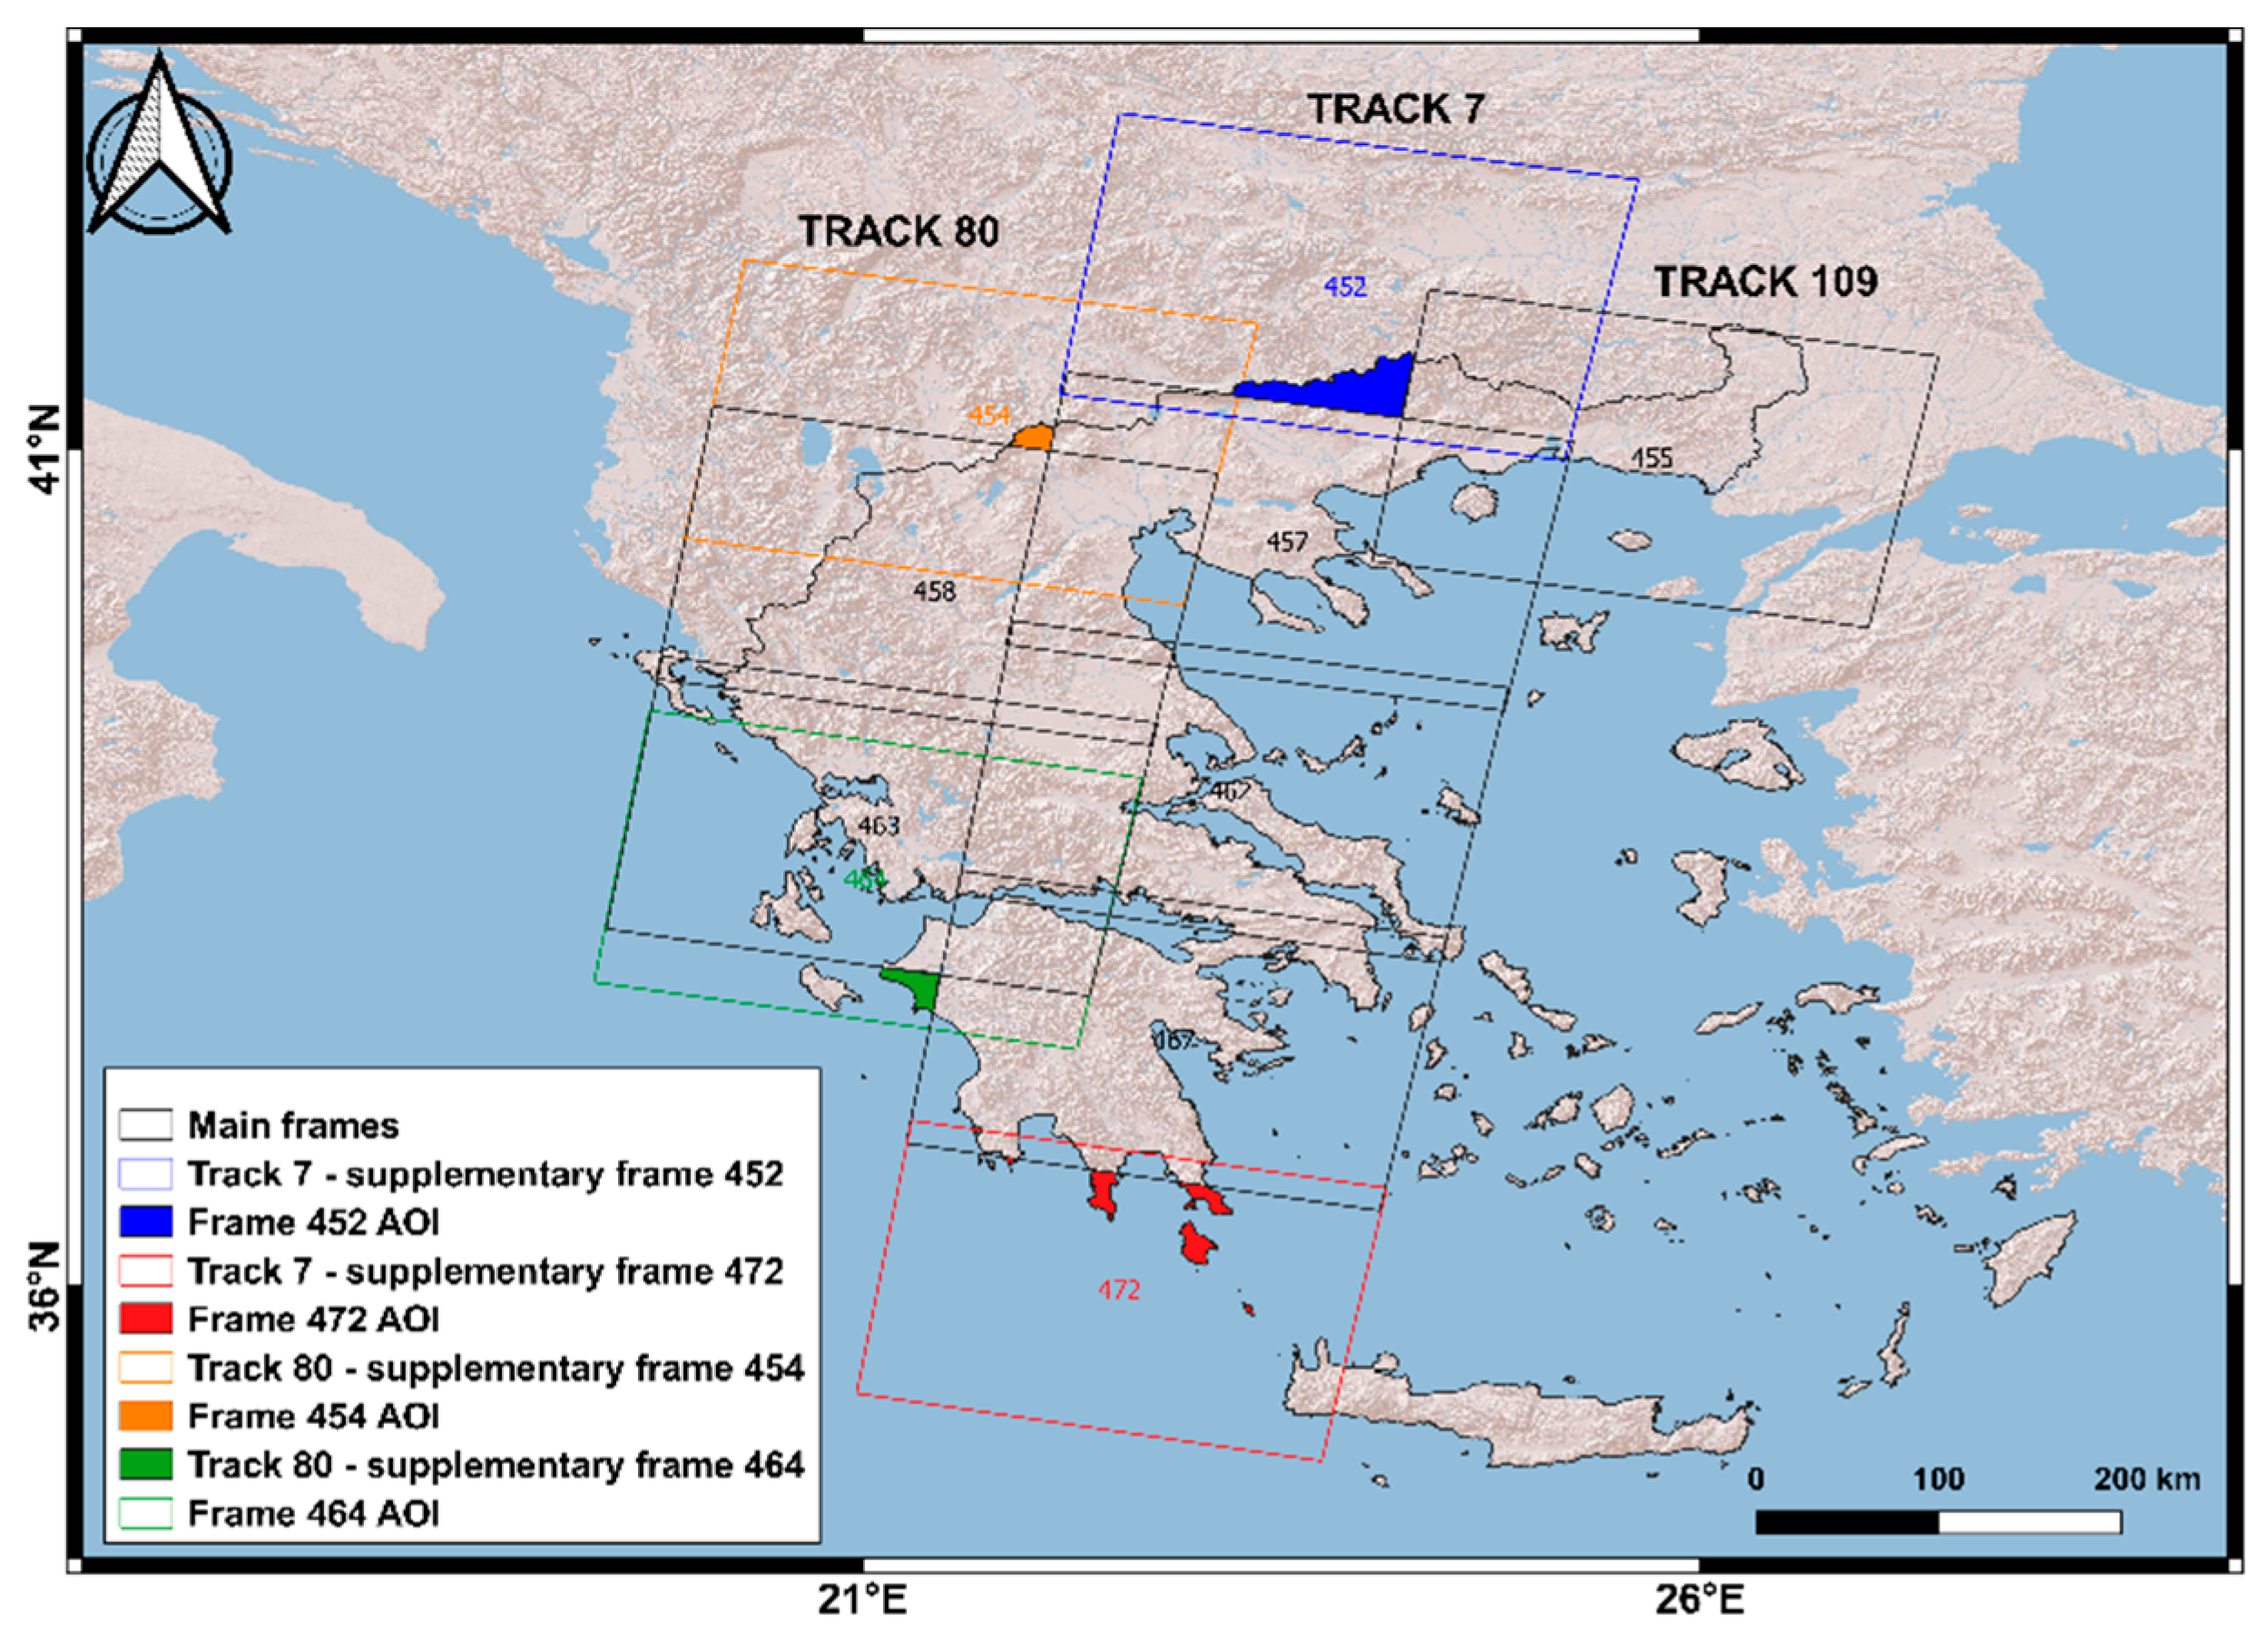
To assess the performance of the processing chain, all swaths and their included bursts were processed in most frames covering Greece’s mainland. Four frames, depicted with various colors in
Figure 8, were selected to cover the remaining small areas in the Greek territory that were partially processed. The project integrated more than 12 TB of Sentinel-1 data belonging to three descending tracks, including four, five, and one frame, separately (
Figure 8). The PSs that were produced for each individual run of P-PSI in these Sentinel-1 frames are shown in
Table 3.
The required processing time and storage requirements were estimated prior to the selection of the final stack size. From 2015 to 2019, with a sample of three images per month, leading to 171 SLCs in total, almost 9 TB in storage was needed and a processing time of approximately 15 days for each full frame stack using the nonparallelized pipeline version. In our case, the selection of a stack with a maximum number of 120 images provided a satisfying temporal sampling (2 SLCs per month). The selected stack sizes were a trade-off between storage needs, processing time, temporal sampling, and accuracy of the end-product. As shown in
Table 3, the initial selection of around 100 to 120 images per stack was changed occasionally due to data availability per track. Note that for the supplementary frames covering smaller areas, we used fewer SLCs, which had no impact on the density or quality of PS pixels.
The coregistered stack of Sentinel-1 SLCs was generated with the P-PSI workflow (
Figure 1). Precise orbit data, provided by ESA and Shuttle Radar Topography Mission (SRTM) DEM [
49] with a resolution of one arc-second, were used for the coregistration of burst overlaps of all secondary acquisitions to the primary image. The generation of differential overlap interferograms was parallelized to take advantage of all available hardware resources and minimize the processing time. The azimuth misregistration was estimated using the enhanced spectral diversity (ESD) technique [
33]. Precise coregistration of the primary and secondary images was performed using geometrical azimuth and range offsets, computed from DEM and orbital data and range and azimuth time-series misregistration. Finally, all bursts for the primary and coregistered SLCs were merged.
LOS displacements were estimated with the StaMPS component of P-PSI (
Figure 1). Outputs from the ISCE2 stack processor were prepared with the ISCE2 to StaMPS package [
50] to perform time-series analysis with StaMPS. A phase-based linear correction with the open-source toolbox TRAIN [
34] was implemented in all interferograms produced using Sentinel-1 data. The initial selection of PSs was based on their amplitude dispersion, as defined by Ferretti et al. [
10]. According to the experience gained, a full Sentinel-1 stack typically returns around 2,000,000 PSs. GPS/GNSS stations from a dense nationwide network, maintained and operated by the Dionysos Satellite Observatory (DSO), served as reference points for all multitemporal InSAR processing. GPS continuous stations, covering the study area and showcasing velocity stability over the investigated time period, were selected as nondeforming points upon which to base interferometric unwrapping.
As shown in
Figure 8, an unavoidable overlap occurs between frames of adjacent tracks. A transformation of PSs from overlapping frames, by solving the inconsistencies of pixels belonging to adjacent tracks, was added as a final processing step in our chain. Initially, we assumed that pixels included in a 25 m radius share the same deformation regime. Therefore, a uniform grid of PS was formed for both tracks, with a patch size of 25 m. The LOS velocity in the center of each patch is estimated with spline interpolation. Cells with zero PS are excluded from multitrack merging. The LOS velocities of the second adjacent frame, considered as the secondary frame, are transformed into the geometry of the first frame, known as the primary frame. Subsequently, following the rationale of the technique proposed by Ge et al. [
51], the reference offset between primary and secondary tracks is estimated using
where
vmi is the displacement rate of the PS in the master track and
vsi is the displacement rate of the PS in the slave track.
The estimated offset is added in all PSs included in the overlapping region (Equation (4)), resulting in a compensated velocity value for the secondary pixels. The final velocity of overlapping PS is calculated with a weighted mean formula (Equation (5)). The frame with the minimum phase unwrapping errors, noise artifacts, and spatially uncorrelated look angle errors was selected as the primary track:
where
Pmi is the weight selected for the PS in the master track and
Psi is the weight selected for the PS in the slave track.
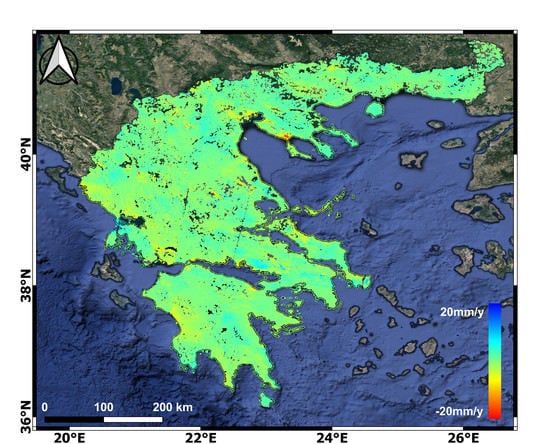
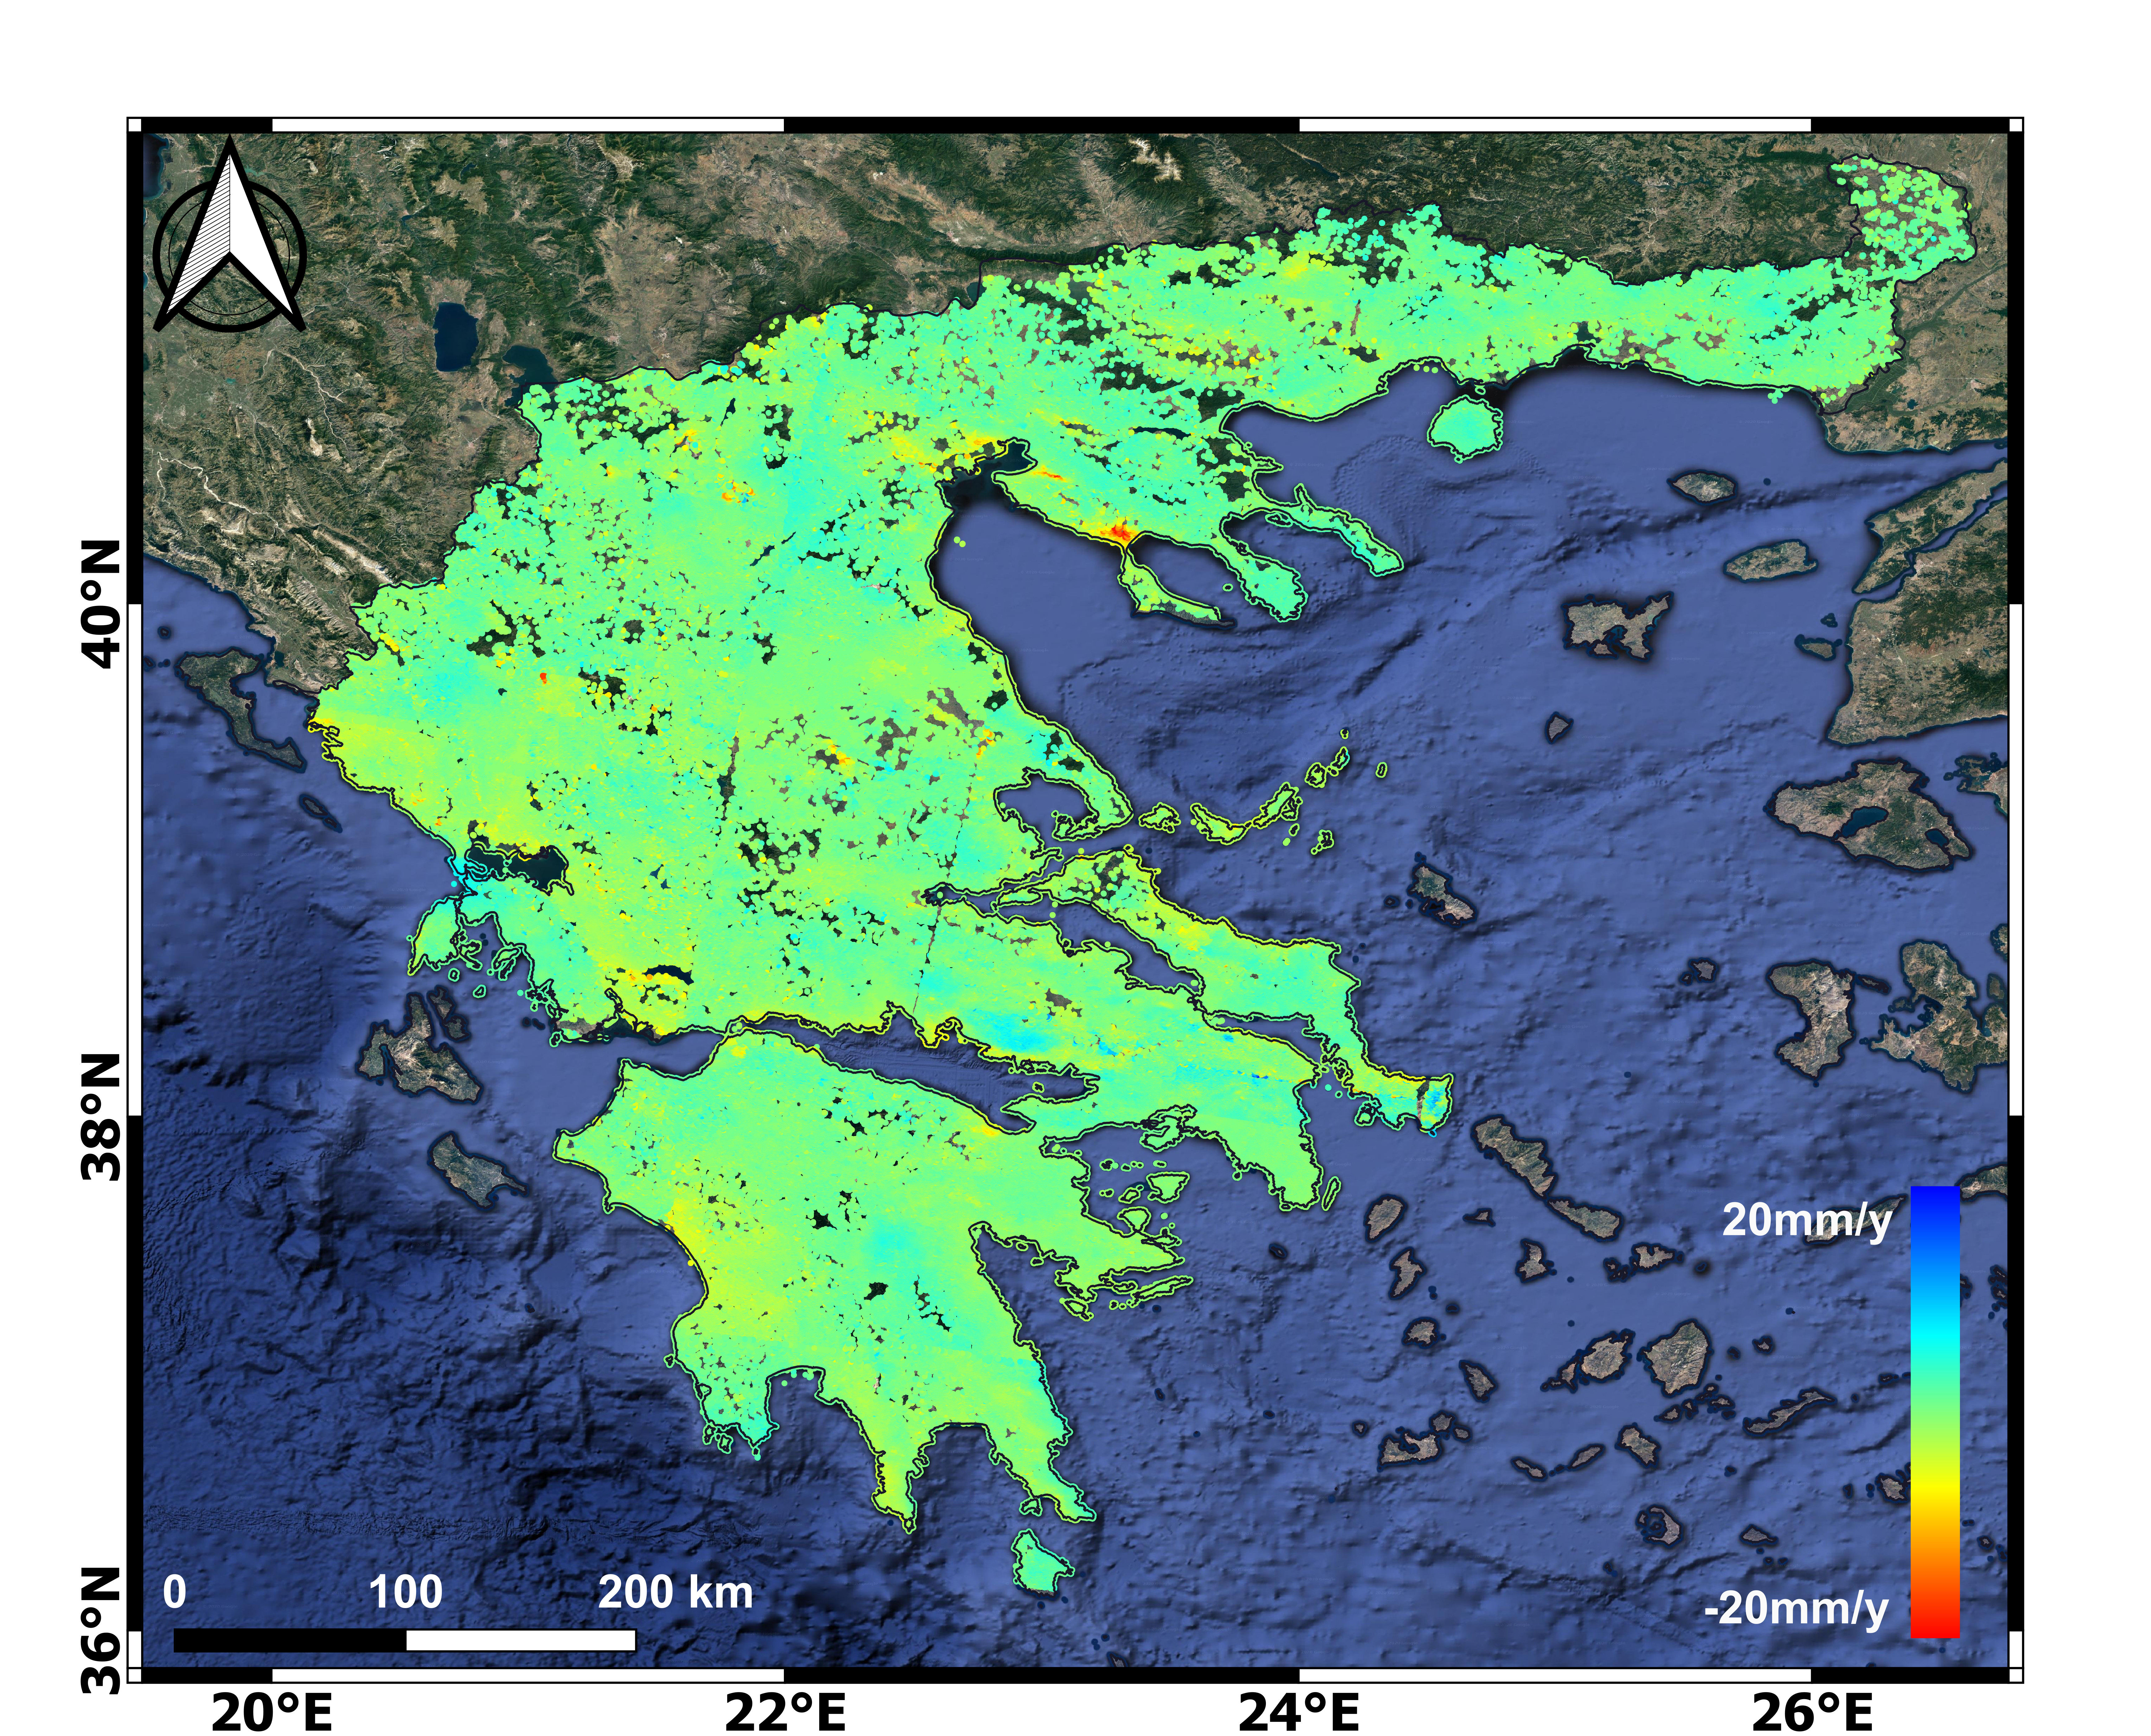
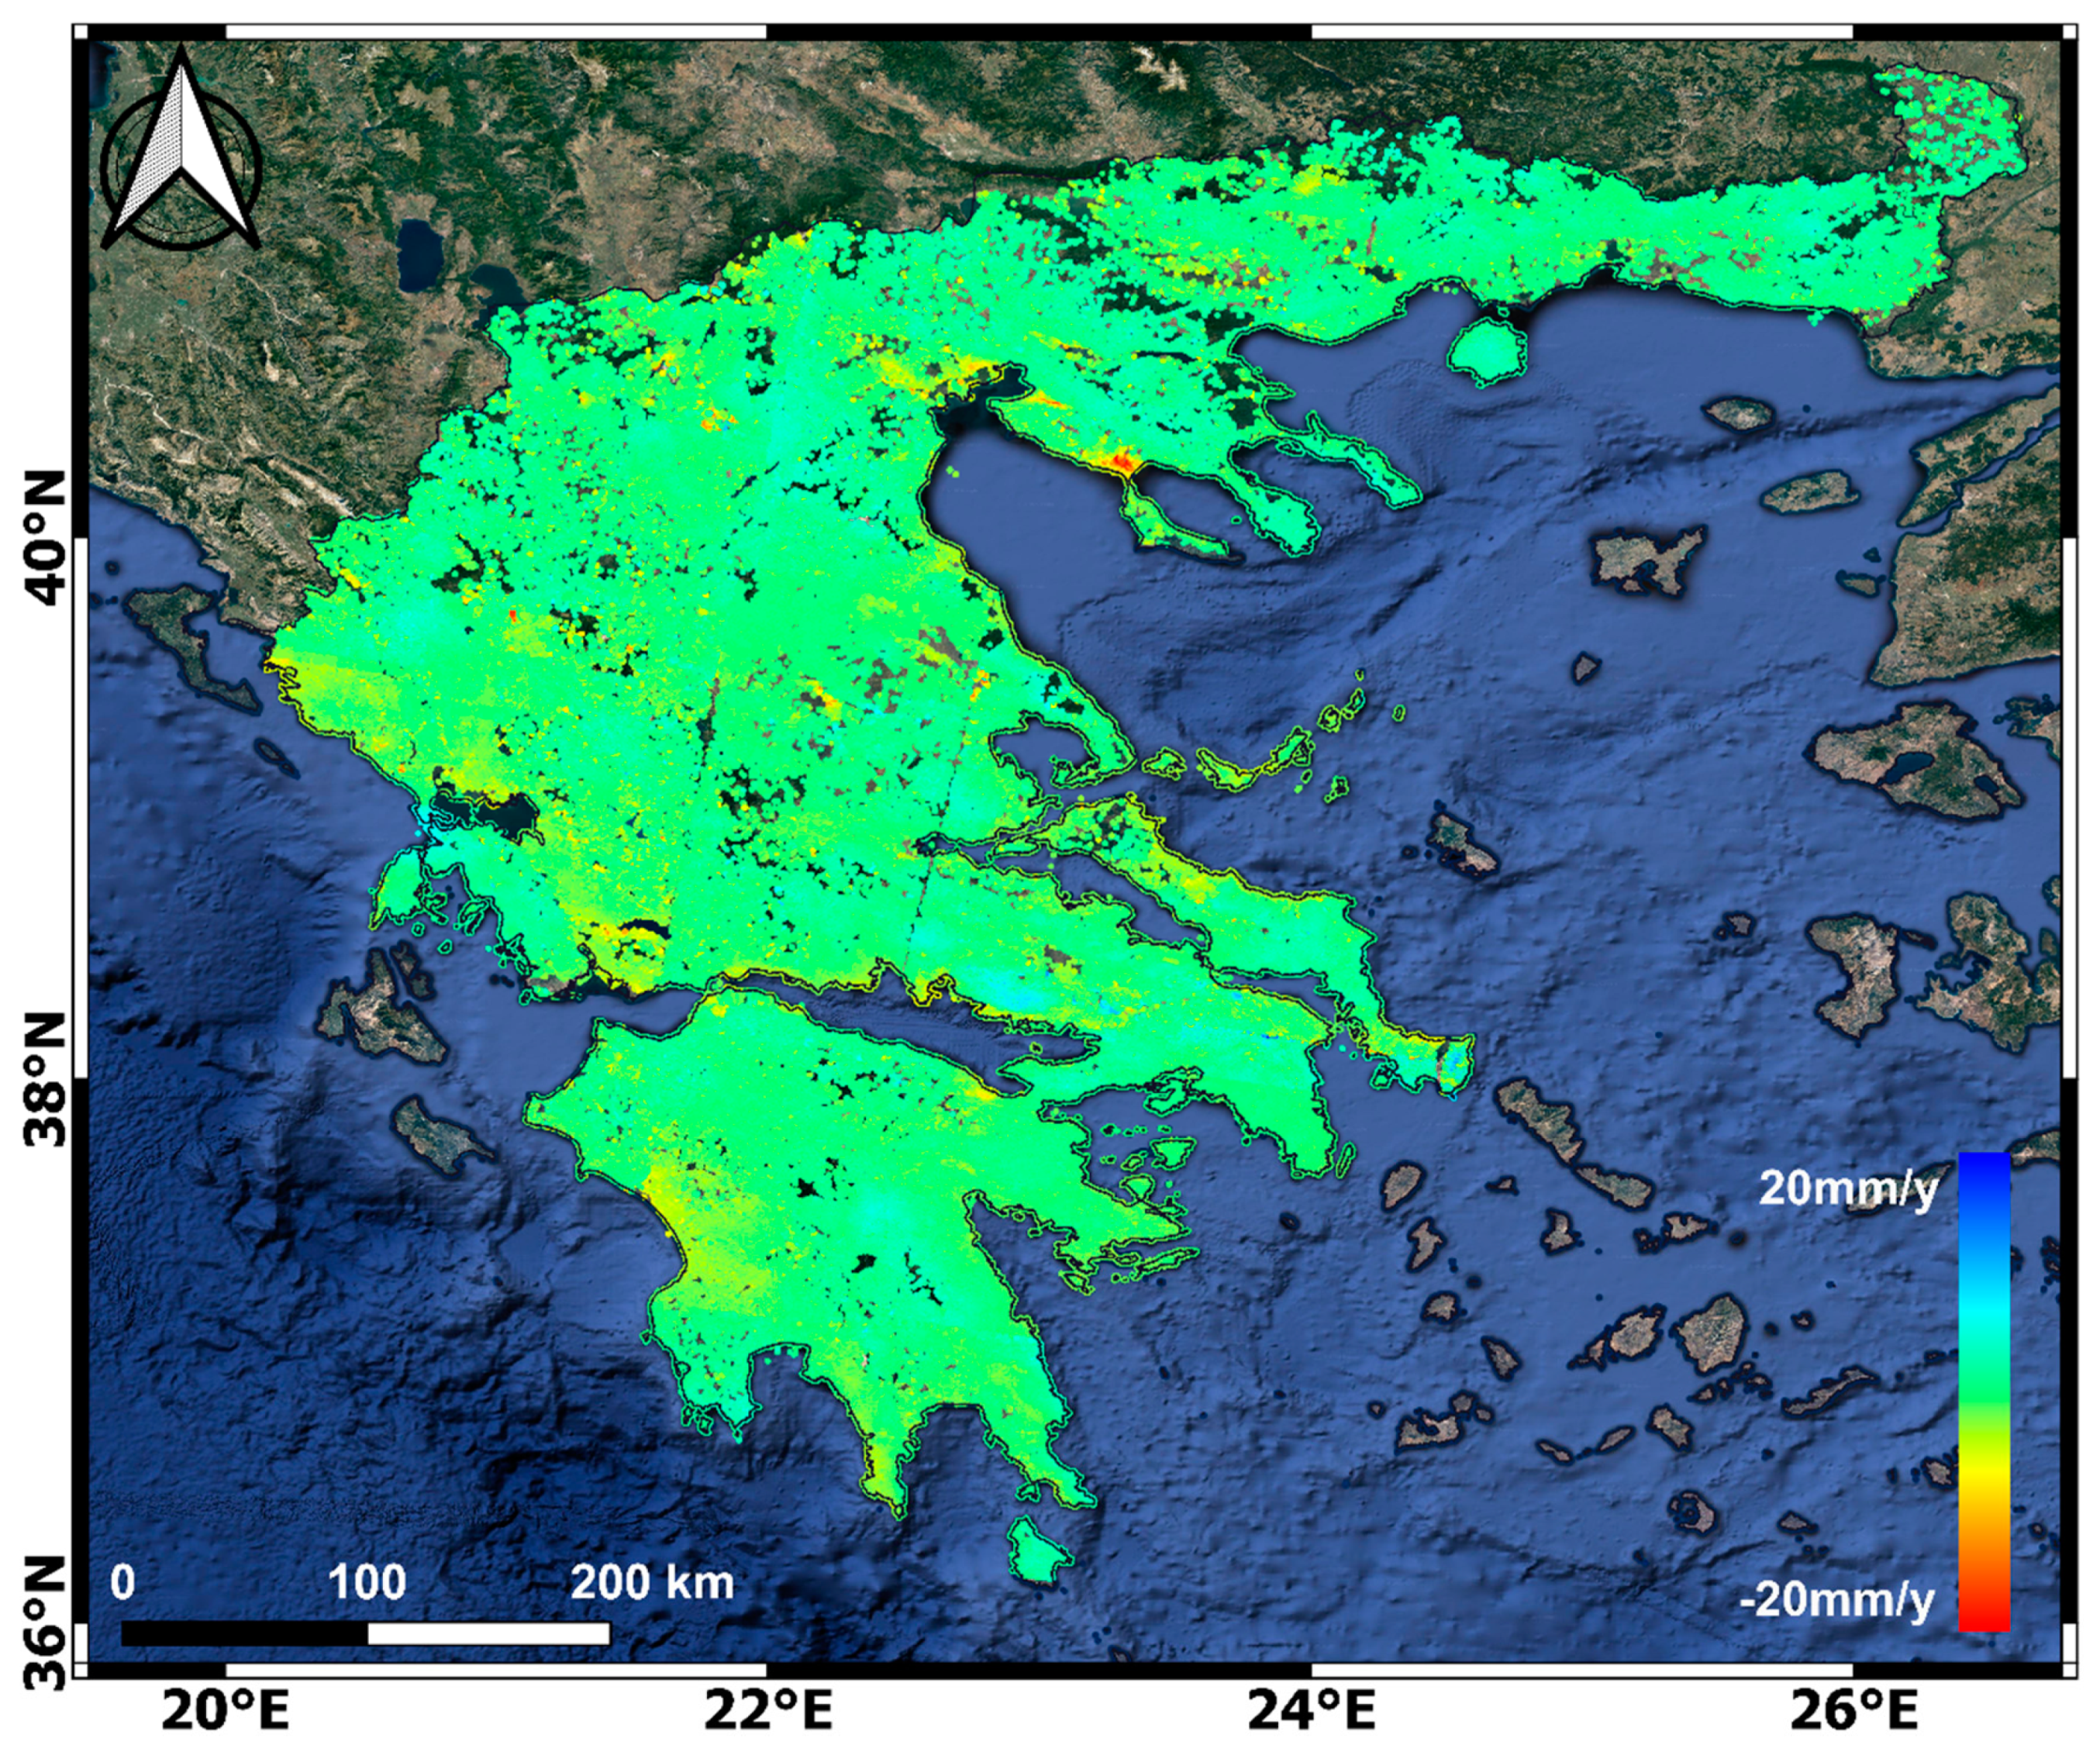
Our P-PSI time-series analysis resulted in more than 12,663,970 persistent scatterers overall, spread in the continental Greek territory for which the LOS velocities and individual deformation histories were estimated. The unique product is demonstrated in
Figure 9. This national-scale mapping of PSs is now available for the first time for Greece. More than 3 TB of input SLC images were processed; including the volume of intermediate products needed to reproduce all products resulted in a total storage size of 12 TB.
The InSAR Greece product was generated in 1.5 months, including both automated and manual processes, as shown in
Figure 1D. For a full Sentinel-1 frame stack, data downloading ranges from 6 to 10 h for a stack of 100 images, depending on the size of the compressed SLC images. The generation of the InSAR stack with our parallelized versions of ESD and coregistration steps of ISCE software required 1.5 days on average to complete. The same applies to PSI processing. The final processing steps include a manual iterative refinement process, with Steps 6 and 7 of StaMPS processing, to mitigate unwrapping errors. Depending on the dataset, this requires several hours of additional manual analysis by an InSAR expert. The end-to-end P-PSI processing time, including data downloading, ranges from 2.5 to 4 days, and on average was three days. However, these values are not absolute and many factors affect the processing time, e.g., the land cover of each frame. The overall processing time of 1.5 months required for the InSAR Greece product will be further reduced in the next product updates, since most technical parameters (e.g., reference points per stack) have already been consolidated and fine-tuned. This time frame to map the entire country highlights the efficiency of our P-PSI processing chain. It allows the regular update of the product (~six updates at least) within one full year, allowing national-scale dynamic monitoring. This was not possible with the conventional PSI pipeline, requiring 15 days per Sentinel-1 frame without accounting for any manual analysis.
5. InSAR Greece Product: Mapping Diverse Deformation Regimes
The main deformation mechanisms present in the InSAR Greece product (
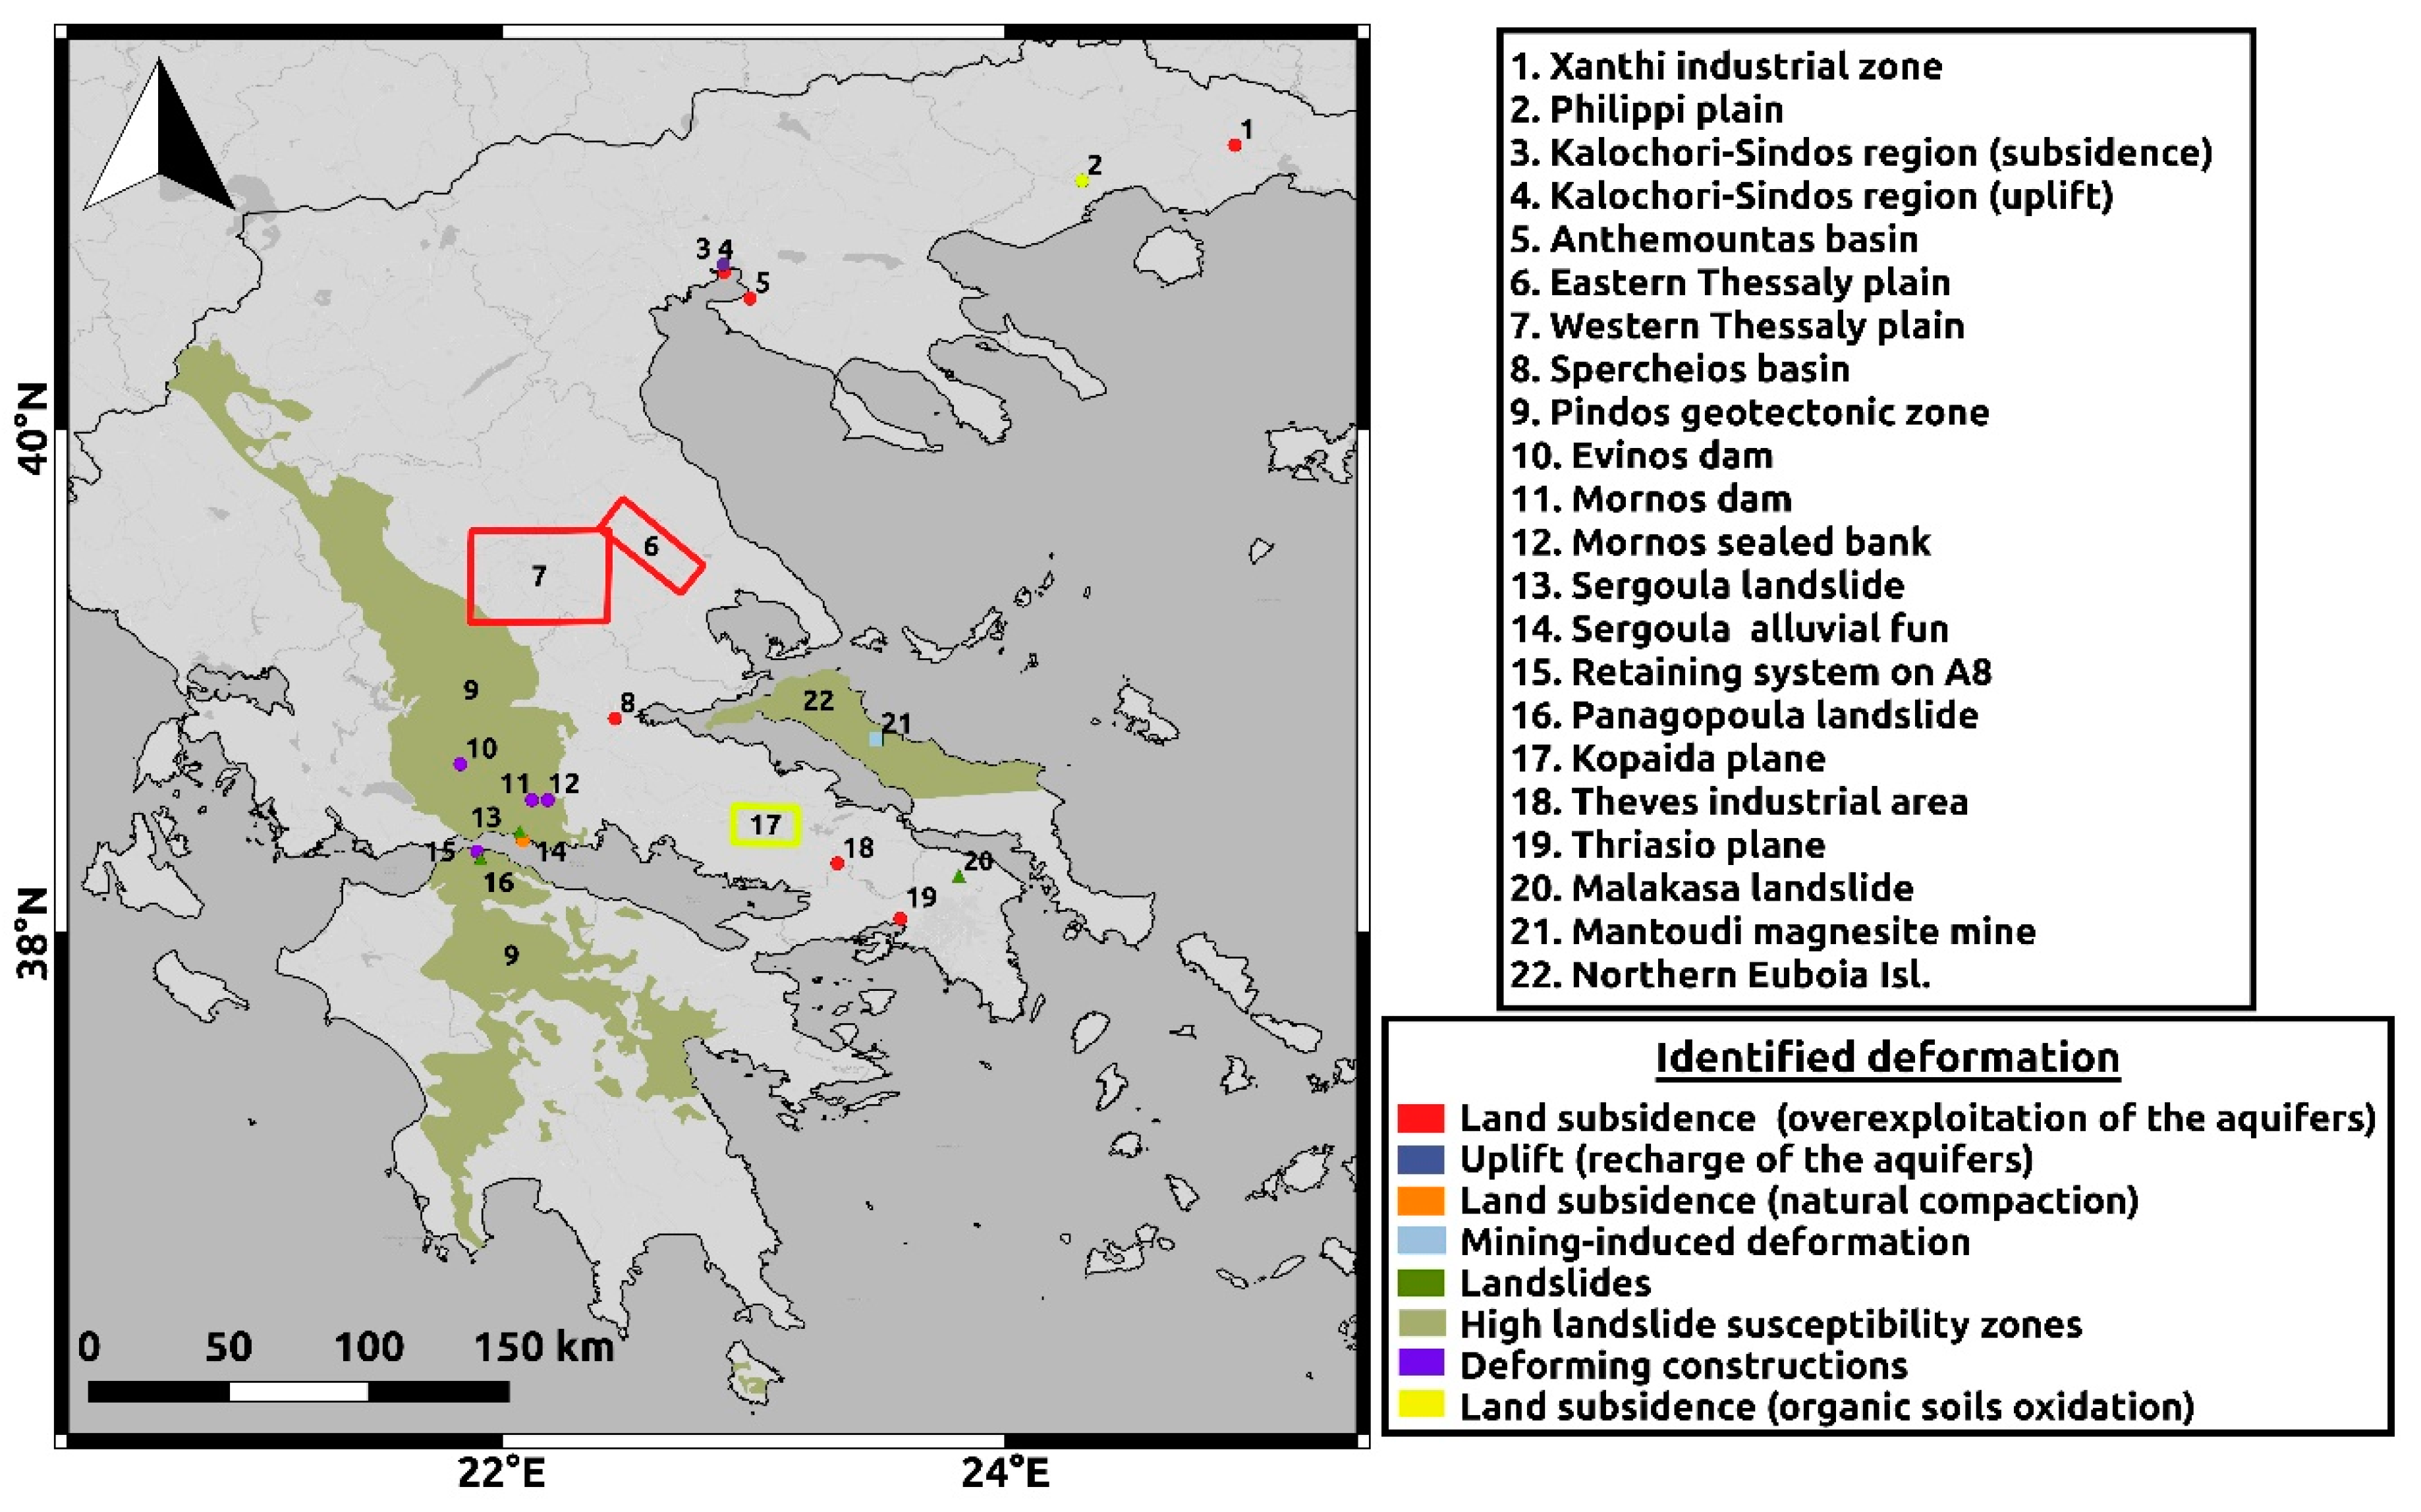
Figure 9) include: landslide events affecting urban or mountainous areas; extensive land subsidence due to the overexploitation of the aquifers, natural compaction of sediments, or oxidation of organic soils; uplift phenomena on plain areas due to the rebound–recharge of the aquifers; deformations triggered by the active tectonic displacements on massive constructions such as dams, bridges, or even large retaining walls; deformations on mining sites related to slope failures or underground cavities collapse; settlement of road embankments; newly constructed buildings; and several other small-scale phenomena. To verify the efficiency of the applied technique in real case studies, some high-impact examples indicating the value and potential of the InSAR Greece study selected for relevant research are presented in the following paragraphs, distributed all over mainland Greece (
Figure 10).
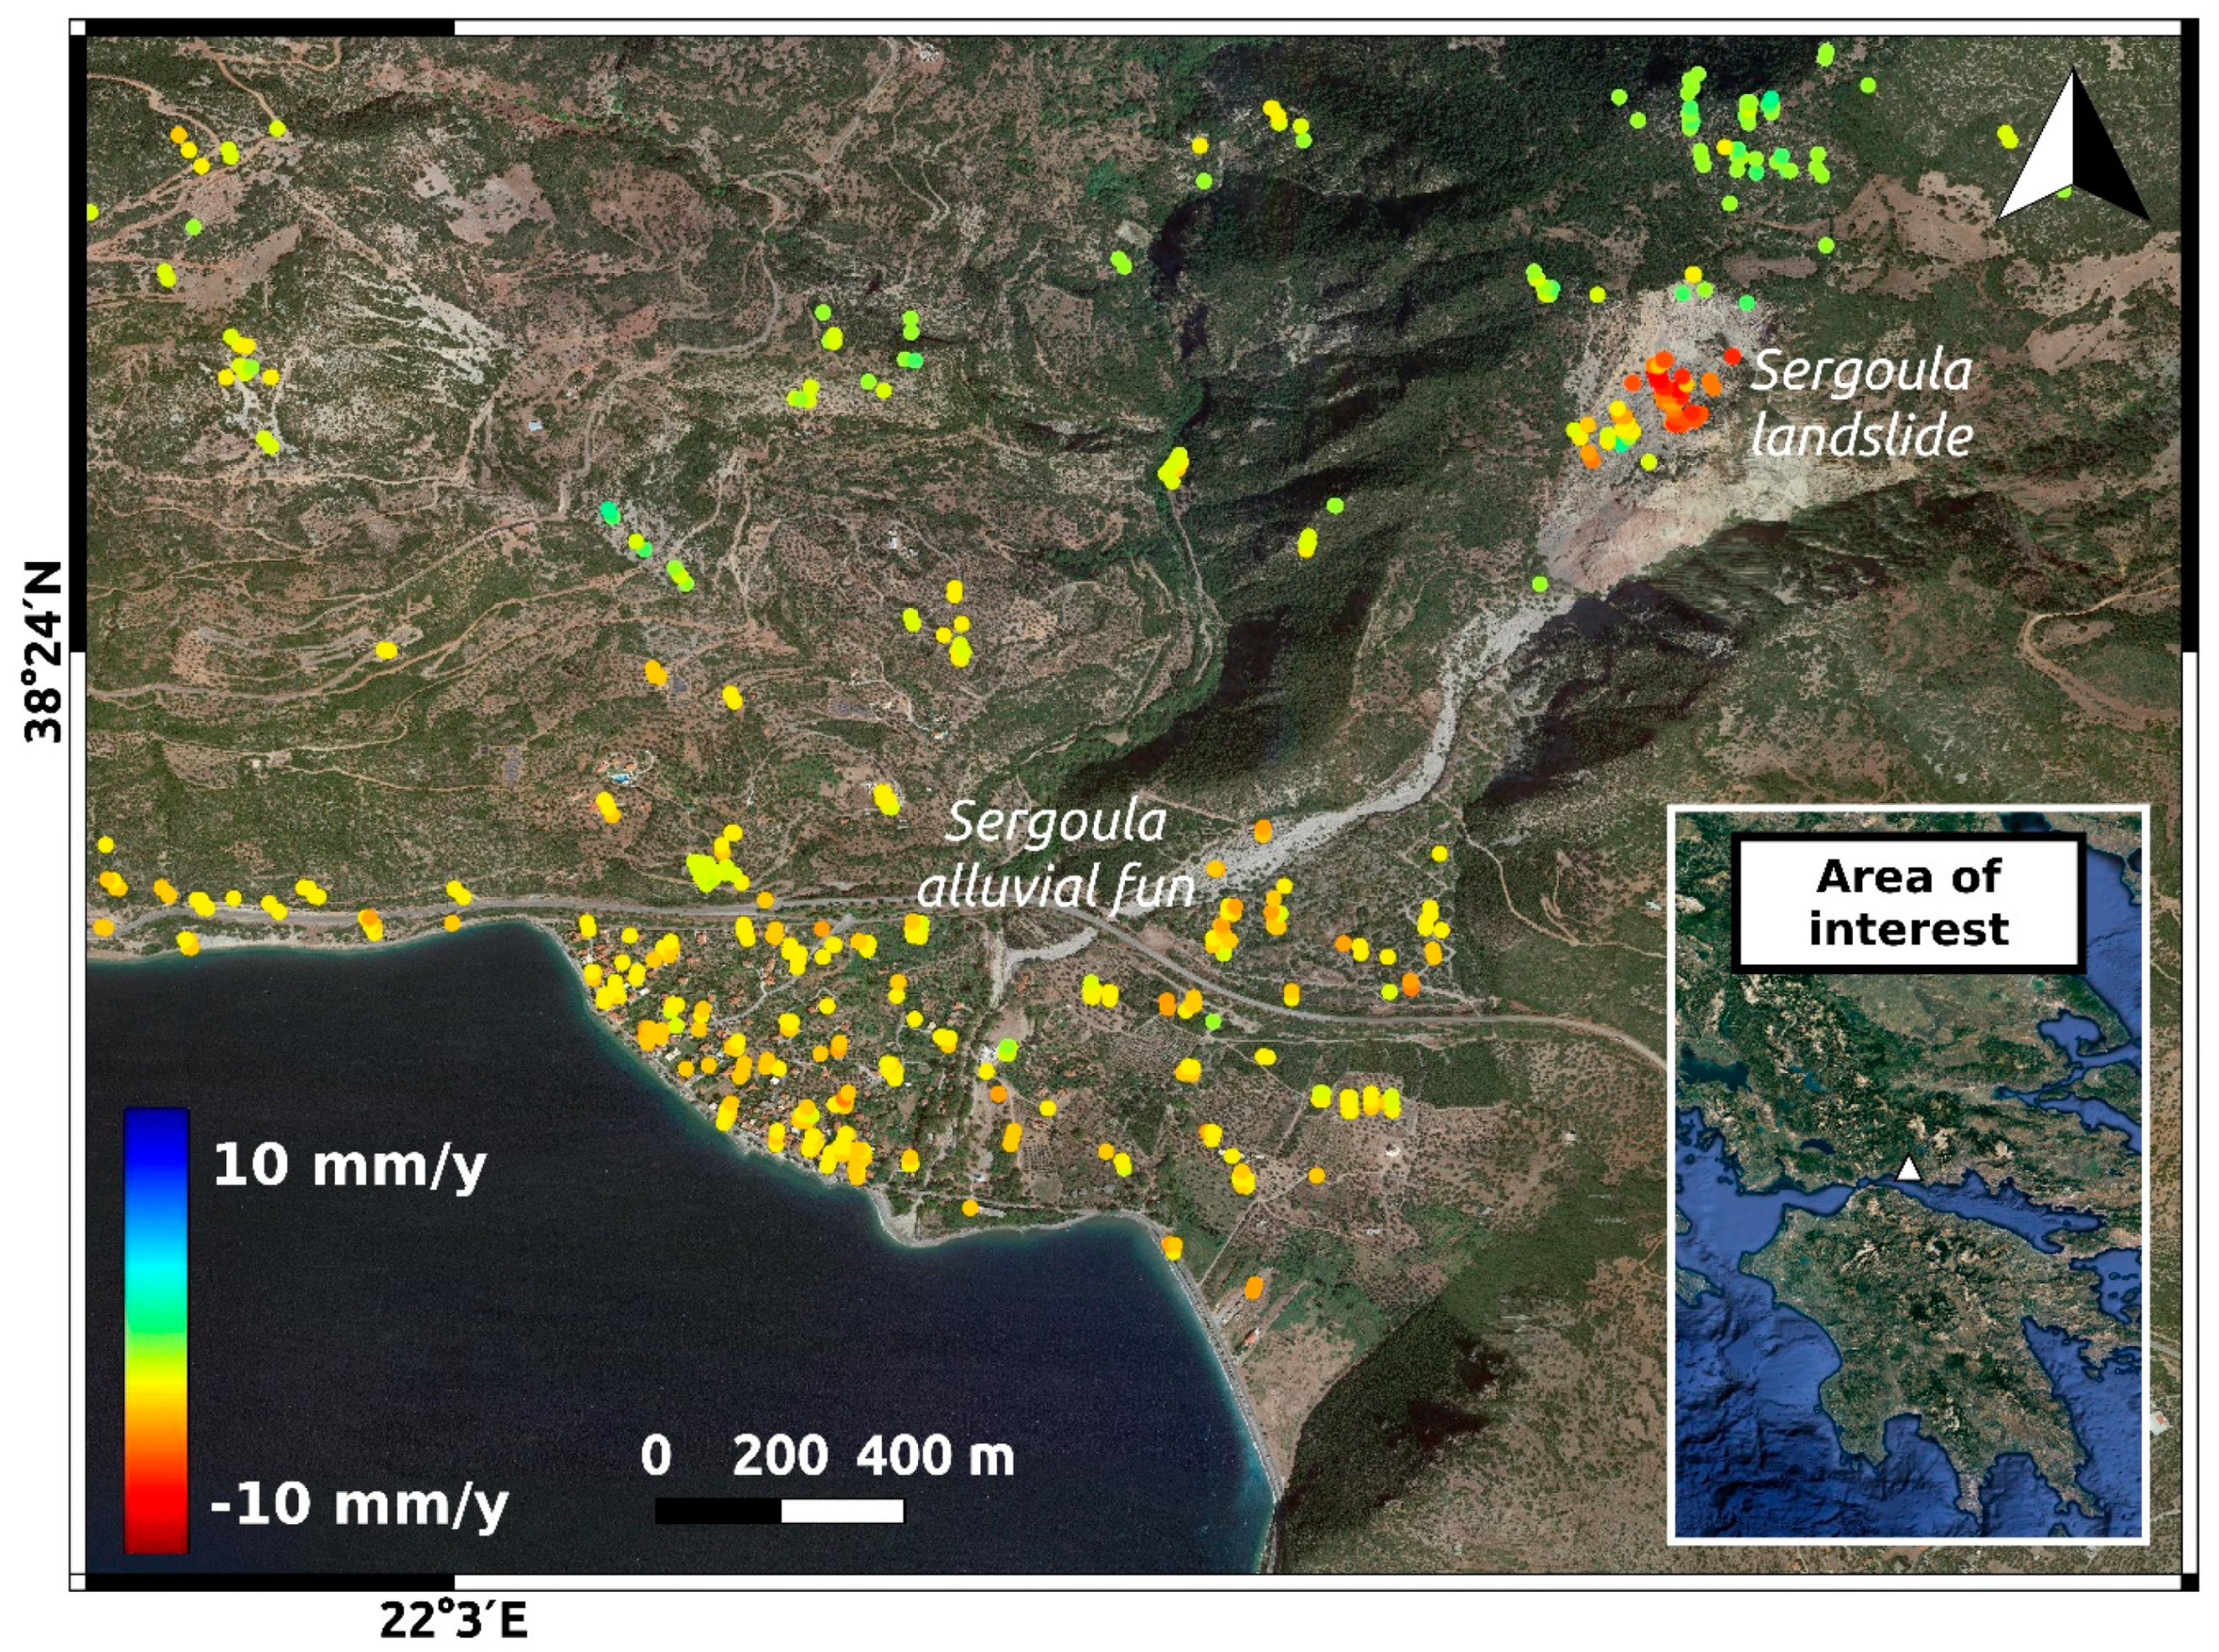
Greece is among the most landslide-prone areas in Europe [
52], being a part of the youngest and most geomorphologically and tectonically active sections of the Eurasian geotectonic plate, formed mainly during the Alpine orogenesis. Thousands of landslides have been recorded during the last decades [
53,
54] in Greece, including several major ones, causing casualties and extreme financial losses. Among them, the Sergoula landslide is included, which occurred adjacent to the active Marathias normal fault [
55] along the Gulf of Corinth (
Figure 10 (13)), occurring primarily within highly brecciated Turonian to Senonian limestones of the Pindos geotectonic zone [
56]. The almost 540 m long and 290 m wide rotational rock-block slide initially activated before 1945, and reactivated sometime before 1969 [
56]. The debris moved from the spoon-like failure plane, located approximately 700 m Absolute Sea Level, down to the coastline forming the Sergoula alluvial fan (
Figure 10 (14)). According to the InSAR Greece dataset, downwards movements with maximum velocities up to 7 mm/y can be currently identified along the entire failure plain (
Figure 11), proving the accumulation of loose materials susceptible to generating a new failure upon proper triggering, e.g., by prolonged precipitation or earthquake. Subsiding movements can be identified all over the alluvial fan that have been triggered by the natural compaction of the deposited loose landslide debris materials.
A thorough examination of the entire data set revealed that the Malakasa landslide [
56], a major failure that occurred on 18 February 1995 along the A1 national road axis 35 km north of Athens (
Figure 10 (20)), is not showing any activity at the moment. The Malakasa landslide is located at the eastern slope of Parnitha Mountain, composed of Permocarboniferous–Middle Triassic schists, sandstones, and shales with limestone intercalations.
Conversely, the slope bearing the Panagopoula landslide (
Figure 10 (16)) (Achaea Prefecture, Peloponnese), activated several times since 1971 [
57,
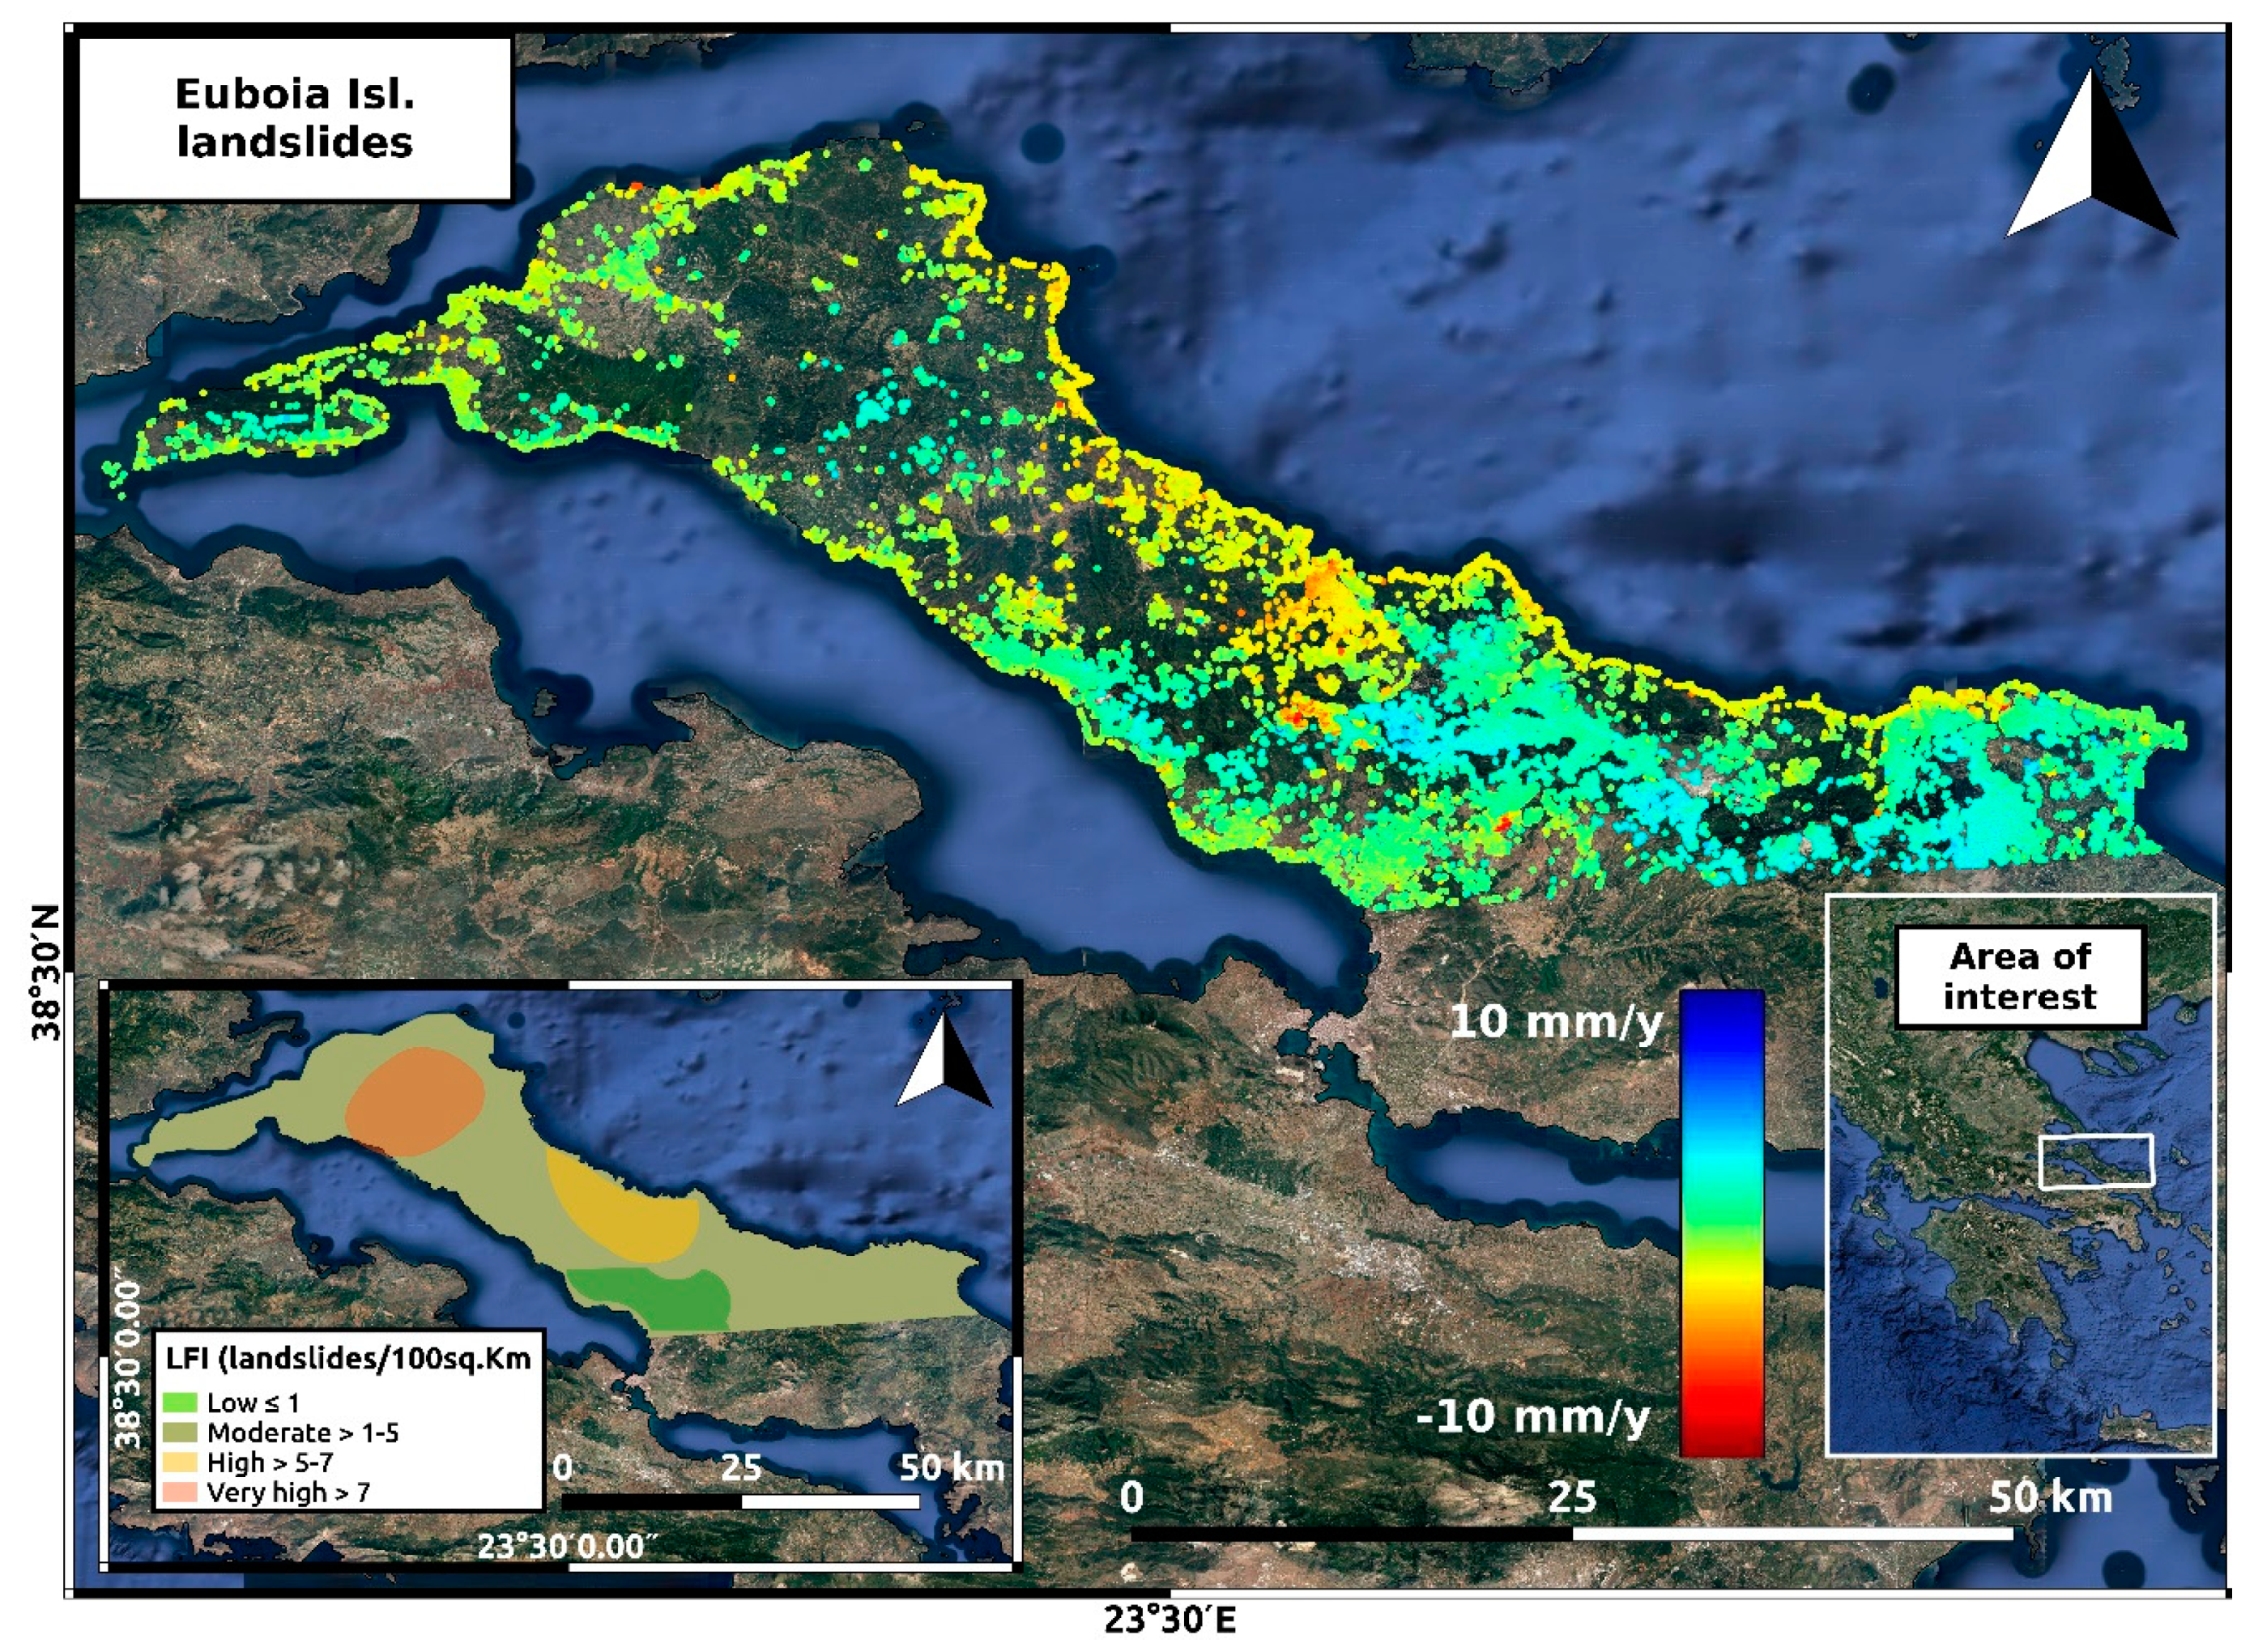
58], is presenting some creep movements. The Panagopoula landslide is a deep-seated landslide along the national road axis A8 with a width of 220 m and a length of 410 m, affecting highly weathered and brecciated formations, mainly limestones, of the Pindos geotectonic zone. Besides the above-described large landslides, numerous failures have been identified in the most landslide-prone areas in the country, such as northern Euboea Island (
Figure 12) and the Pindos geotectonic zone (
Figure 10 (9)). Several landslides have been identified scattered around the entire mainland of the country, which will be analyzed in future studies.
Land subsidence phenomena have affected extended plains areas of the Greek mainland for decades. The main cause was proven to be the overexploitation of the aquifers, but in some sites, natural compaction and oxidation of organic soils have also been identified. According to the InSAR Greece dataset, all the already-studied sites are continuing to deform. For instance, the Sindos–Kalochori region in the west of Thessaloniki [
59,
60,
61,
62,
63,
64] (
Figure 10 (3, 4)), Anthemountas Basin in the east of Thessalonki [
65] (
Figure 10 (5)), Thriasio plain in the west of Athens [
66] (
Figure 10 (19)), and the Eastern Thessaly plain [
67,
68] (
Figure 10 (6)) are some of the sites presenting a persistent deformation pattern identical to that already known.
To cross-evaluate the InSAR Greece project’s findings with ground truth data, the subsiding deformation pattern identified at the Sindos–Kalochori region was compared with ground water level contour maps for the same time period [
64]. Ground truth techniques have been used several times to evaluate the subsiding patterns of this study area identified by the use of ERS 1, ERS 2, and ENVISAT datasets [
61,
62,
63]. The geological, hydrogeological, and geotechnical conditions of the site have been under continuous study and monitoring as the occurrence of the phenomenon has been known since the 1960s [
59,
60]. The dataset provided by the InSAR Greece project indicates that the subsiding deformations of the past, reversed during the late 2000s to early 2010s to uplifting movements, due to the recharge of the aquifers, have reversed again and now a new period of subsidence is occurring in the area. As indicated by the hydrogeological data, this new trend in subsiding deformations can be attributed to the new period of ground water overexploitation that has occurred after the regeneration of the industrial activities following the end of the 2008 financial crisis. Currently, the maximum displacement values in the vicinity of Kalochori are of the order of −10 mm/y, while in the broader area, maximum values reach a rate of −14 mm/y. These new findings triggered the publication of a new detailed follow-up paper presenting the InSAR data as well as their evaluation in detail using ground truth data [
64].
Several sites are presenting substantial changes on the deformation pattern, and several new unknown sites have been identified through the new data sets.
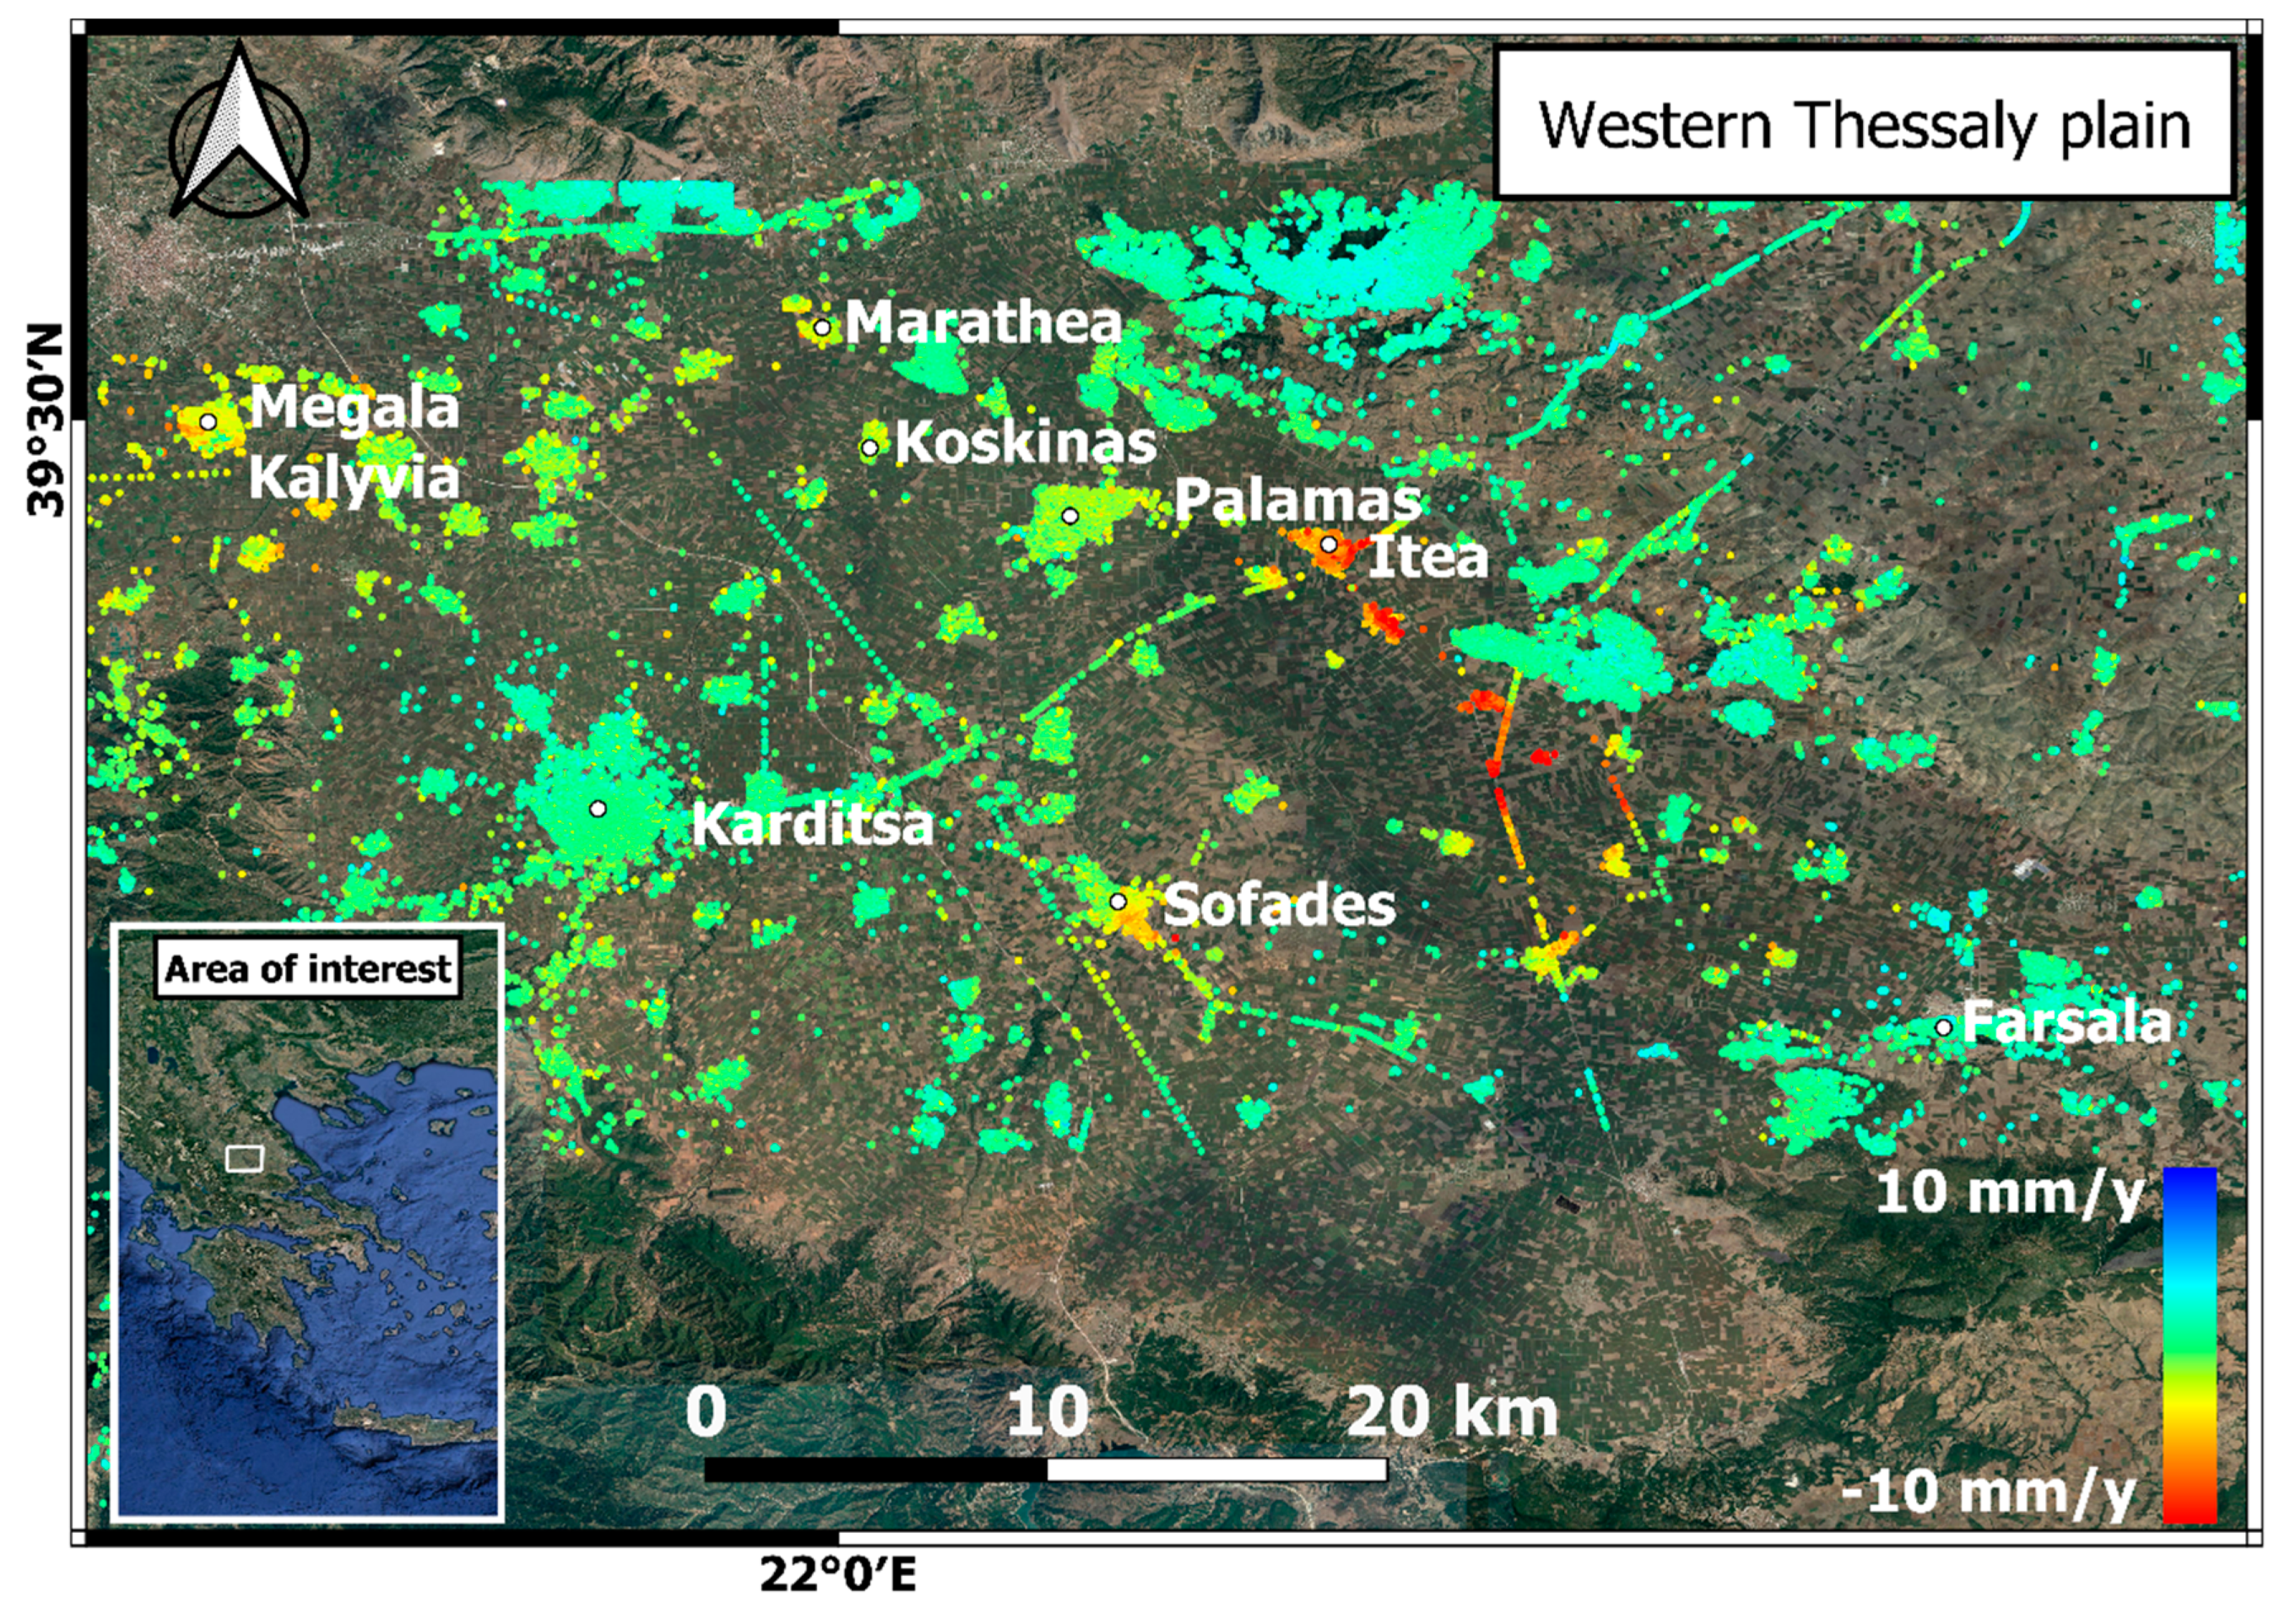
In the Western Thessaly plain (
Figure 10 (7)) (Thessaly region, central Greece), the land subsidence due to the overexploitation of the aquifers, occupying the alluvial deposits of the plain, have been occurring since the early 2000s [
69,
70], initially affecting a small area around the town of Farsala, in the eastern part of the basin (
Figure 13). The first space-borne measurements of the deformations were obtained from a PSI-descending dataset provided by the German Space Agency (DLR). The dataset was acquired between 1995 and 2003 by the ERS1 and ERS2 satellites within the framework of the Global Monitoring for Environment and Security (GMES) service element of the program of the European Space Agency (ESA) [
71]. The InSAR Greece dataset has radically changed the knowledge regarding the spatial distribution of the deformations as, currently, a large part of the plain appears to be subsiding with rates reaching up to 6 mm/y (
Figure 13). Particularly, the plain area extending from the axis connecting Farsala, Sofades, and Megala Kalivia up to the northeast appears to be subsiding, including Palamas, Itea, Marathea, Koskinas, and Pedino villages and several smaller settlements. The provided information indicates that immediate actions should be taken regarding the management of the ground water before the manifestation of intensive nonreversible damage.
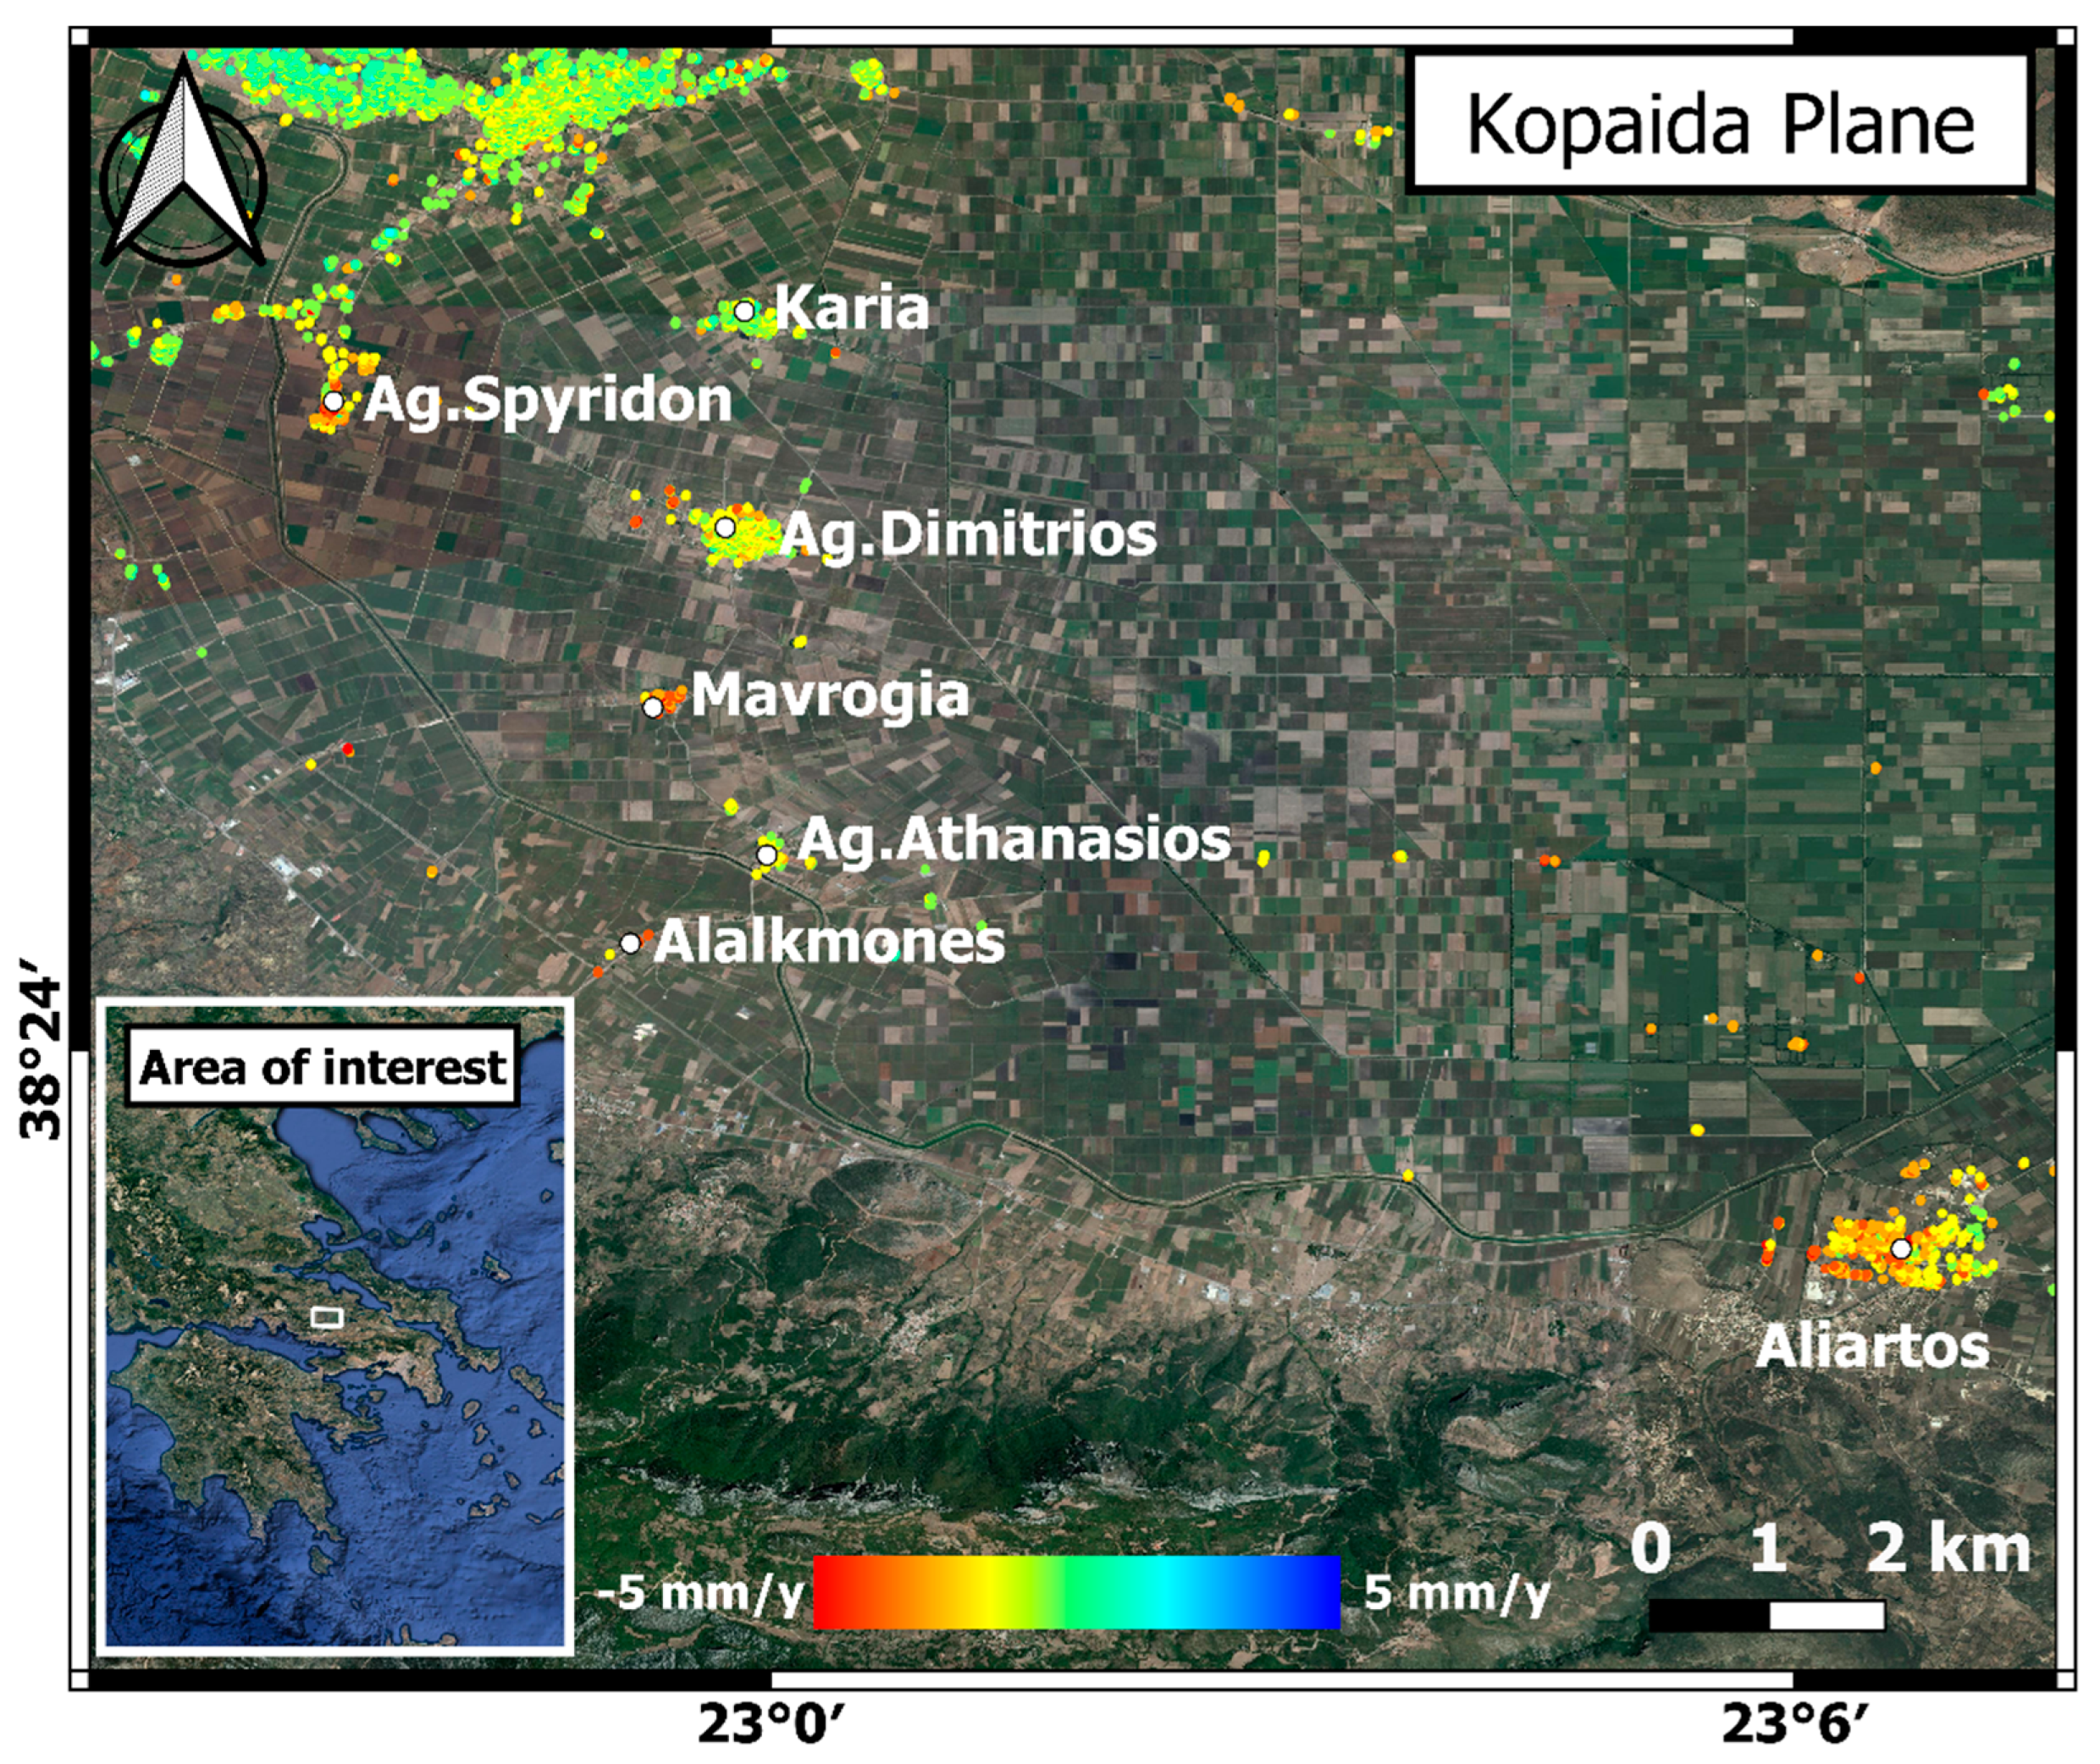
The phenomenon occurring at the Kopaida plain (
Figure 10 (17)), Boeotia prefecture, central Greece, constitutes another high-impact example related to land subsidence, triggered by the oxidation of organic soils this time. The Kopaida plain was covered by a lake. The first attempt in modern history to drain the lake occurred between 1882 and 1886. An extensive draining network with open channels and a tunnel, transferring the water to the nearby Yliki Lake, was constructed at the time. The engineers likely did not consider the existence of a 4 m thick layer of organic soils at the bottom of the lake and the plain self-ignited. The fire burned for years, the ground locally subsided more than 3 m, and the plain flooded again. Finally, fighting the self-ignition, the plain was drained in 1892. Since then, the land use has changed to agricultural and several small settlements have been established. In the literature, there is no reference to land subsidence at the site. The InSAR Greece dataset revealed that numerous settlements along the perimeter of the plain are subsiding at rates up to 4 mm/y (
Figure 14). Aliartos, Alalkomenes, Agios Athanasios, Mavrogia, Agios Dimitrios, Karia, Agios Spiridon, and numerous isolated farm buildings are listed among the subsiding sites on the Kopaida plain.
Besides the above-described large-scale sites, initiating or evolving subsidence phenomena have also been identified at the plain area of the Spercheios basin (
Figure 10 (8)) (Phthiotis prefecture, central Greece), on the Philippi plain (
Figure 10 (2)) (Kavala Region, Eastern Macedonia), in the industrial area of Theves (
Figure 10 (18)) (Boeotia prefecture, central Greece), etc.
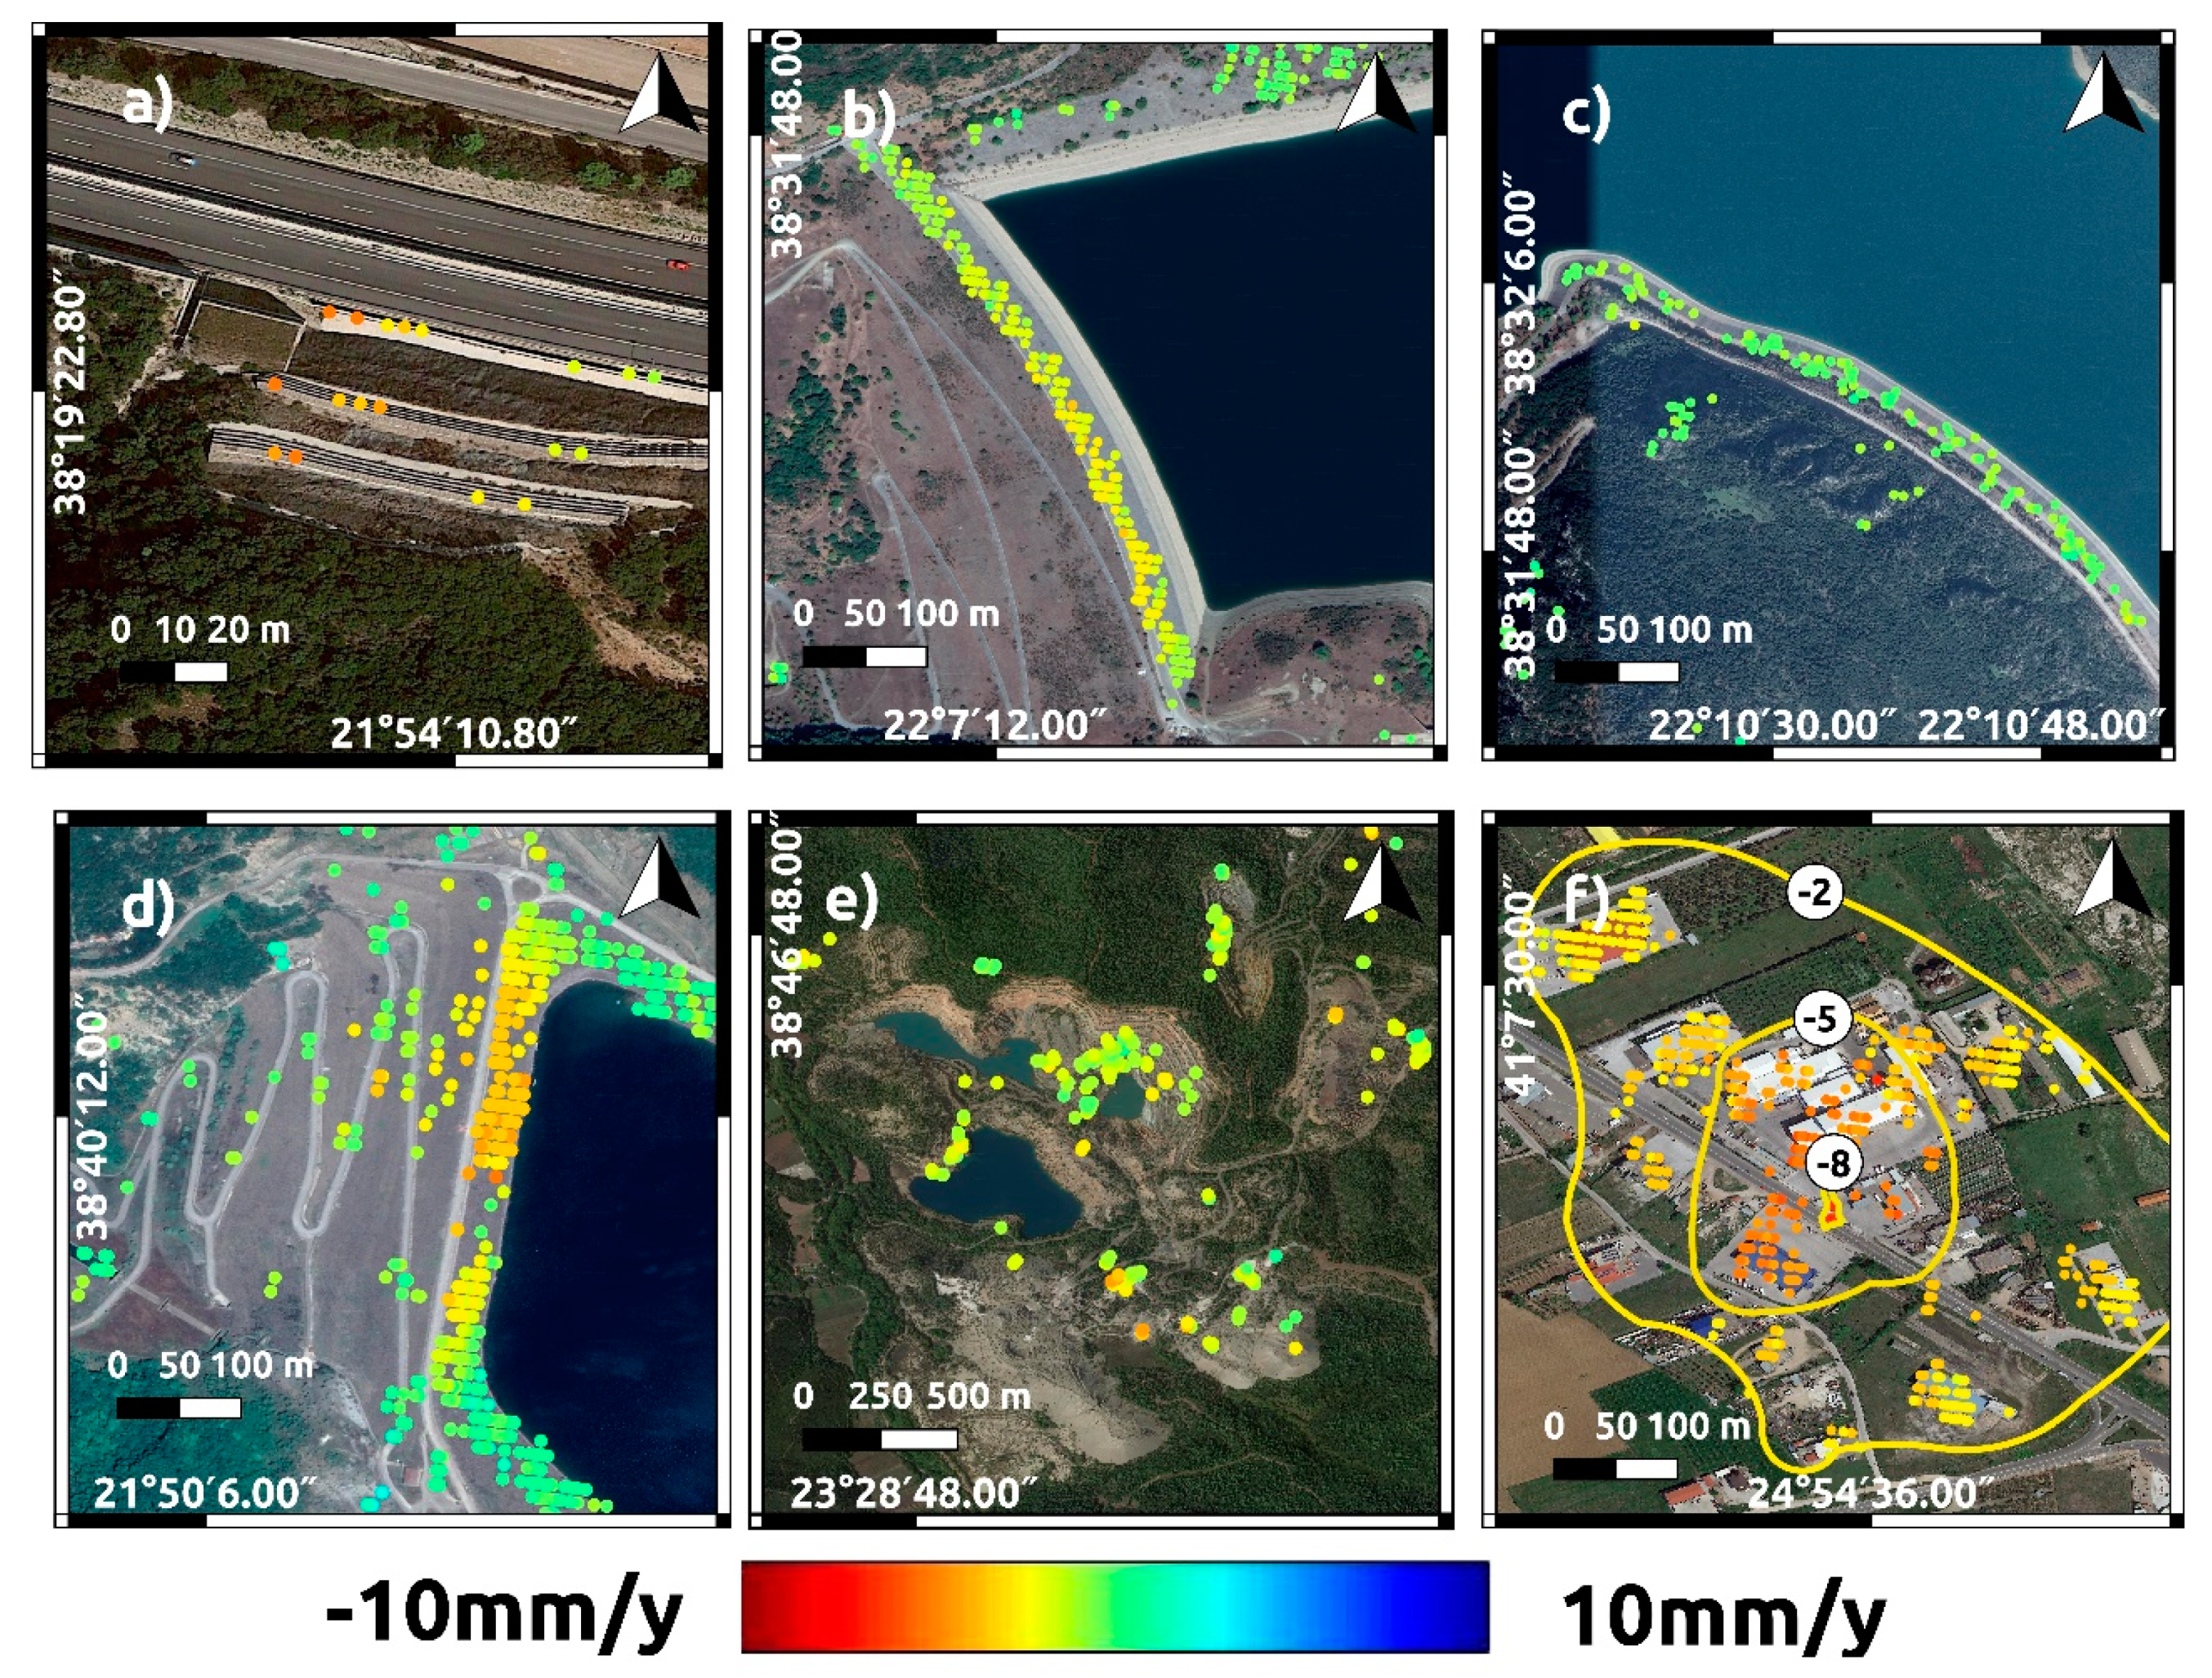
Evaluating the ability of the InSAR Greece dataset to be used to study small-scale site deformation, several deforming or stable humanmade constructions were identified. For instance, the deformations of a retaining system constructed on a large cut along the national road axis A8 (
Figure 10 (15)) can be clearly monitored. The 150 m long retaining construction consists of two gabion walls founded on the benches formed on a steep slope, supported with anchored wire mesh (
Figure 15a). The previously identified deformations [
72] of the Mornos dam’s body can also be seen in the InSAR Greece dataset. As presented in
Figure 15b, the gentle movements of the dam, reaching up to 4.0 mm/y, can be detected along the crest. On the contrary, the excellent stability conditions of the 2.5 km long and 100 m wide sealed bank constructed along the slopes of the Pyrnos Mountain, at the reservoir of the Mornos dam, can be proved by the total absence of deformations (
Figure 15c). Mornos dam belongs to the aqueduct of the city of Athens and the sealed bank was constructed to increase the capacity of the reservoir and avoid leakage of the Pyrnos limestone [
73]. The gentle deformations occurring at the Evinos Earth dam’s body can also be observed with the InSAR Greece dataset (
Figure 10 (10)). The PSs’ distribution indicates that the downward slope of the dam performs rotational movements from the crest down to the middle of the slope, with a maximum velocity up to 5 mm/y (
Figure 15d). Among the numerous mining sites presenting deformations, the abandoned Magnesite mine of Mantoudi (
Figure 10 (21), northern Euboea Island) is a characteristic example of a site with numerous slope stability issues. As presented in
Figure 15e, creep or sliding movements can be identified at the abandoned working slopes as well as at the external depositions’ slopes, with rates up to 4.5 mm/y. Finally, an example of a small-scale deforming site was witnessed at the Xanthi industrial zone (
Figure 10 (1), Western Thrace, northern Greece). As presented in
Figure 15f, a ground water depression cone formed around a water-consuming industry caused escalating displacements in the surrounding industrial buildings with maximum deformation values of 8 mm/y, decreasing in proportion to the distance from the center of the cone.
6. Conclusions and Outlook
This work provides four distinct contributions: First, we have delivered an open-source implementation of an end-to-end persistent scatterer interferometry pipeline based on existing ISCE2 and StaMPS implementations, for which we parallelized the execution of several individual components. Our P-PSI chain achieves a speed-up of the process of up to five times compared to the sequential implementation of the pipeline for a full Sentinel-1 frame. This performance can be further increased if additional processing units are used. P-PSI also comes with an umbrella data access hub to transparently access different and complementary Sentinel-1 SLC data repositories.
We constructed and tested a new algorithm for processing in parallel patches that contain PS candidates. The algorithm balances the total number of PS candidates that are processed in each processing unit, considering the expected PS density as a function of the land use/land cover of the area. This implies that a non-uniform patch grid is formed. The algorithm can be further enhanced by implementing this grid early in the PS selection process. The latest advancements in coregistration methods, like efficient enhanced spectral diversity (EESD) proposed by Ma et al. [
74], are worthy of consideration in the future. The EESD method produces a markedly lower misregistration error than network-based ESD (NESD), while facilitating the additions of new image acquisitions without reprocessing the entire stack. However, the computational performance of the algorithm, which lags behind NESD, introduces a significant challenge for parallelization.
Third, the processing time reduction achieved with P-PSI is critical for monitoring large areas using multiple Sentinel-1 frames. We implemented our P-PSI pipeline to estimate descending pass LOS velocities and individual deformation histories for all of Greece. The end-product, named InSAR Greece, is unique and provides a wealth of information on more than 12 million single points over the country. The InSAR Greece product can be further enriched by executing the entire pipeline (
Figure 1D) for the ascending pass as well, generating LOS velocities in a different look direction. Then, the methodology proposed by Papoutsis et al. [
66] can be adopted to decompose the deformation signals to vertical and east–west components.
Fourth, we provided a glimpse into this wealth of information by discussing critical large- and small-scale deformation regimes in Greece. We identified different natural and anthropogenic drivers that can cause either subsidence or uplift, including overexploitation and recharge of the aquifers, natural compaction, subsidence due to organic soils oxidation, mining-induced deformation, landslides, deformation due to construction works, etc. The understanding, interpretation, and modeling of these deformation drivers can be enhanced by introducing a joint analysis of descending and ascending LOS PS displacements, as described above. This is especially applicable when studying complex phenomena such as landslides.
Finally, we provide two assets to the scientific and user community. The first one is the InSAR Greece product, which can be used as a benchmark for revealing previously unknown deformation patterns and monitoring known critical sites. We expect that this product will spur many new analyses that will attempt to model geodetic data and assess hazards for different types of observed deformation patterns. Secondly, we provide P-PSI as an open-source and live project that can manage a reduction in the total processing time from 15 to approximately three days for a full Sentinel-1 frame. This provides the potential to regularly update LOS velocities in the future to provide monitoring at the national scale, making InSAR Greece a dynamic rather than static product. However, this endeavor will require new storage management approaches and novel interferometric product compression techniques to manage the SAR big data.

 ,
, 


