Article

Ethically Minded Consumer Behavior, Retailers’ Commitment to Sustainable Development, and Store Equity in Hypermarkets

by
Irene Sánchez-González
1,
Irene Gil-Saura
2,* and
María Eugenia Ruiz-Molina
2
1
Facultad de Ciencias Empresariales, Universidad Técnica de Machala, Vía Machala Pasaje, Machala 170517, Ecuador
2
Departamento de Comercialización e Investigación de Mercados, Facultad de Economía, Universitat de València, Avda, Tarongers s/n, 46022 Valencia, Spain
*
Author to whom correspondence should be addressed.
Sustainability 2020, 12(19), 8041; https://doi.org/10.3390/su12198041
Submission received: 2 September 2020 / Revised: 22 September 2020 / Accepted: 27 September 2020 / Published: 29 September 2020
(This article belongs to the Special Issue Services Marketing and Sustainability)

Abstract

:
The present paper analyzed the influence of ethically minded consumer behavior on retailer’s commitment to sustainable development as perceived by the consumer, and their contribution to the chain of relationships “store equity–loyalty–word of mouth communication”, in the context of retailing. Responses from 317 hypermarket customers in Ecuador were analyzed. The model was estimated using the partial least squares technique. The results show the sustainable development actions implemented by retailers, together with perceived value, contribute significantly to store equity creation, which explains customer loyalty and, ultimately, positive word-of-mouth communication. However, the most concerned consumers of ethical aspects value the retailer’s efforts towards sustainability to a lesser extent. The findings of this research allow developing a series of implications for the managers of these establishments.

1. Introduction

In the last decade, public concern for the environment has emerged as a problem of global importance [1,2]. This has led to great changes in consumer attitudes and behaviors, leading them towards patterns of ethical and sustainable consumption [3]. In response to these changes, organizations should examine their strategies with respect to sustainable development [4], as well as their trade policies [5], and companies in the commercial distribution sector are no exception. Specifically, regarding the hypermarket retail format, sustainable development is considered an important issue for both academia and the business sector [6].
In this context, various hypermarket chains have been carrying out actions to contribute to social and environmental sustainability through their activities [7], creating spaces for the development of sustainable management by retailers and ethical consumption. Therefore, investigating this commercial format is of interest in order to contribute to increasing knowledge regarding sustainability [8,9]. This present work focused on analyzing ethically minded consumer behaviour (hereinafter, EMCB), following the call for future research in this area by Sudbury-Riley and Kohlbacher [10].
EMCB implies the consideration of environmental principles and social causes in the purchase decision, beyond the mere satisfaction of needs [11], therefore tangible proof of the social, environmental, and economic commitment of retailers is expected [12]. In this sense, it is important to analyze the scope of the retailers’ commitment to sustainable development as perceived by consumers (hereinafter, RCSD), following the call for future research by Lavorata [12], regarding its impact on consumer behavior in terms of loyalty and word-of-mouth communication.
Despite the relevance of EMCB and RCSD, there are few studies that have analyzed these constructs so far [1,2,9,10,12,13], which presented the ideal research opportunity.
Likewise, in the retail sector, issues of fundamental interest emerge when explaining loyalty towards the hypermarket. On the one hand, the study of store equity [14], and on the other, perceived value [15]. However, there is little research aimed at relating these constructs to sustainability [16], therefore this perspective was considered a valid response to the calls for research put forward by various authors [10,12]. The scarcity of studies in this field is even more evident in the case of Latin America. In Ecuador, innovations in retail business formats began in the 1950s, with the creation of commercial retail establishments, such as supermarkets and hypermarkets [17]. Their development has been continuous throughout recent decades, making gains in terms of meters of surface area, coverage, and market share compared to the more traditional formats such as markets and small local shops.
In this direction, this work had a double objective. Firstly, to study the relationship between EMCB and consumer perception of hypermarkets’ commitment to sustainable development. Secondly, to analyze, through a relationship model, the influence of EMCB on the retailer’s engagement in sustainable development and its impact, along with the perceived value, on the chain of effects “store equity–loyalty-word–of-mouth communication”. The results obtained offer relevant implications for managers of retail establishments when it comes to focusing their efforts on those aspects that help them achieve competitive advantages and maintain lasting connections with customers that generate long-term successful relationships.

2. Theoretical Framework

2.1. Ethically Minded Consumer Behaviour

The concept of ethical behavior emerged as a topic of interest in the 1980s [18,19,20], where ethics is analyzed from the point of view of the consumer rather than adopting a corporate perspective [21]. Ethically minded consumer behavior (EMCB) considers codes, moral principles, standards [22], and values that guide right or wrong behavior [23].
Ethical consumption in the retail sector is defined as “conscientious consumption that takes into account health, society, and natural environment, based on personal and moral beliefs” [24]. Thus, ethical purchasing in hypermarkets incorporates the consideration of environmental and human welfare, fair trade, and ethical products [10], that is, it is founded on a particular ethical, social, or environmental problem [25]. In this sense, ethical products are in demand in many countries [26], and companies have detected the need to adopt principles in line with sustainable development [10] and reflect them in their products, packaging, and various communication channels.
In the decision-making process, ethically minded consumers feel responsibility towards humanity [27] and express these feelings through their behavior, specifically through their purchase decisions [10], taking an active role in creating a pathway to sustainable development [28]. Several studies have shown that consumers form a strong attachment to retailers that they consider to act in line with the retailers’ commitment to sustainable development as perceived by consumers [29,30] and, more specifically, consumers aware of ethical issues prefer to shop at hypermarkets that are committed to social or environmental actions [31], which they perceive to contribute to sustainability [11].
However, in a study in the United Kingdom, Szmigin et al. [13] concluded that consumers, when dealing with real-life situations, do not behave ethically, and their actions greatly depend on the personal values and circumstances of each consumer. Sometimes EMCB involves conflict in balancing personal interests, such as low price and high quality, and social values, such as fairness and the common good [1], environmental issues and recycling [32], and the willingness to pay more for an ethical product [10]. In particular, Jin-Myong et al. [1] identified, in their research in South Korea, four types of consumers: the consumer that is aware of ethical considerations, the ethical consumer, the potentially ethical consumer, and the unethical consumer.
However, there is little research from the perspective of marketing in the retail sector [10] and there are limited studies that allow for the measurement and conceptualization of EMCB [10].

2.2. Retailers’ Commitment to Sustainable Development as Perceived by Consumers

Sustainability emerged as a topic of interest, both for academia and for the corporate world, in the 1980s [33], being defined as “meeting the needs and aspirations of the present generation without compromising the ability of future generations to meet their needs” [34].
In retail literature, definitions of sustainability are varied, with most of them revolving around the idea of preserving the environment for future generations [35]. In the context of hypermarkets, EMCB refers to the purchase of products that reduce environmental damage [36,37]. However, various studies have revealed that whilst consumers are aware of the importance of sustainability and are willing to switch to sustainable products when asked, the actual purchase rate is low [13,29]. In the same way, there are retailers that pursue a “weak” sustainability model, instead of a “strong” one [38].
Furthermore, other studies have suggested that hypermarkets show a progressive concern for EMCB and RCSD [39], adding sustainable actions to their usual practices [40]. In this way, we are beginning to observe efforts such as: contributions to an improvement in the quality of life of employees, suppliers and consumers [41], introduction of recycled products [11], introduction of fair trade and organic products [42], guarantee of decent employment [12], renewal of technologies to positively impact society [43], setting discount prices and promotions to collaborate with social and environmental causes [44], and communication of the image and actions of sustainable business [5,45], amongst others.
Several studies concluded that hypermarkets that adopt sustainable practices improve their competitiveness [12,46], and as a result, enjoy a better corporate image and market position [6], as conscientious consumers establish a loyal relationship with retailers that they consider to be ethical [28,30,47,48].
Along these same lines, several works concluded that the more aware the consumer is, the greater the value of the retailer’s contributions to sustainability in economic, social, and environmental contexts [28]. The retailer is perceived as an ethical and responsible company [2,29], which can contribute to loyalty and repeat purchases from the retailer. Based on these contributions, the first hypothesis was proposed:
Hypothesis 1 (H1).
Ethically minded consumer behavior has a positive and significant effect on Retailers’ Commitment to Sustainable Development as perceived by consumers.

2.3. Store Equity and Its Antecedents

Brand equity is defined as a set of assets and liabilities, linked to a brand, its name, or its symbols, that add to or subtract value from a firm and its customers [49], or, more concisely, a measure of the value or utility related to a brand [50]. It is one of the most studied constructs in the field of marketing [51]. However, its application in the context of retail trade—i.e., store equity—is relatively new [14,52,53].
Numerous studies have recognized brand equity as a relational, market-based asset that is generated through long-lasting interactions and long-term relationships between companies and customers, e.g., [54], becoming one of a company’s most valuable intangible assets [55].
A company builds its brand equity, whilst consumers evaluate it based on what they perceive through communication actions and product characteristics [56]. In this way, brand equity has been related to perceived value in the retail sector [55], and is one of the constructs that has aroused the most interest in retailing [57]. Defined as “the consumer’s overall assessment of the utility of a product based on perceptions of what is received and what is given” [58], value refers to the utility perceived by the consumer based on the costs and the benefit obtained from the quality and expected performance of the retail establishment [14,59].
In the retail sector, perceived value has been qualified as key to the success of organizations [60]. In research in the field of consumer behavior, perceived value is a widely studied variable, having been related to various constructs, such as loyalty and brand equity. According to Sweeney and Soutar [61], perceived value integrates aspects related to quality, value for money, emotional value, and social value, which include utilitarian and hedonic values, proving to be useful, parsimonious, and suitable for study in the retail sector [59]. The quality value dimension refers to the practical benefits that consumers can obtain with the use of the product. Value for money describes how a successful product compares to the cost, time, or effort spent in obtaining the product. The emotional value represents the benefit that consumers discern, which derives from the feelings that a product generates. Finally, social value refers to the collective utility that the consumption of the product transmits [62].
The consumer expects ethical actions, price, and quality based on the perceived value [63]. In this way, in the research applied to the hypermarket format, it was concluded that perceived value is an important factor to differentiate the consumer in regard to the perception that the latter has about the retailer’s brand equity [64]. Studies have also indicated that perceived value plays a relevant role in the creation and improvement of store equity [15,55]. Based on these contributions in the literature, the second hypothesis was proposed:
Hypothesis 2 (H2).
Perceived value has a positive and significant effect on store equity.
In the retail context, several studies have concluded that the consumer positively relates to companies that they consider ethical [2], so hypermarkets should strive to take sustainable actions [51]. RCSD and store equity are constructs that are related in the context of the hypermarket commercial format, in the sense that sustainability initiatives have a positive impact on store equity [65]. Likewise, evidence has been found that identifies RCSD as a determinant of store equity [48,63,66,67]. Retailers face increasing pressure to integrate ethical values into their operations, communicate their commitment to sustainability, and have these values perceived by consumers. Various studies indicate that sustainable and ethical actions perceived by the consumer have a direct and positive impact on brand equity, e.g., [51]. In regard to all of the above, the third hypothesis was stated:
Hypothesis 3 (H3).
The retailers’ commitment to sustainable development as perceived by consumers has a positive and significant effect on store equity.

2.4. Loyalty

Loyalty is defined as “a deeply held commitment to rebuy or repatronize a preferred product/service consistently in the future, thereby causing repetitive same-brand or same brand-set purchasing, despite situational influences and marketing efforts having the potential to cause switching behaviour” [68].
In the retail literature, loyalty is a construct that includes two perspectives: (a) behavioral, emphasizing past experience; and (b) attitudinal, which is based on future actions, considering both purchasing attitudes and behavior, repeat purchases [59,69], and recommendations by the retailer [70]. Loyalty is the consumer’s strong commitment to repurchase a product from a store, despite any contextual influence or marketing efforts of the competition [71]; consequently, the positive sentiment that the consumer holds towards a particular brand is likely to impede the search for alternatives and subsequently favor customer loyalty to the brand [72]. In this sense, several studies have linked brand equity with loyalty in the retail sector, concluding that store equity contributes to generating consumer loyalty to the brand [73,74,75]. Likewise, there has been a discussion in the literature as to whether loyalty is a dimension or consequence of store equity [15,53]. To this regard, Gil-Saura et al. [15] concluded that loyalty works best as a dimension of store equity. Based on these findings, the fourth hypothesis was proposed:
Hypothesis 4 (H4).
Store equity has a significant and positive effect on loyalty.

2.5. Word-of-Mouth (WOM)

When customers are loyal to a brand, they are likely to convey their positive feelings towards that brand to other people [72]. The word-of-mouth communication construct encompasses informal conversations about the brand, the organization, and/or its products or services [76]. The loyalty and word-of-mouth communication constructs have been extensively related in marketing research, specifically in the retail sector. Due to the importance of the quality of relationships between customers and companies in retailing, several authors have found that customer loyalty positively influences word-of-mouth communication [77].
Along the same lines, several authors concluded that loyalty is a significant antecedent of word-of-mouth communication [78,79,80], highlighting the willingness of consumers to share information as an outcome of their loyalty intentions and behavior.
In line with these findings, the fifth hypothesis was put forward:
Hypothesis 5 (H5).
Loyalty has a significant and positive effect on word-of-mouth communication.

3. Methodology

To corroborate the proposed hypotheses, quantitative research is proposed. The information was collected with the administration of an ad hoc, structured, closed-ended questionnaire. Using the questionnaire, information was collected on EMCB, RCSD, perceived value, store equity, consumer loyalty towards the store, and word-of-mouth recommendations. To measure EMCB, the scale proposed by Sudbury-Riley and Kohlbacher [10], was considered. To measure RCSD, the scale from the work of Lavorata [12] was adapted. To measure perceived value, the Sweeney and Soutar [61] scale was taken as a reference. Store equity was measured using the Shen scale [52], loyalty was measured with the scale proposed for the retail sector in the research carried out by Arnett et al. [81], and the items for the scale to measure word-of-mouth communication were adapted from Chaudhuri and Ligas [82] and Zeithaml et al. [83]. In all cases, the items (see Appendix A) were measured with five-point Likert-type scales, ranging from 1 (strongly disagree) to 5 (strongly agreeing). We have used 5-point Likert scales based on the evidence provided by empirical research, in the sense that these scales require the shortest reaction time, compared to 7-point scales, and when considering the data showing potential acquiescence bias and extreme response bias, five is the optimal number of anchors [84]. Additionally, in order to characterize the sample obtained, a series of classification questions was included.
The fieldwork was set in Ecuador, a middle-income country in South America where, in spite of some pro-environmental measures implemented by the government in the last decades and the active role of civil society in strengthening local healthy and sustainable food systems [85], the need to raise awareness about environmental issues among the population has been highlighted, e.g., [86]. The questionnaire was administered following a probability sampling method, surveying one out of every five customers over 18 years of age in hypermarkets located in commercial areas in the main cities of Ecuador in terms of population according to the Ecuadorian Institute of Statistics [87], i.e., Quito, Guayaquil, Cuenca, and Machala, with more than 2,800,000 inhabitants older than 18 altogether, from March to August 2017. The questionnaire included a control question to guarantee that the respondent personally buys from that hypermarket. As a result, 317 valid questionnaires were collected (sampling error: +/−5.5% for a confidence level of 95%). Table 1 shows the distribution of the sample based on the sociodemographic variables and their purchasing behavior patterns.
From the collected data, for the analysis of the results obtained, we proceeded in different phases. In the first phase, an exploratory factor analysis was performed using the SPSS software, with the objective of studying the dimensionality of the different constructs analyzed. Next, a confirmatory factor analysis was carried out and the psychometric properties of the measurement model were confirmed, and then the proposed model was estimated using the partial least squares (PLS) method with the SmartPLS software.

4. Analysis of Results

First, an exploratory factor analysis was performed to identify the dimensions of the different constructs analyzed. In this way, it was verified that the items to measure the EMCB construct were grouped into a single factor (KMO: 0.893; determinant: 2.56 × 10−011; Bartlett’s test of sphericity sign. level: 0.000), which explained 89.5% of the variability of this construct.
By replicating the exploratory analysis on the scale used to measure RCSD, nine items were retained, which were grouped into three factors which have been named economic RCSD, social RCSD, and environmental RCSD, which together explained 89.0% of the variability of the phenomenon, providing a satisfactory fit (KMO: 0.874; determinant: 5.19 × 10−009; Bartlett’s test of sphericity sign. level: 0.000).
The exploratory analysis was repeated on the scale used to measure perceived value, retaining eleven items, from which two factors emerged that have been named perceived value—quality, and perceived value—social, both together explaining 88.3% of the phenomenon, providing a satisfactory fit (KMO: 0.888; determinant: 1.60 × 10−009; Bartlett’s test of sphericity sign. level: 0.000).
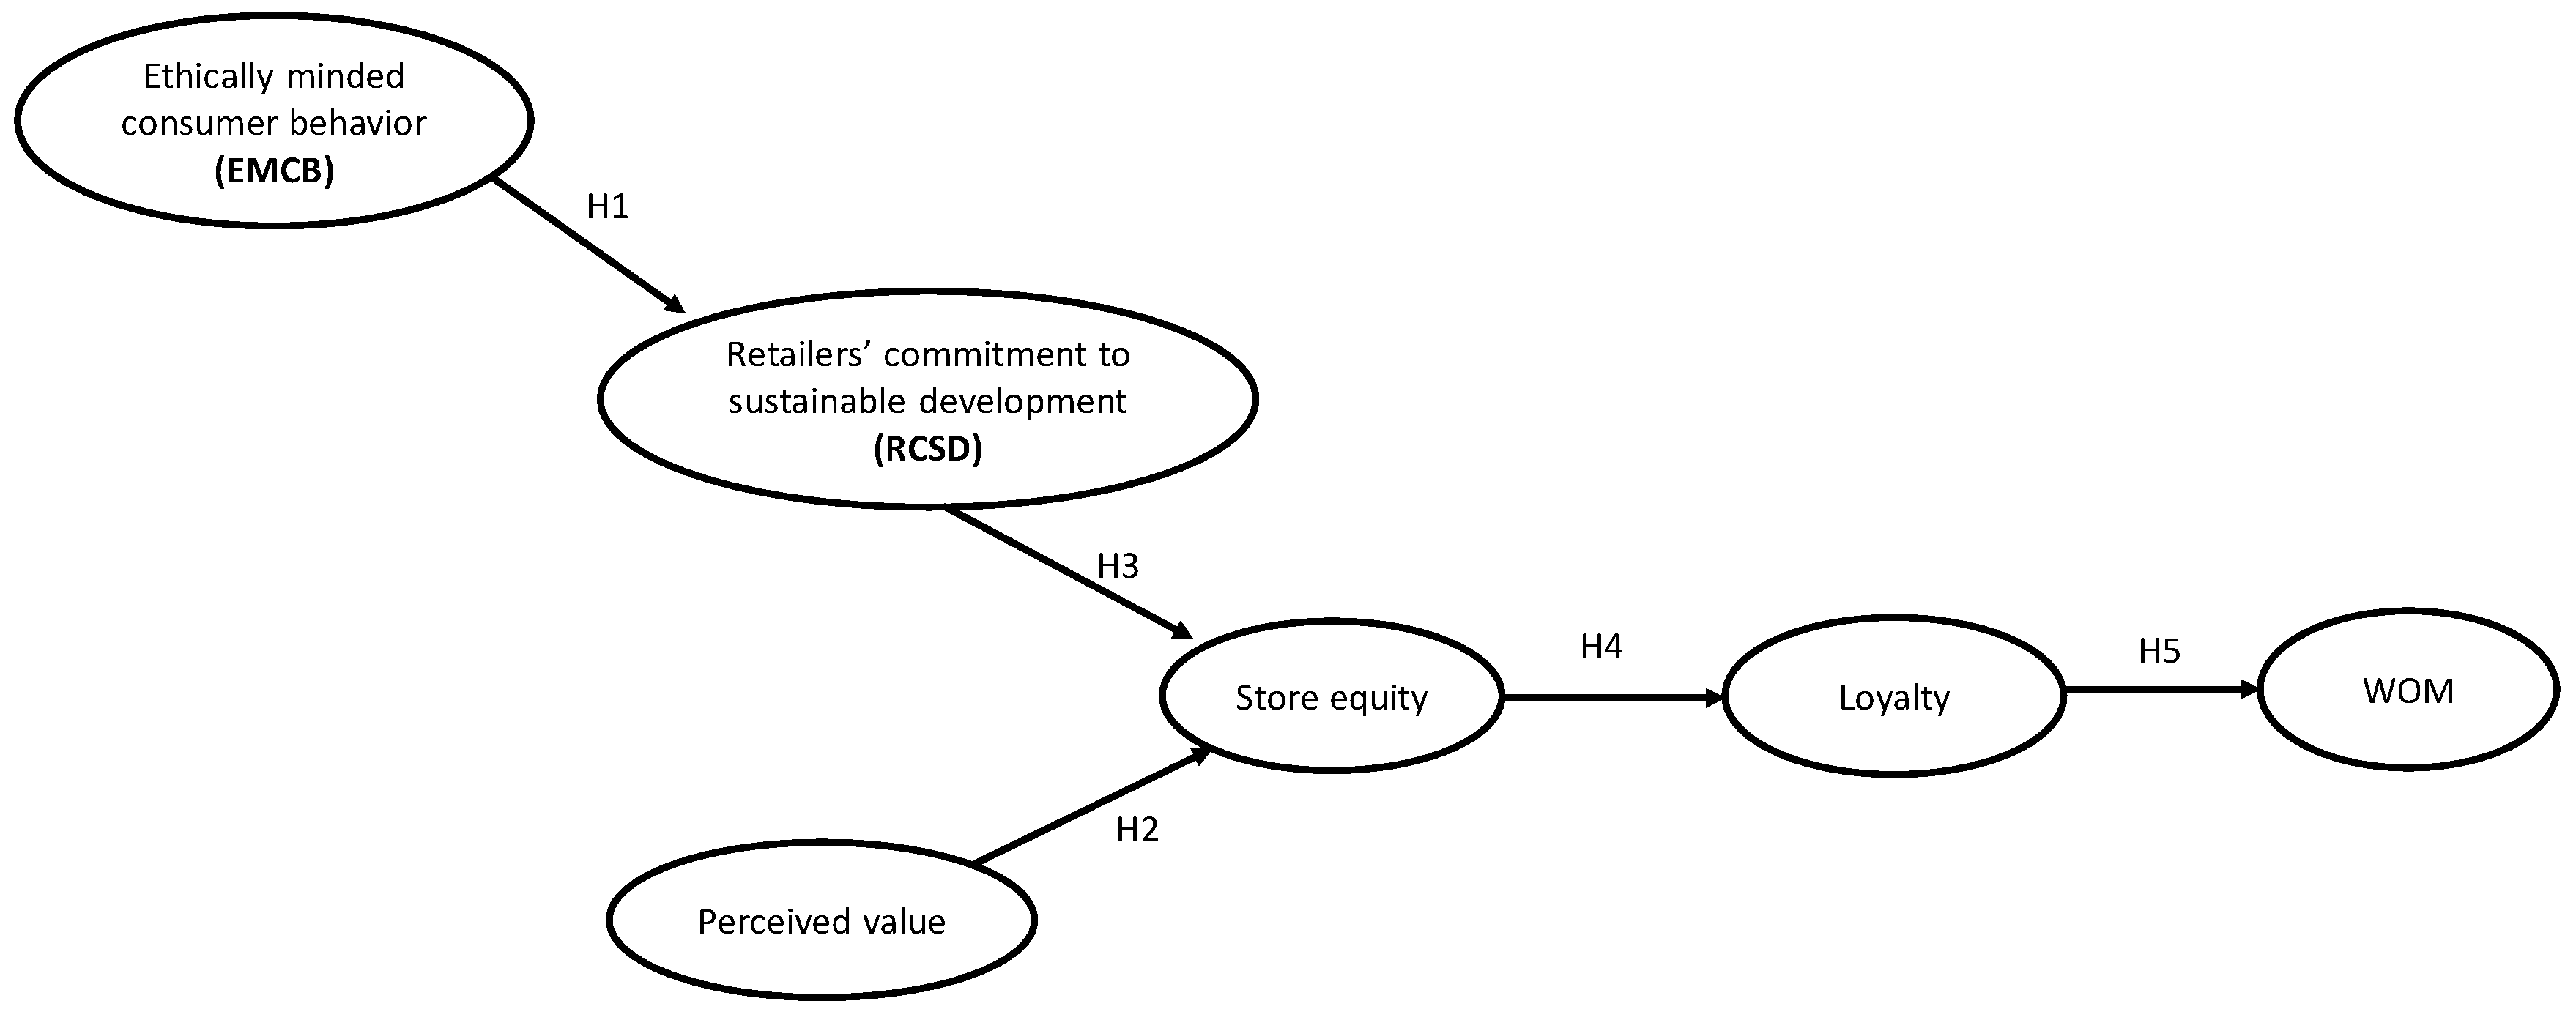
Finally, exploratory factor analyses were carried out for store equity, loyalty, and word-of-mouth communication, observing that the items for these constructs were grouped into a single factor, which explained 76.8% (KMO: 0.788; determinant: 0.000; Bartlett’s test of sphericity sign. level: 0.000), 89.4% (KMO: 0.846; determinant: 0.006; Bartlett’s test of sphericity sign. level: 0.000), and 87.0% (KMO: 0.500; determinant: 0.453; Bartlett’s test of sphericity sign. level: 0.000), respectively. Therefore, once the multidimensionality of the RCSD and perceived value constructs, on the one hand, and the unidimensionality of the EMCB, store equity, loyalty, and word-of-mouth communication constructs were confirmed, the final model, depicted in Figure 1, included two second-order formative constructs, i.e., RCSD and perceived value, which were configured from 3 and 2 first-order reflective constructs, respectively.

Measurement Instrument Validation Process

Firstly, in order to contrast the proposed model, the psychometric properties of the measurement model were verified using confirmatory factor analysis to subsequently estimate the structural model, using the partial least squares (PLS) regression method [88], which permits the incorporation of both formative and reflective constructs into the model to be estimated [89].
Items 8, 9, and 11 of RCSD and items 2 and 3 of PV were eliminated as the individual loads were less than 0.60 [90]. From the results of the confirmatory factor analysis (see Table 2), the reliability of all the scales could be confirmed, since both the values for composite reliability (CR) and for Cronbach’s alpha coefficient (CA) were higher than 0.8 [91] for all first order constructs. The standardized root mean square residual (SRMR) was 0.059; in CB-SEM, a value for SRMR below 0.08 shows a good adjustment, but no reference thresholds for goodness-of-fit measures have been provided for PLS-SEM [92,93].
To assess the convergent validity, it was verified that the standardized loadings were higher than 0.7 and statistically significant for all the items, and it was found that all the values for the average variance extracted (AVE) exceeded the critical level of 0.5 [94]. All this allowed us to confirm the reliability of the scales and the convergent validity of the proposed constructs (see Table 2).
To analyze the discriminant validity in the measurement instrument, firstly, it was found that the estimated correlations between two factors were less than the square root of the average variance extracted of each factor [94]. Secondly, all the HTMT ratios showed values below 0.90 [95], and when comparing the factor loadings across the columns, the item loadings for their own construct were in all cases greater than their cross-loadings with other constructs. Therefore, from Table 3 it can be seen that this condition was met in all cases.
Regarding the second-order formative constructs, it was evident that the first-order reflective constructs make a statistically significantly contribution to their corresponding second-order formative constructs (see Table 4). Moreover, the values of the variance inflation factors (VIF) were less than 5 for all the first-order factors, which allowed us to rule out potential collinearity problems [96].
Next, the structural equation model was estimated using the partial least squares (PLS) regression method (Table 5), and the explanatory power of the structural model was verified through the coefficient of determination (Table 6). As can be seen in Table 6, the R2 values exceeded the reference value of 0.5 rated as moderate, with the exception of word-of-mouth communication with a 0.39, which is considered weak [97]. The Q2 were greater than 0, therefore, the model presented an adequate explanatory and predictive value and allowed us to assess the significance of the previously hypothesized causal relationships. SRMR of the estimated model was 0.103.
The results of the study allowed us to support the assertion that RCSD has a positive and significant effect on store equity, hypothesis H3, as indicated by previous works, e.g., [2,48,51]. Similarly, the perceived value positively influenced the generation of store equity, in line with other studies [15,67,78], corroborating hypothesis H2. In turn, store equity had a positive and significant effect on loyalty, in support to hypothesis H4, along the lines of works such as that of Frasquet et al. [73] and Su and Chang [74]. In correlation with the results, loyalty had a positive and significant effect on word-of-mouth communication and, therefore, hypothesis H5 was accepted, corroborating the findings of Harris and Khatami [79] and Markovic et al. [72].
The estimation of the model, however, did not support the existence of a relationship between EMCB and RCSD in the case of hypermarkets, so there was no support for the H1 hypothesis. Furthermore, EMCB negatively influenced RCSD, which can be explained by the fact that it is the most ethical consumers who are most critical of the actions of retailers in the field of sustainability, in the sense that the actions taken by retailers are interpreted as “greenwashing” tactics and not as actions really aimed at sustainability. “Greenwashing” is the process of conveying a false impression or providing misleading information about how a company’s products are more environmentally sound [98]

5. Conclusions, Limitations, and Future Research Lines

This work has addressed the study of ethical consumer behavior and its relationship with RCSD, as well as the analysis of its contribution to the creation of store equity and its consequences in the context of hypermarkets. The results obtained show the positive and significant effect of RCSD and perceived value on store equity, consistent with the evidence obtained from previous studies in other geographical contexts [15,55,67,78]. Specifically, there was a positive relationship between the environmental, social, and economic RCSD in its triple bottom line, and the retailer’s brand equity, in a manner consistent with the evidence obtained from previous studies [2,51].
Similarly, examining the positive and significant effects of store equity on consumer loyalty, it was observed that when customers perceived the sustainability actions of the hypermarket, the more highly they rated the store equity and attributed this perceived value, which creates a long-term relationship with the retailer, translating into preference and loyalty, in line with the existing literature [15,72,74]. This in turn positively influences the generation of positive word-of-mouth communication [72].
On the other hand, a negative relationship was observed between EMCB and RCSD. This result could be explained by the differences between the cultures of retail consumers in the countries where this research has been carried out and those of Ecuador, where the issue of ethical consumption is only just beginning to emerge, e.g., [86], and the most conscientious consumers may be skeptical in regard to the retailer’s commitment to sustainability, believing these actions to be little more than mere advertising claims. This evidence contrasts with the results of studies that, in other geographical contexts, have highlighted the importance of proving sustainability actions to customers due to the fact that this creates an emotional connection between the customer and the retailer, which translates into purchase, repeat purchase, and recommendation [70], positively influencing consumer perception [99].
All in all, the results reveal that, although there are ethical consumers, and hypermarkets communicate their sustainability activities to all of their target markets, the concepts of ethical consumption and sustainability may not be sufficiently established amongst consumers in Ecuador. In fact, these are issues that are only just starting to gain awareness amongst Ecuadorian consumers today. Despite this, it is evident that consumers are aware that, with their purchase they can promote the wellbeing of the environment and society and reward the sustainability actions that the hypermarket executes and communicates, given that their perceptions of these actions influence their beliefs in regard to perceived value, store equity, and loyalty, which leads the consumer to communicate their positive experiences to others. With this, to the extent that the retailer influences the consumer with the development of sustainability actions, integrating them into their culture as a commitment and a responsibility, they will be rewarded with better perceptions of store equity and positive results in terms of customer loyalty and word-of-mouth communication. Therefore, it is considered that this work contributes to the existing literature by providing evidence regarding the usefulness of implementing RCSD actions in hypermarkets and their effect on consumers with an ethical mentality.
In the managerial and academic fields, these results hold a range of implications for management. Given the increasing competition, it is necessary for managers to understand how actions that benefit society, the environment, and their workers and suppliers influence consumer perception. In this way, a combination of marketing strategies, sustainable development management, and superior value delivery will lead to better positioning through increased store equity that allows them to differentiate themselves from the competition. Efforts should be made to demonstrate that the retailer’s commitment to sustainable development is real, through the retailer’s various communication channels with consumers. Additionally, it is necessary to take care of both the functional and emotional aspects that can contribute to strengthening the perceived value of the consumer and store equity to achieve greater consumer loyalty towards the hypermarket, leading to positive word-of-mouth communication.
To conclude, we can highlight some limitations that can also be considered as possible future lines of research. On the one hand, the restricted geographical scope of application of the study (i.e., four of the most populated cities in Ecuador) raises concerns about the sample representativeness, so that it is necessary to expand its scope in order to compare results with the perceptions of consumers from other countries. In addition, a larger sample could allow the results to be further refined through multi-sample analysis to verify the moderating effect of different variables, such as gender or age of the consumer, on the relationship between EMCB and RCSD.
On the other hand, the study could be applied to other retail formats that have already incorporated sustainable development strategies into their management. Consumer perceptions of the retailer’s commitment to sustainable development are assumed to be holistic, based on the actions of the retailer. In our study, we focused on hypermarkets, which sell basically food, but also include other nonfood products in their assortment. Thus, given the peculiarities of the agri-food market, further research is required to analyze differences in consumer perceptions of the retailer’s commitment to sustainable development across different types of products and retailers.
Finally, it is worth highlighting the opportunity to advance this line of research with the in-depth analysis of the mediated relationships between the constructs included in the proposed model as well as the introduction of new relevant variables, such as image, satisfaction, perceived quality, and information and communication technologies (ICT), amongst others.

Author Contributions

Conceptualization, I.S.-G. and I.G.-S.; Methodology, I.S.-G., M.E.R.-M., and I.G.-S.; Validation, I.S.-G., M.E.R.-M., and I.G.-S.; Formal Analysis, I.S.-G., M.E.R.-M., and I.G.-S.; Investigation, I.S.-G., M.E.R.-M., and I.G.-S.; Data Curation, I.S.-G.; Writing—Original Draft Preparation, I.S.-G., M.E.R.-M., and I.G.-S.; Writing—Review and Editing, I.S.-G., M.E.R.-M., and I.G.-S.; Visualization, I.S.-G., M.E.R.-M., and I.G.-S.; Supervision, M.E.R.-M., and I.G.-S.; Project Administration, I.G.-S. All authors have read and agreed to the published version of the manuscript.

Funding

This research received no external funding.

Acknowledgments

This paper was developed within the Research Project ECO2016-76553-R of the Spanish Ministry of Economy, Industry and Competitiveness, National Research Agency, and GRP-081 COMARK of Universidad Técnica de Machala.

Conflicts of Interest

The authors declared no potential conflicts of interest with respect to the research, authorship, and/or publication of this article.

Appendix A

Table A1. Measurement scales.
ItemsNMeansStandard Deviation
EMCB 1When there is a choice, I always choose the product that contributes to the least amount of environmental damage.3174.000.870
EMCB 2I have switched products for environmental reasons.3173.970.880
EMCB 3If I understand the potential damage to the environment that some products can cause, I do not purchase those products. 3173.980.873
EMCB 4I do not buy household products that harm the environment. 3173.930.974
EMCB 5Whenever possible, I buy products packaged in reusable or recyclable containers.3173.950.968
EMCB 6I make every effort to buy paper products (toilet paper, tissues, etc.) made from recycled paper.3174.000.884
EMCB 7I will not buy a product if I know that the company that sells it is socially irresponsible.3174.150.959
EMCB 8I will not buy products from companies that I know use sweatshop labor, child labor, or other poor working conditions.3174.160.957
EMCB 9I have paid more for environmentally friendly products when there is a cheaper alternative. 3174.010.861
EMCB 10I have paid more for socially responsible products when there is a cheaper alternative. 3174.020.851
RCSD 1My hypermarket pays producers a fair price.3173.860.768
RCSD 2My hypermarket pays their employees a decent wage. 3173.830.766
RCSD 3My hypermarket pays their employees a minimum wage in developing countries.3173.750.849
RCSD 4My hypermarket monitors the working conditions of their employees.3173.840.793
RCSD 5My hypermarket sells fair trade products.3174.350.764
RCSD 6My hypermarket sells organic products. 3174.390.758
RCSD 7My hypermarket implements humanitarian actions.3164.060.814
RCSD 8My hypermarket engages in actions directed at schools.3163.970.861
RCSD 9My hypermarket sells share products (donations to charitable associations).3173.970.864
RCSD 10My hypermarket recycles their products and packaging. 3173.980.869
RCSD 11My hypermarket cuts back their consumption of electricity.3163.301.290
RCSD 12My hypermarket pays attention to the environment.3174.030.847
PV 1The products of this store have an acceptable standard of quality. 3174.570.589
PV 2The products of this store have poor workmanship (*).3171.060.303
PV 3The products of this store would not last a long time (*).3171.060.322
PV 4The products of this store would perform consistently.3174.440.675
PV 5I would enjoy buying in this store. 3154.520.594
PV 6I would feel good if I had the products of this store. 3154.520.588
PV 7In comparison to the monetary effort and other inconveniences derived from buying in this store, I think the value it offers is adequate. 3164.520.593
PV 8The people I know would like this store.3174.510.609
PV 9I would like buying in this store. 3164.510.615
PV 10The products of this store offer value for money.3174.540.587
PV 11The products of this store would be economical. 3174.520.609
PV 12Buying in this store may have an influence in the image of me that other people have. 3173.781.211
PV 13Buying in this store may give a good impression of me to other people. 3173.541.239
SE 1It makes sense to go to this store instead of any other store, even if they are the same. 3174.442.321
SE 2Even if another store has same features as this store, I would prefer to shop at this store. 3174.300.825
SE 3If there is another store as good as this store, I prefer to shop at this store.3164.310.824
SE 4If the other store is not different from this store in any way, it seems smarter to shop at this store.3164.310.816
L 1I consider myself loyal to this store.3174.340.798
L 2This store is my first choice.3174.400.729
L 3I will not buy from other stores.3174.160.896
L 4Even though the same items are available in other stores, I still prefer this establishment. 3174.290.856
W 1If my family/friends ask my advice, I tell them to go to this hypermarket.3174.470.691
W 2 I tell other people about the positive things of this hypermarket. 3174.490.649
W 3I recommend this hypermarket to my friends. 3164.510.630
* Reversed item.

References

  1. Lee, J.M.; Kim, H.J.; Rha, J.Y. Shopping for society? consumers’ value conflicts in socially responsible consumption affected by retail regulation. Sustainability 2017, 9, 1968. [Google Scholar] [CrossRef] [Green Version]
  2. Chang, S.H.; Chou, C.H. Consumer intention toward bringing your own shopping bags in Taiwan: An application of ethics perspective and theory of planned behavior. Sustainability 2018, 10, 1815. [Google Scholar] [CrossRef] [Green Version]
  3. Albayrak, T.; Aksoy, Ş.; Caber, M. The effect of environmental concern and scepticism on green purchase behaviour. Mark. Intell. Plan. 2013, 31, 27–39. [Google Scholar] [CrossRef]
  4. Shamim, A.; Ghazali, Z.; Khan, Z.; Jamak, A.B.S.A. Gender and ethnic group differences in customer citizenship behavior. Glob. Bus. Manag. Res. 2017, 9, 546–554. [Google Scholar]
  5. Kotler, P. Reinventing marketing to manage the environmental imperative. J. Mark. 2011, 75, 132–135. [Google Scholar] [CrossRef]
  6. Lavorata, L.; Mugel, O. Compréhension des mécanismes de construction des stratégies de développement durable des distributeurs indépendants: Une étude qualitative. Revue L’organisation Responsab. 2017, 12, 34–52. [Google Scholar] [CrossRef]
  7. Kessous, A.; Boncori, A.L.; Paché, G. Are consumers’ sensitive to large retailers’ sustainable practices? A semiotic analysis in the French context, J. Retail. Consum. Serv. 2016, 32, 117–130. [Google Scholar] [CrossRef]
  8. Coca, V.; Dobrea, M.; Vasiliu, C. Towards a sustainable development of retailing in Romania. Amfiteatru Econ. (Supl. Special No.7) Bus. Sust. Dev. 2013, 15, 583–602. [Google Scholar]
  9. Hampl, N.; Loock, M. Sustainable development in retailing: What is the impact on store choice? Bus. Strategy Environ. 2013, 22, 202–216. [Google Scholar] [CrossRef]
  10. Sudbury-Riley, L.; Kohlbacher, F. Ethically minded consumer behavior: Scale review, development, and validation. J. Bus. Res. 2016, 69, 2697–2710. [Google Scholar] [CrossRef] [Green Version]
  11. Toti, J.; Moulins, J. How to measure ethical consumption behaviors? RIMHE 2016, 24, 45–66. [Google Scholar] [CrossRef]
  12. Lavorata, L. Influence of retailers’ commitment to sustainable development on store image, consumer loyalty and consumer boycotts: Proposal for a model using the theory of planned behavior. J. Retail. Consum. Serv. 2014, 21, 1021–2027. [Google Scholar] [CrossRef]
  13. Szmigin, I.; Carrigan, M.; McEachern, M.G. The conscious consumer: Taking a flexible approach to ethical behavior. Int. J. Consum. Stud. 2009, 33, 224–231. [Google Scholar] [CrossRef]
  14. Gil-Saura, I.; Ruiz-Molina, M.E.; Berenguer-Contrí, G. Store equity and behavioral intentions: The moderating role of the retailer’s technology. J. Prod. Brand. Manag. 2016, 25, 642–650. [Google Scholar] [CrossRef]
  15. Gil-Saura, I.; Šerić, M.; Ruiz-Molina, M.E.; Berenguer-Contrí, G. The causal relationship between store equity and loyalty: Testing two alternative models in retailing. J. Brand. Manag. 2017, 24, 193–208. [Google Scholar] [CrossRef]
  16. Gonçalves, M.F.; Menezes, J.; Marques, C. Grocery consumer relational perceptions in green consumption context. Tour. Manag. Stud. 2015, 11, 160–163. [Google Scholar]
  17. Corporación Favorita. Sostenibilidad. Available online: http://www.corporacionfavorita.com/sostenibilidad/ (accessed on 20 June 2020).
  18. Lee, K.-R. Ethical beliefs in marketing management a cross cultural study. J. Mark. 1981, 15, 58–67. [Google Scholar] [CrossRef]
  19. Hunt, S.D.; Vitell, S.J. A general theory of marketing ethics. J. Macromark. 1986, 8, 5–16. [Google Scholar] [CrossRef]
  20. Muncy, J.; Vitell, S. Consumer ethics: An investigation of the ethical beliefs of the final consumer. J. Bus. Res. 1992, 24, 297–311. [Google Scholar] [CrossRef]
  21. Schlegelmilch, B.; Öberseder, M. Half a century of marketing ethics. Shifting perspectives and emerging trends. J. Bus. Ethics 2010, 93, 1–19. [Google Scholar] [CrossRef]
  22. Shaw, D. Consumer voters in imagined communities. Int. J. Sociol. Soc. Policy 2007, 27, 135–150. [Google Scholar] [CrossRef]
  23. Diallo, M.; Lambey-Checchin, C. Consumers’ perceptions of retail business ethics and loyalty to the retailer: The moderating role of social discount practices. J. Bus. Ethics 2017, 141, 435–449. [Google Scholar] [CrossRef]
  24. Oh, J.-C.; Yoon, S.-J. Theory-based approach to factors affecting ethical consumption. Int. J. Consum. Stud. 2014, 38, 278–288. [Google Scholar] [CrossRef]
  25. Gulyás, E. Interpretations of ethical consumption. Rev. Sociol. 2008, 14, 25–44. [Google Scholar] [CrossRef] [Green Version]
  26. Carrington, M.J.; Neville, B.A.; Whitwell, G.J. Lost in translation: Exploring the ethical consumer intention–behavior gap. J. Bus. Res. 2014, 67, 2759–2767. [Google Scholar] [CrossRef]
  27. Shaw, D.; Shiu, E. An assessment of ethical obligation and self-identity in ethical consumer decision-making: A structural equation modelling approach. Int. J. Consum. Stud. 2002, 26, 286–293. [Google Scholar] [CrossRef]
  28. Buerke, A.; Straatmann, T.; Lin-Hi, N.; Müller, K. Consumer awareness and sustainability-focused value orientation as motivating factors of responsible consumer behaviour. Rev. Manag. Sci. 2017, 11, 959–991. [Google Scholar] [CrossRef]
  29. Davies, I.A.; Gutsche, S. Consumer motivations for mainstream “ethical” consumption. Eur. J. Mark. 2016, 50, 1326–1347. [Google Scholar] [CrossRef]
  30. Richards, C.; Zen, I.S. From surface to deep corporate social responsibility: The Malaysian no plastic bags campaign as both social and organizational learning. J. Glob. Responsib. 2016, 7, 275–287. [Google Scholar] [CrossRef]
  31. Bartels, J.; Reinders, M.J.; Van Haaster-De Winter, M. Perceived sustainability initiatives: Retail managers’ intrinsic and extrinsic motives. Br. Food J. 2015, 117, 1720–1736. [Google Scholar] [CrossRef]
  32. Sudbury-Riley, L. Unwrapping senior consumers’ packaging experiences. Mark. Intell. Plan. 2014, 32, 666–686. [Google Scholar] [CrossRef] [Green Version]
  33. Yip, A.W.; Bocken, N.M. Sustainable business model archetypes for the banking industry. J. Clean. Prod. 2018, 174, 150–169. [Google Scholar] [CrossRef]
  34. Brundtland, G.H. Our common future—Call for action. Environ. Conserv. 1987, 14, 291–294. [Google Scholar] [CrossRef]
  35. Ferrell, O.C.; Fraedrich, J.; Ferrel, L. Business Ethics: Ethical Decision Making and Cases; Cengage Learning: Boston, MA, USA, 2015. [Google Scholar]
  36. Brønn, P.; Vrioni, A.B. Corporate social responsibility and cause-related marketing: An overview. Int. J. Advert. 2001, 20, 207–222. [Google Scholar] [CrossRef]
  37. Rakic, M.; Rakic, B. Sustainable lifestyle marketing of individuals: The base of sustainability. Amfiteatru Econ. 2015, 17, 891–908. [Google Scholar]
  38. Jones, P.; Comfort, D.; Hillier, D. Sustainability in the global shop window. Int. J. Retail. Distrib. Manag. 2011, 39, 256–271. [Google Scholar] [CrossRef]
  39. Gulyás, E. Sustainability issues in the ethical codes of hypermarkets: A case for inefficient self-regulation. Soc. Econ. 2011, 33, 111–129. [Google Scholar] [CrossRef]
  40. Sanclemente-Téllez, J.C. La responsabilidad social empresarial (RSE) de los pequeños distribuidores minoristas. Clío Am. 2015, 9, 42–56. [Google Scholar] [CrossRef] [Green Version]
  41. Lombart, C.; Louis, D. A study of the impact of Corporate Social Responsibility and price image on retailer personality and consumers’ reactions-satisfaction, trust and loyalty to the retailer. J. Retail. Consum. Serv. 2014, 21, 630–642. [Google Scholar] [CrossRef]
  42. González, M.P. Oferta de Consumo Responsable en Hipermercados de España. Boletín Económico ICE Información Comercial Española 2012, 3027, 35–52. [Google Scholar]
  43. Reinartz, W.; Dellaert, B.; Kraft, M.; Kumar, V.; Varadarajan, R. Retailing innovations in a globalizing retail market environment. J. Retail. 2011, 87, S53–S66. [Google Scholar] [CrossRef]
  44. Andrews, M.; Luo, X.; Fang, Z.; Aspara, J. Cause marketing effectiveness and the moderating role of price discounts. J. Mark. 2014, 78, 120–142. [Google Scholar] [CrossRef] [Green Version]
  45. Gonzalez-Lafaysse, L.; Lapassouse-Madrid, C. Facebook and sustainable development: A case study of a French supermarket chain. Int. J. Retail. Distrib. Manag. 2016, 44, 560–582. [Google Scholar] [CrossRef]
  46. He, A.; Hong, L. Impact of the retailer’s environmental sustainability in consumer support. J. Bus. Econ. 2017, 1, 14–24. [Google Scholar]
  47. Charriãre, V.; Morin-Delerm, S. Chapter 12 consumer perception of french retailers’ commitment to sustainable development. In Business and Sustainability: Concepts, Strategies and Changes (Critical Studies on Corporate Responsibility, Governance and Sustainability, Vol. 3); Eweje, G., Perry, M., Eds.; Emerald Group Publishing Limited: Bingley, UK, 2011; pp. 261–291. [Google Scholar]
  48. Ruiz-Molina, M.E.; Lavorata, L. Retailers’ Commitment to Sustainable Development and Store Brand Equity: A comparison between Consumers in France and Spain. In Food Retailing and Sustainable Development; Lavorata, L., Sparks, L., Eds.; Emerald Publishing Limited: Bingley, UK, 2018; pp. 131–153. [Google Scholar]
  49. Aaker, D.A. Managing Brand Equity; The Free Press: New York, NY, USA, 1991. [Google Scholar]
  50. Kamakura, W.A.; Russell, G.J. Measuring brand value with scanner data. Int. Mark. J. Res. Mark. 1993, 10, 9–22. [Google Scholar] [CrossRef]
  51. Iglesias, O.; Markovic, S.; Singh, J.J.; Sierra, V. Do customer perceptions of corporate services brand ethicality improve brand equity? considering the roles of brand heritage, brand image, and recognition benefits. J. Bus. Ethics 2019, 154, 441–459. [Google Scholar] [CrossRef]
  52. Shen, P. A study on the multi-dimensional relationship between consumer shopping value and retailer brand equity. In Proceedings of the Marketing Science Innovations and Economic Development Paper Presented at the—Proceedings of 2010 Summit International Marketing Science and Management Technology Conference, Beijing, China, 7 August 2010; pp. 128–132. [Google Scholar]
  53. Marín-García, A.; Gil-Saura, I.; Ruíz-Molina, M.E. How do innovation and sustainability contribute to generate retail equity? Evidence from Spanish retailing. J. Prod. Brand. Manag. 2019, 29, 601–615. [Google Scholar]
  54. Davcik, N.S.; Da Silva, R.V.; Hair, J.F. Towards a unified theory of brand equity: Conceptualizations, taxonomy and avenues for future research. J. Prod. Brand. Manag. 2015, 24, 3–17. [Google Scholar] [CrossRef] [Green Version]
  55. Girard, T.; Trapp, P.; Pinar, M.; Gulsoy, T.; Boyt, T.E. Consumer-based brand equity of a private-label brand: Measuring and examining determinants. J. Mark. Theory Pract. 2017, 25, 39–56. [Google Scholar] [CrossRef]
  56. Stahl, F.; Heitmann, M.; Lehmann, D.R.; Neslin, S.A. The impact of brand equity on customer acquisition, retention, and profit margin. J. Mark. 2012, 76, 44–63. [Google Scholar] [CrossRef] [Green Version]
  57. Atulkar, S.; Kesari, B. Satisfaction, loyalty and repatronage intentions: Role of hedonic shopping values. J. Reta. Cons. Serv. 2017, 39, 23–34. [Google Scholar] [CrossRef]
  58. Zeithaml, V.A. Consumer perceptions of price, quality and value: A means-end model and synthesis of evidence. J. Mark. 1988, 52, 2–22. [Google Scholar] [CrossRef]
  59. Gallarza, M.G.; Gil-Saura, I.; Ruiz-Molina, M.E. Emotional and altruistic values as drivers for a loyalty-based segmentation in retailing: An approach to postrecession Spanish apparel consumers. J. Relatsh. Mark. 2016, 15, 200–217. [Google Scholar]
  60. Nikhashemi, S.R.; Tarofder, A.K.; Gaur, S.S.; Haque, A. The effect of customers’ perceived value of retail store on relationship between store attribute and customer brand loyalty: Some insights from Malaysia. Proc. Econ. Financ. 2016, 37, 432–438. [Google Scholar] [CrossRef] [Green Version]
  61. Sweeney, J.C.; Soutar, G.N. Consumer perceived value: The development of a multiple item scale. J. Retail. 2001, 77, 203–220. [Google Scholar] [CrossRef]
  62. Walsh, G.; Shiu, E.; Hassan, L.M. Replicating, validating, and reducing the length of the consumer perceived value scale. J. Bus. Res. 2014, 67, 260–267. [Google Scholar] [CrossRef]
  63. Chang, H.J.; Jai, T.M. Is fast fashion sustainable? The effect of positioning strategies on consumers’ attitudes and purchase intentions. SRJ 2015, 11, 853–867. [Google Scholar] [CrossRef]
  64. Rubio, N.; Villaseñor, N.; Yagüe, M. Medición del capital de marca de distribuidor desde un enfoque formativo: Diferencias entre grandes y pequeños compradores de marca de distribución”. In Paper Presented at the Marketing Trends Congress; Universidad Autónoma de Madrid: Madrid, Spain, 2014; Available online: http://archives.marketing-trends-congress.com/2014/pages/PDF/308.pdf (accessed on 28 September 2020).
  65. Cai, L.; He, C. Corporate environmental responsibility and equity prices. J. Bus. Ethics 2014, 125, 617–635. [Google Scholar] [CrossRef]
  66. Hur, W.M.; Kim, H.; Woo, J. How CSR leads to corporate brand equity: Mediating mechanisms of corporate brand credibility and reputation. J. Bus. Ethics 2014, 125, 75–86. [Google Scholar] [CrossRef]
  67. Sierra, V.; Iglesias, L.; Markovic, S.; Singh, J. Does ethical image build equity in corporate services brands? the influence of customer perceived ethicality on affect, perceived quality, and equity. J. Bus. Ethics 2017, 144, 661–676. [Google Scholar] [CrossRef]
  68. Oliver, R.L. Whence consumer loyalty? J. Mark. 1999, 63, 33–44. [Google Scholar] [CrossRef]
  69. Gil-Saura, I.; Ruiz-Molina, M.E.; Michel, G.; Corraliza-Zapata, A. Retail brand equity: A model based on its dimensions and effects. Int. Rev. Retail. Distrib. Consum. Res. 2013, 23, 111–136. [Google Scholar] [CrossRef]
  70. Cacho-Elizondo, S.; Loussaïef, L. The influence of sustainable development on retail store image. Int. Bus. Res. 2010, 3, 100–110. [Google Scholar] [CrossRef] [Green Version]
  71. Oliver, R.L. Satisfaction: A Behavioral Perspective on the Customer; Irwin/McGraw-Hill: New York, NY, USA, 1997. [Google Scholar]
  72. Markovic, S.; Iglesias, O.; Singh, J.J.; Sierra, V. How does the perceived ethicality of corporate services brands influence loyalty and positive word-of-mouth? Analyzing the roles of empathy, affective commitment, and perceived quality. J. Bus. Ethics 2018, 148, 721–740. [Google Scholar] [CrossRef]
  73. Frasquet, M.; Molla Descals, A.; Ruiz-Molina, M.E. Understanding loyalty in multichannel retailing: The role of brand trust and brand attachment. Int. J. Retail. Distrib. Manag. 2017, 45, 608–625. [Google Scholar] [CrossRef]
  74. Su, J.; Chang, A. Factors affecting college students’ brand loyalty toward fast fashion: A consumer-based brand equity approach. Int. J. Retail. Distrib. Manag. 2018, 46, 90–107. [Google Scholar] [CrossRef] [Green Version]
  75. Swoboda, B.; Berg, B.; Dabija, D.C. International transfer and perception of retail formats: A comparison study in Germany and Romania. Int. Mark. Rev. 2014, 31, 155–180. [Google Scholar] [CrossRef]
  76. Silverman, G. How to harness the awesome power of word of mouth. Direct Mark. 1997, 60, 32–37. [Google Scholar]
  77. Moliner-Velázquez, B.; Ruiz-Molina, M.E.; Fayos-Gardó, T. Satisfaction with service recovery: Moderating effect of age in word-of-mouth. J. Cons. Mark. 2015, 32, 470–484. [Google Scholar] [CrossRef]
  78. Fuentes-Blasco, M.; Moliner-Velázquez, B.; Gil-Saura, I. Analyzing heterogeneity on the value, satisfaction, word-of-mouth relationship in retailing. Manag. Decis. 2017, 55, 1558–1577. [Google Scholar] [CrossRef]
  79. Harris, P.; Khatami, N.A. Antecedents of word of mouth behaviour among female grocery shoppers in Iran. J. Islam Mark. 2017, 8, 2–15. [Google Scholar] [CrossRef]
  80. Leppäniemi, M.; Karjaluoto, H.; Saarijärvi, H. Customer perceived value, satisfaction, and loyalty: The role of willingness to share information. Int. Rev. Retail. Distrib. Consum. Res. 2017, 27, 164–188. [Google Scholar] [CrossRef]
  81. Arnett, D.B.; Laverie, D.A.; Meiers, A. Developing parsimonious retailer equity indexes using partial least squares analysis: A method and applications. J. Retail. 2003, 79, 161–170. [Google Scholar] [CrossRef]
  82. Chaudhuri, A.; Ligas, M. Consequences of value in retail markets. J. Retail. 2009, 85, 406–419. [Google Scholar] [CrossRef]
  83. Zeithaml, V.A.; Berry, L.L.; Parasuraman, A. The behavioral consequences of service quality. J. Mark. 1996, 60, 31–46. [Google Scholar] [CrossRef]
  84. Chen, X.; Yu, H.; Yu, F. What is the optimal number of response alternatives for rating scales? From an information processing perspective. J. Mark. Anal. 2015, 3, 69–78. [Google Scholar] [CrossRef]
  85. April-Lalonde, G.; Latorre, S.; Paredes, M.; Hurtado, M.F.; Muñoz, F.; Deaconu, A.; Cole, D.C.; Batal, M. Characteristics and Motivations of Consumers of Direct Purchasing Channels and the Perceived Barriers to Alternative Food Purchase: A Cross-Sectional Study in the Ecuadorian Andes. Sustainability 2020, 12, 6923. [Google Scholar] [CrossRef]
  86. Zambrano-Monserrate, M.A.; Ruano, M.A. Do you need a bag? Analyzing the consumption behavior of plastic bags of households in Ecuador. Resour. Conserv. Recycl. 2020, 152, 1–19. [Google Scholar] [CrossRef]
  87. Instituto Nacional de Estadística y Censos. Población y Demografía. Available online: https://www.ecuadorencifras.gob.ec/censo-de-poblacion-y-vivienda/2020 (accessed on 28 September 2020).
  88. Ringle, C.M.; Wende, S.; Becker, J.M. SmartPLS 3. SmartPLS GmbH Boenningstedt. 2015. Available online: http://www.smartpls.com (accessed on 28 September 2020).
  89. Diamantopoulos, A.; Winklhofer, H.M. Index construction with formative indicators: An alternative to scale development. J. Mark. Res. 2001, 38, 269–277. [Google Scholar] [CrossRef]
  90. Bagozzi, R.P.; Yi, Y. On the evaluation of structural equation models. J. Acad. Mark. Sci. 1988, 16, 74–94. [Google Scholar] [CrossRef]
  91. Carmines, E.G.; Zeller, R.A. Reliability and Validity Assessment; Sage Publications: London, UK, 1979. [Google Scholar]
  92. Hair, J.F.; Hult, G.T.M.; Ringle, C.; Sarstedt, M. A Primer on Partial Least Squares Structural Equation Modeling (PLS-SEM), 2nd ed.; SAGE Publication: Thousand Oaks, CA, USA, 2017. [Google Scholar]
  93. Henseler, J.; Sarstedt, M. Goodness-of-fit indices for partial least squares path modelling. Comput. Stat. 2013, 28, 565–580. [Google Scholar] [CrossRef] [Green Version]
  94. Fornell, C.; Larcker, D.F. Evaluating structural equation models with unobservable variables and measurement error. J. Mark. Res. 1981, 18, 39–50. [Google Scholar] [CrossRef]
  95. Henseler, J.; Ringle, C.M.; Sarstedt, M. A new criterion for assessing discriminant validity in variance-based structural equation modelling. J. Acad. Mark. Sci. 2015, 43, 115–135. [Google Scholar] [CrossRef] [Green Version]
  96. Hair, J.F.; Ringle, C.M.; Sarstedt, M. PLS-SEM: Indeed a silver bullet. J. Mark. Teoría Pract. 2011, 19, 139–152. [Google Scholar] [CrossRef]
  97. Hair, J.F., Jr.; Sarstedt, M.; Matthews, L.M.; Ringle, C.M. Identifying and treating unobserved heterogeneity with FIMIX-PLS: Part, I.–method. Eur. Bus. Rev. 2016, 28, 63–76. [Google Scholar] [CrossRef]
  98. Schmuck, D.; Matthes, J.; Naderer, B. Misleading consumers with green advertising? An affect–reason–involvement account of greenwashing effects in environmental advertising. J. Advert. 2018, 47, 127–145. [Google Scholar] [CrossRef] [Green Version]
  99. Hanaysha, J.R. Customer retention and the mediating role of perceived value in retail industry. World J. Entrep. Manag. Sustain. Dev. 2018, 14, 2–24. [Google Scholar] [CrossRef]
Figure 1. Proposed final model.
Sustainability 12 08041 g001
Table 1. General sample details.
TotalMegamaxiSuper TiaCoral HiperGran AkíHipermarket
VariableN%N%N%N%N%N%
Gender
Male18458.045364.634656.103049.181967.863656.25
Female13341.962935.373643.903150.82932.142843.75
Age
18–25 years old6219.561923.171518.291829.5100.001015.63
26–35 years old5617.671012.202024.391118.03621.43914.06
36–45 years old11335.652125.612834.151931.151346.433250.00
46–60 years old6219.562429.271113.411016.39828.57914.06
Older than 60247.5789.7689.7634.9213.5746.25
Level of Studies
Primary studies/No studies144.4244.8833.6623.2813.5746.25
Secondary studies7323.032024.391923.172032.7913.571320.31
University studies14244.793441.464150.002744.261760.712335.94
Postgraduate5216.401518.2978.54914.75310.711828.13
Others3611.36910.981214.6334.92621.4369.38
Family Situation
Single8928.082228.082728.082228.08428.081428.08
Married/Living as a couple16150.793947.564251.222642.621760.713757.81
Divorced5316.721619.511012.201118.03621.431015.63
Widower144.4256.1033.6623.2813.5734.69
Table 2. Confirmatory factor analysis results.
ConstructItemStandardized Loadingst-ValuesCACRAVE
F1 EMCB 0.9850.9870.881
EMCB1.0.963258.528 *
EMCB20.963228.216 *
EMCB30.957135.014 *
EMCB40.962247.436 *
EMCB50.965262.992 *
EMCB60.969331.633 *
EMCB70.958161.308 *
EMCB80.84764.425 *
EMCB90.82758.923 *
EMCB100.964225.149 *
F2 RCSD—Economic 0.9630.9730.899
RCSD10.967217.868 *
RCSD20.967210.896 *
RCSD30.936118.710 *
RCSD40.92290.778 *
F3 RCSD—Social 0.8760.9260.807
RCSD50.955217.439 *
RCSD60.945160.533 *
RCSD70.78437.602 *
F4 RCSD—Environmental 0.9370.9690.940
RCSD100.976182.253 *
RCSD120.96399.427 *
F5 PV—Quality 0.9800.9830.867
PV10.81649.644 *
PV40.89964.623 *
PV50.94799.340 *
PV60.966217.472 *
PV70.962178.597 *
PV80.964211.197 *
PV90.959183.249 *
PV100.943120.683 *
PV110.91359.772 *
F6 PV—Social 0.9070.9530.910
PV120.97516.122 *
PV130.93312.514 *
F7 Store equity 0.9880.9910.966
SE10.978152.370 *
SE20.991452.259 *
SE30.984210.669 *
SE40.979177.580 *
F8 Loyalty 0.9500.9650.872
L10.965253.331 *
L20.943138.955 *
L30.86353.021 *
L40.961251.173 *
F9 WOM 0.9680.9790.939
W10.96160.624 *
W20.971104.998 *
W30.975136.648 *
CA = Cronbach’s alpha, CR = composite reliability, AVE = average variance extracted, * p < 0.01.
Table 3. Measurement model. Discriminant validity.
F1F2F3F4F5F6F7F8F9
F1 EMCB0.9390.3860.4870.5250.6270.2370.6700.7220.496
F2 RCSD—Economic0.3820.9480.4910.5390.2820.1810.2370.2400.242
F3 RCSD—Social0.4480.4480.8980.8520.6150.1390.6360.6090.605
F4 RCSD—Environmental0.5090.5170.7560.9700.5150.2070.4640.5120.446
F5 VP—Quality 0.6160.2780.5680.4980.9310.2150.7690.7420.703
F6 VP—Social0.2390.1670.0150.1920.2070.9540.0790.0950.040
F7 Store equity0.6610.2360.5950.4520.7560.0790.9830.8200.797
F8 Loyalty0.6980.2340.5600.4910.7170.0890.7960.9340.654
F9 WOM0.4840.2370.5590.4280.6840.0410.7790.6280.969
Values on the diagonal are the square roots of the AVE. Below the diagonal: squared correlations between factors. Above the diagonal: heterotrait–monotrait ratio (HTMT).
Table 4. Parameter estimates of the second-order training model.
Second-Order Factor First-Order FactorsWeightsFIV
Retailers’ commitment to sustainable development as perceived by consumersRCSD—Economic0.494 *1.412
RCSD—Social0.380 *2.382
RCSD—Environmental0.319 *2.735
Perceived valuePV—Quality0.990 *1.045
PV—Social 0.045 *1.045
* p < 0.01.
Table 5. Structural equations model results.
RelationsStandardized Betat-ValueHypotheses
EMCB → RCSD−0.0054.358 *H1 not supported
Perceived value → Store equity0.68322.447 *H2 supported
RCSD → Store equity0.1344.817 *H3 supported
Store equity → Loyalty0.79639.855 *H4 supported
Loyalty → WOM0.62821.503 *H5 supported
* p < 0.01.
Table 6. Results of R2 and Q2 for endogenous constructs.
Endogenous ConstructR2Q2
RCSD1.0000.579
Perceived value1.0000.670
Store equity0.5780.524
Loyalty0.6340.519
WOM0.3940.350

