Article

Assessing the Relationship between Access Travel Time Estimation and the Accessibility to High Speed Railway Station by Different Travel Modes

1
Beijing Key Laboratory of Traffic Engineering, Beijing University of Technology, Beijing 100124, China
2
CCCC Highway Consultants Co. Ltd., Beijing 100088, China
3
Department of Civil and Environmental Engineering, the Hong Kong Polytechnic University, Hong Kong
*
Author to whom correspondence should be addressed.
Sustainability 2020, 12(18), 7827; https://doi.org/10.3390/su12187827
Submission received: 4 September 2020 / Revised: 19 September 2020 / Accepted: 20 September 2020 / Published: 22 September 2020
(This article belongs to the Section Sustainable Transportation)

Abstract

:
This paper aims to fill the research gap of the relationship between the access travel time (ATT) estimation and the accessibility to high speed railway (HSR) station. A regression analysis was developed on the basis of risk-return model to analyze the access travel time estimation error (ATTEE). The data sources were 1595 valid interview survey data at Beijing South Railway Station (BSRS), China in October 2016. The factors and scenarios included travel mode, departure time, and travel date, etc. The coefficients of ATT estimation were obtained by different travel modes. The results showed that the expected access travel time (EATT) has positive linear correlation with the actual access travel time (AATT). Accessibility was calculated by the ratio of AATT to EATT. The accessibility coefficients ranged from 0.89 to 1.38 in different travel modes, departure time, and travel dates. A smaller coefficient indicates better travel time reliability and accessibility. This study not only provides a useful tool to estimate the travel time budget required for access to HSR station, but also establishes a connection with the accessibility and ATTEE. It offers an opportunity to estimate ATT to HSR stations by different modes of transport, which can help to better understand how the accessibility of the feeder transport changes at different time periods.

1. Introduction

Due to the rapid development of high speed railway (HSR), the inter-city accessibility and capacity of railway networks have been improved [1,2,3,4,5]. HSR can enhance the speed of long-distance inter-city trips with less travel cost and energy consumption [6,7,8,9]. HSR can also promote economic growth and short-term population migration [10,11,12], particularly in tertiary industry [13,14]. A HSR station is the connection between inter-city transport and urban transport. The passengers have to arrive at their HSR station earlier than the latest check-in time, otherwise they will miss the train. The actual access travel time (AATT), which is the duration from their origin (home, hotel, etc.) to HSR stations, become the key point for the access trip to HSR stations. In general, travelers have their own subjective estimation on access travel time (ATT) before they start the trip, namely the expected access travel time (EATT). However, if ATT estimation error (ATTEE) is too large, it will lead to an insufferable waiting time at HSR stations. Consequently, the number of cumulative travelers will increase. More seats and other service facilities will be needed in HSR stations.
Many countries have constructed HSR to provide safe, efficient, convenient, and comfortable service, such as the HSR system in China [15], Shinkansen in Japan [16], Inter City Express (ICE) in Germany [17], train à grande vitesse (TGV) in France [18], and so on. China has established the largest HSR network in the world [19]. The maximum speed of HSR is over 350 km/hour, which is much higher than the conventional trains. The length of the HSR network in China was about 29,000 km by 2018, accounting for over 60% of the world [20]. Beijing South Railway Station (BSRS) is the largest HSR station and an important multimodal transport hub in Beijing. It is connected with 2 subway lines, 15 bus lines, taxi, car-hailing, and other available travel modes. In order to study the access trips to BSRS, a series of interview surveys were conducted at BSRS on 1 October (holiday), 10 October (weekday), and 23 October (weekend), 2016. The valid samples were 511, 546, and 538, respectively.
Good accessibility of the feeder transport can contribute to reducing the ATT. Hence, there is a task that calls for answer: how to assess the relationship between the passengers’ concern of ATT estimation and the accessibility of the feeder transport to HSR station? To reduce ATTEE and shrink travelers’ waiting time, the accessibility of different travel modes should be considered in HSR station trips. The main contributions of this paper can be summarized as followed: (1) Risk-return model is applied to assess the relationship between ATT estimation and accessibility to HSR stations. Accessibility is calculated as the ratio of AATT to EATT. Positive linear correlation is found between EATT and AATT. (2) Travel mode, departure time, and travel date are proved as influence factors of ATT, in which travel mode is the most significant factor. (3) The reliability of ATT can be calculated by different travel modes. Travelers can choose appropriate feeder modes at different departure time. This study can help travelers get a more accurate EATT and shrink ATTEE. For system management, the model can enhance the accessibility of HSR station.
The paper is organized as follows: Section 2 presents the literature review about the previous study. The explanations of methodology and survey are addressed in Section 3. The results and discussions on accessibility analysis and modeling of AATT and EATT are in Section 4. Section 5 is the conclusion.

2. Literature Review

2.1. Accessibility

The concept of the accessibility was firstly proposed by Hansen [21] and was described as the potential opportunities for traveling to attractive points. Geurs and Ritsema [22] defined the accessibility as the transport system that enabled travelers to participate in activities. Geurs and Wee [23] pointed out that accessibility can be reflected by the opportunities to obtain the social sources, including the jobs, hospitals, markets, and transportation hubs. Guaranteeing people’s accessibility to markets and services are important goals of transportation planning and policy [24]. El-Geneidy et al. [25] suggested that accessibility could be used to assess the land use, transport system, and other social equity issues.
The method for accessibility evaluation included gravity model, distance measure, cumulative opportunity measure, space-time prism, two-step floating catchment area, and potential model, etc. [26,27,28,29,30]. Nicole et al. [31] analyzed the influences of location, travel impedance, and travel friction and calculated the transit accessibility using the potential model. Can [32] studied the travel mode choice for the domestic travelers in Nha Trang, Thailand using the multinomial probit model. Travelers with higher income were found to prefer the trains. Hasnine et al. [33] presented a discrete station choice model that considered the variables including demographics, level-of-service attributes, and land-use factors. This model was verified using data in Greater Toronto Area via GIS software. The results reveal that the conventional measures tend to overestimate the transit accessibility. Nassir et al. [34] added the transit schedule information and walkway network into the choice set of Nested Logit (NL) model to measure the accessibility of public transportation system. Miller [35] incorporated the spatial-temporal characteristics into the accessibility calculation. This model could reflect the relationship with travel time and time budget. Ho and Mulley [36] comparatively analyzed the travel mode choices on weekdays and weekends on the basis of a household travel survey in Sydney, Australia. The average travel time decreased on weekends while weekday trips were closely related to travel purpose, mobility constraints, and household income. Wang et al. [37] analyzed the relationship between the holiday trip accessibility and the travel characteristics. Private car and taxi passengers had shorter travel time and longer travel distance in holiday trips. Using OpenStreetMap data, Ziemke et al. [38] measured the accessibility in Nelson Mandela Bay, South Africa via MATSim. The results reflected the advantages of better interpretability, universality, and policy sensitivity than conventional methods. Rahman and Zhang [39] estimated the accessibility of urban public green space to different social groups in Dhaka City, Bangladesh by calculating the time-distance weighted scores. The results indicated that small-size and high-density communities can provide better accessibility to public green space. Zhang et al. [40] selected Nanjing, China as case study to evaluate the difference of public park accessibility in gated and open communities. The study identified the vulnerable groups and provided a basis for managers to improve further public green space design. According to the public schools and residential areas in Nanjing, China, Xu et al. [41] measured the social-spatial accessibility from residential areas to different public schools in terms of geography, opportunity, and economy.
Geng et al. [42] deduced that accessibility was influenced by the travel attributes using cluster analysis. The findings indicated that private car was the main travel mode for most people living in the suburb owing to faster speed and better accessibility. Based on the survey results in Bangkok, Thailand, Prasertsabpakij and Nitivattanano [43] found that travel time, safety, and comfort were essential factors on the accessibility of subway stations. Biniva et al. [44] investigated the walking environment near the subway stations in Delhi, India. The results showed that safety, comfort, convenience, service facilities, and feeder travel modes were significant factors for the residents.

2.2. Access Trip to High Speed Railway Station

HSR has become an important choice in inter-city transportation. Based on HSR, air flight, and weather data from 2016 to 2017 in China, Chen and Wang [45] found HSR was more reliable than air flight when facing severe weather conditions. Chen [46] pointed out that HSR had partly replaced some air flights in inter-city trips, especially within the distance from 500 to 800 km. Through spatially localized failures model, Li et al. [47] analyzed the vulnerability of HSR system, air system, and HSR-Air coupling system in China and found that HSR-Air coupling system was the most resilient. Zhao et al. [48] found that HSR usage was influenced by travel time arrangement, income, and travel cost.
The travel mode choice is of important consideration for travelers when going to HSR stations. Asa et al. [49] presented an analysis on the travel mode choice of train passengers and provided valuable insights for the agency to improve the station-area planning. Chen et al. [50] found that public transport provided better accessibility and punctuality than other travel modes, especially private car and taxi. Liu et al. [51] figured out that the areas along the bus and subway lines had higher accessibility to Shanghai Hongqiao Railway Station than other areas. Tang et al. [52] found that information and communication technology products were used by 96% of the 901 respondents in HSR station trips.

2.3. Access Travel Time Estimation

ATT estimation is important for both traffic management and travelers. Actual travel time can be collected either manually (survey, online, and questionnaires), or sensors (hardware and software) [53]. Indicators including the average absolute error, cumulative relative error, error uniformity index, and mean square error can reflect the accuracy of access travel time estimation [54,55,56]. Moyano et al. indicated that the access and egress were determining factors in total travel time [57]. Zhou et al. [58] proposed time estimation model to calculate the transfer time in subway stations. This model provided a quantitative basis for schedule management and could deduce passengers’ waiting time. Yu et al. [59] found that ATT was significantly affected by travel mode. Yang and Zhou [60] found the error of travel time estimation was closely correlated with road construction, departure time, and travel date.
Tam et al. [61] estimated the safety margin of different travel modes in the access trips to airport. The accessibility of various travel modes was compared according to the ratio of safety margin to effective travel time. The airport express was the most reliable mode with the smallest safety margin. The safety margins of the taxi, the private car, and car-hailing were similar. Koster et al. [62] analyzed the influence factors of safety margin using regression analysis. EATT was positively related to the safety margin. Travelers with less travel experience were more likely to arrive earlier. Takada et al. [63] estimated the safety margin with Markov chain based on online surveys of 1000 train passengers in Tokyo. The safety margin was influenced by travel distance and number of transfers, and also affected travelers’ departure time decision. Fosgerau [64] pointed out that bottleneck congestion had strong impacts on ATT.
From the previous studies, the concepts and influence factors of accessibility have been well discussed. Researches on HSR service focus on the benefits of transportation, economy, and environment, but few studies pay attention to how travelers go to HSR stations. There is still a research gap between the accessibility calculation and travel time estimation, especially how to consider the access trips to HSR stations. This paper is motivated to narrow the gap. A novel method for accessibility calculation according to AATT and EATT is proposed. ATT estimation models in multiple scenarios are established to study the trips to HSR stations by different feeder travel modes.

3. Methodology and Materials

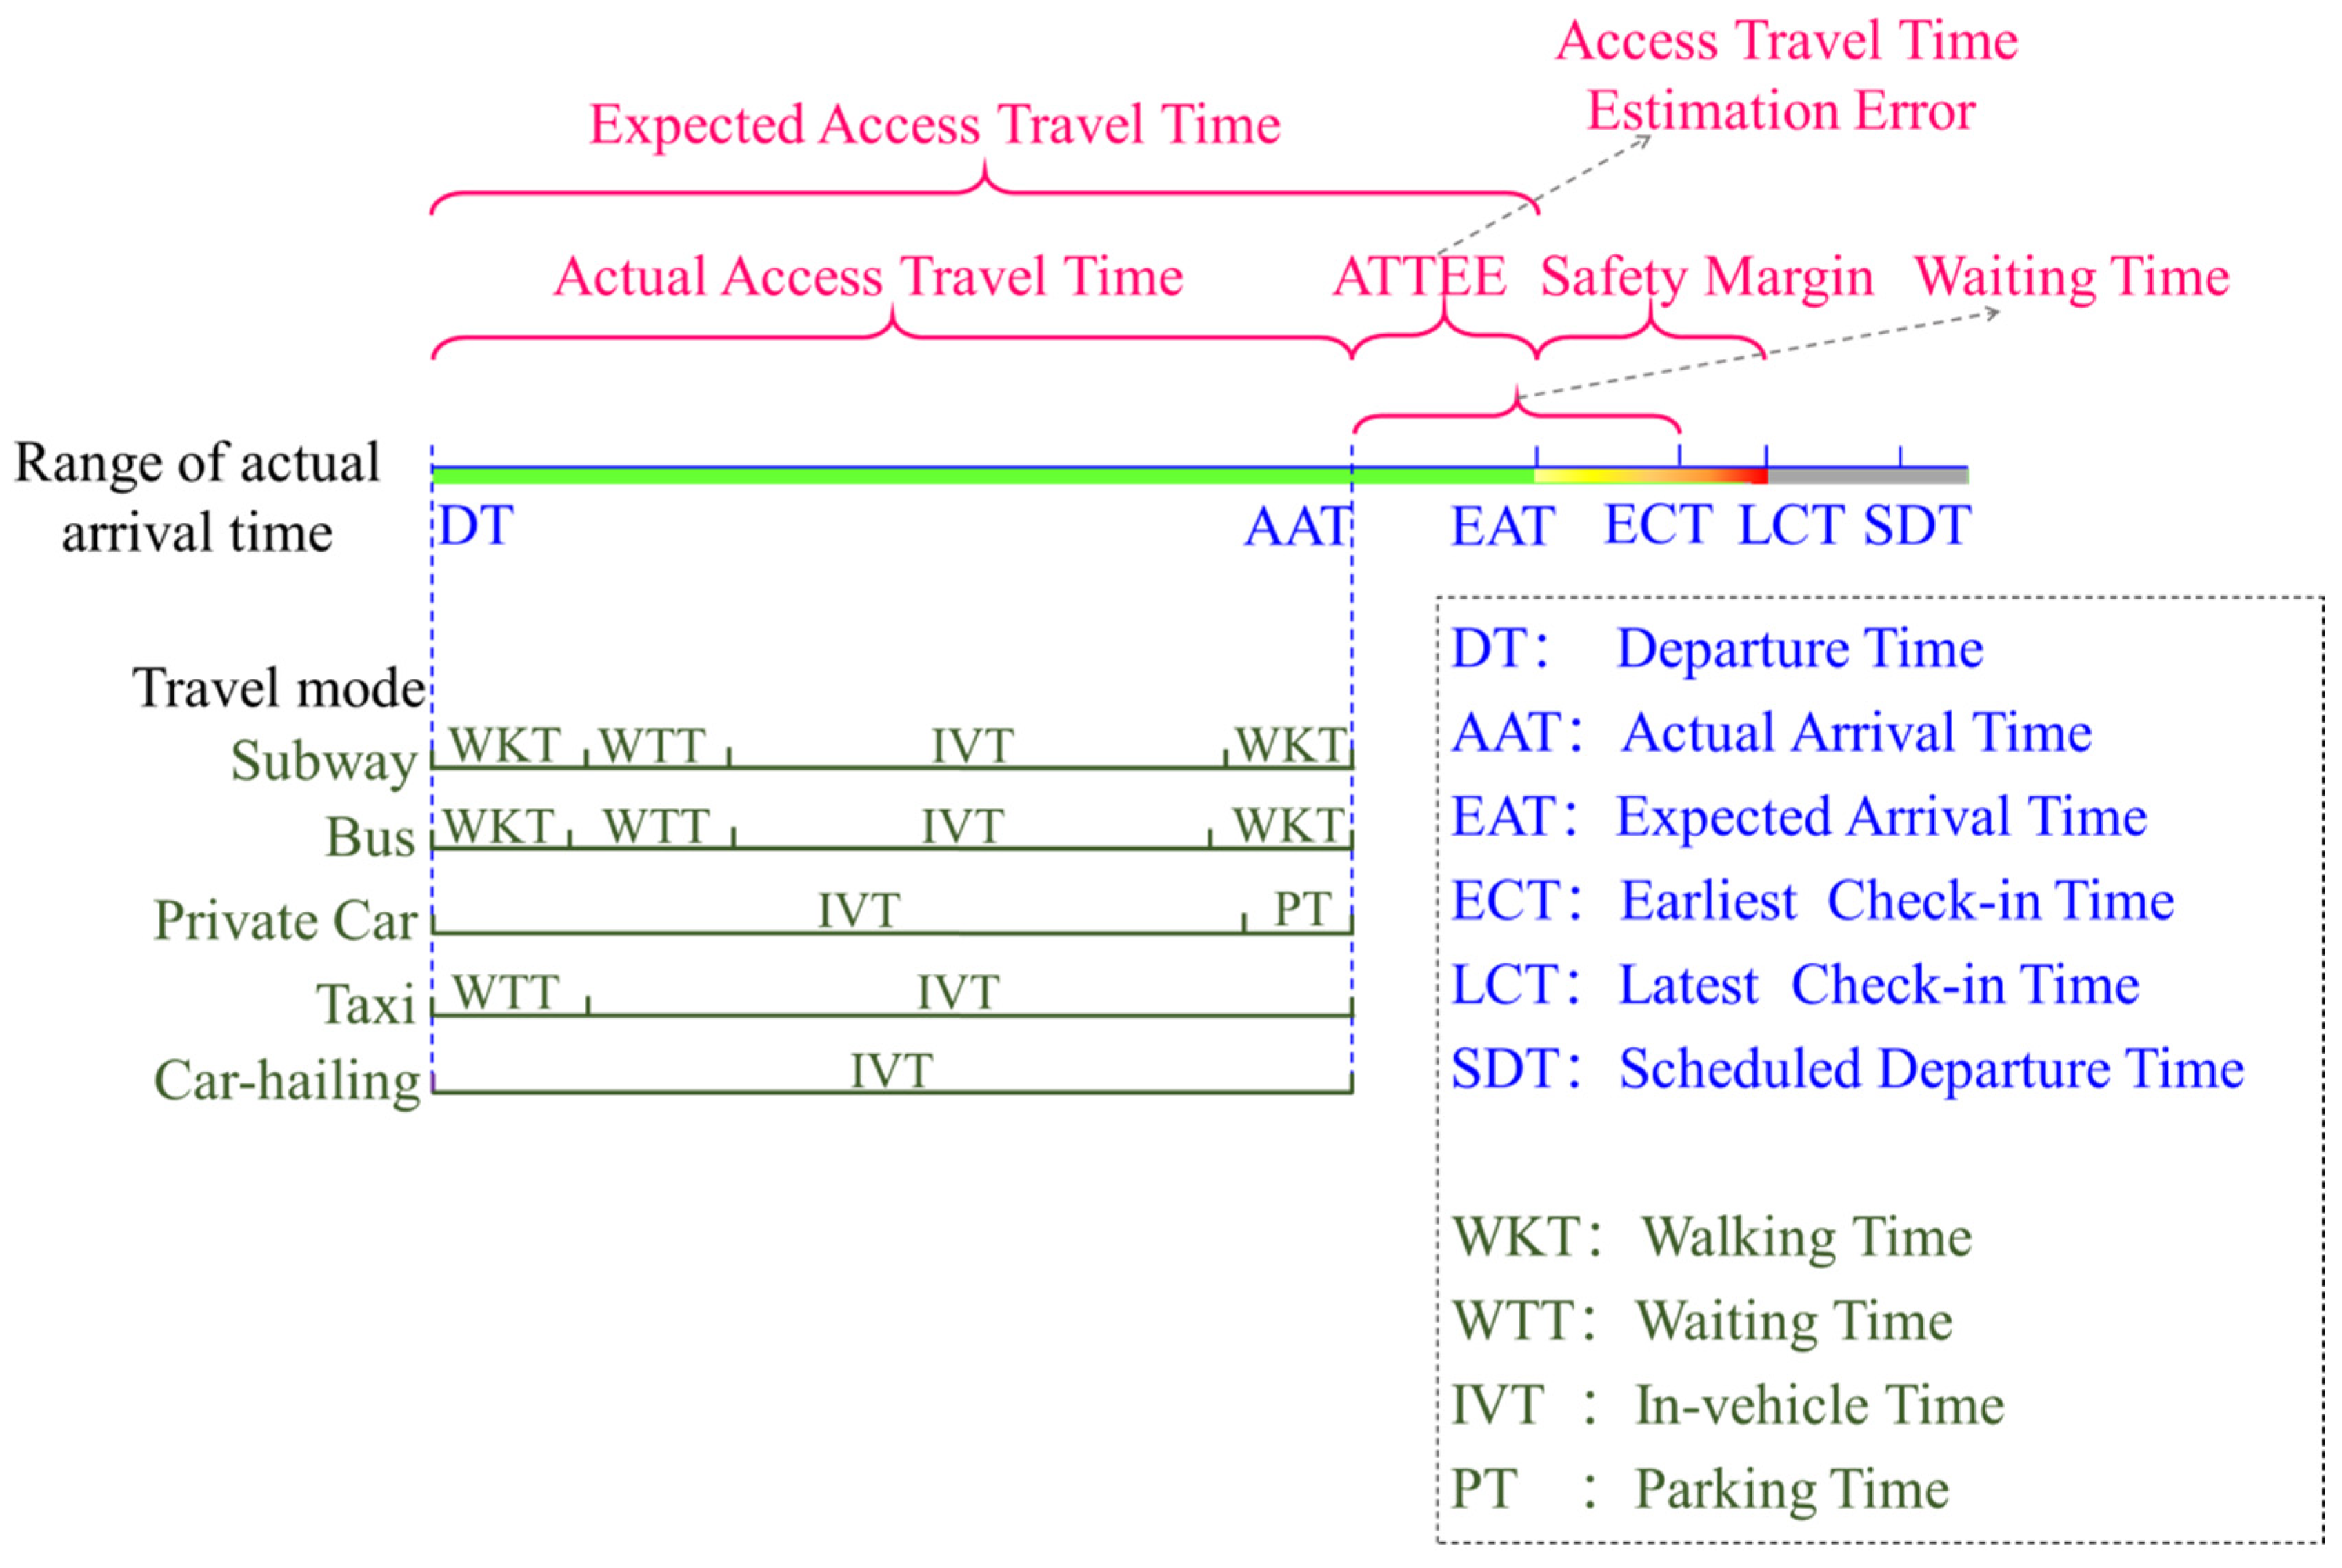
3.1. Model Establishment

The method is motivated by the risk-return model in finance. A decision-maker intends to evaluate the option’s return while minimizing the associated risk [65], as shown in Equation (1) (with a linear-additive form):
U = λ 1 μ τ + λ 2 σ τ
where U is the sum of two terms for an unspecified choice, μ τ is the expected return, σ τ is the risk option, λ 1 , λ 2 are exogenous parameters.
In the access trips to HSR station, the option’s return can be represented by EATT, which is considered as a central measure (e.g., mean) of AATT distribution. The risk is ATT estimation error (ATTEE). AATT is the algebraic sum of EATT and ATTEE, which is shown in Equation (2).
T = T 0 + Δ T
where T is AATT; T 0 is EATT; and Δ T is ATTEE. ATTEE is considered as a dispersion measure (e.g., deviation) of AATT distribution. The best profit for the traveler is to minimize the risk of arriving later than the safety margin. It means to formulate AATT by minimizing ATTEE. To construct the ATT estimation model, it is necessary to analyze the relationship between the time components, as illustrated in Figure 1.
The travelers wish and have to arrive at HSR station before the latest check-in time. The time duration between the expected arrival time and the latest check-in time is the safety margin. The value of safety margin is greater than 0. However, ATT has the nature of uncertainty. The time duration from AATT to the earliest check-in time is the waiting time at HSR station. It should be noticed that AATT may be either earlier or later than EATT. The earlier AATT is, the longer waiting time will be. On the other side, if AATT is later than the latest check-in time, passengers will not get the HSR service.
Looking into the feeder travel modes, ATT is the sum of walking time (for subway and bus), waiting time (for subway, bus, and taxi), in-vehicle time (all the feeder travel modes) and parking time (for private car only). The walking time and waiting time can be taken as the resistances of the accessibility. The in-vehicle time affects the accessibility to some extent and is relevant with the reliability. Reliability is normally used to measure the differences of travel time by travel modes, travel date, and departure time. These factors are independent without loss of generality. Hence, Equation (3) is constructed to assess the relationship of AATT and EATT.
T = f ( M i , H j , N k ) T 0
where M i is travel mode i ( i =1, subway; i = 2, bus; i = 3, private car; i = 4, taxi and i = 5, car-hailing). H j is travel date ( j = 1, weekday; j = 2, weekend and j = 3, holiday). N k is departure time ( k = 1, AM peak; k = 2, off-peak and k = 3, PM peak). The values of M i , H j and N k are 0 or 1, respectively. If the trip is under the corresponding scenario, the value is 1, otherwise, it is 0.

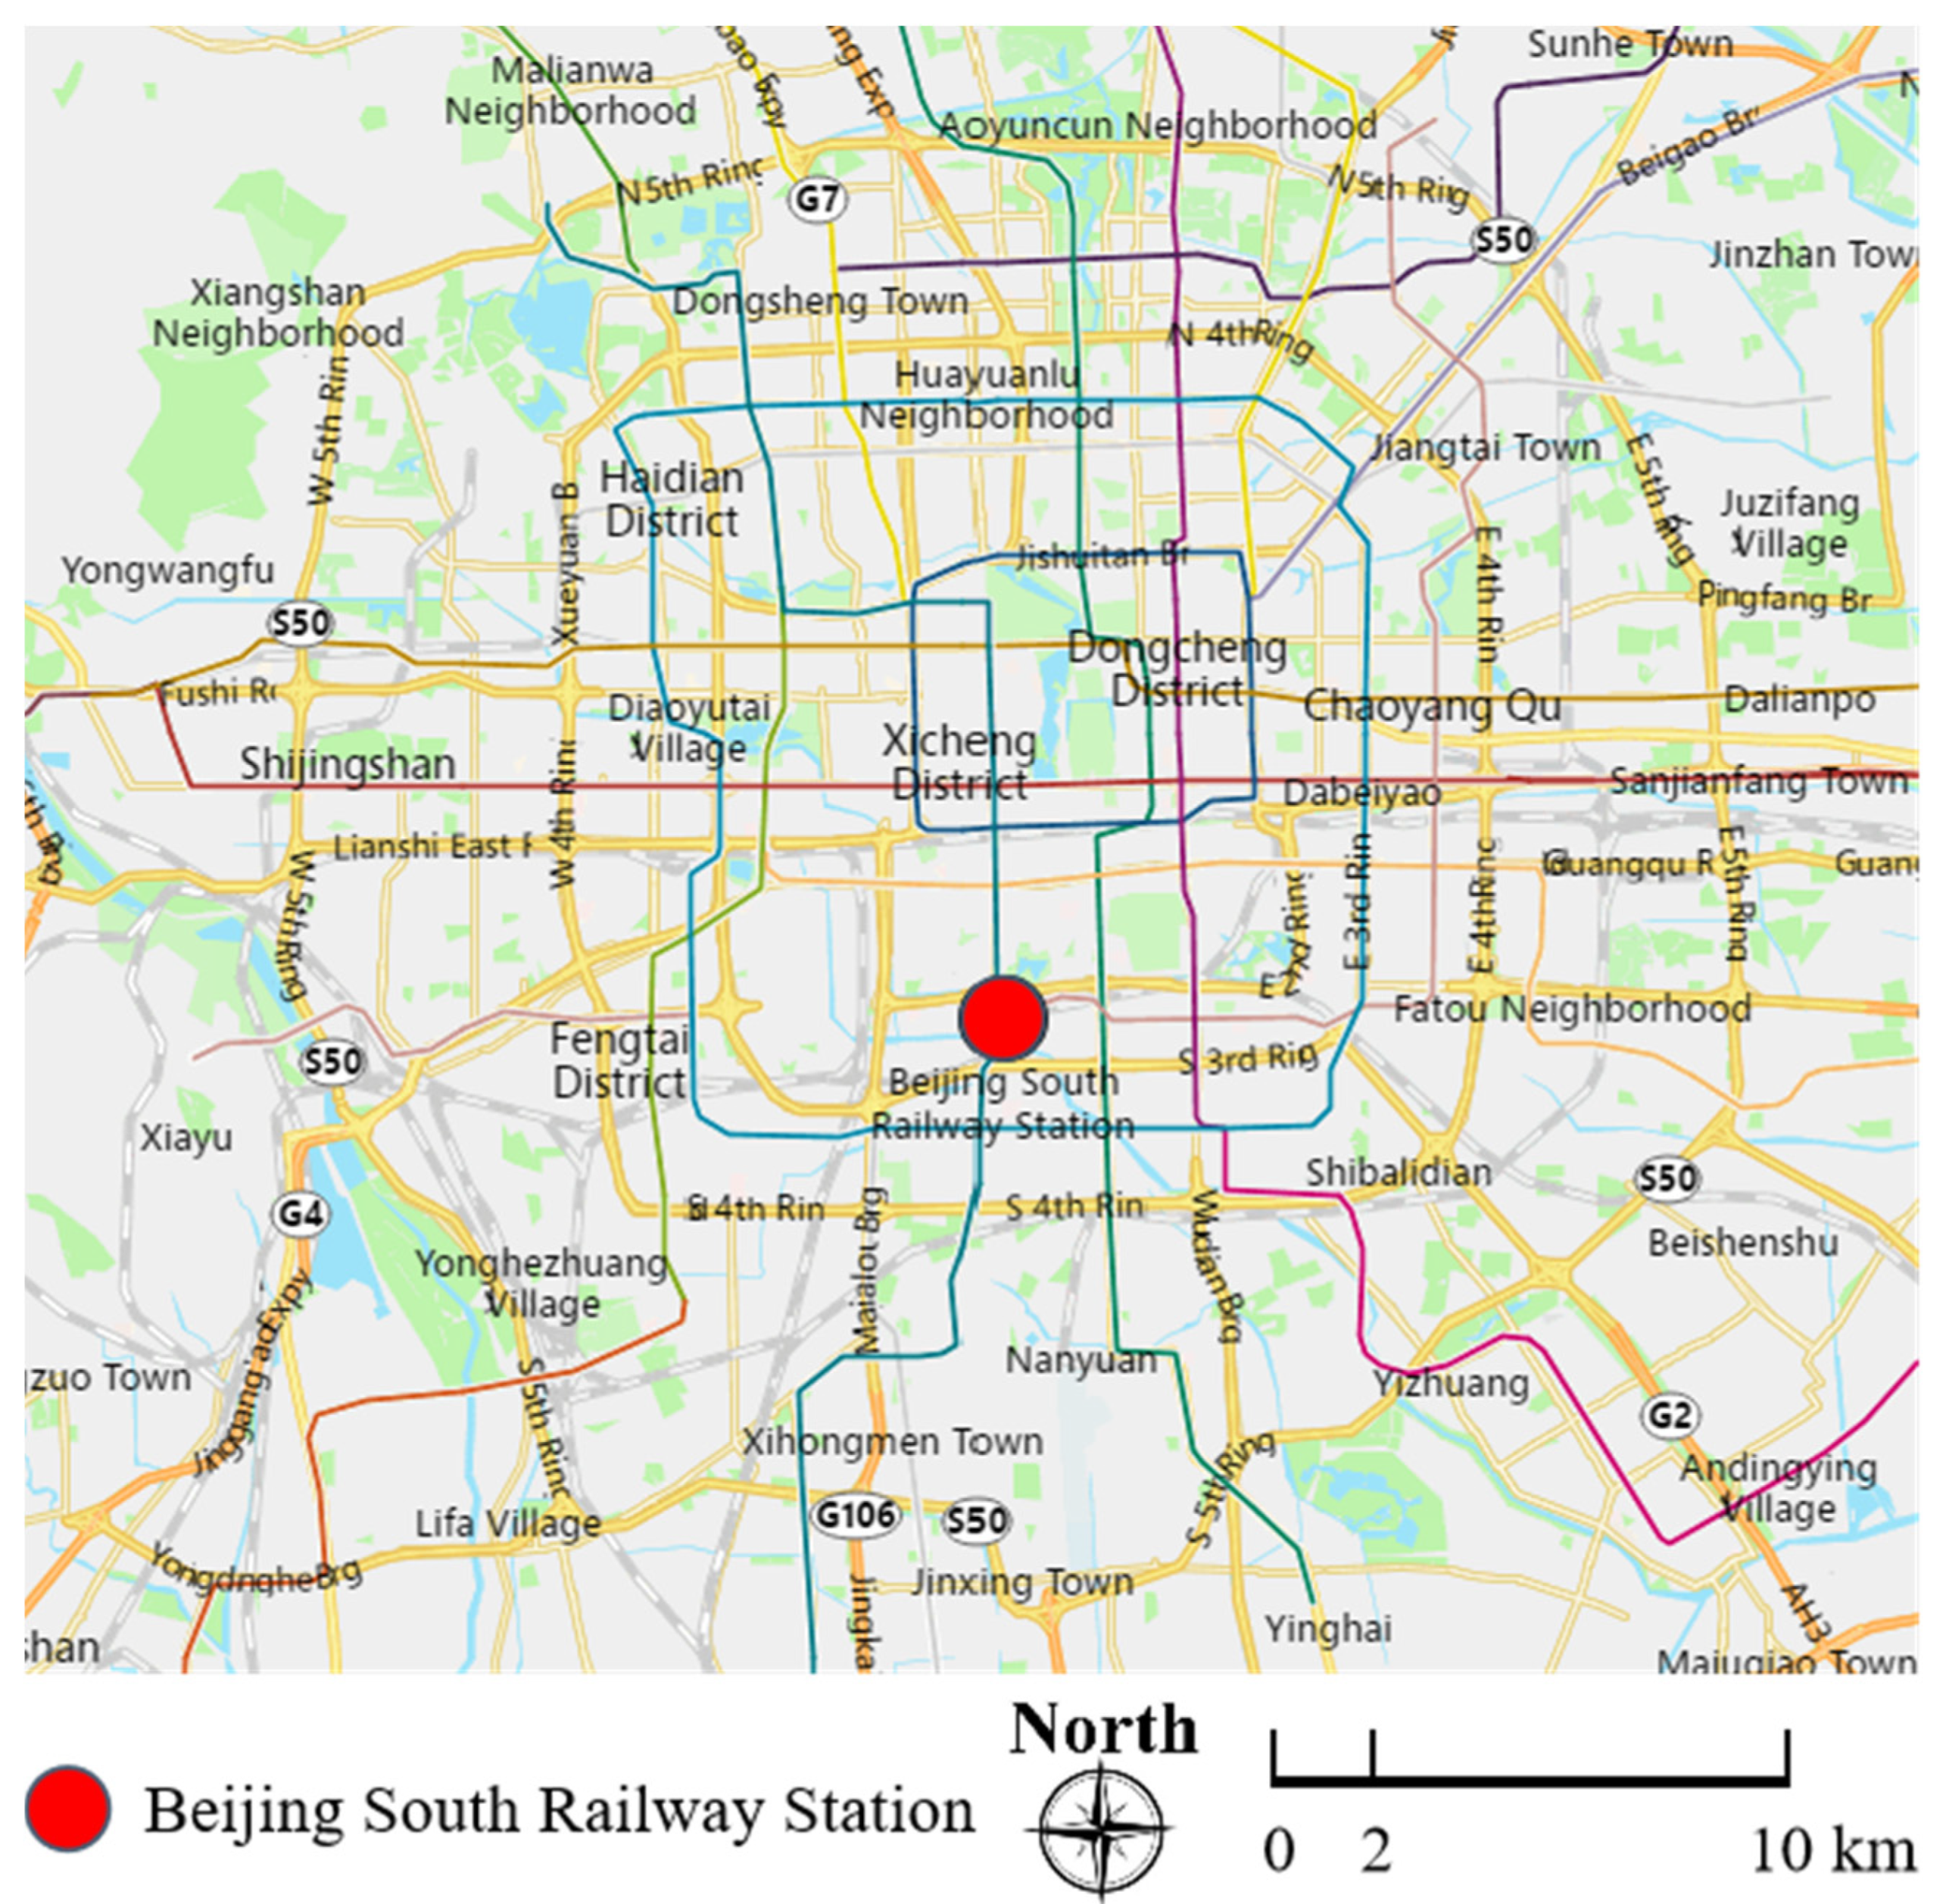
3.2. Survey Design and Data

BSRS is one of the largest integrated transport terminals in Beijing [66], providing HSR, subway (transfer station of subway line 4 and line 14), bus, taxi, and other services. As an important terminal for both urban transport network and HSR network, BSRS was selected as the case study. The location of BSRS is shown in Figure 2.
The survey was grouped into three parts: the trip attributes, the travel characteristics, and the travel experience. The trip attributes included travel mode, departure origin (represented by nearby landmark building, subway station, or bus stop), departure time, expected arrival time, in-vehicle time, walking time, waiting time, and parking time (for private car drivers only). AATT was the sum of the above factors. The time-related questions were recorded by minutes. In order to avoid the error of access travel time, online-map app was used by investigators to query the reasonable time range according to respondents’ starting point and travel mode. The results of online-map app were compared with respondents’ answers of EATT and AATT. For the abnormal access travel time, investigators asked twice on the spot to figure out if the respondents encountered other situations such as waiting for people and losing their way. The investigators determined whether the data was valid or not. Any error of access travel time was declined via the double-check. In the part of travel characteristics, the travel date was acquired. In terms of the travel experience, a scoring system was used for quantitative evaluation on punctuality feeling. The punctuality scores ranged from one to five, representing the subjective feelings from the worst to the best. Descriptive analysis was used to reflect the sample statistics of HSR station trips, as shown in Table 1.
From Table 1, about 70% of HSR travelers come to BSRS by subway. BSRS is an integrated station for HSR and subway. As a transfer subway station, 2 subway lines are available for travelers. Additionally, travelers have a short-distance access to HSR station after their subway trips. These advantages help the subway to provide a punctual, convenient, and cheap choice. Based on the trip attributes part of the survey, over 60% of subway passengers are free of transfer, and less than 10% of subway passengers have to transfer more than once in their trips to BSRS. The widespread network contributes to the huge subway utilization rate. According to the survey results, there is at least one station near their origins for about four fifths of subway passengers. HSR is used for inter-city travelers and they are often with luggage. Nearly two thirds of HSR travelers go to BSRS during the off-peak period. Less traffic congestion and more in-vehicle space can be obtained by the off-peak travelers.

4. Results and Discussions

4.1. Analysis on Accessibility to High Speed Railway Station

To analyze the accessibility to HSR stations, the distribution of AATT under different EATT and the corresponding numbers of HSR station trips are presented in Figure 3. The diamond reflects one respondent and the color gets darker as the number of respondent increases.
EATT has a positive linear correlation with AATT along the line AATT = EATT . When the diamond point is on the line, AATT is equal to EATT. It contains the fluctuation in a certain range. AATT is divergent when EATT increases. The difference between AATT and EATT is due to the inaccuracy of travelers’ estimation.
The accessibility can be represented by the ratio of AATT to EATT. The coefficients can be calculated by fitting EATT and the average AATT. ATT estimation model is the linear-additive form within AATT and EATT, as shown in Equation (4):
γ = T / T 0
where γ is the coefficient of the corresponding scenarios. T is AATT. T 0 is EATT.
If the accessibility to HSR station is insufficient, γ will be greater than 1 and the value of AATT is larger than EATT. Travelers need to spend more time than expected with ATTEE greater than 0. When HSR station provides good accessibility, γ will be less than 1. AATT and EATT will have completely reverse relationship. In this case, travelers will arrive at HSR stations before the expected arrival time. If γ is equal to 1, travelers can arrive at HSR stations as expected with less waiting time and enough time for check-in. For real life, the closer γ is to 1, the better the accessibility and trip experience will be.
Accessibility to HSR station is influenced by travel mode, departure time, and travel date. Accessibility has significant impacts on AATT and EATT. In risk-return model, ATTEE is the part of risk and is related to the sum of the coefficients including travel mode, travel date, and departure time. In this study, the travel mode included subway, bus, taxi, car-hailing, and private car. The travel date consisted of weekday, weekend, and holiday. The departure time contained AM peak, off-peak, and PM peak. The time periods of AM peak, off-peak, and PM peak were 07:00–09:00, 09:00–17:00, and 17:00–19:00, respectively. The value of γ under different scenarios can be obtained by the regression analysis, as shown in Table 2. The sample sizes of private car users on holidays and car-hailing users at weekends were small, and coefficients were not calculated to avoid random errors.
From Table 2, travel date and departure time have influence on ATT estimation of different modes of transport. Equation (4) presents γ for different scenarios of travel mode, travel date, and departure time. In all travel dates, the fitting coefficients of BSRS trip in AM and PM peaks were higher than the coefficients in off-peak period. The results indicate that travelers usually underestimate AATT during the AM peak and PM peak, regardless the travel modes and travel dates. The coefficients of different travel modes ranged from 0.89 to 1.38. During the AM peak and PM peak, the coefficients of private car, taxi and car-hailing were higher than subway. The value of subway coefficient was the smallest at any departure time (the coefficient is close to 1.15), which indicates that subway has the best reliability and accessibility to HSR station. The coefficients of weekend and holiday were similar, slightly higher than that of weekday. The coefficients of all travel modes on weekdays were less than weekend and holiday. This reveals that accessibility to HSR stations is better on weekdays, and travelers can estimate their ATT more accurately.
Accessibility is closely related to the travel mode. The travel mode with high reliability can provide good accessibility, and travelers are able to estimate the ATT in different time periods more accurately, namely with smaller ATTEE. Accurate ATT estimation according to different travel modes can help decrease travelers’ waiting time without missing the train, thus reducing the cumulative number of waiting passengers at HSR station. To study the relationship between the ATT estimation and the accessibility to HSR stations, the samples were classified according to different travel modes, as shown in Figure 4.
The accessibility (represented by the ratio of AATT to EATT) fluctuates in a certain range Figure 3. AATT is divergent when EATT increases. According to survey data of AATT and EATT, the range of AATT can be estimated via accessibility calculation under different travel modes. It will help travelers to choose reasonable departure time and travel mode. The travel mode is an influence factor of AATT and EATT, as discussed above. The maximum and minimum EATT are both linearly related to ATT. The possible range of AATT can be predicted with Equations (5)–(7). Travelers can estimate the range of AATT according to EATT and travel mode.
γ m a x = α i T 0 i = 1 5 a i + M i + b i j ( i = 1 5 M i 1 )  
where γ m a x is the maximum ratio of AATT to EATT, T 0 is EATT, T 0 i is EATT of travel mode i , ( i =1, 2…5, 1: subway; 2: bus; 3: private car; 4: taxi; 5: car-hailing); α i is the ratio of T 0 i to average T 0 ; a i + is the coefficient of maximum AATT, i =1,2…5. If the traveler selects the travel mode i , M i is 1; Otherwise, M i is 0; b i j is the transfer coefficient from travel mode i to travel mode j , if i = j , b i j = 0 ; Otherwise, b i j = 1 .
γ m i n = α i T 0 i = 1 5 a i M i + b i j ( i = 1 5 M i 1 )
  α i T 0 i = 1 5 a i M i + b i j ( i = 1 5 M i 1 ) T α i T 0 i = 1 5 a i + M i + b i j ( i = 1 5 M i 1 )
where a i is the coefficient of minimum AATT of travel mode i ,   i = 1,2, …5. T is AATT.
As shown in Figure 4, for each travel mode, AATT is not evenly distributed on both sides of EATT. The distribution trend of AATT indicates that travelers tend to underestimate ATT they need. AATT can be over 35% larger than EATT in HSR station trips, especially for ground transport travelers including private car, taxi, and car-hailing passengers. It takes longer than expected and they may be late for the check-in time.
In order to verify the model, the calculation results of the model were compared with the subjective evaluations on punctuality from the survey data. From Table 3, subway has an average punctuality score of 4.40, which is the highest over other travel modes. Subway has similar ranges of the maximum/minimum ATT, with the ratios of +0.31 and −0.28 respectively. It shows that passengers have an accurate estimation on ATT of subway due to the good accessibility to HSR stations. Subway has attracted many passengers due to its advantages of punctuality, which is also the most concerned feature for HSR passengers. While for taxi, the ratio of maximum ATT to average ATT is 0.38, nearly three times as much as the value of minimum ATT (−0.14). The results reveal that it is necessary to explore the impact of different travel modes on ATT estimation.

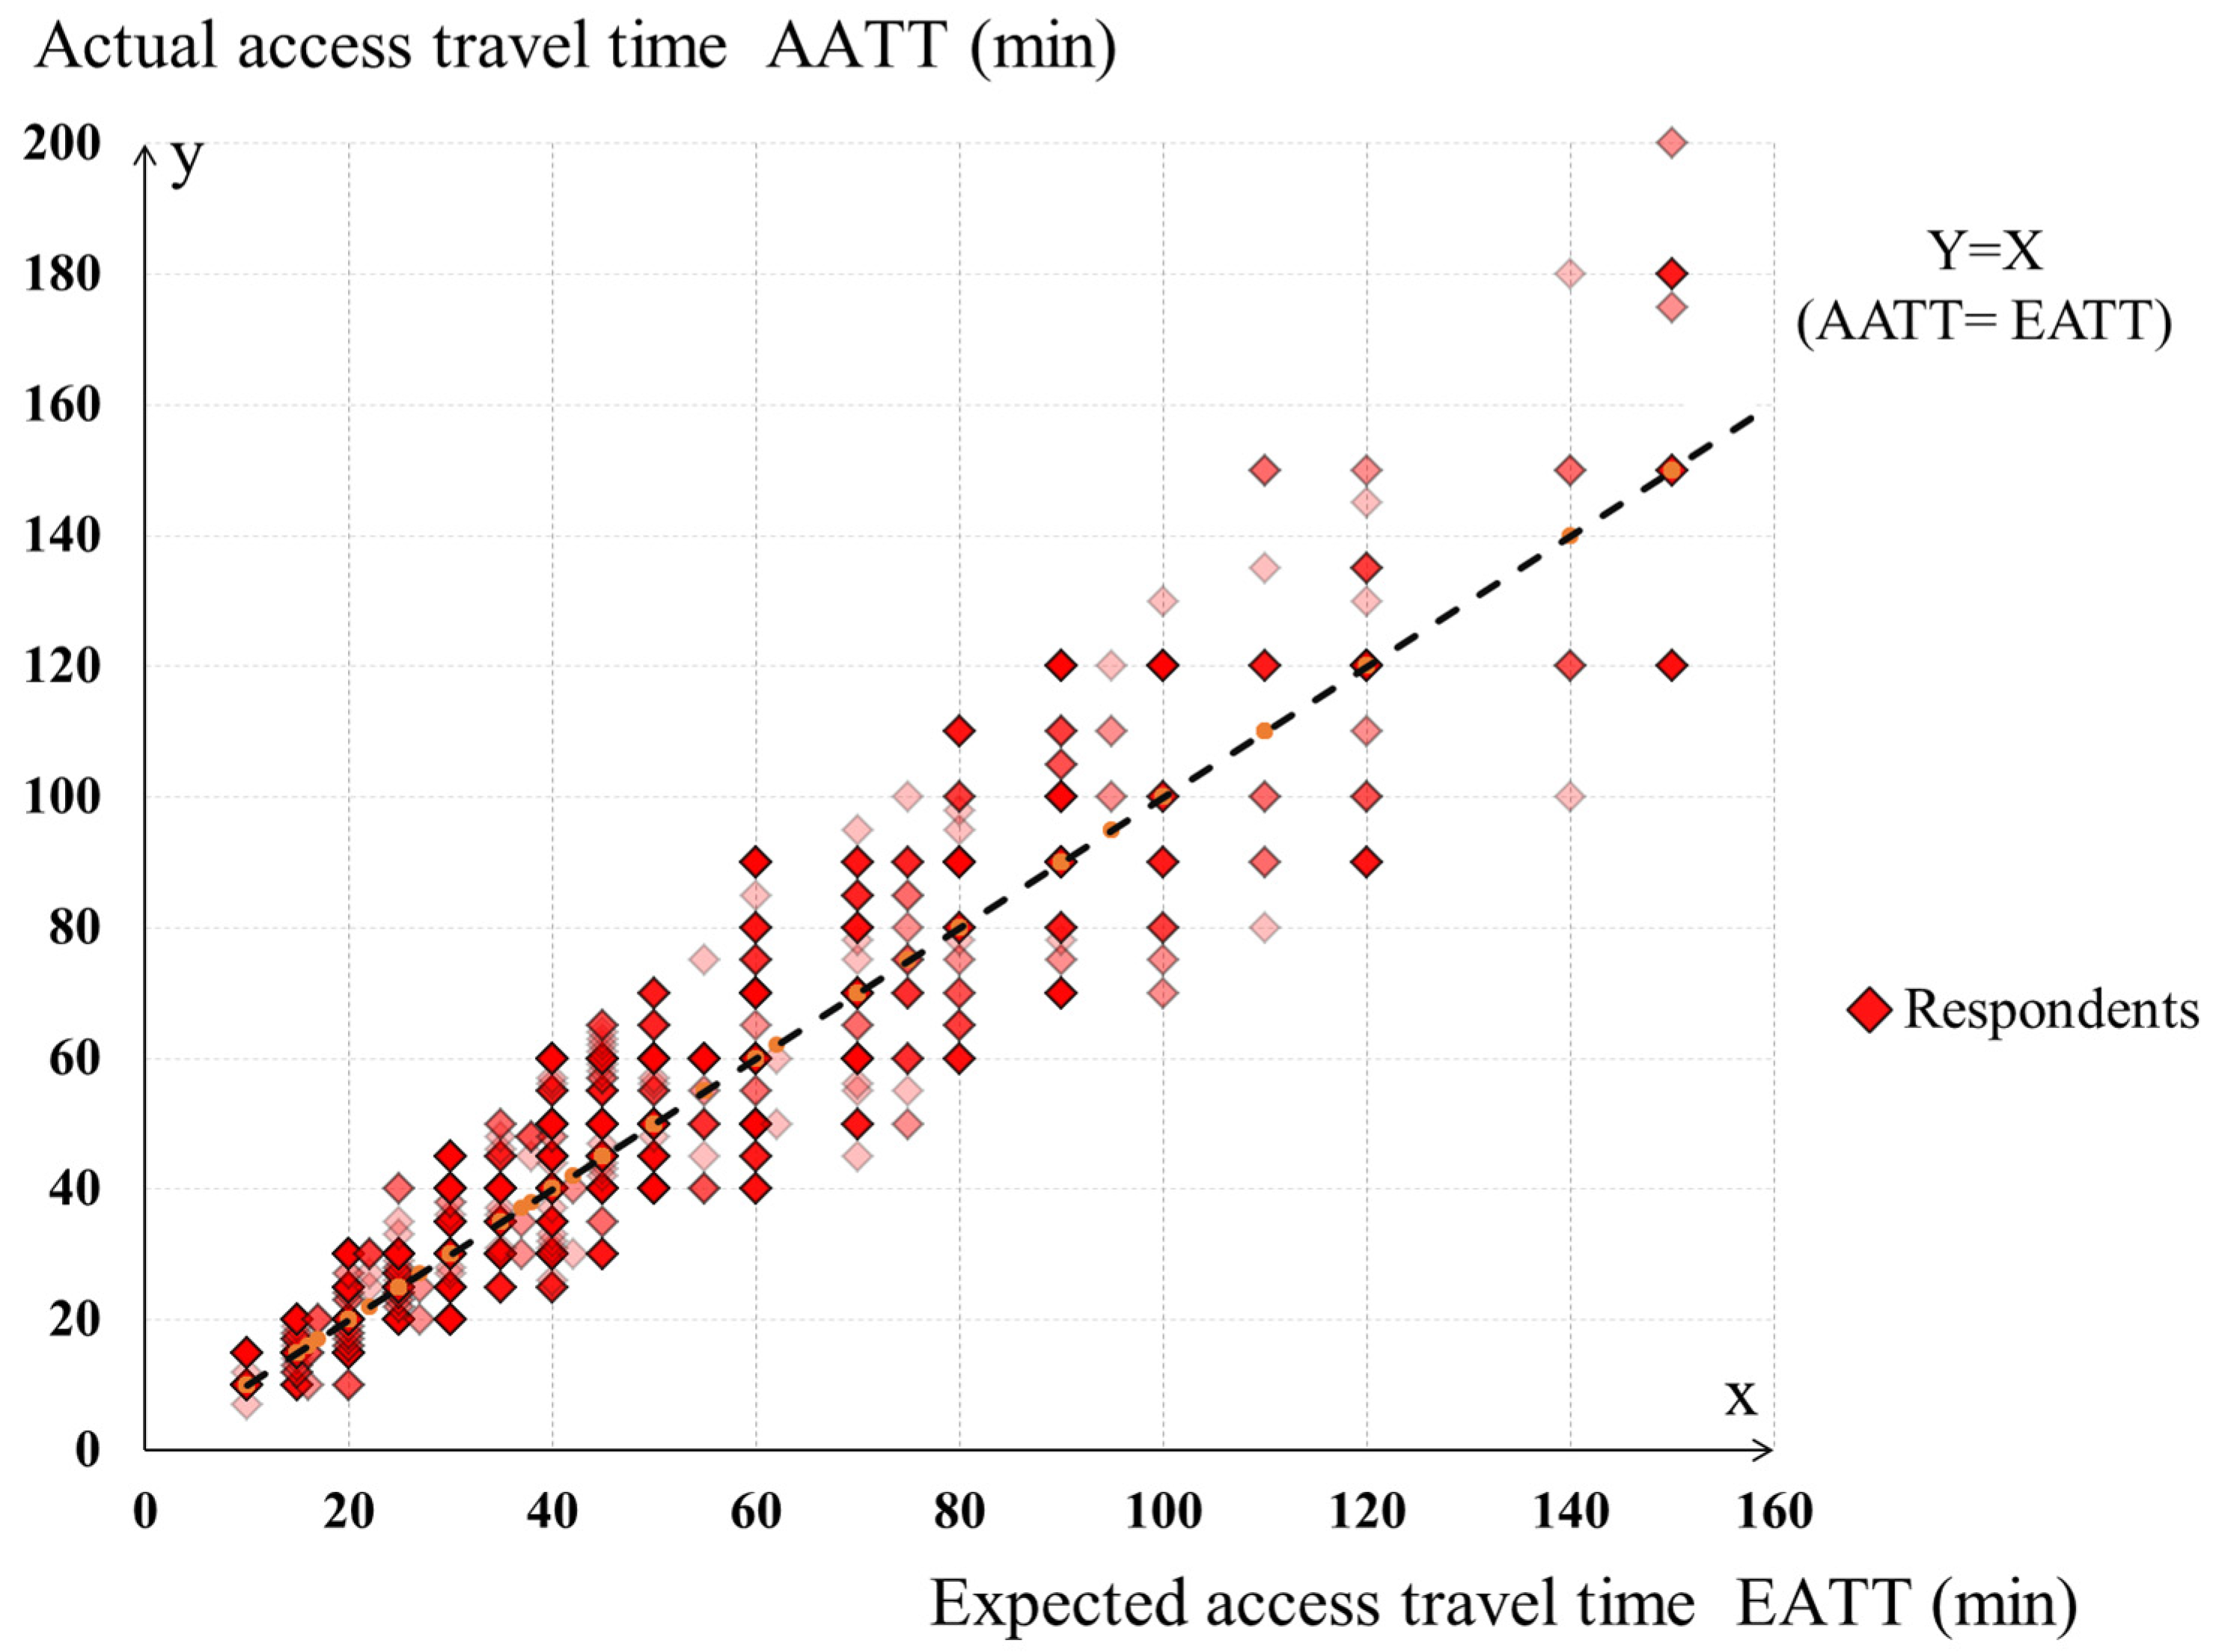
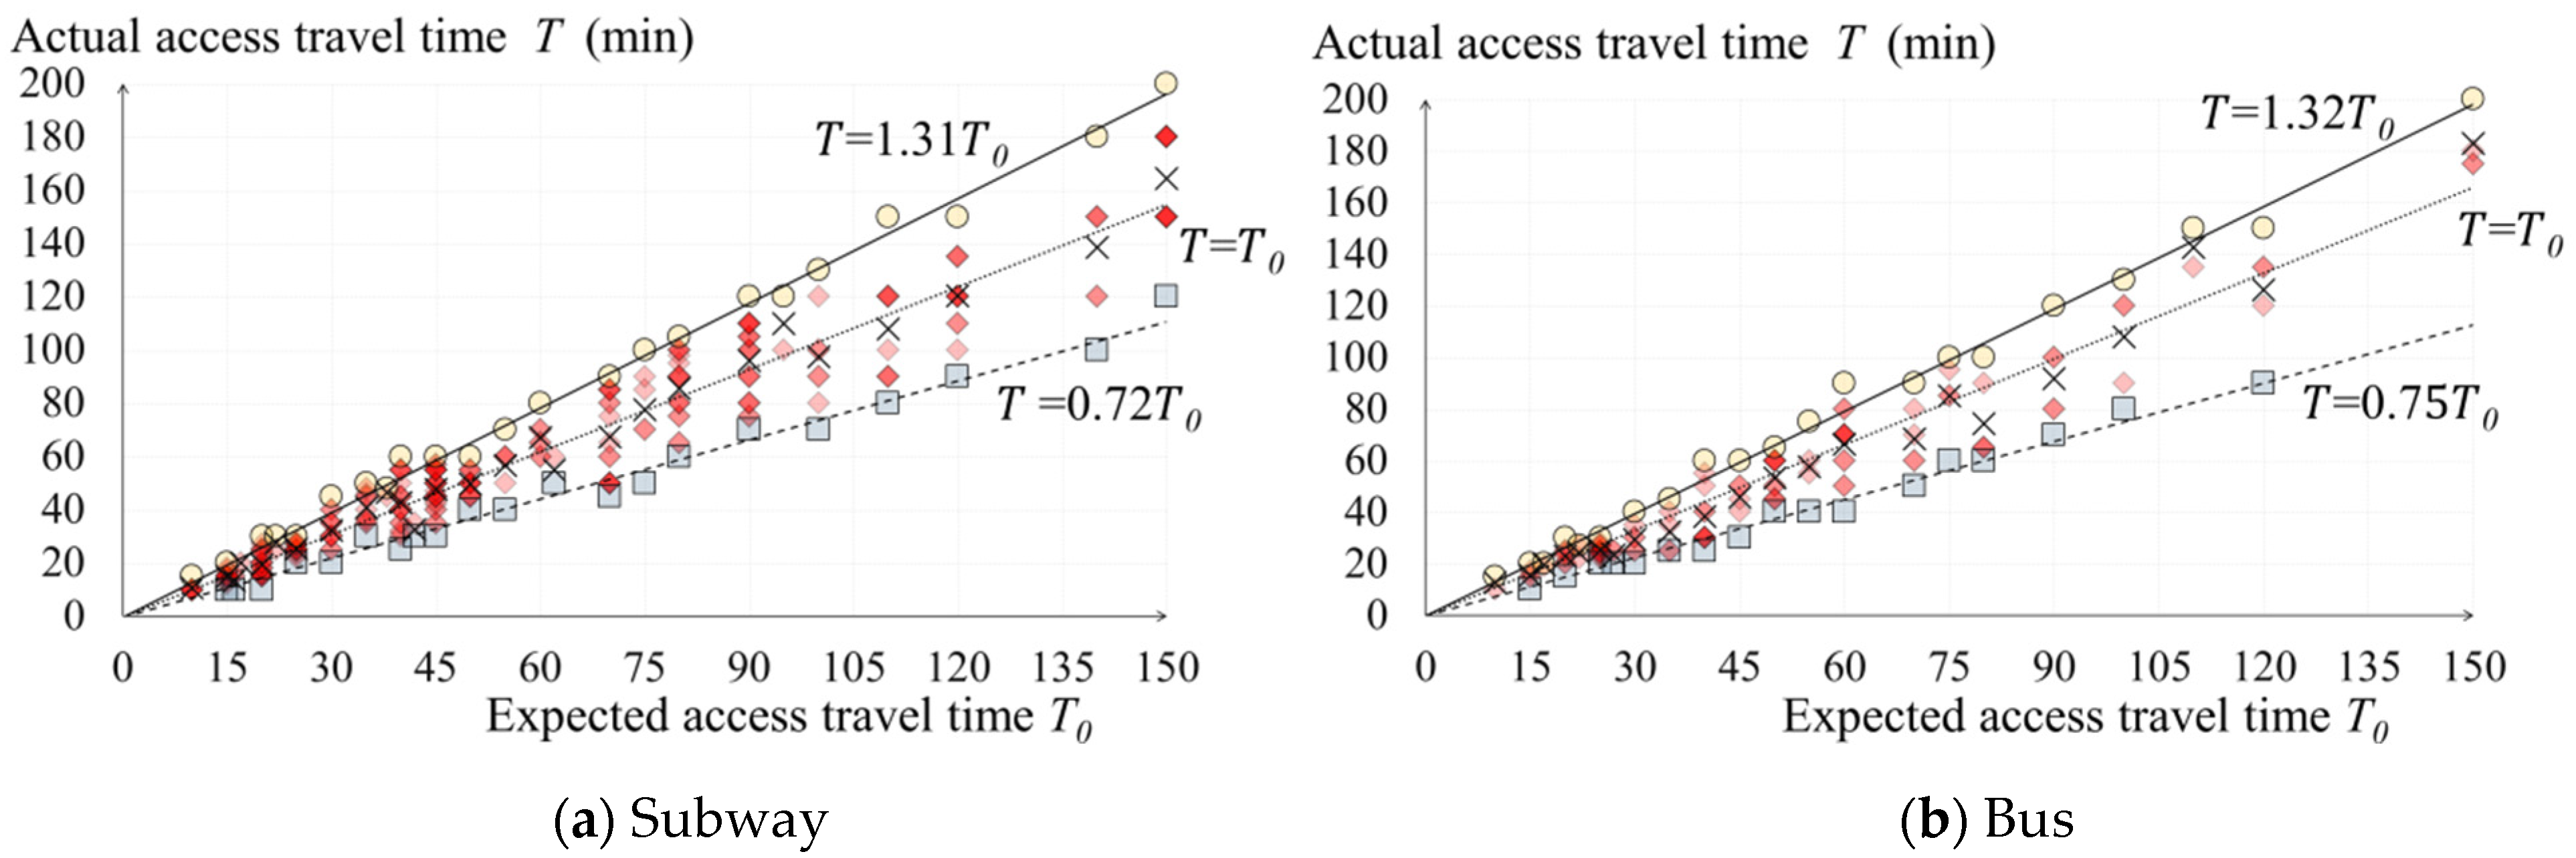
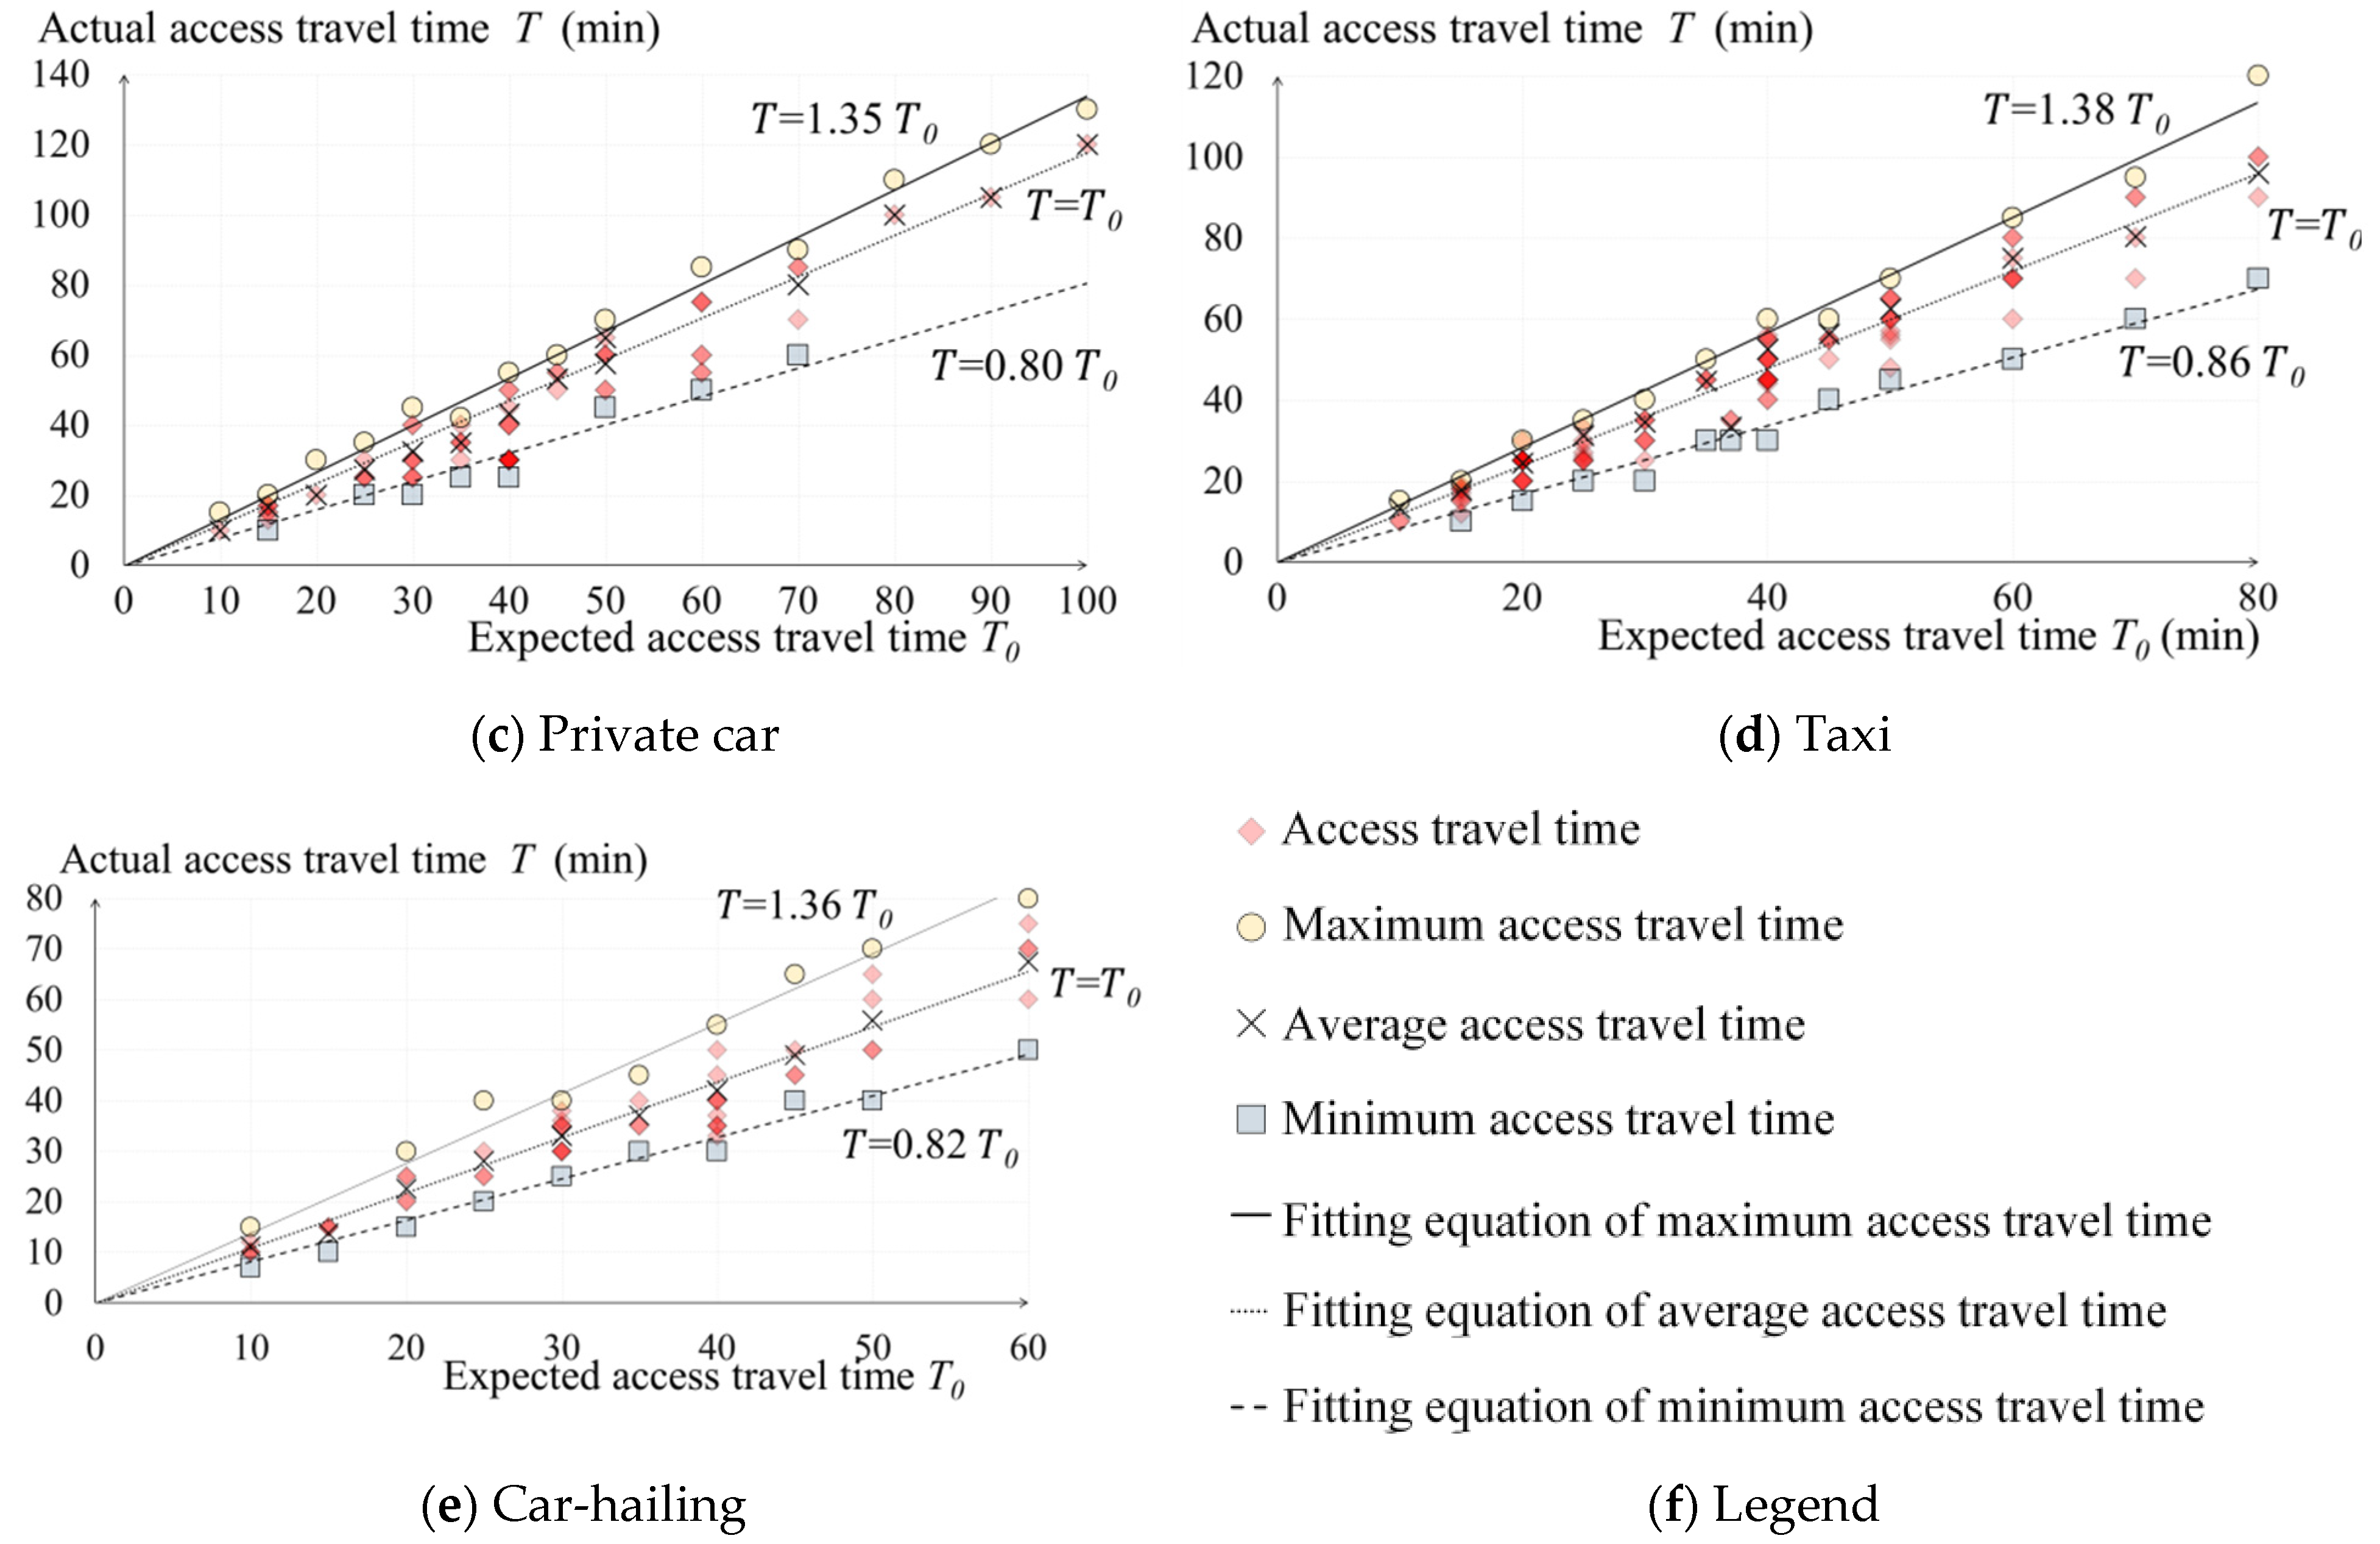
4.2. Modeling of Access Travel Time Estimation

AATT is affected by the travel mode, the departure date, and the travel date. The above factors were set as the virtual variables according to the classification mentioned above. The correlation test was examined between these factors, as shown in Table 4.
As shown in Table 4, the ranges of the significance levels between any two factors were from 0.012 to 0.072, lower than 0.1. Regression analysis shows that there is an independent relationship between travel mode, travel date, and departure time owing to the low significance level. The fitting equations are shown as Equations (8) and (9).
δ = i = 1 5 d i M i + j = 1 3 e j H j + k = 1 3 f k N k
T = ( δ + 1 ) T 0    
where δ is the addition of d i , e j and f k under the certain scenario. ATTEE in different scenarios is directly presented by the value of δ . When δ is greater than 0, ATTEE is greater than 0. On the contrary, when γ is less than 0, ATTEE is less than 0. δ is the accessibility under different scenarios. HSR station trips are subdivided into different scenarios by travel mode, travel date, and departure time. d i ,   e j , and f k are the estimated factors. The values of these factors are 0 or 1, respectively. The estimated values are shown in Table 5.
From Table 5, the smallest coefficient indicates the best travel time reliability and accessibility. Subway provides the most punctual service with the smallest coefficient among other travel modes. The results are consistent with the fact that subway is the most common choice in the access trips to BSRS. As the subway station and HSR station are integrated at BSRS, it takes only 10 min for subway passengers walking to the HSR check-in area, which is convenient for travelers with luggage. The well-developed subway network in Beijing also contributes to the high proportion of subway. Subway passengers can usually arrive at BSRS within one transfer. Improving the connection with feeder modes during the planning and development process is conducive to enhancing the accessibility of HSR stations. Compared with previous studies [62], underground modes are included in the ATT estimation models. The results show that subway is an important feeder mode in access trips to HSR stations, especially when the subway station and HSR station are integrated.
All the coefficients of travel modes are greater than 0, and those of bus, private car, taxi, and car-hailing are even greater than 0.3. It reveals that underestimation on ATT is common for travelers in their access trips to HSR station. The coefficients of travel date are within the range of −0.12 to 0.19, far less than the coefficients of travel modes. Travelers have a better understanding of the relationship between the travel date and the travel time. The coefficient of off-peak is −0.24, while the coefficients of AM peak and PM peak are 0.21 and 0.18, respectively. Traveling at AM peak and PM peak often takes more time than travelers expect. ATT estimation for off-peak trip reflects that travelers have not realized that choosing off-peak hours can reduce travel time. This finding can be used to encourage HSR passengers to consider more reasonable choices of departure time before traveling, therefore their travel efficiency will get improved and the ATTEE can be reduced.
AATT can be calculated from Equations (7)–(9) before HSR station trip, and EATT can be obtained based on AATT. This model offers accurate travel time prediction under different scenarios. At the same time, accordingly, the managers can evaluate the service demand in HSR stations. It can improve the integrative transportation service in the multimodal network. For example, during the off-peak on weekdays, a subway passenger with 60-min EATT is able to catch the check-in time within 80 min due to the good accessibility of subway. If he/she takes a taxi, it may be five minutes late without enough safety margins. On the other side, another characteristic of the subway passengers is that they may arrive much earlier than expected. This phenomenon is getting serious with the raise of ATT. For a 120-min EATT by subway, the probable range of ATT is about 87–157 min. It is very possible that passengers need to wait for half an hour at HSR stations, which will bring increasing demand for waiting space at HSR stations.

5. Conclusions

(1)
The accessibility to HSR stations is closely related to the ATT estimation. Accessibility to HSR station is formulated as the ratio of AATT to EATT. EATT has a positive linear correlation with AATT.
(2)
ATT estimation models in different scenarios are established through regression analysis. The influence factors of EATT and AATT include travel mode, departure time, and travel date. With the largest coefficients from 0.89 to 1.38, travel mode has the most significant impacts on ATT estimation and accessibility. Subway has the best reliability and accessibility to HSR station with the highest punctuality score over other modes.
(3)
This model can help travelers choose the feeder mode with smaller ATTEE. As the EATT becomes more accurate, the accessibility of HSR stations will be enhanced.
This model can help travelers to determine appropriate departure time and travel mode in different scenarios. Travelers can get the benefits of the accessibility and save the waiting time at HSR station. As for the policy makers, this study can provide a scientific basis for the novel method of accessibility calculation. Accurate ATT estimation requires understanding the accessibility of different travel modes, as the provided model brings to light, which is of great value for both HSR travelers and managers.
There are some limitations in the study. The HSR train schedule and the duration between the earliest and the latest check-in time were not investigated. The check-in time duration can be much different due to whether the station is an intermediate station or the departure station. For further research, the ratio of the check-in time duration to the total travel time can be introduced to the model to explore its influence on access travel time estimation.

Author Contributions

Methodology, Y.Z., M.Z., S.T., W.H.K.L., A.C., N.N.S. and Y.C.; formal analysis, M.Z. and S.T.; investigation, Y.Z., S.T., A.C., N.N.S. and Y.C.; original draft, Y.Z., M.Z. and S.T.; review and editing, Y.Z., M.Z., W.H.K.L., A.C., N.N.S. and Y.C.; funding acquisition, Y.Z. and W.H.K.L. All authors have read and agreed to the published version of the manuscript.

Funding

The work described in this paper was supported in parts of the following research grants: the National Key Research and Development Program of China (No. 2018YFB1600900), the Beijing Natural Science Foundation Program (L181002), the Beijing Municipal Education Commission, the General Program of Science and Technology (No. KM201810005017), the Research Grants Council of the Hong Kong Special Administrative Region, China (No. PolyU 152095/17E), and the Research Committee of the Hong Kong Polytechnic University (4-ZZFY), for a joint research project with Beijing University of Technology.

Acknowledgment

The authors appreciate the kind assistance from 1595 respondents in the survey and 15 postgraduate student investigators from Beijing University of Technology.

Conflicts of Interest

The authors declare no conflict of interest.

References

  1. Marr, P.; Sutton, C. Changes in accessibility in the Meseta Purépecha region of Michoacán, exico: 1940–2000. J. Transp. Geogr. 2007, 15, 465–475. [Google Scholar] [CrossRef]
  2. Martínez, H.S.; Givoni, M. The accessibility impact of a new high-speed rail line in the UK—A preliminary analysis of winners and losers. J. Transp. Geogr. 2012, 25, 105–114. [Google Scholar] [CrossRef]
  3. Cao, J.; Liu, X.C.; Wang, Y.; Li, Q. Accessibility impacts of China’s high-speed rail network. J. Transp. Geogr. 2013, 28, 12–21. [Google Scholar] [CrossRef]
  4. Shaw, S.L.; Fang, Z.X.; Lu, S.W.; Tao, R. Impacts of high speed rail on railroad network accessibility in China. J. Transp. Geogr. 2014, 40, 112–122. [Google Scholar] [CrossRef]
  5. Wang, L.; Liu, Y.; Sun, C.; Liu, Y. Accessibility impact of the present and future high-speed rail network: A case study of Jiangsu Province, China. J. Transp. Geogr. 2016, 54, 161–172. [Google Scholar] [CrossRef]
  6. Yang, H.; Zhang, A. Effects of high-speed rail and air transport competition on prices, profits and welfare. Transp. Res. Part B Methodol. 2012, 46, 1322–1333. [Google Scholar] [CrossRef]
  7. Abrate, G.; Viglia, G.; Garcia, J.S.; Forgas-Coll, S. Price competition within and between airlines and high-speed trains: The case of the Milan-Rome route. Tour. Econ. 2016, 22, 311–323. [Google Scholar] [CrossRef] [Green Version]
  8. Krishnan, V.; Kastrouni, E.; Pyrialakou, V.D.; Gkritza, K.; McCalley, J.D. An optimization model of energy and transportation systems: Assessing the high-speed rail impacts in the United States. Transp. Res. Part C Emerg. Technol. 2015, 54, 131–156. [Google Scholar] [CrossRef]
  9. Wang, F.; Wei, X.; Liu, J.; He, L.; Gao, M. Impact of high-speed rail on population mobility and urbanisation: A case study on Yangtze River Delta urban agglomeration, China. Transp. Res. Part A Pol. Pract. 2019, 127, 99–114. [Google Scholar] [CrossRef]
  10. Zhang, W.; Nian, P.; Lyu, G. A multimodal approach to assessing accessibility of a high-speed railway station. J. Transp. Geogr. 2016, 54, 91–101. [Google Scholar] [CrossRef]
  11. Jia, S.; Zhou, C.; Qin, C. No difference in effect of high-speed rail on regional economic growth based on match effect perspective? Transp. Res. Part A Pol. Pract. 2017, 106, 144–157. [Google Scholar] [CrossRef]
  12. Lu, S.M. A low-carbon transport infrastructure in Taiwan based on the implementation of energy-saving measures. Renew. Sustain. Energy Rev. 2016, 58, 499–509. [Google Scholar] [CrossRef]
  13. Cheng, Y.; Chen, S. Perceived accessibility, mobility, and connectivity of public transportation systems. Transp. Res. Part A Pol. Pract. 2015, 77, 386–403. [Google Scholar] [CrossRef]
  14. Chen, Z.; Xue, J.; Rose, A.Z.; Haynes, K.E. The impact of high-speed rail investment on economic and environmental change in China: A dynamic CGE analysis. Transp. Res. Part A Pol. Pract. 2016, 92, 232–245. [Google Scholar] [CrossRef]
  15. High-Speed Rail in China. Available online: https://encyclopedia.thefreedictionary.com/High-speed+rail+in+China (accessed on 16 September 2020).
  16. Shinkansen. Available online: https://encyclopedia.thefreedictionary.com/Shinkansen (accessed on 16 September 2020).
  17. ICE. Available online: https://www.bahn.com/en/view/trains/long-distance/ice-ice-sprinter.shtml?dbkanal_007=L04_S02_D002_KIN0059_FLYOUT-ZUGFLOTTE-ICE-UEBERPUNKT_LZ01 (accessed on 16 September 2020).
  18. TGV. Available online: https://www.eurail.com/en/get-inspired/trains-europe/high-speed-trains/tgv (accessed on 16 September 2020).
  19. Finance China. Available online: http://finance.china.com.cn/news/20190924/5087467.shtml (accessed on 12 November 2019).
  20. China Railway. Available online: https://www.chnrailway.com/html/20190705/1875327.shtml (accessed on 16 September 2020).
  21. Hansen, W.G. How accessibility shapes land use. J. Am. Inst. Plan. 1959, 25, 73–76. [Google Scholar] [CrossRef]
  22. Geurs, K.T.; Ritsema, J.R. Accessibility Measures: Review and Applications. Evaluation of Accessibility Impacts of Land-Use Transport Scenarios, and Related Social and Economic Impact. In RIVM Report 408505 006, National Institute of Public Health and the Environment; Universiteit Utrecht-URU: Bilthoven, The Netherlands, 2001. [Google Scholar]
  23. Geurs, K.T.; Wee, B.V. Accessibility evaluation of land-use and transport strategies: Review and research directions. J. Transp. Geogr. 2004, 12, 127–140. [Google Scholar] [CrossRef]
  24. Bristow, G.; Farrington, J.; Shaw, J.; Richardson, T. Developing an evaluation framework for crosscutting policy goals: The accessibility policy assessment tool. Environ. Plan. A 2009, 41, 48–62. [Google Scholar] [CrossRef]
  25. El-Geneidy, A.; Levinson, D.; Diab, E.; Boisjoly, G.; Verbich, D.; Loong, C. The cost of equity: Assessing transit accessibility and social disparity using total travel cost. Transp. Res. Part A Pol. Pract. 2016, 91, 302–316. [Google Scholar] [CrossRef] [Green Version]
  26. Erlander, S.; Stewart, N.F. The gravity model in transportation analysis: Theory and extensions. Environ. Plan. B Plan. Des. 1992, 19, 232–233. [Google Scholar]
  27. Li, L.; Ren, H.; Zhao, S.; Duan, Z.; Zhang, Y.; Zhang, A. Two dimensional accessibility analysis of metro stations in Xi’an, China. Transp. Res. Part A Pol. Pract. 2017, 106, 414–426. [Google Scholar] [CrossRef]
  28. Litman, T. Measuring transportation: Traffic, mobility and accessibility. ITE J. Inst. Transp. Eng. 2003, 73, 28–32. [Google Scholar]
  29. McGrail, M.R.; Humphreys, J.S. Measuring spatial accessibility to primary care in rural areas: Improving the effectiveness of the two-step floating catchment area method. Appl. Geogr. 2009, 29, 533–541. [Google Scholar] [CrossRef]
  30. Talen, E. Neighborhoods as Service Providers: A Methodology for Evaluating Pedestrian Access. Environ. Plan. B Plan. Des. 2003, 30, 181–200. [Google Scholar] [CrossRef]
  31. Nicole, F.; Kevin, M.; El-Geneidy, A. Toward equitable transit: Examining transit accessibility and social need in Toronto, Canada, 1996–2006. In Proceedings of the 92nd Transportation Research Board Meeting, Washington, DC, USA, 13–17 January 2013. [Google Scholar]
  32. Can, V.V. Estimation of travel mode choice for domestic tourists to Nha Trang using the multinomial probit model. Transp. Res. Part A Pol. Pract. 2013, 49, 149–159. [Google Scholar] [CrossRef] [Green Version]
  33. Hasnine, M.S.; Graovac, A.; Camargo, F.; Habib, K.N. A random utility maximization (RUM) based measure of accessibility to transit: Accurate capturing of the first-mile issue in urban transit. J. Transp. Geogr. 2019, 74, 313–320. [Google Scholar] [CrossRef]
  34. Nassir, N.; Hickman, M.; Malekzadeh, A.; Irannezhad, E. A utility-based travel impedance measure for public transit network accessibility. Transp. Res. Part A Pol. Pract. 2016, 88, 26–39. [Google Scholar] [CrossRef]
  35. Miller, H.J. Measuring space-time accessibility benefits within transportation networks: Basic theory and computational procedures. Geogr. Anal. 1999, 31, 187–212. [Google Scholar] [CrossRef]
  36. Ho, C.; Mulley, C. Tour-based mode choice of joint household travel patterns on weekend and weekday. Transportation 2013, 40, 789–811. [Google Scholar] [CrossRef]
  37. Wang, B.; Shao, C.; Ji, X. Dynamic analysis of holiday travel behaviour with integrated multimodal travel information usage: A life-oriented approach. Transp. Res. Part A Pol. Pract. 2017, 104, 255–280. [Google Scholar] [CrossRef]
  38. Ziemke, D.; Joubert, J.W.; Nagel, K. Accessibility in a post-apartheid city: Comparison of two approaches for accessibility computations. Netw. Spat. Econ. 2018, 18, 241–271. [Google Scholar] [CrossRef]
  39. Rahman, K.M.A.; Zhang, D. Analyzing the level of accessibility of public urban green spaces to different socially vulnerable groups of people. Sustainability 2018, 10, 3917. [Google Scholar] [CrossRef] [Green Version]
  40. Zhang, J.; Cheng, Y.; Wei, W.; Zhao, B. Evaluating spatial disparity of access to public parks in gated and open communities with an improved G2SFCA model. Sustainability 2019, 11, 5910. [Google Scholar] [CrossRef] [Green Version]
  41. Xu, Y.; Song, W.; Liu, C. Social-spatial accessibility to urban educational resources under the school district system: A case study of public primary schools in Nanjing, China. Sustainability 2018, 10, 2305. [Google Scholar] [CrossRef] [Green Version]
  42. Geng, J.; Long, R.; Chen, H. Impact of information intervention on travel mode choice of urban residents with different goal frames: A controlled trial in Xuzhou, China. Transp. Res. Part A Pol. Pract. 2016, 91, 134–147. [Google Scholar] [CrossRef]
  43. Prasertsubpakij, D.; Nitivattananon, V. Evaluating accessibility to Bangkok Metro Systems using multi-dimensional criteria across user groups. LATSS Res. 2012, 36, 56–65. [Google Scholar] [CrossRef] [Green Version]
  44. Bivina, G.R.; Gupta, A.; Parida, M. Influence of microscale environmental factors on perceived walk accessibility to metro stations. Transp. Res. Part D Transp. Environ. 2019, 67, 142–155. [Google Scholar] [CrossRef]
  45. Chen, Z.; Wang, Y. Impacts of severe weather events on high-speed rail and aviation delays. Transp. Res. Part D Transp. Environ. 2019, 69, 168–183. [Google Scholar] [CrossRef]
  46. Chen, Z. Impacts of high-speed rail on domestic air transportation in China. J. Transp. Geogr. 2017, 62, 184–196. [Google Scholar] [CrossRef]
  47. Li, T.; Rong, L.; Yan, K. Vulnerability analysis and critical area identification of public transport system: A case of high-speed rail and air transport coupling system in China. Transp. Res. Part A Pol. Pract. 2019, 127, 55–70. [Google Scholar] [CrossRef]
  48. Zhao, J.; Zhao, Y.; Li, Y. The variation in the value of travel-time savings and the dilemma of high-speed rail in China. Transp. Res. Part A Pol. Pract. 2015, 82, 130–140. [Google Scholar] [CrossRef]
  49. Asa, B.; Gliebe, J.; Strathman, J. Modeling access mode choice for inter-suburban commuter rail. J. Public Transp. 2014, 14, 23–42. [Google Scholar]
  50. Chen, S.; Leng, Y.; Mao, B.; Liu, S. Integrated weight-based multi-criteria evaluation on transfer in large transport terminals: A case study of the Beijingnan Railway station. Transp. Res. Part A Pol. Pract. 2014, 66, 13–26. [Google Scholar] [CrossRef]
  51. Liu, R.; Chen, Y.; Wu, J.; Xu, T.; Gao, L.; Zhao, X. Mapping spatial accessibility of public transportation network in an urban area—A case study of shanghai Hongqiao transportation hub. Transp. Res. Part D Transp. Environ. 2018, 59, 478–495. [Google Scholar] [CrossRef]
  52. Tang, J.; Zhen, F.; Cao, J.; Mokhtarian, P.L. How do passengers use travel time? A case study of Shanghai-Nanjing high speed rail. Transportation 2017, 45, 451–477. [Google Scholar] [CrossRef]
  53. Gentili, M.; Mirchandani, P.B. Review of optimal sensor location models for travel time estimation. Transp. Res. Part C Emerg. Technol. 2018, 90, 74–96. [Google Scholar] [CrossRef]
  54. Kianfar, J.; Edara, P. Optimizing freeway traffic sensor locations by clustering global-positioning-system-derived speed patterns. IEEE Trans. Intell. Transp. Syst. 2010, 11, 738–747. [Google Scholar] [CrossRef]
  55. Ban, X.; Chu, L.; Herring, R.; Margulici, J.D. Sequential modeling framework for optimal sensor placement for multiple intelligent transportation system applications. J. Transp. Eng. 2011, 137, 112–120. [Google Scholar] [CrossRef]
  56. Moyano, A.; Moya-Gómez, B.; Gutiérrez, J. Access and egress times to high-speed rail stations: A spatiotemporal accessibility analysis. J. Transp. Geogr. 2018, 73, 84–93. [Google Scholar] [CrossRef]
  57. Bartin, B.; Ozbay, K.; Iyigun, C. Clustering-based methodology for determining optimal roadway configuration of detectors for travel time estimation. Transp. Res. Rec. 2007, 2000, 98–105. [Google Scholar] [CrossRef]
  58. Zhou, Y.; Yao, L.; Gong, Y.; Chen, Y. Time estimation model of subway transfer. Springerplus. 2016, 5, 44–54. [Google Scholar] [CrossRef] [Green Version]
  59. Yu, B.; Lam, W.H.K.; Tam, M.L. Bus arrival time estimation at bus stop with multiple routes. Transp. Res. Part C Emerg. Technol. 2011, 19, 1157–1170. [Google Scholar] [CrossRef]
  60. Yang, L.; Zhou, X. Constraint reformulation and a Lagrangian relaxation-based solution algorithm for a least expected time path problem. Transp. Res. Part B Methodol. 2014, 59, 22–44. [Google Scholar] [CrossRef]
  61. Tam, M.L.; Lam, W.H.K.; Lo, H. Modeling air passenger travel behavior on airport ground access mode choices. Transportmetrica 2008, 4, 135–153. [Google Scholar] [CrossRef]
  62. Koster, P.; Kroes, E.; Verhoef, E. Travel time variability and airport accessibility. Transp. Res. Part B Methodol. 2011, 45, 1545–1559. [Google Scholar] [CrossRef] [Green Version]
  63. Takada, K.; Miyauchi, K.; Fujiu, M. Departure time decision of railway commuters considering different buffer time distribution. J. East. Asia Soc. Transp. Stud. 2017, 12, 565–579. [Google Scholar]
  64. Fosgerau, M. On the relation between the mean and variance of delay in dynamic queues with random capacity and demand. J. Econ. Dyn. Control 2010, 34, 598–603. [Google Scholar] [CrossRef] [Green Version]
  65. Carrion, C.; Levinson, D. Value of travel time reliability: A review of current evidence. Transp. Res. Part A Pol. Pract. 2012, 46, 720–741. [Google Scholar] [CrossRef] [Green Version]
  66. Beijing South Railway Station. Available online: https://en.wikipedia.org/wiki/Beijing_South_railway_station (accessed on 12 September 2018).
Figure 1. Time components for access trips to high speed railway station.
Sustainability 12 07827 g001
Figure 2. The location of Beijing South Railway Station in Beijing urban area.
Sustainability 12 07827 g002
Figure 3. Scatter plots of expected access travel time and actual access travel time.
Sustainability 12 07827 g003
Figure 4. Scatter plots of expected access travel time and actual access travel time by different travel modes: (a) Subway; (b) Bus; (c) Private car; (d) Taxi; (e) Car-hailing; (f) Legend.
Sustainability 12 07827 g004aSustainability 12 07827 g004b
Table 1. Descriptive statistics of the sample (n = 1595).
AttributesDistributionPercentage (%)
Travel modeSubway69.5
Bus8.2
Taxi12.4
Car-hailing4.0
Private car5.9
Departure timeAM peak27.7
Off-peak65.9
PM peak7.4
Actual access travel time (min)<3014.2
30–5952.9
60–8921.3
90–1196.7
≥1204.9
Travel dateWeekday34.2
Weekend33.8
Holiday32.0
Punctuality score12.2
22.5
311.2
429.8
554.3
Table 2. Value of coefficients under different scenarios.
Travel DateDeparture TimeValue of γ in Different Travel Modes
SubwayBusPrivate CarTaxiCar-Hailing
WeekdayAM peak1.121.311.281.321.33
Off-peak0.890.990.940.950.94
PM peak1.151.311.341.361.31
WeekendAM peak1.161.321.331.35
Off-peak0.921.030.970.98
PM peak1.181.371.351.38
HolidayAM peak1.141.311.341.34
Off-peak0.951.050.990.98
PM peak1.181.321.371.35
Table 3. Punctuality scores and ranges of access travel time (ATT) for different travel modes.
Travel ModeAverage Punctuality ScoreMaximum ATT/Average ATTMinimum ATT/Average ATT
Subway4.401.31 (+0.31)0.72 (−0.28)
Bus4.091.32 (+0.32)0.75 (−0.25)
Private car3.641.35 (+0.35)0.80 (−0.20)
Taxi4.281.38 (+0.38)0.86 (−0.14)
Car-hailing4.311.36 (+0.36)0.85 (−0.15)
Table 4. Correlation test between travel mode, travel date, and departure time.
Sig.FactorTravel ModeTravel DateDeparture Time
Factor
Travel mode1
Travel date0.072 *1
Departure time0.045 **0.012 **1
Sig. is short for Significance levels. Significance levels: * Significant at 0.1, ** Significant at 0.05.
Table 5. Value of coefficient of each scenario.
FactorScenarioCoefficient
Travel modeSubway ( M 1 )0.15
Bus ( M 2 )0.30
Private car ( M 3 )0.32
Taxi ( M 4 )0.34
Car-hailing ( M 5 )0.31
Travel dateWeekday ( H 1 )–0.12
Weekend ( H 2 )0.19
Holiday ( H 3 )0.15
Departure timeAM peak ( N 1 )0.21
Off-peak ( N 2 )–0.24
PM peak ( N 3 )0.18

