Experimental and Numerical Analysis of a Sustainable Farming Compartment with Evaporative Cooling System


1
Department of Civil and Environmental Engineering, University of Nebraska-Lincoln, Omaha, NE 68588-0531, USA
2
Department of Mechanical and Materials Engineering, University of Nebraska-Lincoln, Lincoln, NE 68588-0526, USA
*
Author to whom correspondence should be addressed.
Processes 2019, 7(11), 823; https://doi.org/10.3390/pr7110823
Submission received: 4 August 2019
/
Revised: 14 October 2019
/
Accepted: 29 October 2019
/
Published: 6 November 2019
(This article belongs to the Special Issue CFD Modeling of Complex Chemical Processes: Multiscale and Multiphysics Challenges)
Abstract
:The United Arab Emirates (UAE) relies on groundwater as well as desalinated water which are very expensive and energy-concentrated. Despite the lack of water resources, only 54% of wastewater was recycled in the UAE in 2016. In this study, a Sustainable Farming Compartment (SFC) with an evaporative cooling system is investigated as an alternative to reusing wastewater and the optimal design is identified experimentally and numerically. First, the applicability of the SFC was examined to reduce the ambient temperature in the system. A prototype SFC was tested in the environmentally constrained laboratory and field site considering an extreme climate condition (with high temperature and humidity) in Abu Dhabi to evaluate the temperature drop and humidity change of the SFC. The experimental results showed that the temperature of the SFC significantly decreases by 7–15 °C when the initial relative humidity is 50%. For validation, an energy modeling using dynamic numerical simulations was performed that shows statistically good agreement with the experimental results. Based on the parametric studies of the system components, the optimal cooling performance of the system in terms of locations of inlet and outlet, the variation of Reynolds number was evaluated. The study suggested an optimized design for the SFC with an evaporative cooling system.
1. Introduction
Desertification, the process of land degradation leading the land to become desert, is one of the most significant environmental problems of the Arabian Peninsula region. Despite the national, regional and international collaboration to combat desertification and to mitigate the damage of drought, desertification is still one of the major environmental concerns in the area [1,2]. In the United Arab Emirates (UAE), wind erosion due to prevailing hyper-arid conditions, insufficient vegetation and the strong wind have contributed to the serious degradation of land and ground soils [3,4]. For instance, the process of desertification can be accelerated as the fertile topsoil is removed by wind erosion [4,5]. Therefore, it is important to reduce wind erosion for protecting the environment and mitigating desertification.
The UAE is classified as a hyper-arid climate with less than 120 mm of average annual rainfall [6], which causes a high dependence on groundwater resources and desalinated water. However, these resources are very expensive and highly energy-concentrated. Despite the lack of water resource, only 54% of wastewater was recycled in the UAE in 2016 and the remaining 48% was disposed into the sea near Abu Dhabi [7]. Moreover, the wastewater will continuously increase by 10% until 2030 because of the development of the urban area, the growing population and the enhancement of life quality in Abu Dhabi [8]. The government of Abu Dhabi ambitiously plans to reuse 100% of its wastewater by 2030 to resolve this situation [7,8]. However, the main challenge associated with recycling treated wastewater is that a distribution system has not been developed [7]. Nowadays, the treated wastewater is mostly used for irrigation of public areas such as parks and roadways and for district cooling in residential areas. However, the amount of recycling is insufficient to meet the amount of production [7]. Therefore, the development of any other ways to reuse more treated wastewater is warranted to increase the recycling rate of the water in the region.
Recently, the sustainable agricultural complex referred to as the “Oasis” complex was proposed [8] as an alternative method to mitigate wind erosion and desertification as well as to increase the recycling rate. The complex is expected to decrease the temperature inside the structure by using renewable energy from the evaporative cooling system and solar panels with the treated wastewater providing the conditions for raising plants. However, the applicability of the components comprising the complex has not been thoroughly studied and validated.
In this study, we investigated the performance and effectiveness of the Sustainable Farming Compartments (SFC) as a part of the “Oasis” complex to control the inside temperature in the climate conditions in the UAE. A prototype of the SFC at half-scale was developed and tested in an environmentally constrained laboratory and field site considering the climate conditions in Abu Dhabi. Furthermore, energy modeling via dynamic numerical simulations of the SFC was conducted to evaluate the heat transfer and stabilization in the SFC and to compare with the experimental results. The parametric studies of the system components were performed numerically in terms of locations of inlet and outlet, the variation of Reynolds number. Based on the results, an optimized design for the SFC was identified.
1.1. Sustainable Farming Compartment (SFC)
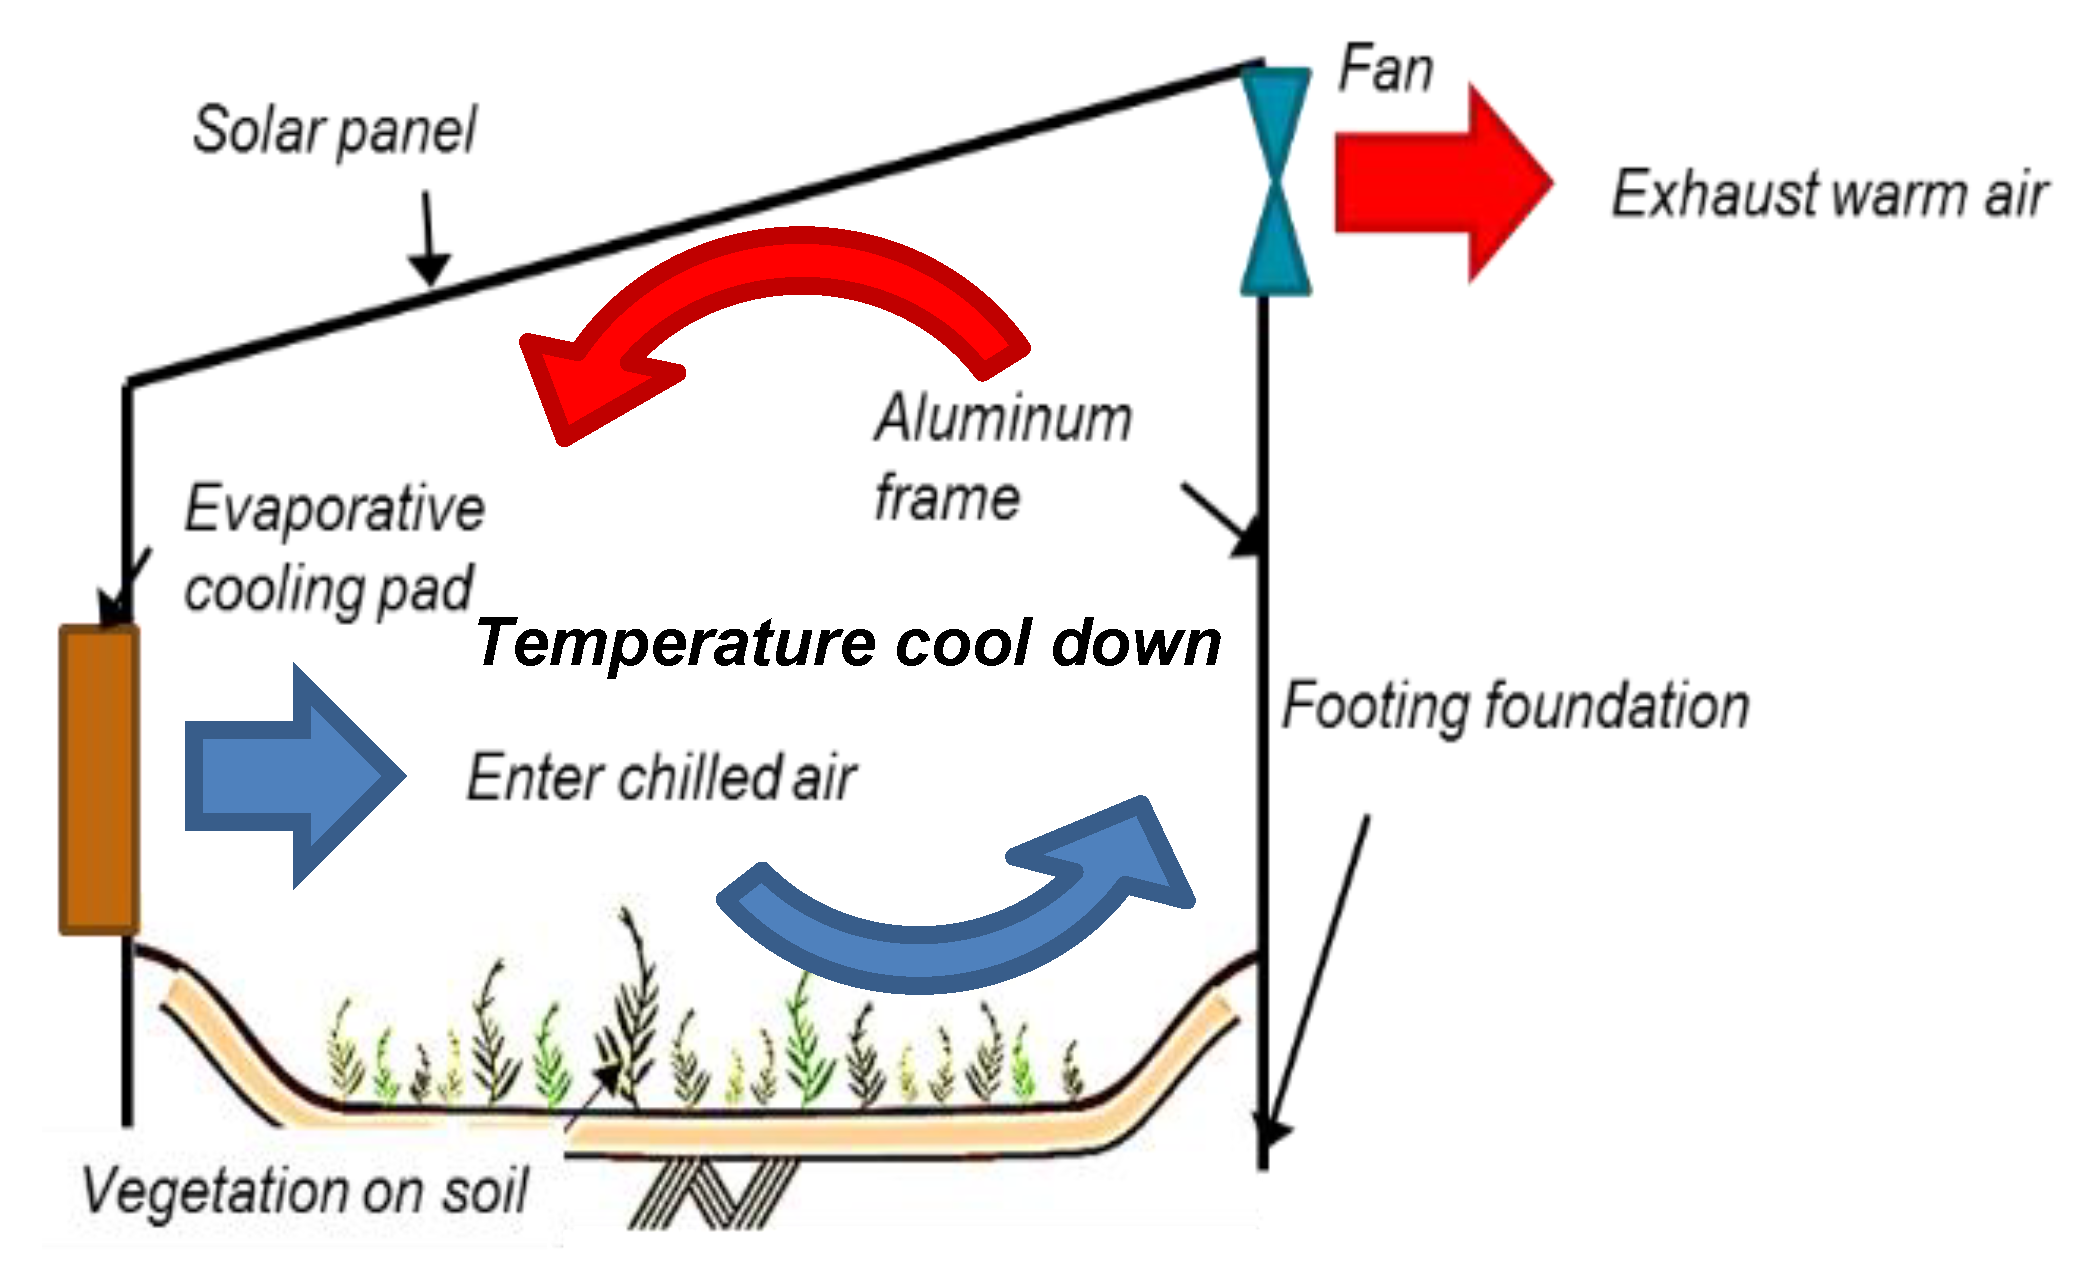
The SFC is designed to install exhaust fans in the front and an evaporative cooling pad in the backside. The pad is wetted by treated wastewater to decrease the interior temperature. The ambient air in the SFC is cooled by using the heat in the air to evaporate the water from an adjacent surface, as shown in Figure 1. Selected agricultural plants under lower sunlight in shaded conditions can be raised in the compartment even during outside hot-dry weather by maintaining a relatively low temperature inside [9]. Hence, a preliminary investigation of the environmentally controlled laboratory and field site is necessary to evaluate the feasibility and effectiveness of the SFC when subjected to the actual climatic conditions in Abu Dhabi.
1.2. Evaporative Cooling System
The SFC contains a direct evaporative cooling system with a proper water supply system and cooling pad that use treated wastewater to reduce the inside temperature. The design of the evaporative cooling system intends to decrease the inside temperature by evaporating the water and absorbing the latent heat. The temperature of dry air can be considerably decreased through the phase change of water from liquid to vapor (evaporation). This phenomenon will decrease the temperature of the air using much less energy than refrigeration [10,11,12]. The cooling potential for evaporative cooling fully relies on the wet-bulb depression that is the difference between dry-bulb temperature and the wet-bulb temperature according to the psychrometric chart. In the SFC system, the humidity is important [13,14]. While the direct evaporative cooling system runs, the relative humidity increases because of the air coming into direct contact with water of the cooling pad and its vaporization. Accordingly, the temperature in the SFC will not decrease when the humidity theoretically reaches 100% but practically, the temperature does not drop when the moisture reaches around 85% [15,16]. Therefore, it is crucial to monitor variations of humidity to analyze the process and compare the results with the chart.
Many studies have been conducted to investigate the performance of evaporative cooling systems. Ibrahim et al. achieved a drop of 6–8 °C dry bulb temperature with a 30% increase in relative humidity using a direct evaporative cooling system supported by porous ceramics in Nottingham [15]. Lertsatitthanakorn et al. studied the effect of a 1.8 m by 3.6 m direct evaporative cooling pad in a 32-m2 silkworm-rearing house in Maha Sarakham, Thailand. Their results show that 6–13 °C dry bulb temperature decreases with increasing 30–40% relative humidity. Further economic analysis showed a 2.5 year payback period for this system, indicating its cost-effectiveness [16]. Heidarinejad et al. provided a two-stage indirect/direct evaporative cooling system experiment in various climate conditions in Iran. They showed that in regions with high wet bulb temperature, this system can be used instead of mechanical vapor compressions with one-third of their energy consumption. Their results also show that the two-stage system has 55% more water consumption than a direct evaporative cooling system that favors the latter system in arid areas [17]. Recently, Aljubury and Ridha conducted a two-stage indirect/direct evaporative system using groundwater to study its effect on the greenhouse in the Iraq desert climate. The results showed 12.1–21.6 °C decrease in temperature and increase of relative humidity from 8% to 62% compared to the ambient condition [18].
2. Materials and Methods
2.1. Prototype SFC
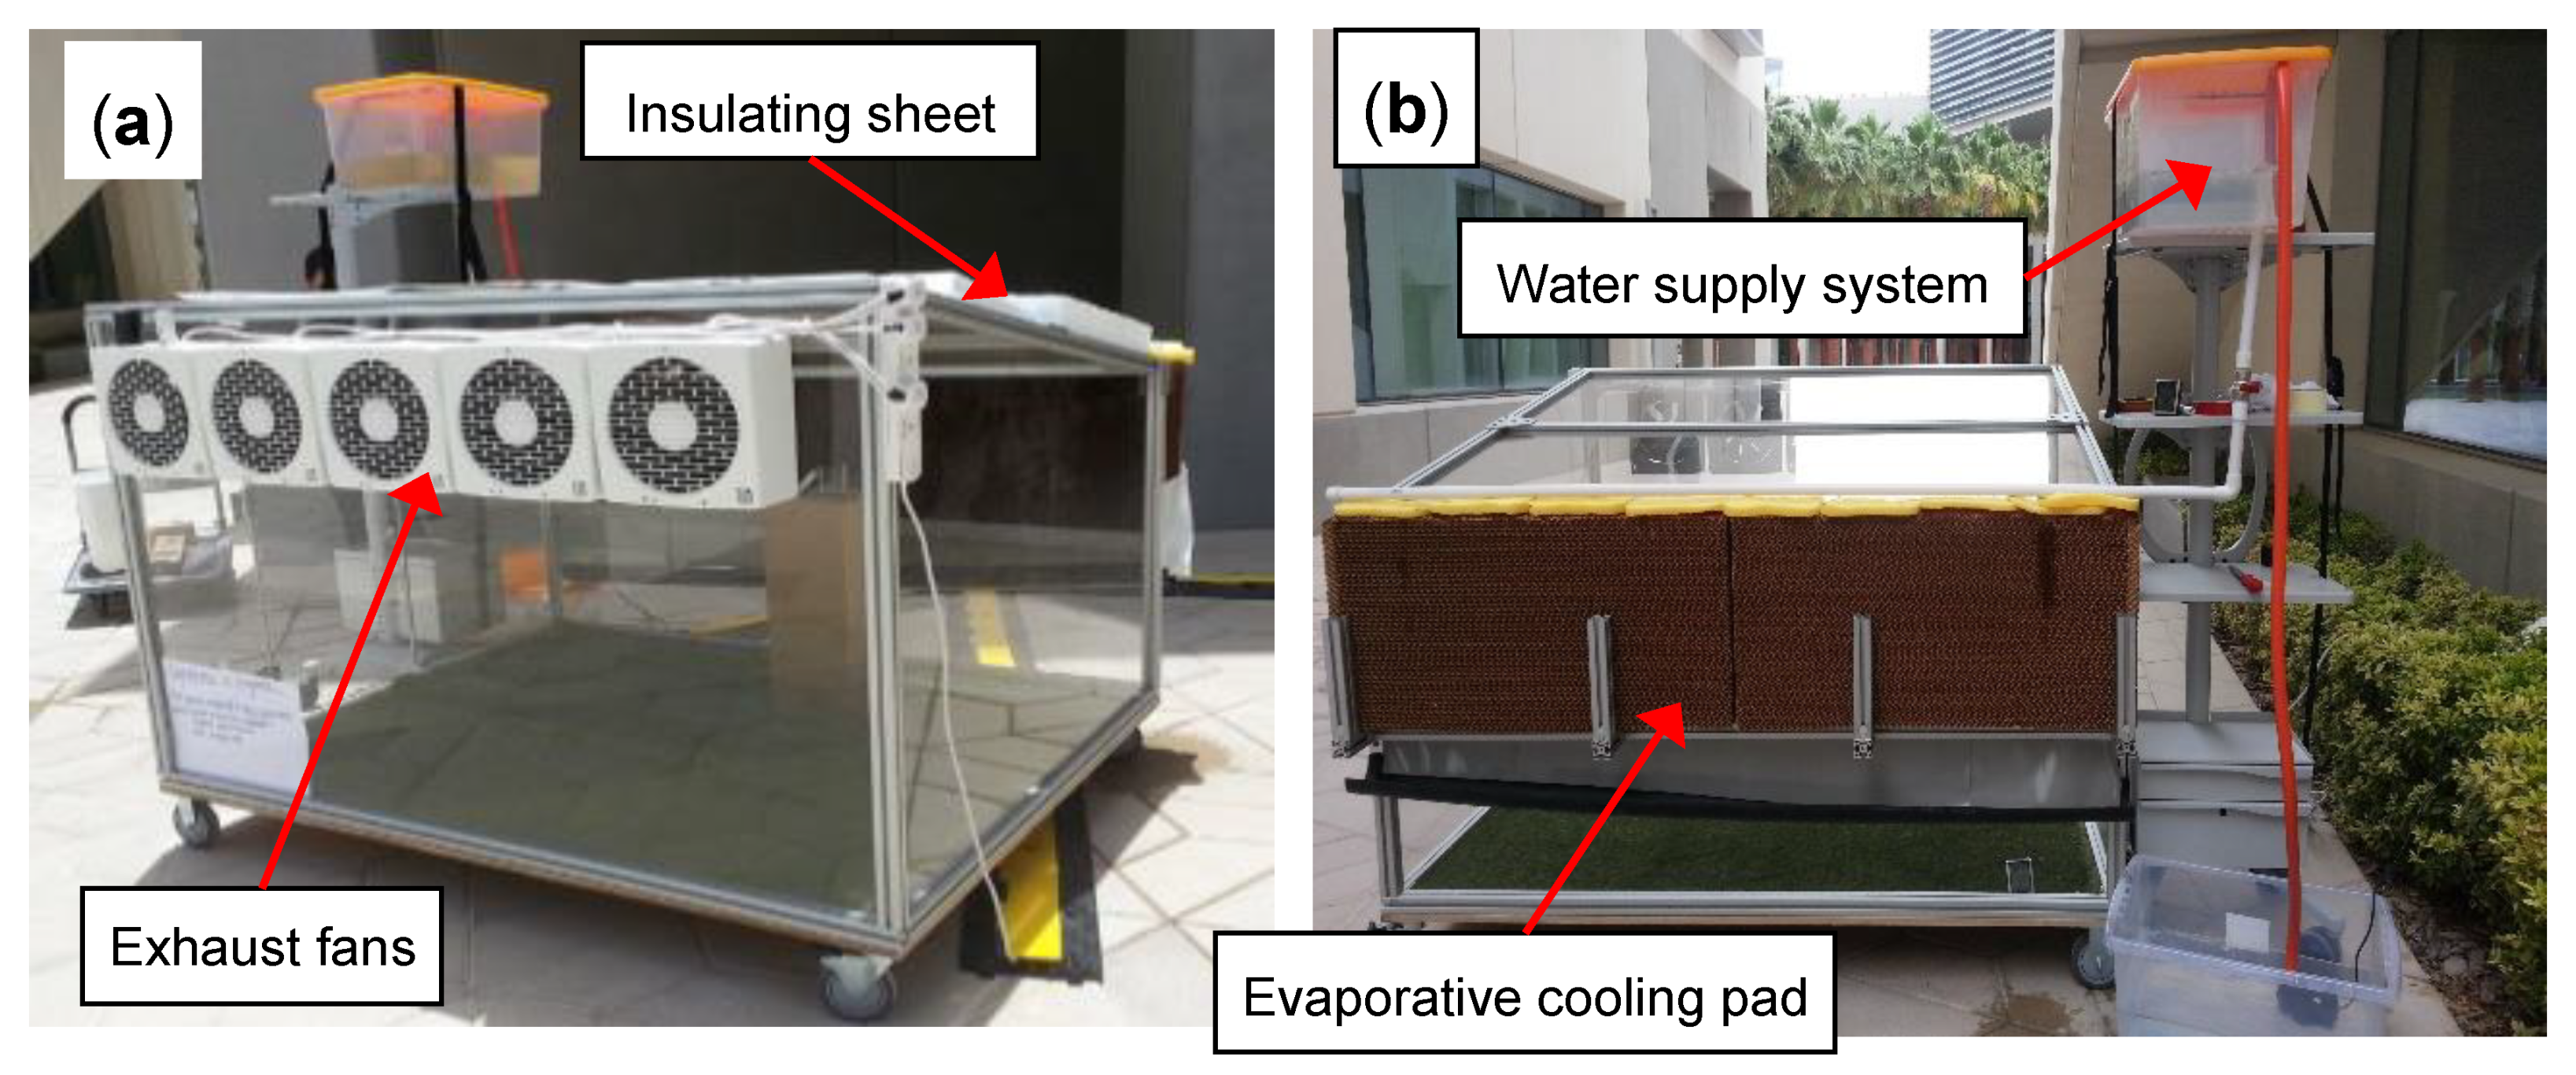
A prototype SFC that is half the scale of the actual structure was constructed with aluminum frames (40 × 40 mm) manufactured by 80/20 Material Inc. (Columbia City, IN, USA) (Figure 2). The frame was easily assembled with mechanical bonding alone to provide full stability for the structure. The dimension of the SFC used was 1.2 m of the front height, 1.8 m of width, 1.5 m of depth and 0.9 m of the back height. The structural analysis, using SAP 2000, was performed to confirm the structural stability of the SFC. The bottom was constructed with plywood and the walls were constructed with Plexiglas panels which have approximately three to five times lower thermal conductivity (=0.2 W·m−1·K−1) in comparison with glass. The materials in the wall and bottom allow limited heat transport. The roof was covered with the white color-polystyrene insulated sheet (with the thickness = 0.05 m) to reduce direct solar radiation into the compartment. On the upper wall of the front side, five exhaust fans with 190 cubic feet per minute (CFM) per fan were installed. On the backside, a cardboard cooling pad (0.1 × 0.45 × 1.8 m3) where the absorption of the latent heat occurs by the evaporating water, was installed. The pressure in the evaporative cooling system was assumed to be identical to the atmospheric pressure because the SFC was opened to the atmosphere and the distribution of the pressure was not considered in the simulation. Four portable sensors with 12-bit resolution were installed at the center of the compartment. The inside sensor was located at 0.75 m from the front wall, 0.9 m from the side wall and 0.45 m from the bottom plate. The outside roof and the ambient outside sensors were near the SFC to monitor the variations in temperature and humidity during the test. The resolution of the temperature and humidity is 0.5 °C and 0.05%, respectively. The accuracy is typically ±0.5 °C for temperature and ±2.5% for humidity. The data were collected every sixty seconds. The SFC was placed near the campus of New York University Abu Dhabi (NYUAD) during the test, which is a typical weather condition in the UAE.
For the water supplying system, 30 mm-polyvinyl chloride (PVC) pipes were used to connect 0.12 m3-upper and lower water reservoirs. The valve was installed to control water flow rate during the test. Tap water was used for the test and refilled the reservoirs adequately. The water was distributed evenly to the pad from the upper reservoir to fully wet the pad. Since the water was reused in the system, the temperature was not varied significantly. The water pump was installed in the lower reservoir to recirculate the water in the system. The pad was initially saturated with 10 L of water. The flow rate and hydraulic gradient of the water supply system are approximately 5 L/hr and 0.5 m/m, respectively.
The original design of SFC included the solar photo voltaic (PV) panels with adequate insulation on the roof to enhance the energy efficiency of the SFC in the “Oasis” complex; thus, the prototype of SFC with polyethylene (PE) polymer insulation was consistent with the original one. However, the applicability of the solar panels should be carefully investigated in terms of power capacity and economical cost. Selected agricultural plants might be raised in SFC during hot-dry weather outside by allowing some sunlight to reach inside and maintaining a relatively low temperature inside. However, the amount of sunlight entering through the four surfaces needs to be monitored and assessed enough in terms of growing the plants.
2.2. Dynamic Numerical Simulation of SFC
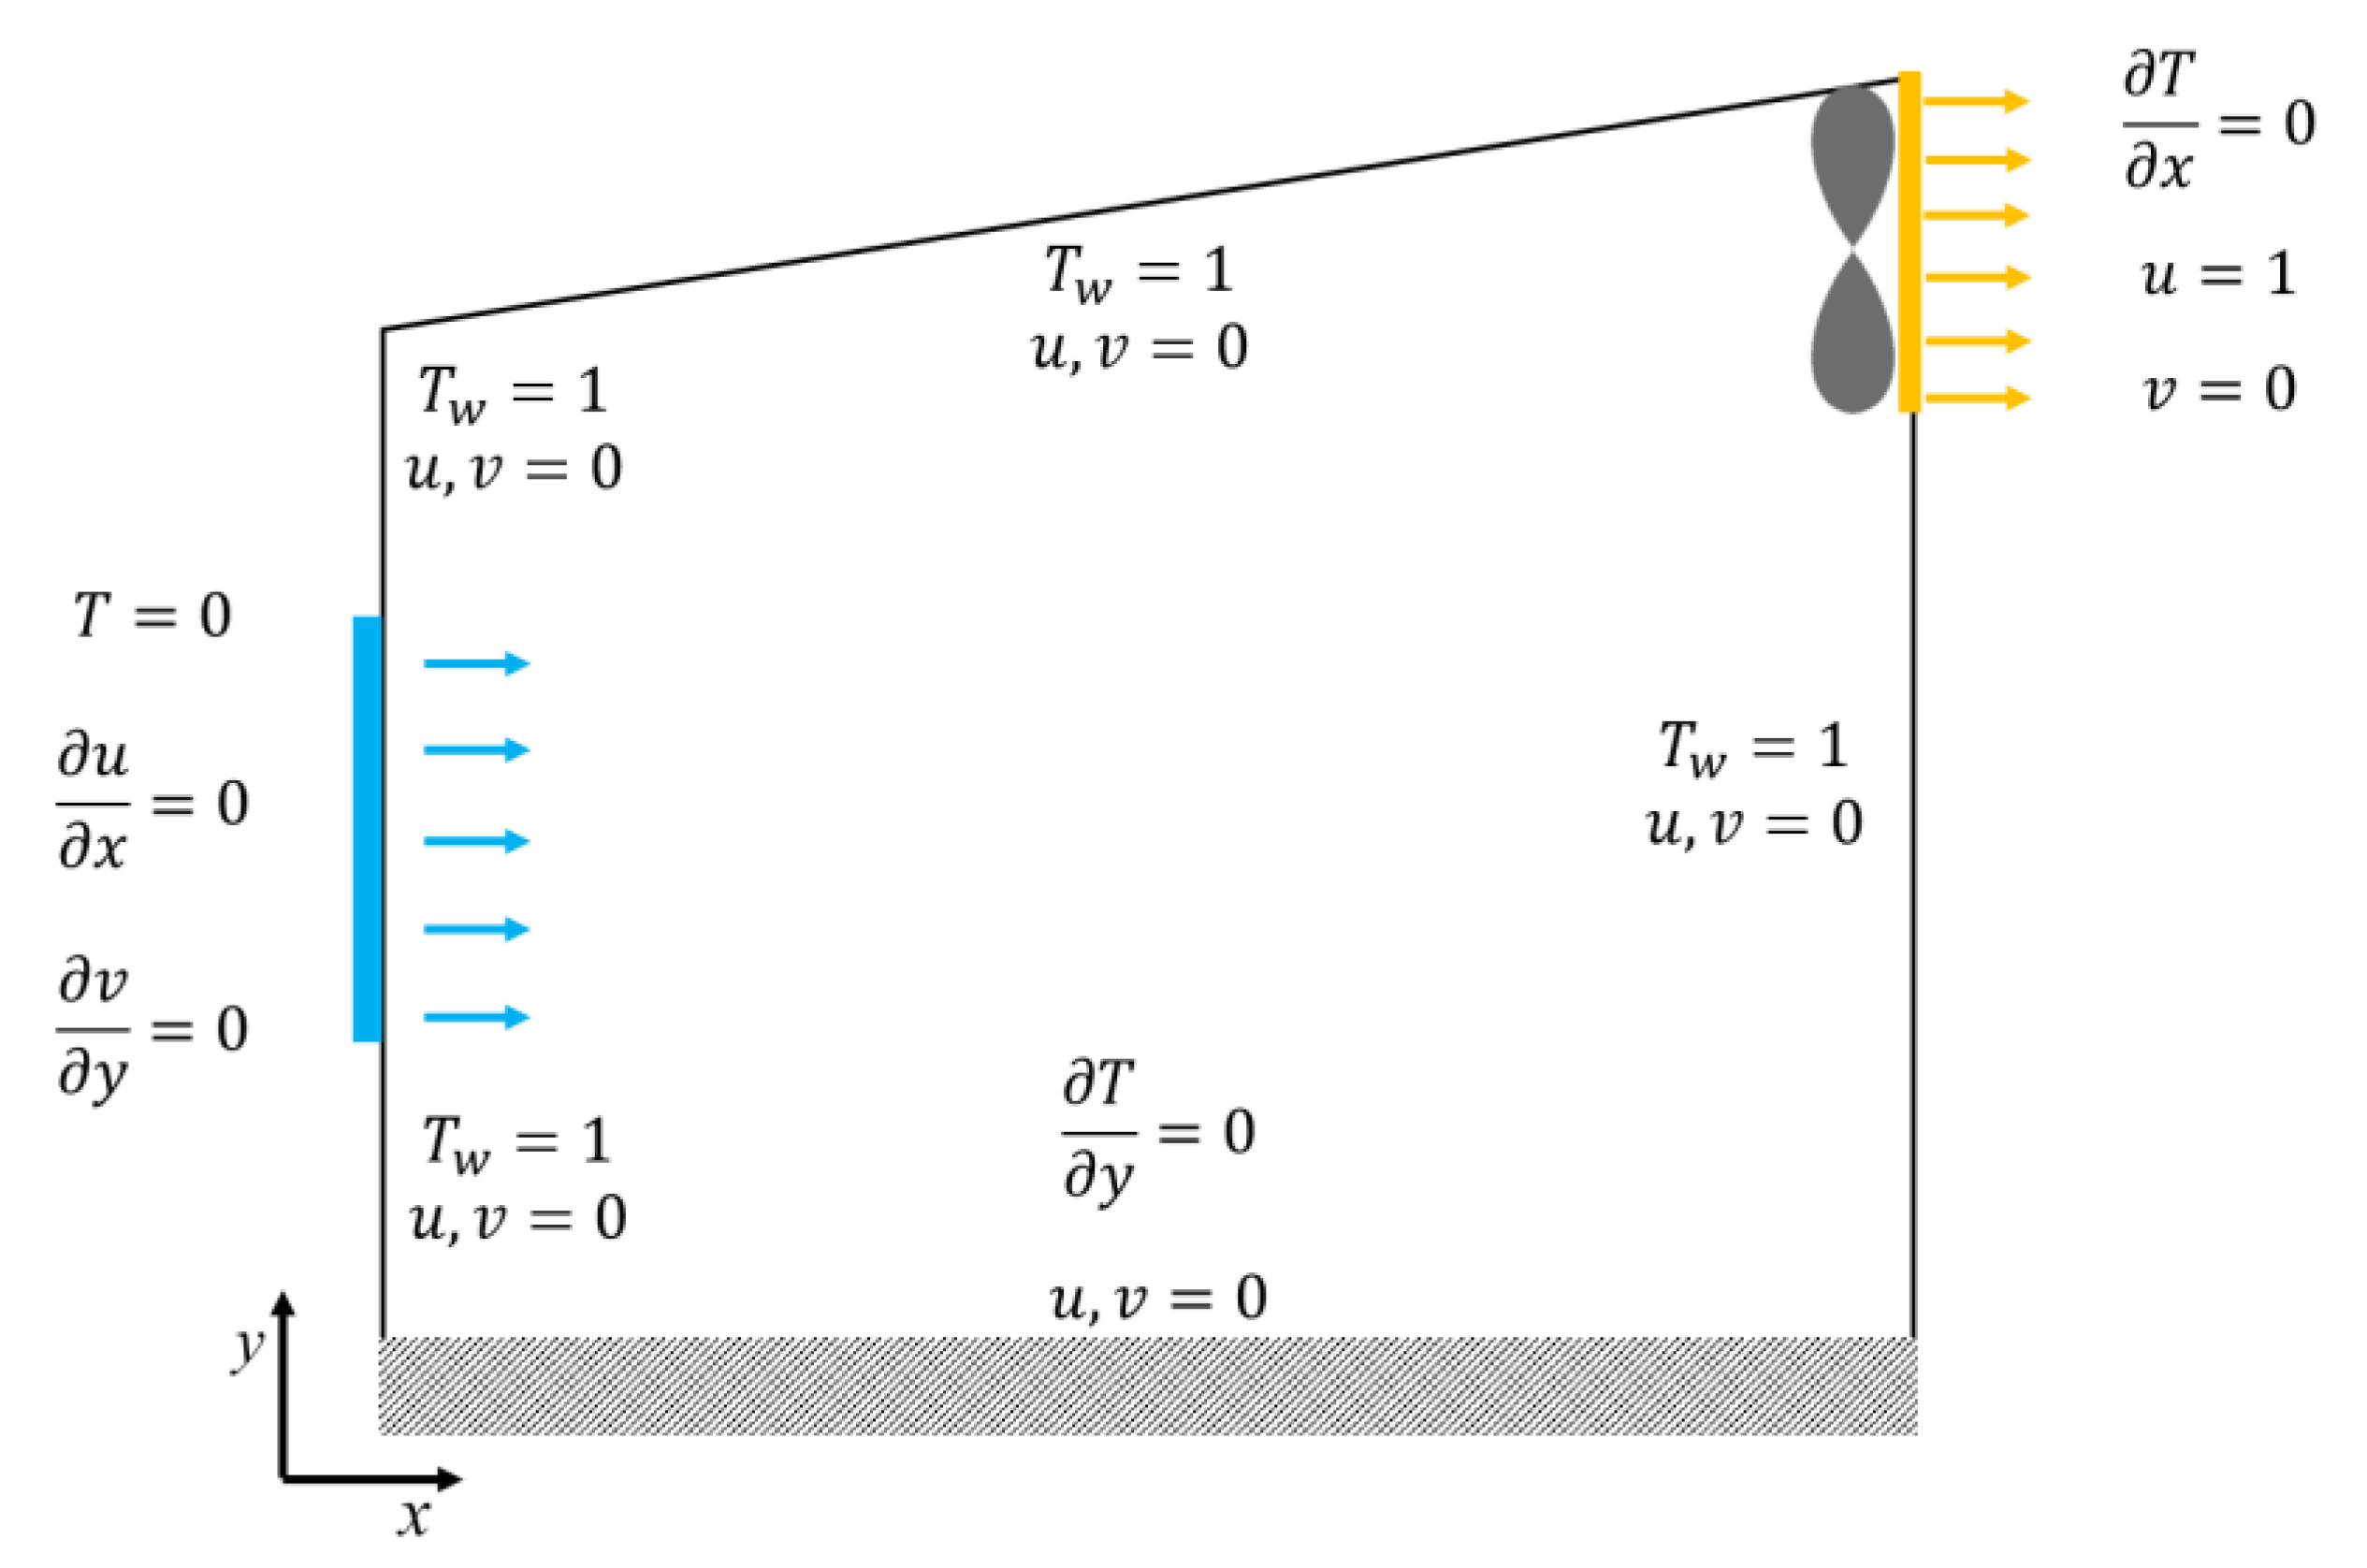
For dynamic numerical simulations of the SFC system, an in-house numerical code was developed to evaluate the thermal performance of the SFC and to validate the experimental results. For simulations, the prototype SFC, which is subjected to actual weather data of the UAE, was modeled. All materials were identical to those used during the prototype test. The material properties, used as the input parameters for the simulation, are summarized in Table 1. The physical system upon which the numerical simulation is based is shown schematically in Figure 3. Boundary conditions at both sidewalls of the SFC and the roof were at a constant temperature of 53.9 °C, which conservatively equals the highest outside temperature.
2.2.1. Governing Equations of Mathematical Model
We provide a model capable of predicting the temperature distribution and hydrodynamic characteristics of fluid inside the SFC prototype.
The model is based on the conservation of mass, momentum and energy. An incompressible fluid in a two-dimensional (2-D) domain with a trapezoidal geometry with the same size of the experimental prototype was simulated, as shown in Figure 3. Note that the actual SFC is designed as a plane strain condition (e.g., a long chain), which is close to the model of the 2-D domain. The geometric dimension of the model is identical to that of the prototype SFC experiment.
The characteristic length, and velocity scales, were the length of SFC protype chamber in x direction and the outlet velocity of air at exhaust fan, respectively. With these characteristic scales and given that a viscous fluid is incompressible with constant properties and the effect of gravity on fluid flow is negligible, the conservation equations for momentum, mass and energy in the non-dimensional form were
where the non-dimensionalized variables including velocity V = (u, v), lengths (x, y), pressure (P), time (t) and temperature (T) can be derived from their dimensional form by the following equations (the variables symbol accompanied with prime symbol, for example, , , are dimensional).
where the Equations (1)–(3) are the Navier-Stokes equations. Here, we define the Reynolds number and the Prandtl number as and , respectively, where ν is the kinematic viscosity of the fluid and α is the thermal diffusivity of the fluid. The variation of temperature and humidity during one operation cycle of the SFC prototype leads to negligible differences in air properties such as density, viscosity and thermal diffusivity; therefore, the properties of simulating fluid are assumed to stay constant. The air properties were evaluated at 80% humidity. Nevertheless, the humidity should be considered because the vapor phase coexists. In this study, it is found that the Reynolds and Prandtl numbers implicitly take into account the presence of the vapor phase but their resultant effect on the average temperature is almost negligible. However, it is likely that spatially varying parameters due to spatial non-uniform humidity would have a significant impact on the results, which is a subject of future work. For boundary conditions, a no-slip boundary condition was assumed at the walls in the momentum equation. Constant velocity was assumed at the outlet due to the exhaust fan, while Neumann inflow condition was applied due to the evaporative cooling system. In the energy equation, a uniform temperature is assumed at the sidewalls and the roof. The cold air of a uniform temperature was injected through the evaporative cooling system. The Neumann boundary condition for the temperature at the outlet is used due to the exhaust fan. No heat flux condition was considered for the bottom floor.
2.2.2. Numerical Method
The dynamic and thermal behaviors of the fluid inside the simulation domain is analyzed using the direct numerical simulation (DNS). In the current simulation, a boundary-fitted grid system is generated for the trapezoidal space and then the governing equations are transformed for a rectangular computational domain using 2 × 2 Jacobean matrices [19]. A staggered grid system was generated to solve the two-dimensional governing equations and a second-order explicit finite difference method (center in space and forward in time) was used for discretization of the equations [20,21]. The continuity and time-discretized momentum equations are written as follow
A fractional-step method or the projection algorithm was employed to compute a velocity field [22,23,24]. It is worth noting that, as seen in the original paper for the fractional-step method [22], this method can be applied to the 2D case as the present study. In this algorithm, the intermediate velocity () is introduced such that from which Equations (6) and (7) can be modified into Equations (8) and (9), where the pressure is now decomposed from the momentum equation. In this numerical approach, the intermediate velocity () was calculated explicitly from the velocity fields at the previous time step () by Equation (8). With the continuity equation, the Poisson equation in Equation (9) was solved via Successive Over Relaxed (SOR) method to correct the intermediate velocity to satisfy the divergence constraint on the velocity field. The energy equation in Equation (11) was solved using a second-order explicit finite difference method to calculate the temperature field.
All computations were performed on mesh and the time step () was in the order of to ensure the numerical stability condition. The mesh convergence was tested and its size is selected in order for further grid refinement not to lead to significant difference in spatial average steady-state temperature. The tolerances used in the simulation as stopping criterions were respectively and for velocity and temperature computations. The simulations stop when the spatial average of absolute residual error for both velocity and temperature fields fall below the tolerances. Each simulation performed by in-house numerical code takes approximately 20 central processing unit (CPU) hours to complete for the range of Reynolds numbers studied in the current research. However, in cases of studying the systems with high Reynolds numbers and large domains, direct numerical simulation (DNS) becomes significantly limited. In order to effectively simulate such systems, it is worth noting that the methods employing the Reynolds-averaged Navier–Stokes equations (RANS) incorporated with various models such as k-epsilon models [25,26,27] can be more appreciated.
3. Results
3.1. Variation of Temperature and Humidity in a Controlled Condition
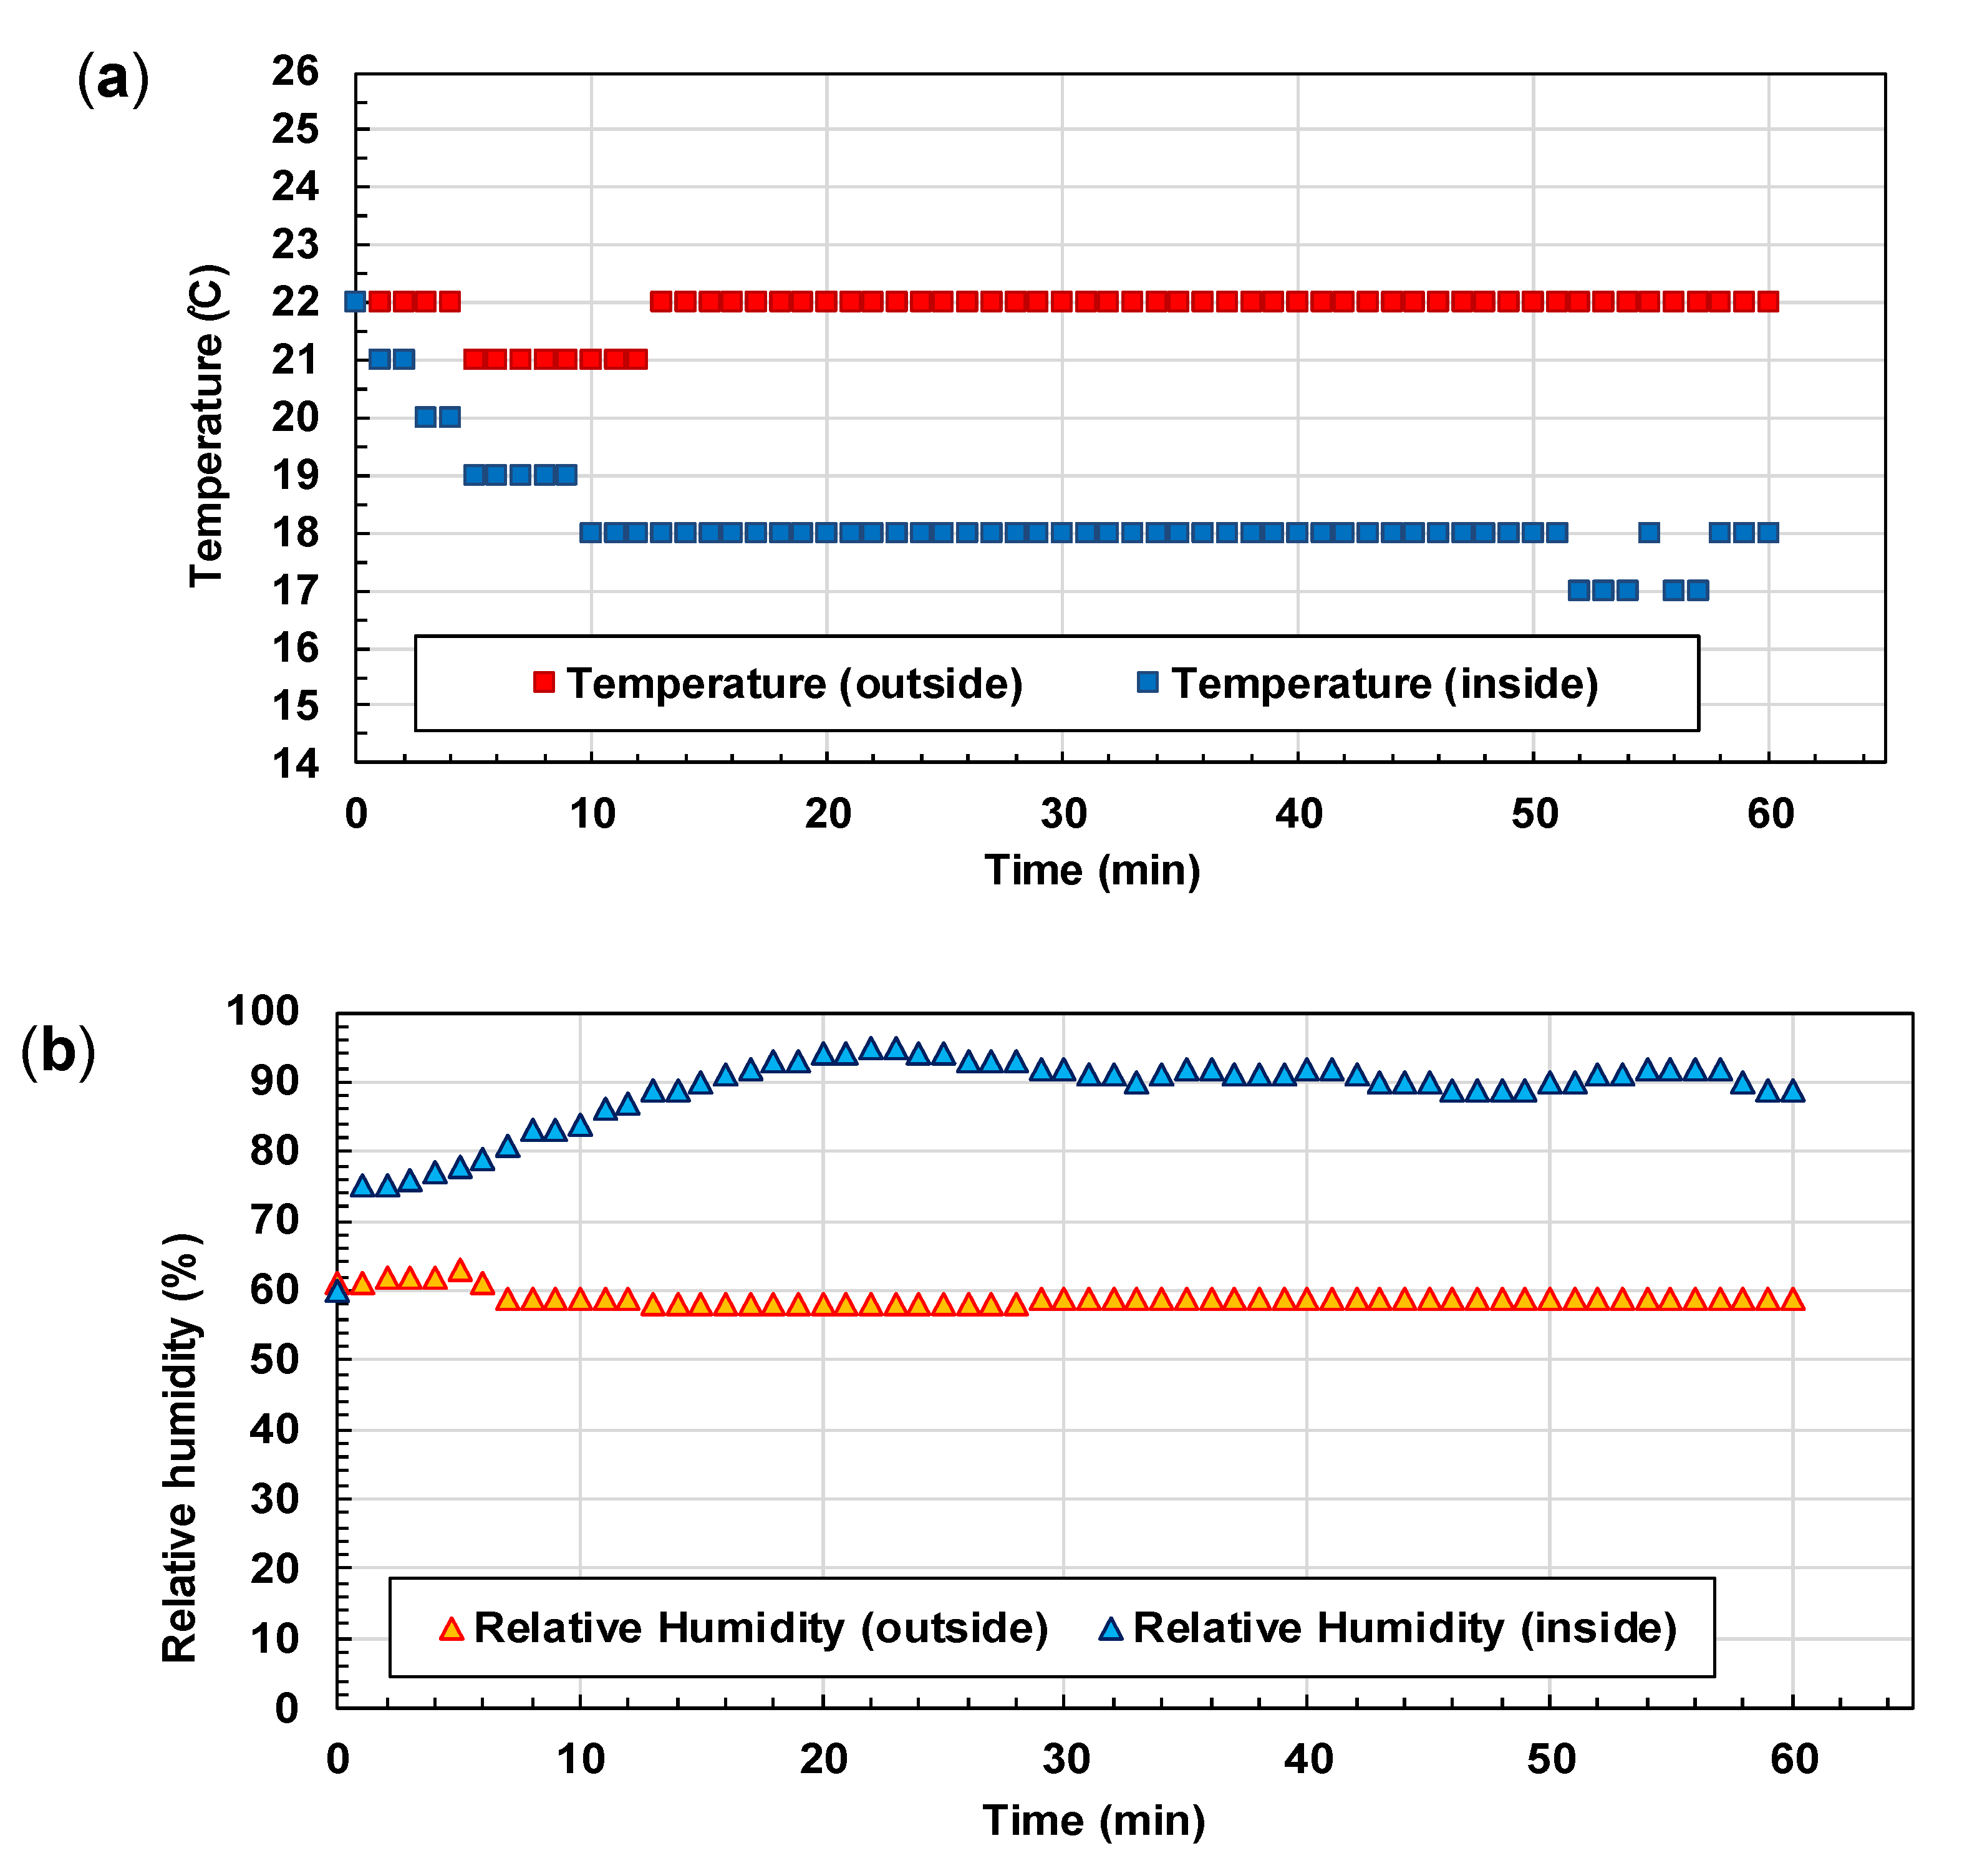
A cubical chamber (0.45 × 0.45 × 0.9 m) made of polyethylene was prepared as a constrained volume for a test in an environmentally controlled condition to evaluate an exhaust fan and an evaporative cooling pad. The relative humidity and room temperature in the laboratory was maintained at 22.0 °C and 60.0%, respectively. In Figure 4, the testing result of the environmentally controlled condition was shown. The humidity and temperature of the chamber were monitored until stabilized for more than 60 min. At the initial time, the interior temperature and humidity were 22.0 °C and 60.0%, respectively, which were identical with the outside ones. However, the temperature was significantly decreased by 5 °C from 22.0 °C to 17.0 °C after the test started. The temperature drop was 29.4%. According to psychometric chart, the temperature decreases by 5.5 °C from 22 °C to 16.5 °C, which reasonably agreed with the results. On the other hand, the relative humidity was significantly increased from 60.0% up to 95.0% during the test. Typically, the temperature in the chamber decreased with increasing relative humidity because latent heat as evaporation proceeded in the pad took out the heat, resulting in the temperature drop. Approximately 4.0 L of water was consumed during the test. The temperature and relative humidity were stabilized around 15 and 30 min later since the test started.
3.2. Variation of Temperature and Humidity during the Prototype SFC Test
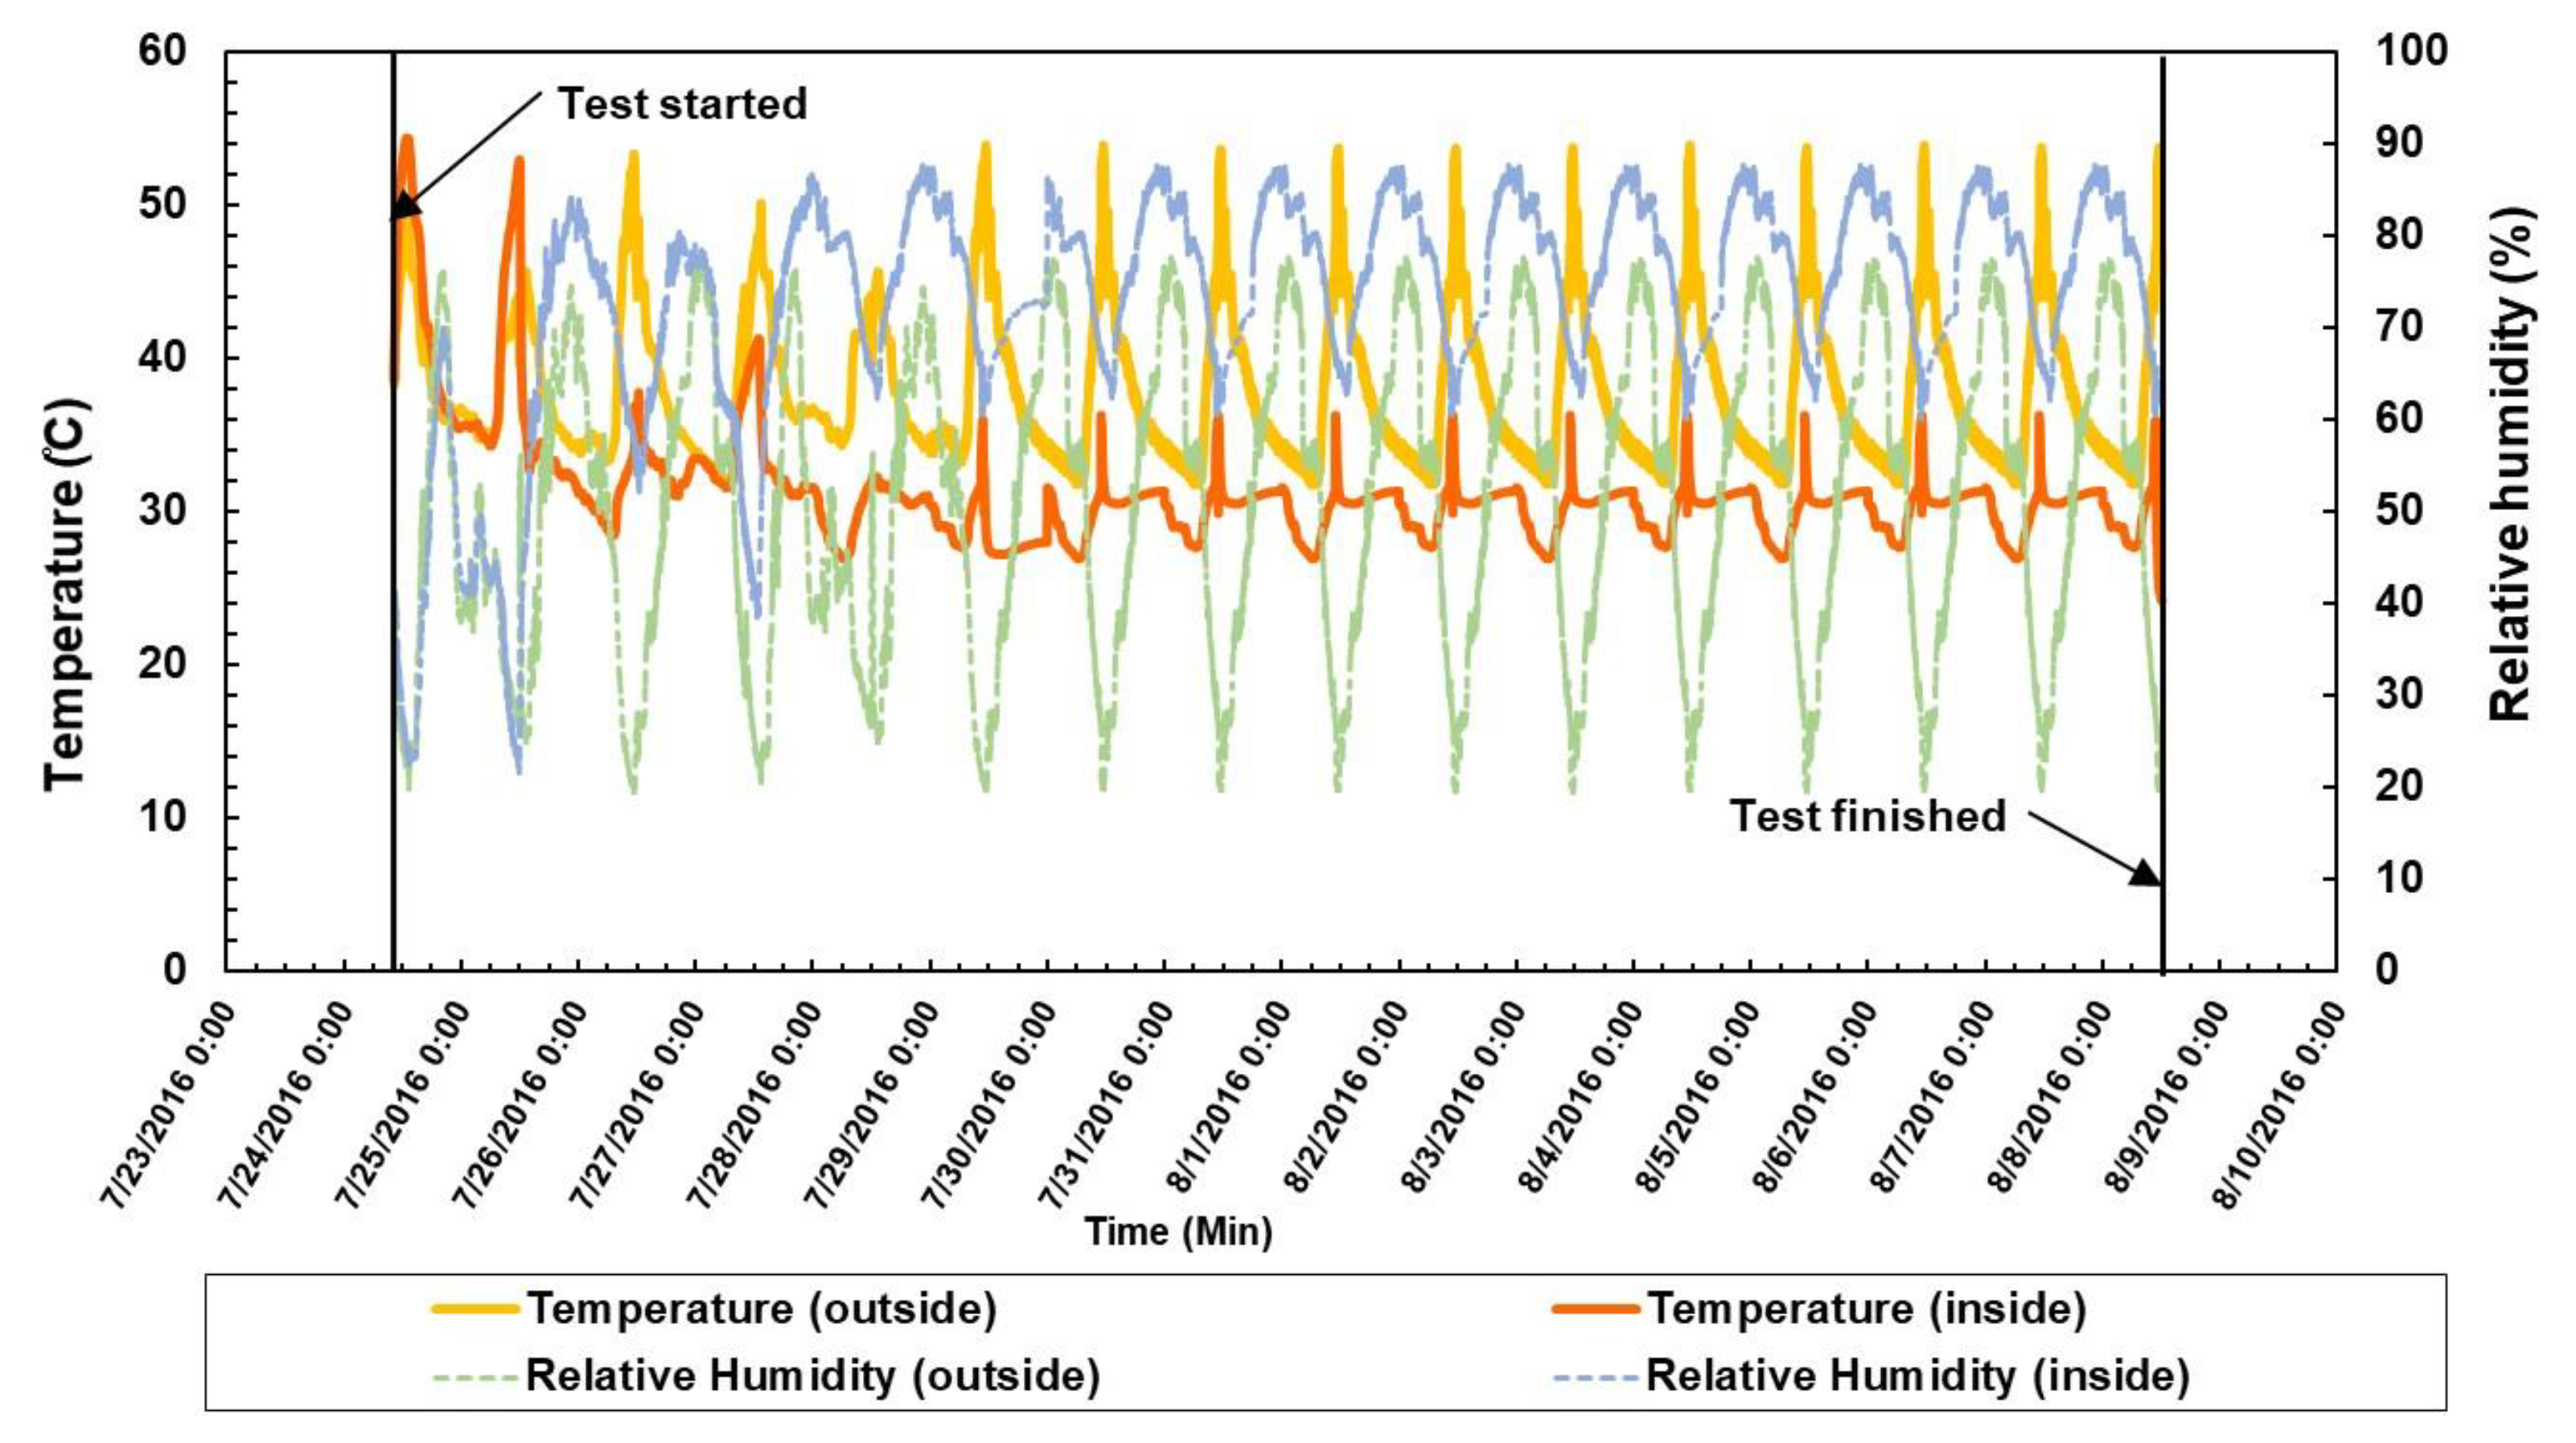
The performance of the prototype SFC with the operation of the evaporation cooling system was tested outside near the campus of NYUAD more than two weeks from July and August. Summer in Abu Dhabi is very hot and the outside average temperature reaches approximately 42.5 °C [28]. Figure 5 shows the variation of temperature and humidity obtained from the SFC test. The outside temperature varied from 31.8 °C to 53.9 °C. The difference between the highest and lowest temperatures was 22.0 °C and the average temperature was 37.9 °C. However, the inside temperature of the SFC varied from 24.1 °C to 54.4 °C. The average temperature was 31.2 °C and the difference between the highest and lowest temperatures was 30.2 °C.
The relative humidity in the outside was ranged from 19.6% to 77.6%. The average of the relative humidity was 50.7% and the standard deviation was 16.2%. On the other hand, the relative humidity in the inside is ranged from 21.5% to 87.7%. The average of the temperature was 73.2% and the standard deviation was 17.4%. As the relative humidity (inside and outside) increases, the temperature decreases in the SFC. Not only the inside temperature but also the outside temperature is correlated with the humidity. However, the temperature tends to increase with decreasing humidity. The relationship between the humidity and temperature in the compartment was mostly opposite during the test. The variations of the outside temperature and the inside humidity were considerably higher than those of the inside temperature and outside humidity. The temperature in the inside chamber was consistent under 31.0 °C except at the peak time of outside temperature and specifically around noon.
Figure 5 also shows that in the first two days, the temperature inside and outside the compartment was almost the same. This shows that it takes time for the evaporating coolers to create a shifted new equilibrium inside the system for temperature and humidity. The same trend occurs for relative humidity where after the first two days, it increases over 40% inside the compartment and once again, we can see the decreased temperature is related to increasing relative humidity. After day 3, the inside temperature is lowered compared to the outside temperature and after day four, the variation trend of inside temperature is stable for the next ten days. Three unexpected temperature peaks inside the compartment might be due to outside high-temperature peaks and running out of the water to be supplied to the evaporative cooling system. It seems that the humidity inside SFC was dramatically dropped when the water was runout during the test. The stabilizing delay on the second day may be due to the running of water. Additionally, the temperature measurement at the center of the compartment may not represent the inside temperature entirely. Because of this limitation, the stabilization of the temperature might not be seen clearly on the second day of the testing.
3.3. Validation of Numerical Simulation
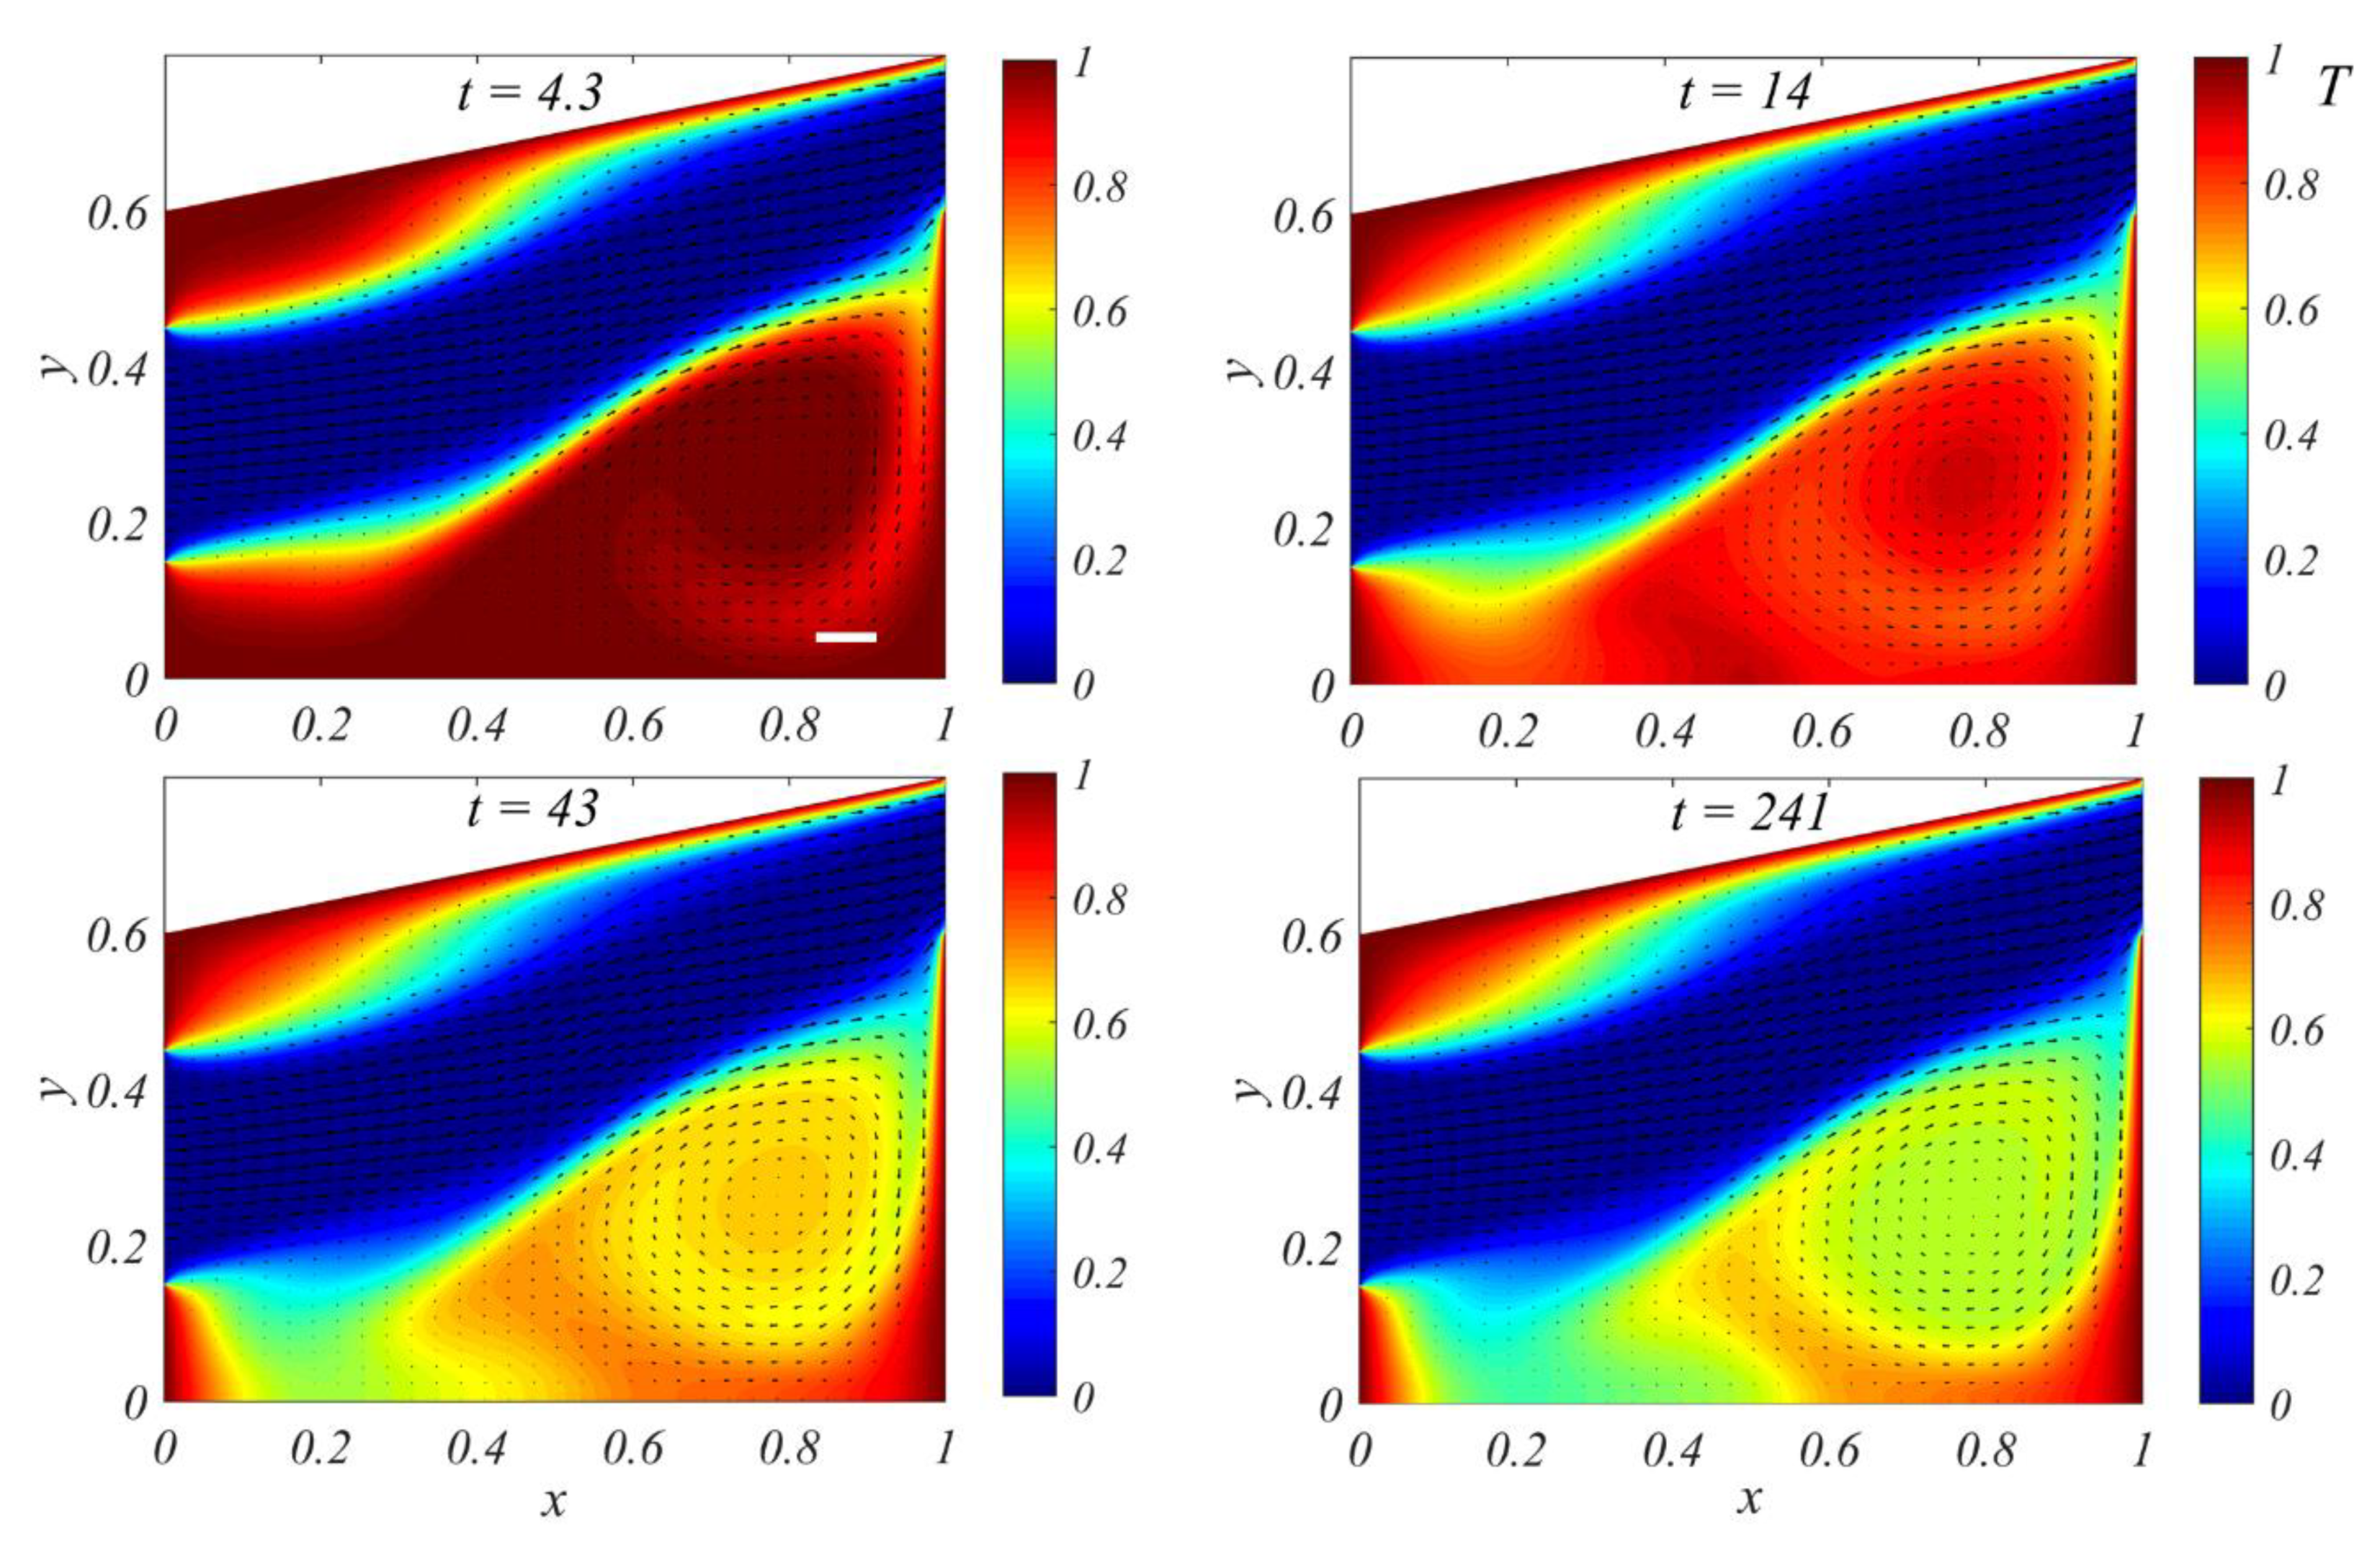
Dynamic numerical simulations for SFC at Reynolds number of 2300 were performed. The Reynolds number is calculated based on the experimental parameters and prototype SFC geometry. Figure 6 shows color contours for temperature distribution and arrows for fluid velocity inside the domain as a function of time from unsteady to steady states. Mixing the cool air coming from the evaporative cooling system with the inside warm air causes an overall temperature drop in the domain. The vortical flow patterns were observed near the left top and bottom walls. The similar vortical patterns can also be seen in temperature contours. These fluid circulations tend to enhance the heat transfer inside the domain. The white scale bar at t = 4.3 corresponds to 0.1 m/s. Thus, the velocity can be calculated in the caption of the Figure 6.
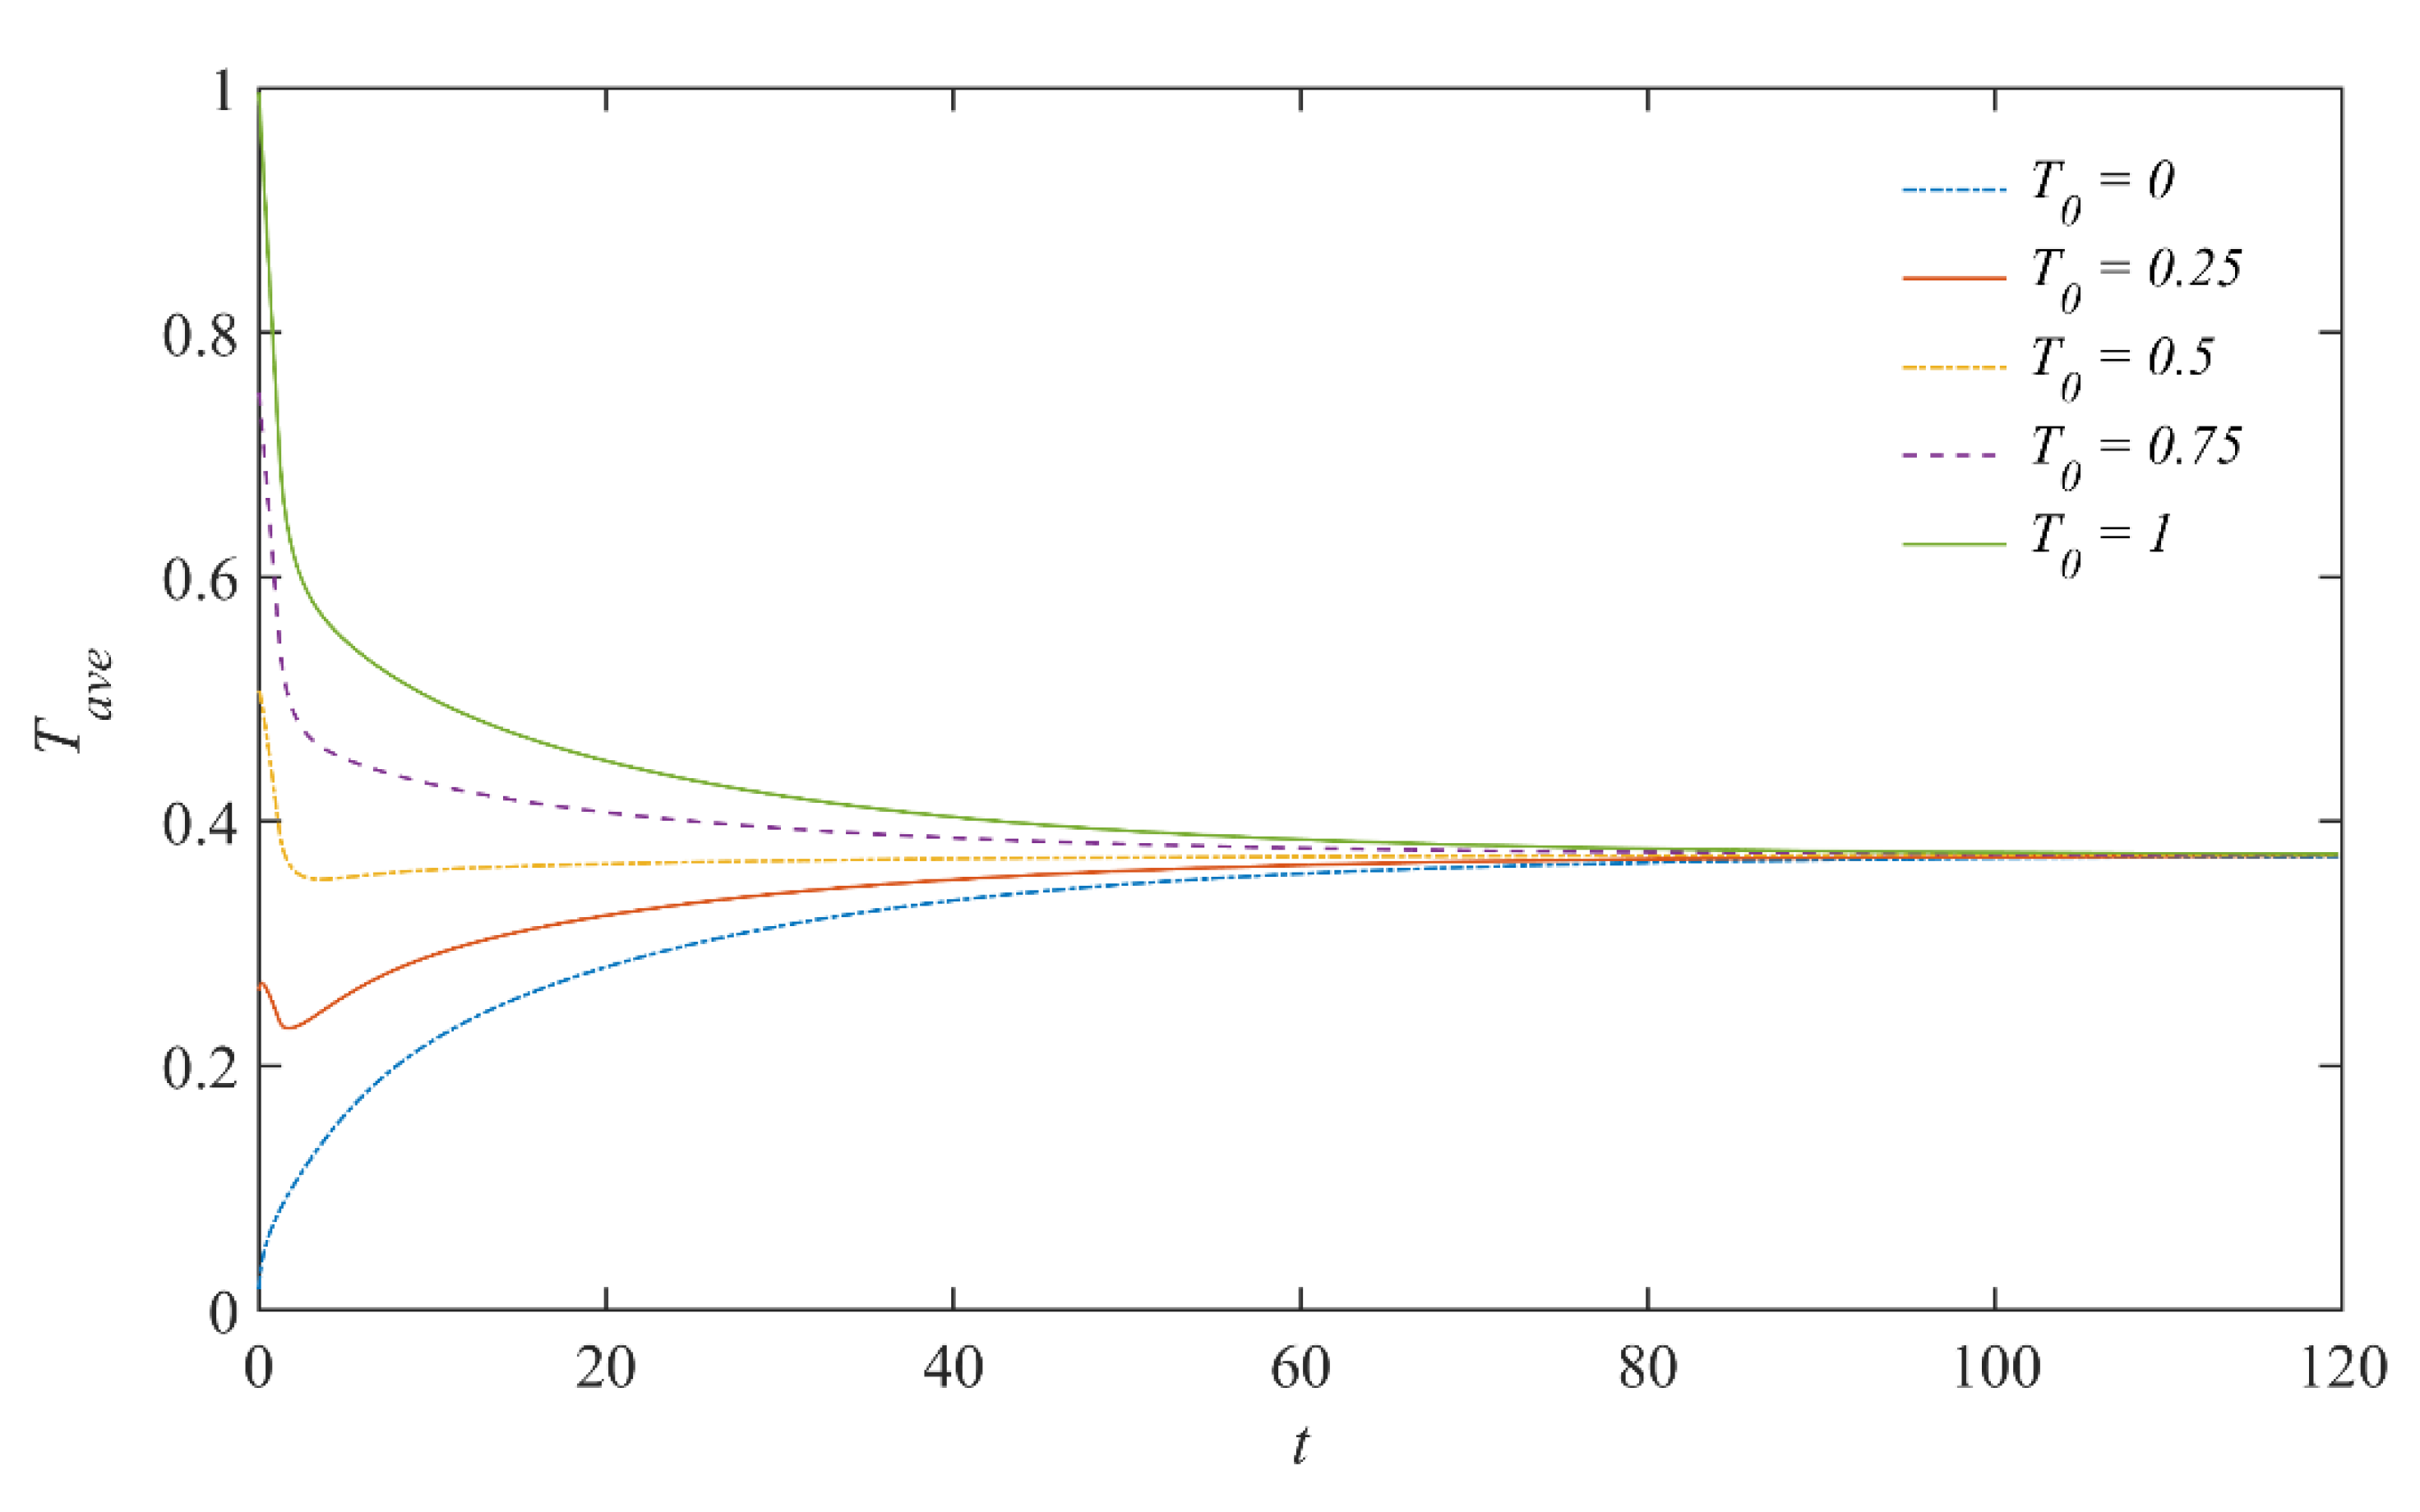
Figure 7 shows the time evolution of an area-averaged temperature for the different initial temperatures (). The average temperature becomes constant, leading to a thermally steady-state. All different initial temperatures are converged to the same average temperature . It is worth noting that this average temperature corresponds to a temperature drop of approximately 5–10 °C, depending on the outside temperature. In other words, in the system with and wall temperature of 22 °C and 33 °C with inlet temperature of 10–14 °C and 17–23 °C, respectively, a temperature drop is found to be about 6–12 °C. This temperature drop is in good agreement with experimental observations. Thus, the developed numerical model tends to predict the performance of the SFC reasonably.
3.4. Comparisons of Temperature between Simulation and Experiment
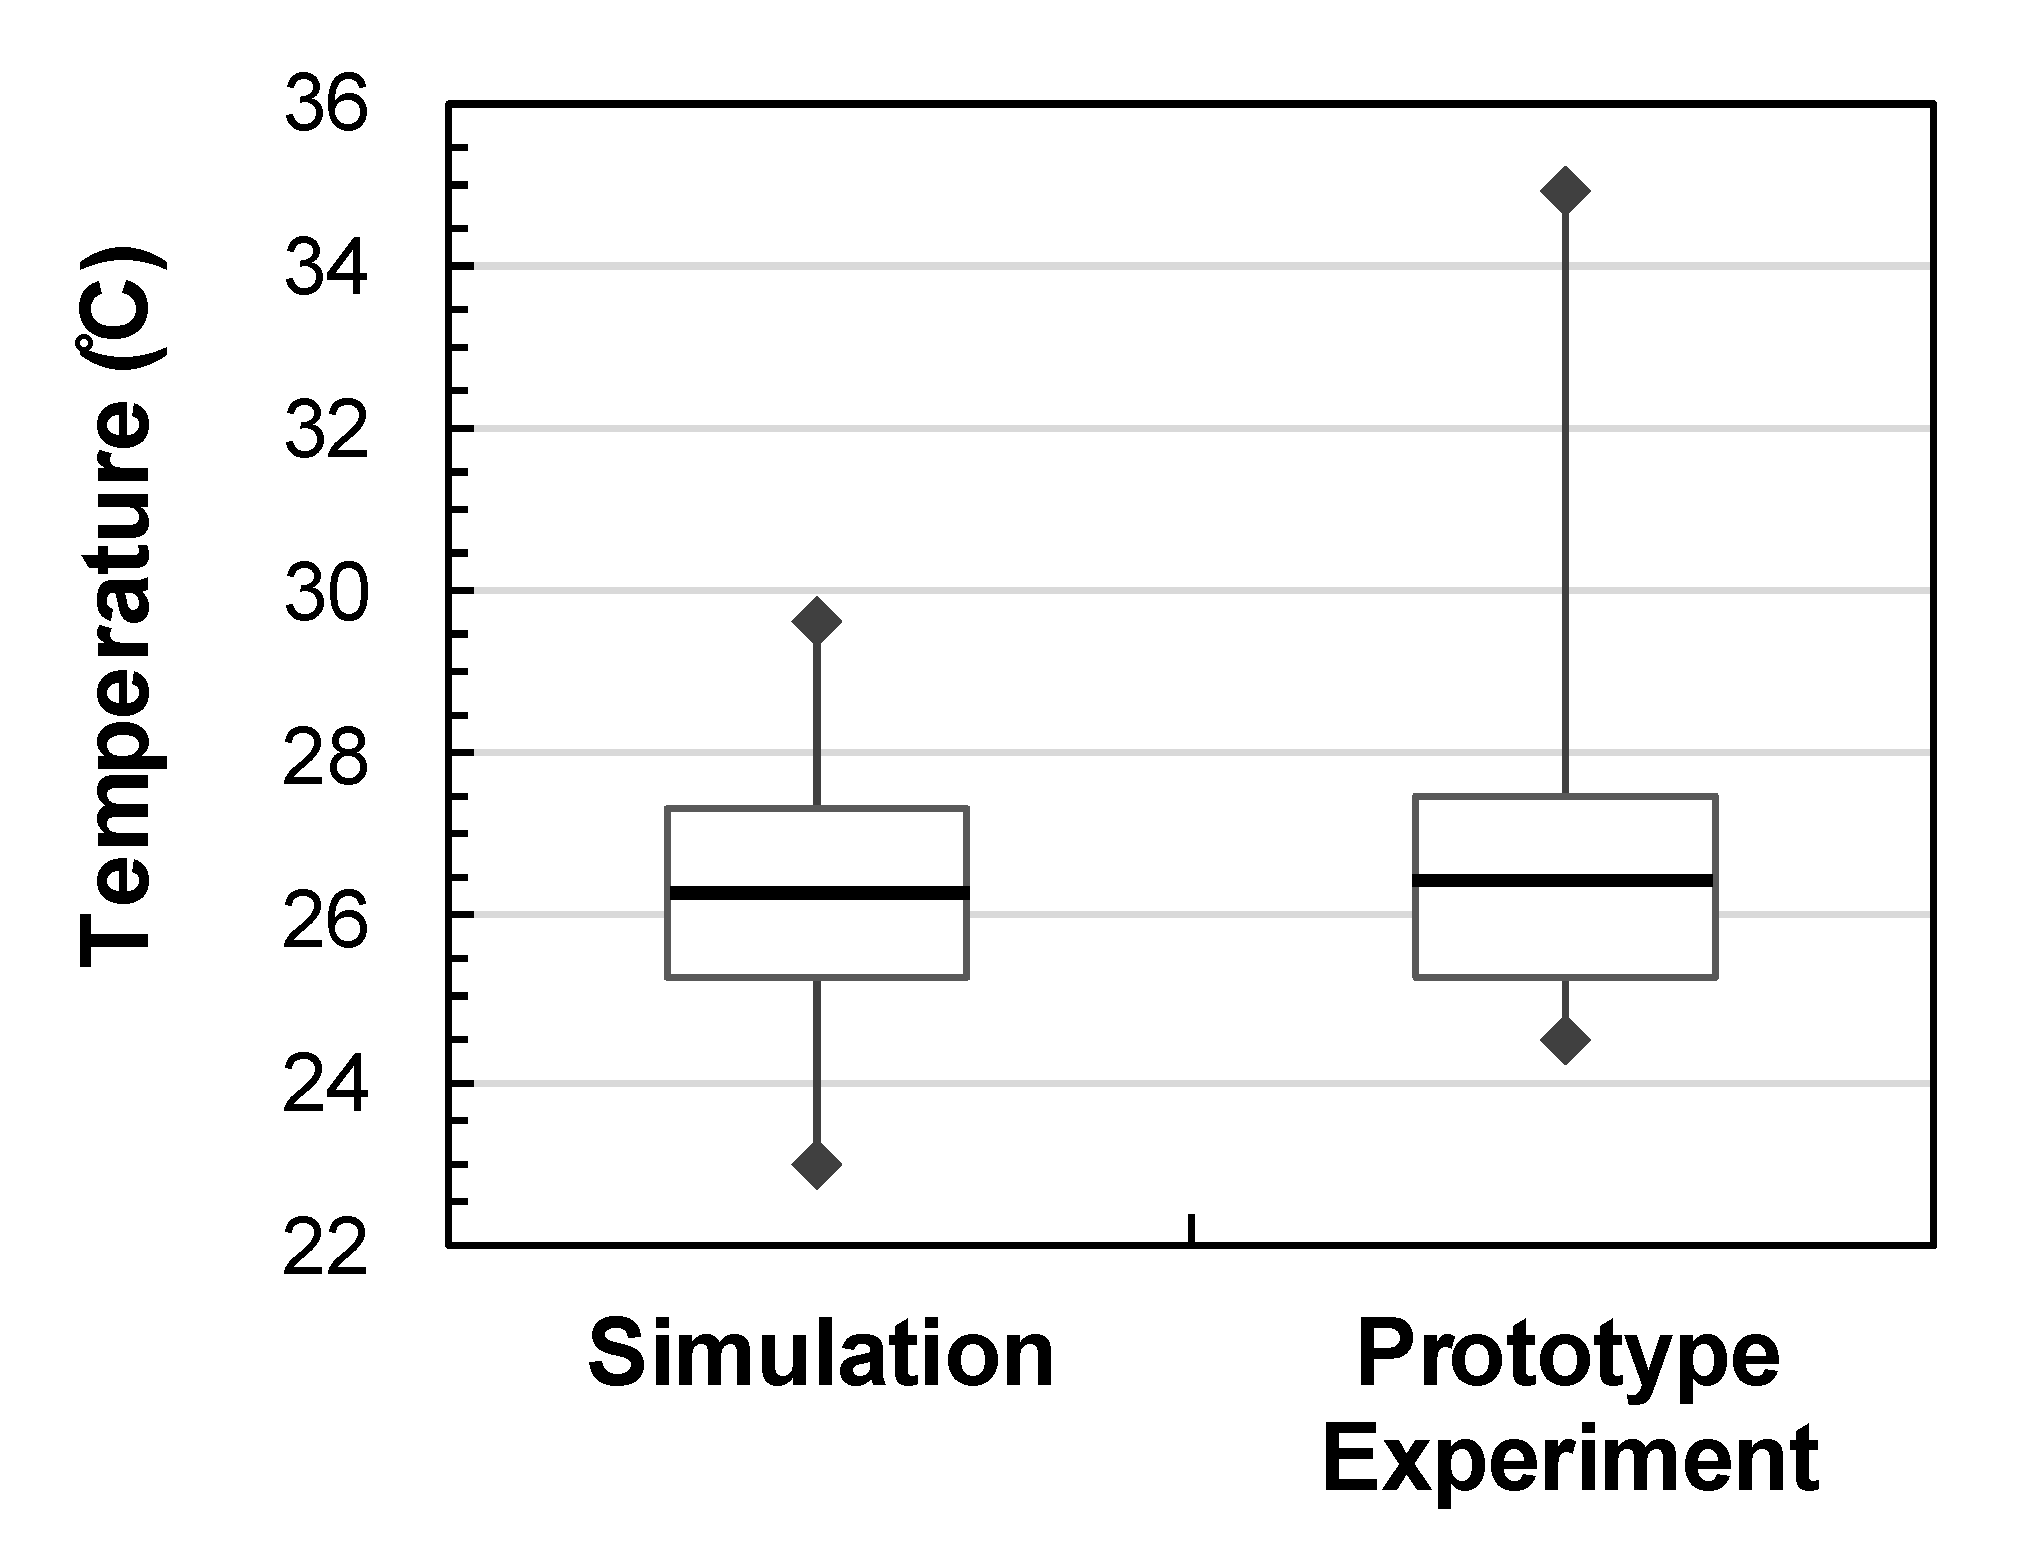
Figure 8 shows the comparative results of the varied temperatures obtained from the dynamic energy simulation and experimental tests. The temperatures from the experiment and simulation were measured at the same location, which was the center of the SFC chamber. In the figure, the symbols show the range of the temperature and the boxes show 25% and 75% of the values. The average temperature obtained from the dynamic simulation was 26.0 °C with 2.6 °C standard deviation. The difference between the average data is 0.40 °C for the temperature. The results show statistically no difference from the paired T-test (p = 0.087 > 0.050). Thus, the results obtained from the energy simulation show good agreement with the results of the experimental test.
However, temperature variation in the prototype test can influence plant productivity; thus, the reliability and stability of the system need to be considered before it can be used for farming. Additionally, an undesirable situation, such as running out of cooling water, may affect the growth of the plants.
4. Discussion
4.1. Numerical Parametric Studies on Inlet and Outlet Locations
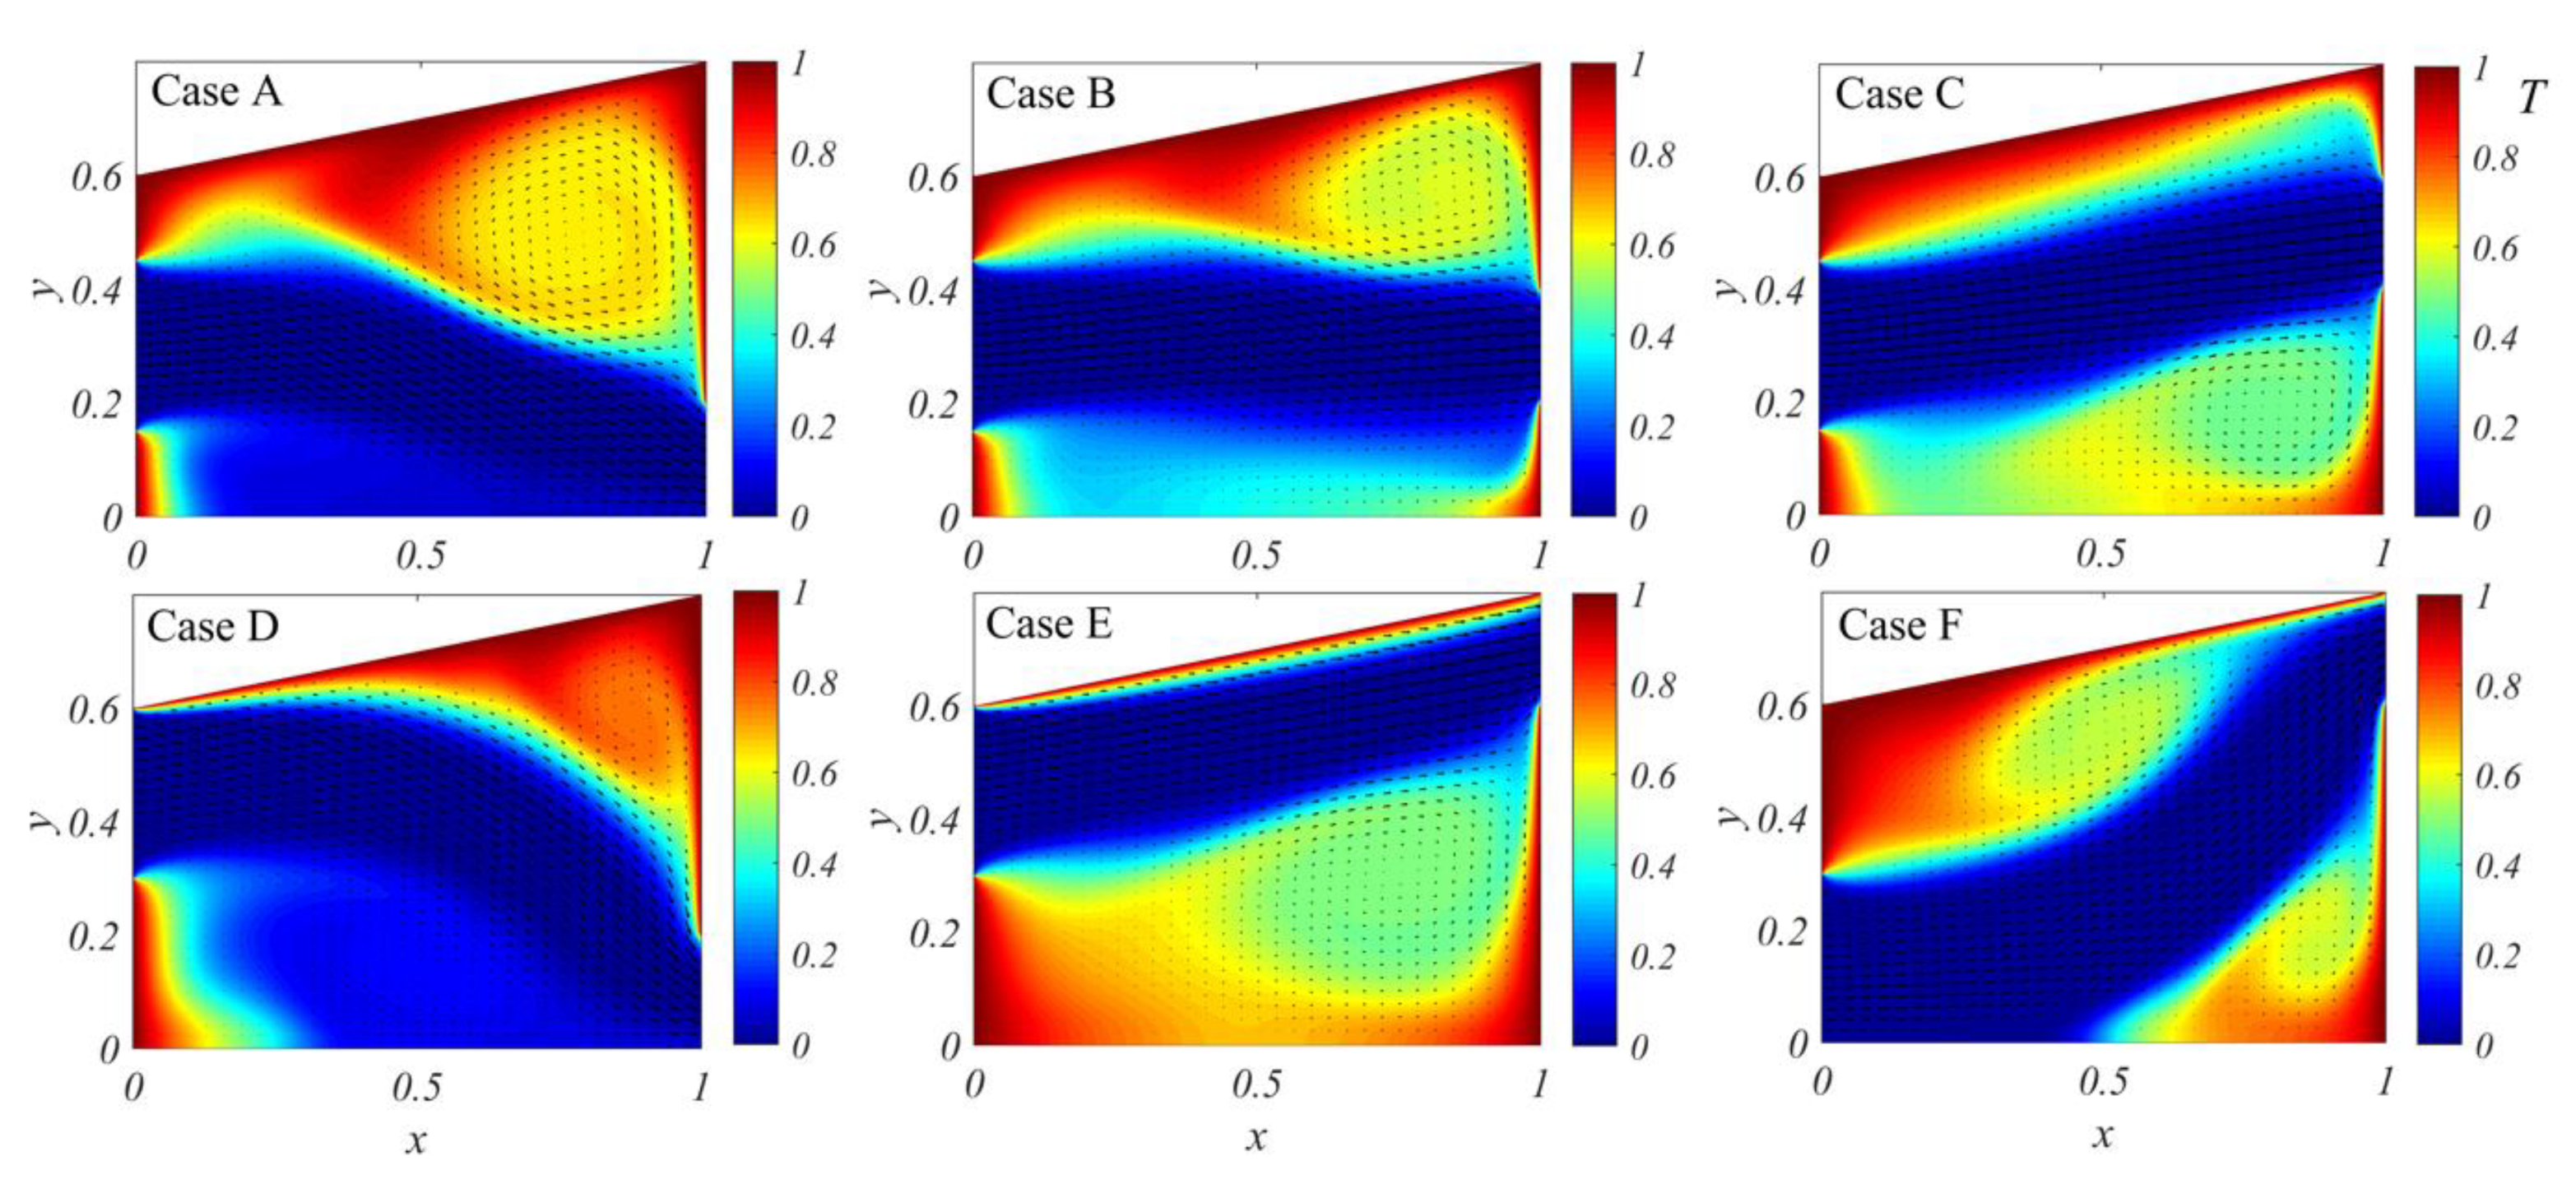
To optimize the performance of the SFC system, the effect of the evaporative cooling system and fan locations on the temperature and velocity field is evaluated numerically. Figure 9 shows the variations of velocity and temperature fields in the different cases as varying the locations of the evaporative cooling system and fan. Cases A to F shows the effect of the different combinations of inlet and outlet locations on temperature and velocity fields. The A, B, C cases are different in terms of outlet location where inlet for A, B, C are located on the middle 0.2. While cases E and F have similar outlet location of top 0.2, their inlet is located at 0.4–0.6 and 0.2–0.4 units respectively. Case D has the opposite locations of inlet and outlet compared to case F.
As can be seen in Figure 9, the positions of locations of the evaporative cooling system and fans significantly influence the velocity and temperature fields. The change in the vorticity flow pattern observed in the temperature contour seems to be the factor making a difference in the thermal performance of each case due to the variation in the mixing mechanism and vorticity as the inlet or outlet is displaced. In other words, one strong vorticity at the lower portion of the domain and one weaker vorticity at the top right corner effectively contribute to the cooling process of SFC, leading to an optimum thermal feature among all the cases.
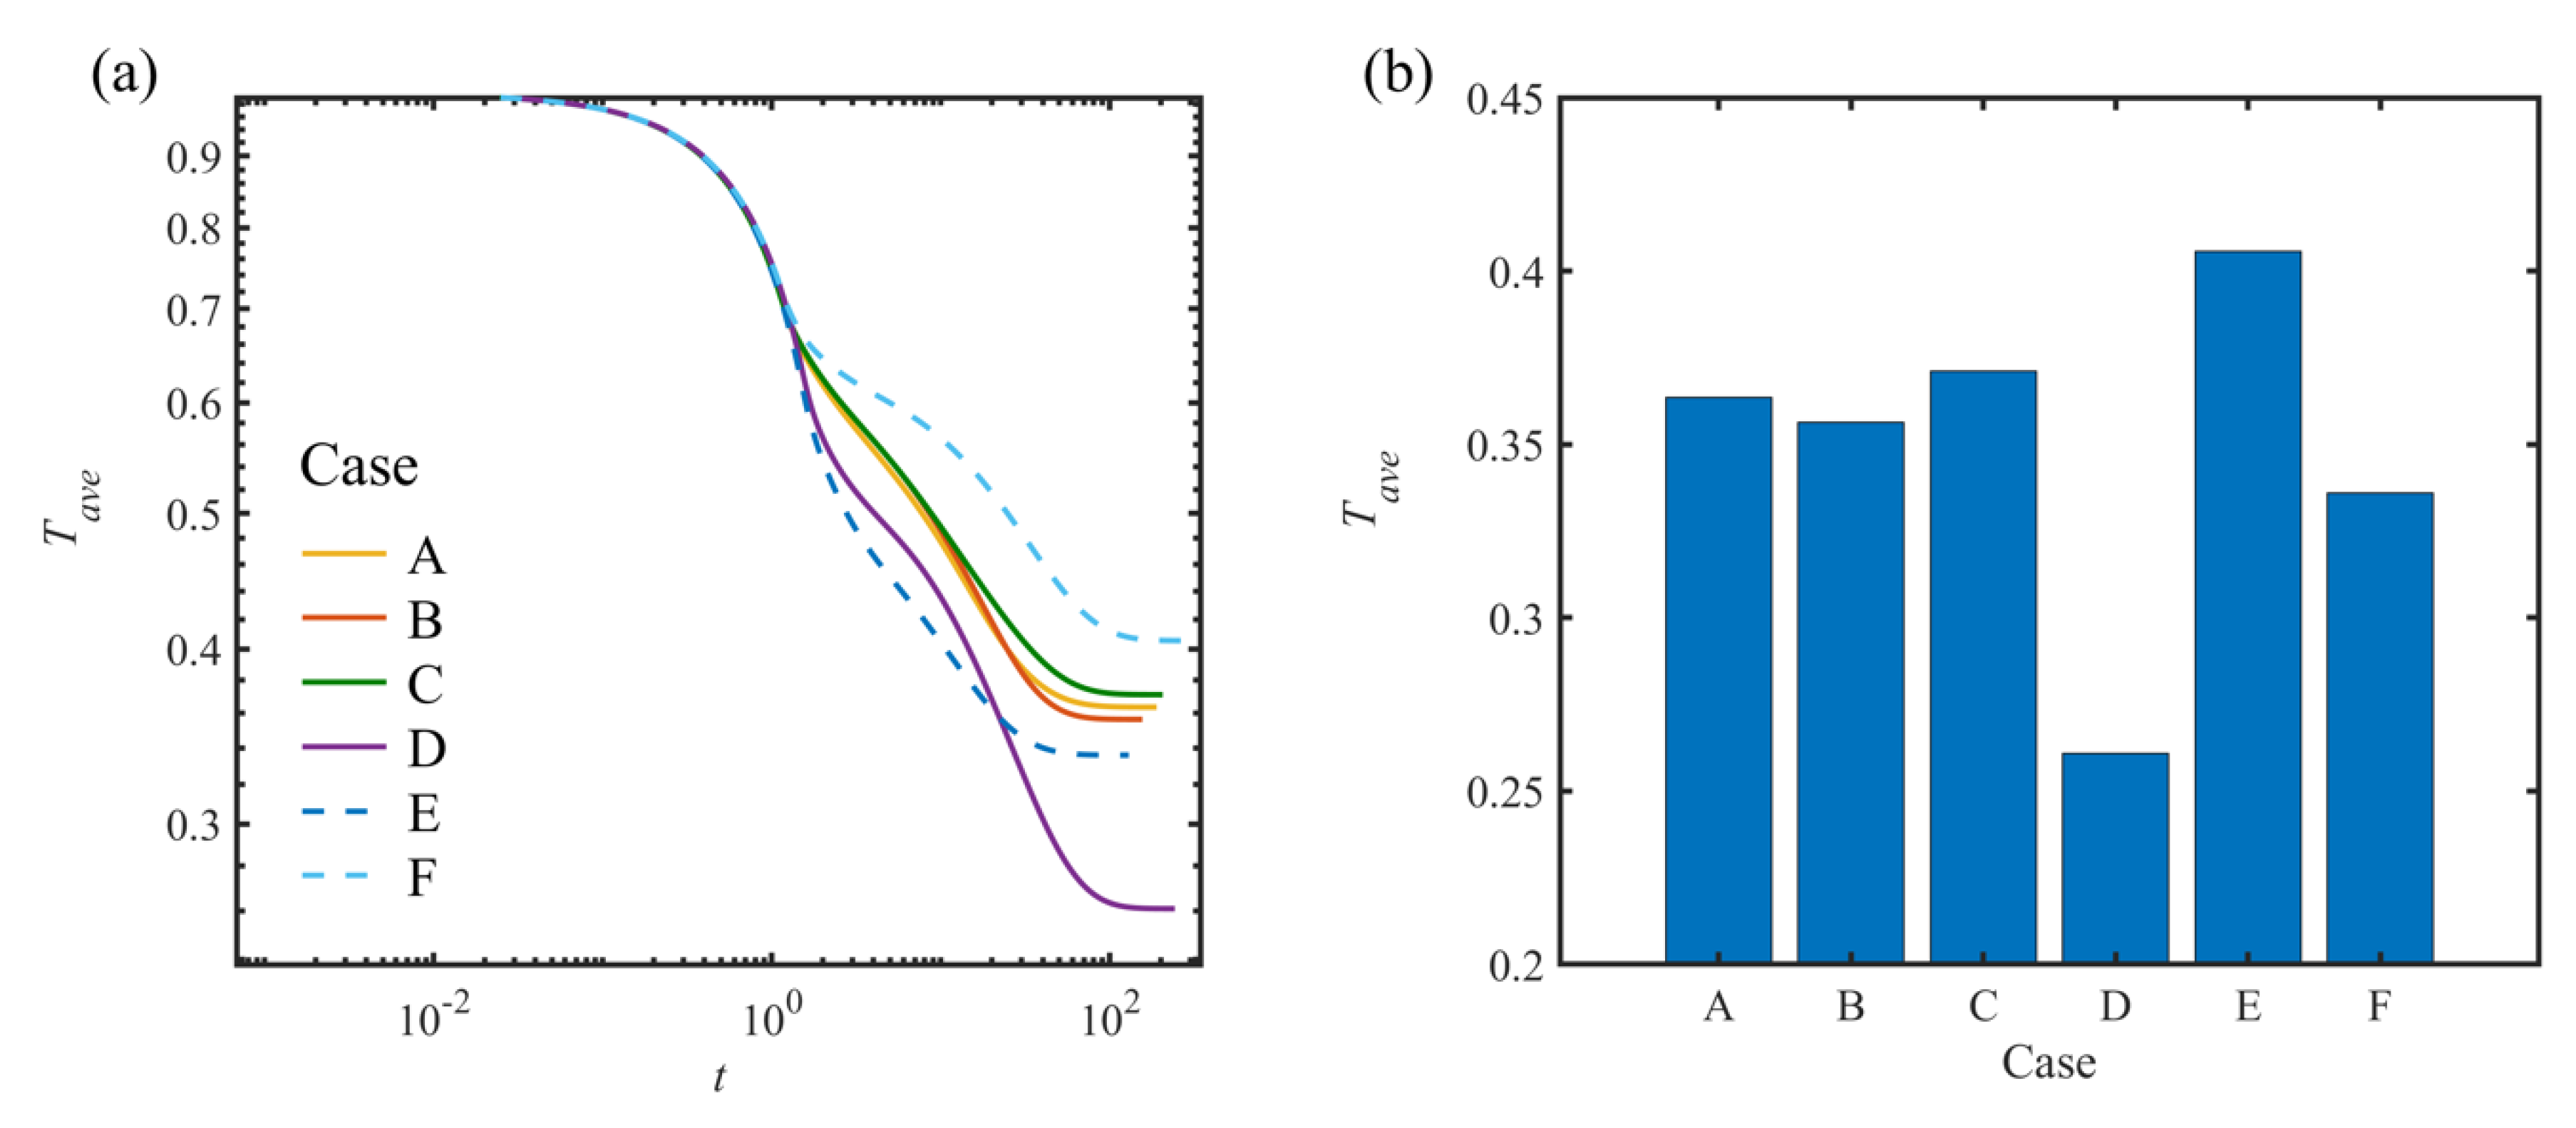
The temporal variation of the spatial average temperature and its steady-state value for all cases are shown in Figure 10a. As expected, case D has the best cooling performance because of the largest area of lower temperatures coming from the evaporative cooling system, leading to the lowest average temperature at the steady-state. Case D provided the best mixing mechanism between the cold inflow and the hot fluid inside the domain, regarding the geometry of the domain. In this case, two vorticities, especially the bottom one which is very strong, promote the mixing mechanism. This shows the advantage of this inlet and outlet arrangement. Figure 10a shows that at each time, the average temperature in case D is lower than that in other cases except case F for a short period of time (t = 2 to t = 20). However, case F has the fastest convergence to steady-state. It seems that the size of vorticity is correlated with the time required to reach steady-state, as case F has the small twin vorticity (Figure 9). Figure 10b shows the steady-state temperature of all cases where it clearly shows that case D has the lowest temperature.
4.2. Numerical Parametric Studies on Reynolds Number
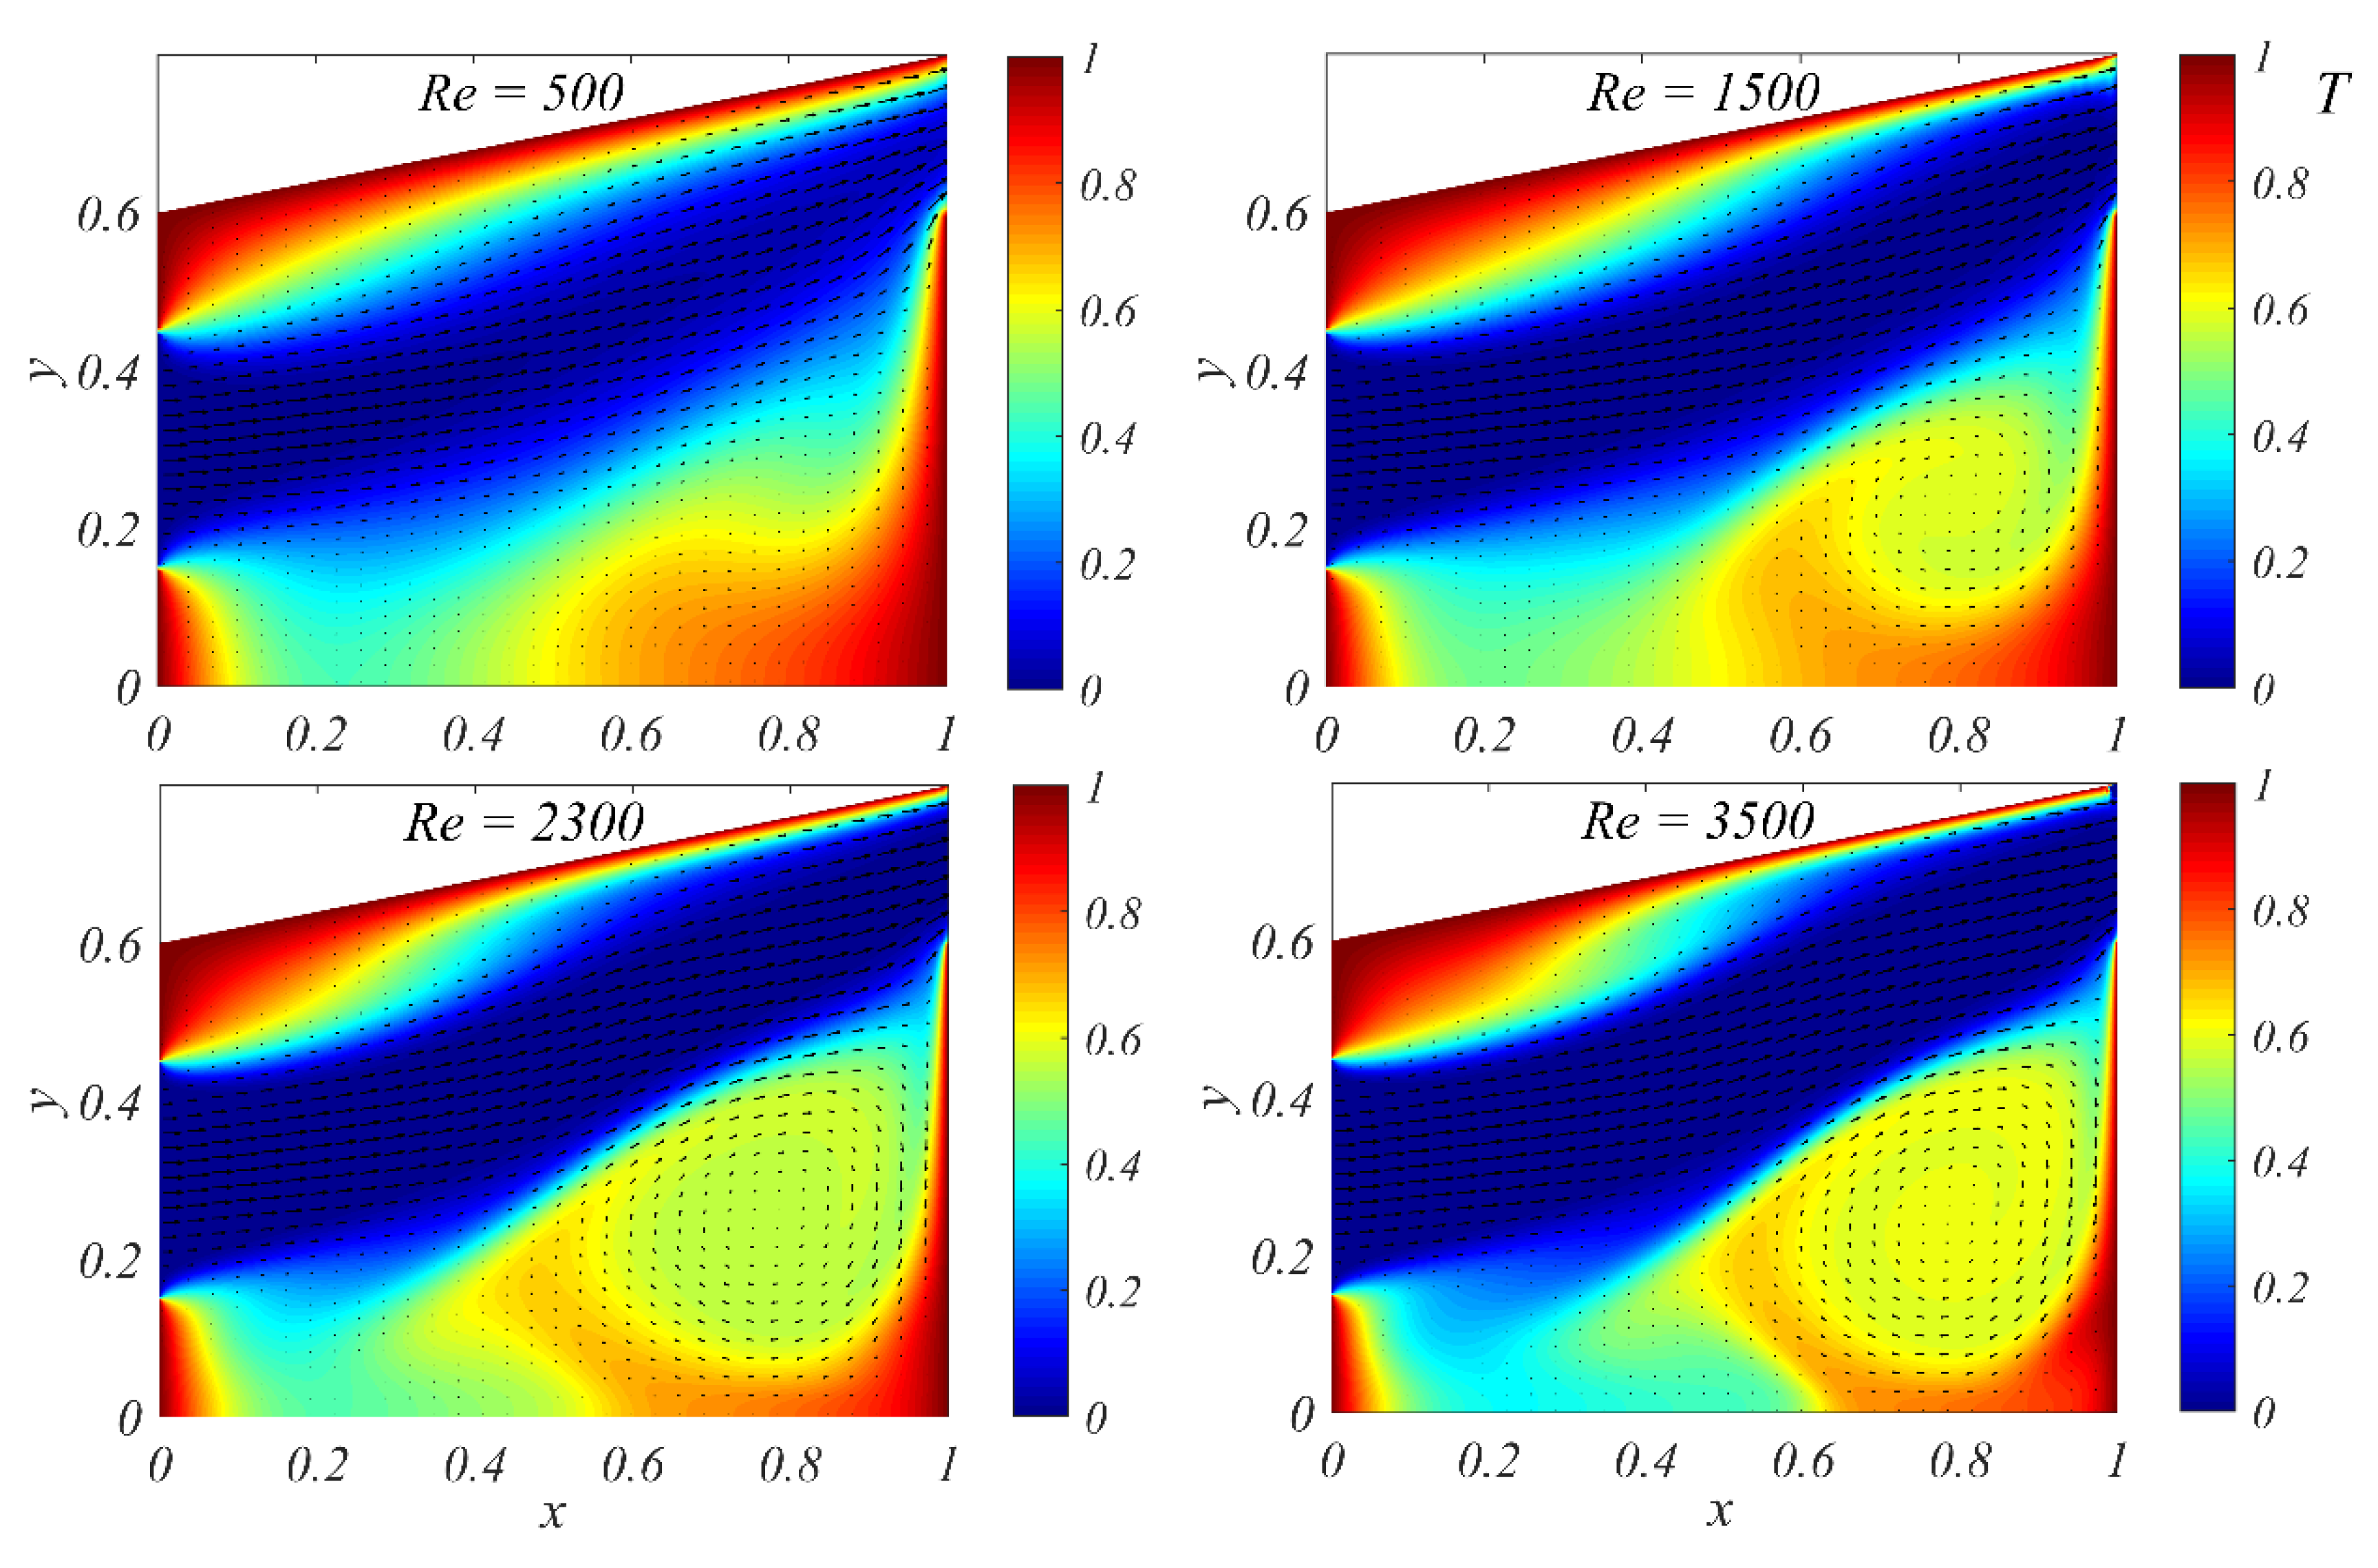
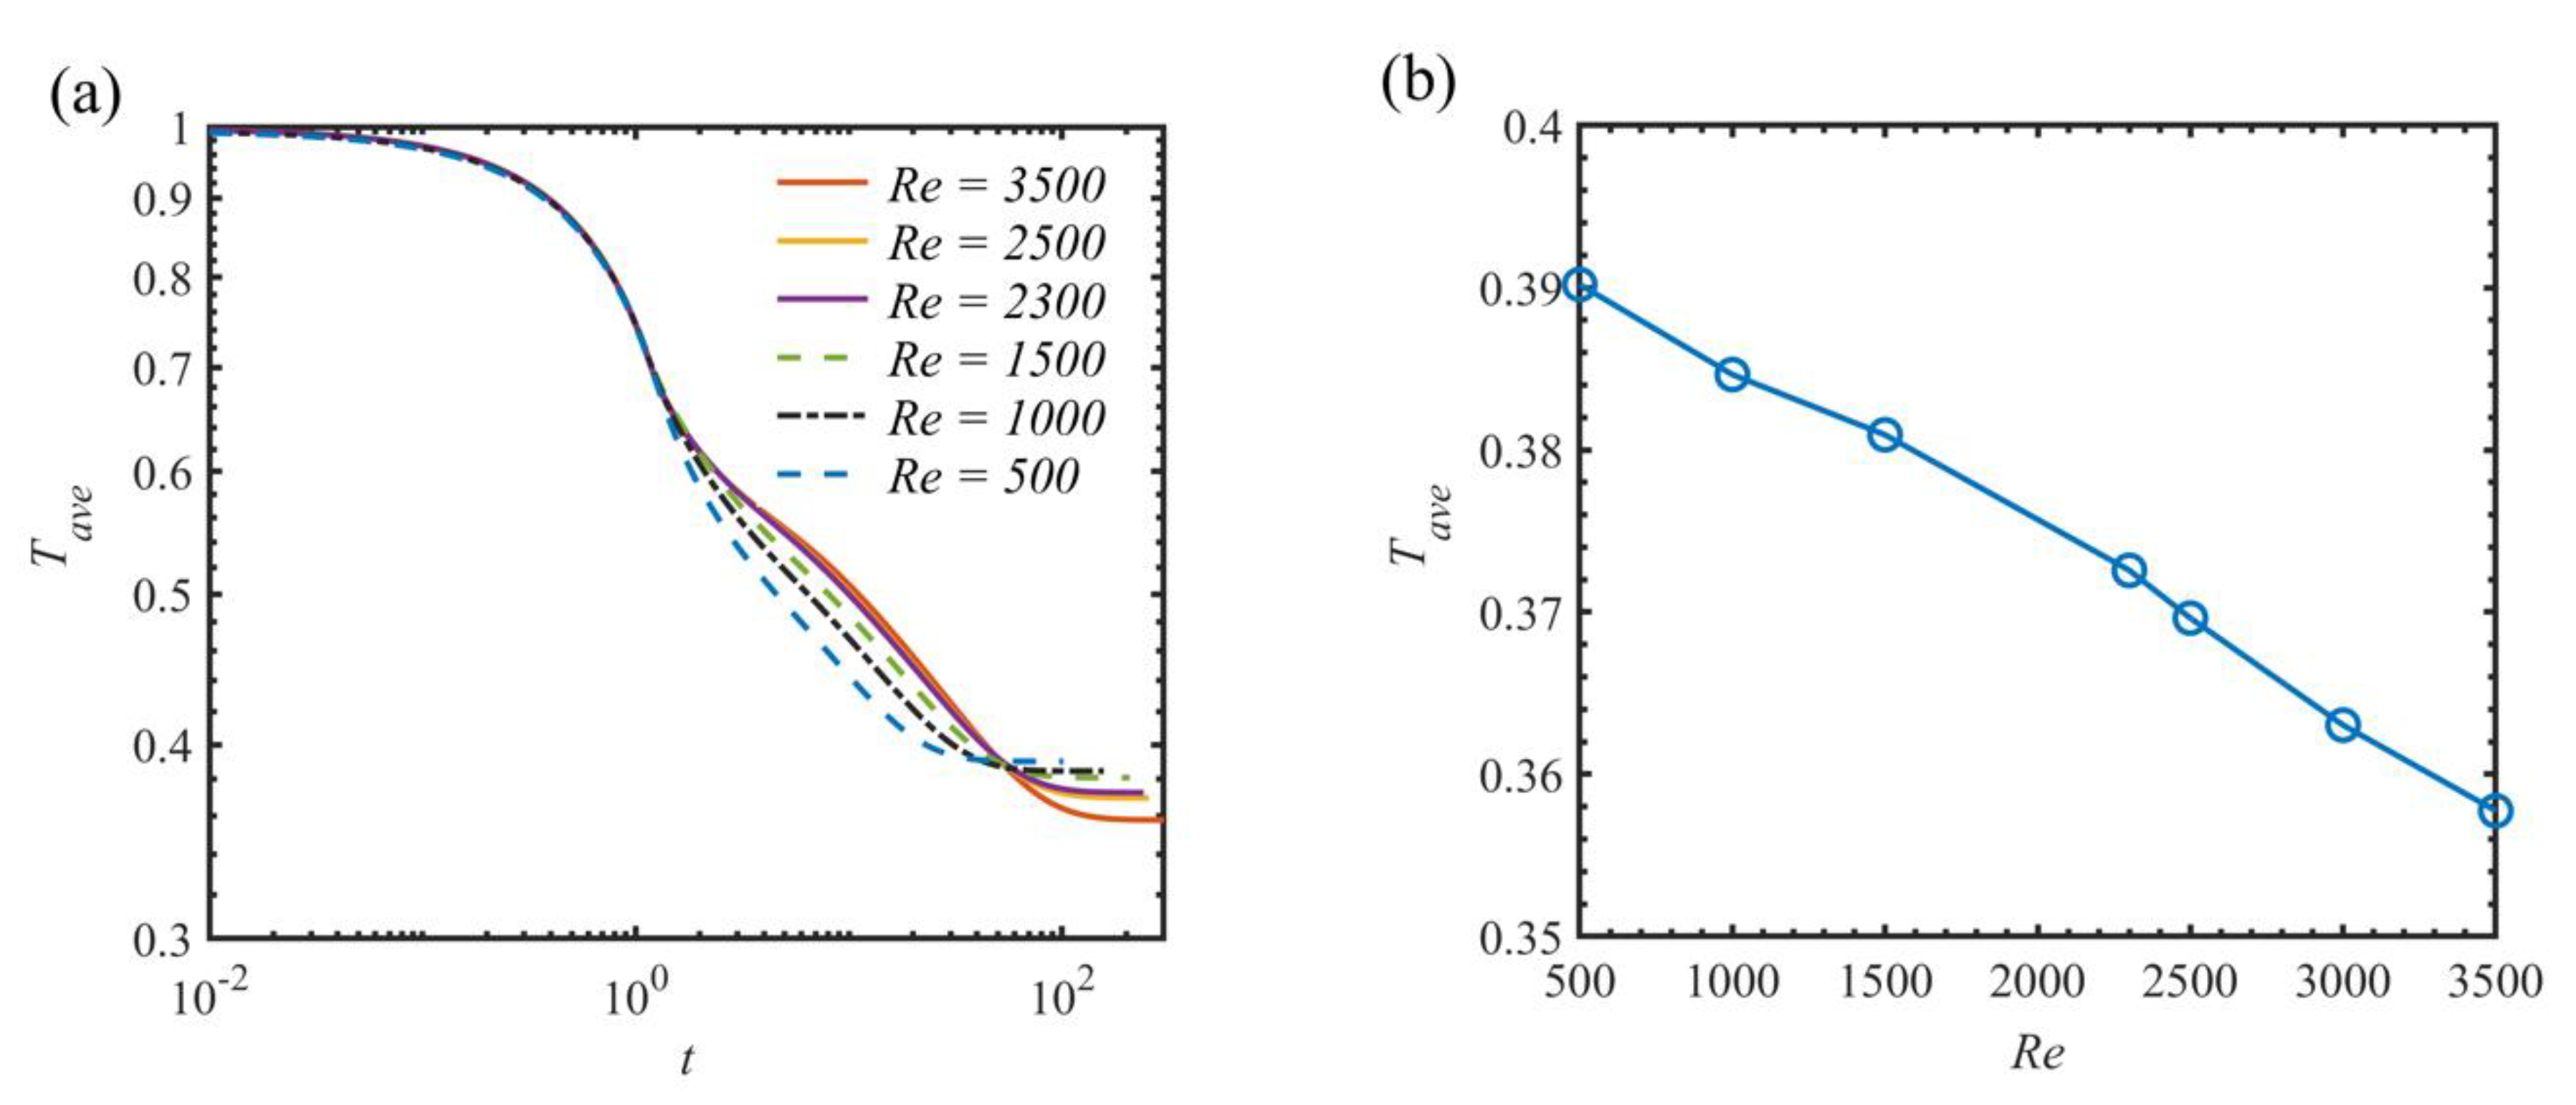
Lastly, Figure 11 shows the effect of Reynolds number on the temperature contour and fluid velocity field. Increasing the Reynolds number appears to straighten the vorticity flow, which eventually leads to a lower steady-state temperature, as shown in Figure 10. In addition, as the Reynolds number increases, it takes more time to reach steady-state for temperature field, as shown in Figure 12a. Figure 12b shows the steady-state temperature at different Reynolds numbers. Comparing the system performance for different arrangements of inlet and outlet gives design preference in this aspect. With increasing Reynolds number, interplays between viscous and thermal boundary layers might lead to the enhancement of the thermal performance [29]. As a result, with the current simulation data, we can conclude that increasing the fan velocity increases the thermal performance of the system. The velocity of the fluid at the outlet (fan location) can be the easiest way to control the Reynolds number. Also, the Reynolds number is a function of the length scale, which means it can be changed by changing the box size.
Based on parametric studies, a design recommendation can be suggested. The locations of inlet and outlet in the D case would provide a design preference for the SFC system. Also, increasing Reynolds number (i.e., increasing the fan velocity) would lead to enhancement of the thermal performance of the system. However, it should be noted that, since there are limits on the fan speed and size, these limits should be considered to optimize the performance of the system.
5. Conclusions
In this study, a prototype Sustainable Farming Compartment (SFC) was constructed and tested in an environmentally controlled laboratory and field site to evaluate the performances of the SFC in Abu Dhabi. In addition, the optimal design of SFC was identified based on the numerical parametric study. From the environmental controlled test in the laboratory and the prototype tests at the field site, the temperature drop achieved in the SFC were 5.0 °C (from the average of 22.0 °C) and 7.0 °C (from the average of 38 °C) respectively, reaching an average temperature of 31.2 °C (at the relative humidity of approximately 50%). Both experimental results coincided with the results from the psychrometric chart. The dynamic numerical simulations using a fractional-step method were performed. The simulation results show that with the SFC system there is approximately a 6–12 °C temperature drop, which is in good agreement with prototype experimental observations. The results between the energy simulation and experiments show statistically no difference (T-test p = 0.087 > 0.05). As the numerical model exhibits a good prediction for the thermal performance of the system, we performed parametric studies to evaluate the effects of the locations of a fan (outlet) and evaporative cooling system (inlet) as well as the Reynolds number. As the Reynolds number increases, it takes more time to reach steady-state for temperature field. The optimum thermal performance of the system based on the arrangement of the inlet and outlet is determined. Case D, where the inlet is located at the top of the backside while the outlet is located at the bottom, has the best cooling performance resulting in the best mixing mechanism between the cold inflow and the hot fluid inside the domain, regarding the geometry of the domain. In short, in the SFC with an evaporative cooling system in the climate conditions of Abu Dhabi, it was possible to decrease the temperature inside the SFC. Future research is required to validate the large-scale experiment “Oasis” complex and SFC in the field by using treated wastewater.
Author Contributions
J.E. conducted experimental tests and analyzed the results with M.S.M.; J.S.P. performed numerical simulations and analyzed the results with S.M.
Funding
This research was funded by research department of New York University Abu Dhabi, the Collaboration Initiative, Interdisciplinary Research, and Planning Grants at the University of Nebraska. The authors also gratefully acknowledge the financial support.
Acknowledgments
The authors acknowledge the research department of New York University Abu Dhabi (NYUAD) for funding this study and Sam Helwany at NYUAD and Al-Alili at the Petroleum Institute for their valuable comments.
Conflicts of Interest
The authors declare that there is no conflict of interest.
References
- UNCCD. United Nations Convention to Combat Desertification; UNCCD: Bonn, Germany, 1992. [Google Scholar]
- Abdelfattah, M.A.; Dawoud, M.A.H.; Shahid, S.A. Soil and water management for combating desertification–towards the implementation of the United Nations Convention to combat desertification from the UAE perspectives. In Proceedings of the International Conference on Soil Degradation, Riga, Latvia, 17–19 February 2009; pp. 17–19. [Google Scholar]
- Abdelfattah, M.A. Land degradation indicators and management options in the desert environment of Abu Dhabi, United Arab Emirates. Soil Horiz. 2009, 50, 3–10. [Google Scholar] [CrossRef]
- Abahussain, A.A.; Abdu, A.S.; Al-Zubari, W.K.; El-Deen, N.A.; Abdul-Raheem, M. Desertification in the Arab region: Analysis of current status and trends. J. Arid Environ. 2002, 51, 521–545. [Google Scholar] [CrossRef]
- Schlesinger, W.H.; Reynolds, J.F.; Cunningham, G.L.; Huenneke, L.F.; Jarrell, W.M.; Virginia, R.A.; Whitford, W.G. Biological feedbacks in global desertification. Science 1990, 247, 1043–1048. [Google Scholar] [CrossRef] [PubMed]
- Böer, B. An introduction to the climate of the United Arab Emirates. J. Arid Environ. 1997, 35, 3–16. [Google Scholar] [CrossRef]
- EAD. Maximizing recycled water use in the Emirate of Abu Dhabi. In Annual Policy Brief; EAD: Abi Dhabi, UAE, 2013. [Google Scholar]
- “The National”, UAE. Available online: http://www.thenational.ae/uae/environment/plans-to-reuse-100-of-abu-dhabis-waste-water-in-four-years (accessed on 4 November 2015).
- Sahara Forest Project. 2017. Available online: https://www.saharaforestproject.com/wp-content/uploads/2015/03/SFP_-_Intro.pdf (accessed on 24 October 2017).
- Hatfield, J.L.; Prueger, J.H. Temperature extremes: Effect on plant growth and development. Weather Clim. Extrem. 2015, 10, 4–10. [Google Scholar] [CrossRef] [Green Version]
- Camargo, J.R.; Ebinuma, C.D.; Silveira, J.L. Experimental performance of a direct evaporative cooler operating during summer in a Brazilian city. Int. J. Refrig. 2005, 28, 1124–1132. [Google Scholar] [CrossRef]
- Wu, J.M.; Huang, X.; Zhang, H. Theoretical analysis on heat and mass transfer in a direct evaporative cooler. Appl. Therm. Eng. 2009, 29, 980–984. [Google Scholar] [CrossRef]
- Wu, J.M.; Huang, X.; Zhang, H. Numerical investigation on heat and mass transfer in a direct evaporative cooler. Appl. Therm. Eng. 2009, 29, 195–201. [Google Scholar] [CrossRef]
- Stabat, P.; Marchio, D.; Orphelin, M. Pre-Design and design tools for evaporative cooling. ASHRAE Trans. 2001, 107, 501–510. [Google Scholar]
- Ibrahim, E.; Shao, L.; Riffat, S.B. Performance of porous ceramic evaporators for building the cooling application. Energy Build. 2003, 35, 941–949. [Google Scholar] [CrossRef]
- Lertsatitthanakorn, C.; Rerngwongwitaya, S.; Soponronnarit, S. Field experiments and economic evaluation of an evaporative cooling system in a silkworm rearing house. Biosyst. Eng. 2006, 93, 213–219. [Google Scholar] [CrossRef]
- Heidarinejad, G.; Bozorgmehr, M.; Delfani, S.; Esmaeelian, J. Experimental investigation of two-stage indirect/direct evaporative cooling system in various climatic conditions. Build. Environ. 2009, 44, 2073–2079. [Google Scholar] [CrossRef]
- Aljubury, I.M.A.; Ridha, H.D.A. Enhancement of evaporative cooling system in a greenhouse using geothermal energy. Renew. Energy 2017, 111, 321–331. [Google Scholar] [CrossRef]
- Prosperetti, A.; Tryggvason, G. Computational Methods for Multiphase Flow; Cambridge University Press: Cambridge, UK, 2009. [Google Scholar]
- Harlow, F.H.; Welch, J.E. Numerical calculation of time-dependent viscous incompressible flow of fluid with a free surface. Phys. Fluids 1965, 8, 2182–2189. [Google Scholar] [CrossRef]
- Ferziger, J.H.; Peric, M. Computational Methods for Fluid Dynamics; Springer Science & Business Media: Berlin/Heidelberg, Germany, 2012. [Google Scholar]
- Kim, J.; Moin, P. Application of a fractional-step method to incompressible Navier-Stokes equations. J. Comput. Phys. 1985, 59, 308–323. [Google Scholar] [CrossRef]
- Bell, J.B.; Colella, P.; Glaz, H.M. A second-order projection method for the incompressible Navier-Stokes equations. J. Comput. Phys. 1989, 85, 257–283. [Google Scholar] [CrossRef]
- Park, J.S.; Anthony, M.J. A run-around heat exchanger system to improve the energy efficiency of a home appliance using hot water. Appl. Therm. Eng. 2009, 29, 3110–3117. [Google Scholar] [CrossRef]
- Fan, S.; Lakshminarayana, B.; Barnett, M. Low-Reynolds-number k-epsilon model for unsteady turbulent boundary-layer flows. AIAA J. 1993, 31, 1777–1784. [Google Scholar] [CrossRef]
- Pasculli, A. CFD-FEM 2D Modeling of a local water flow. Some numerical results. Ital. J. Quat. Sci. 2008, 21, 215–228. [Google Scholar]
- Pasculli, A. Viscosity variability impact on 2D laminar and turbulent poiseuille velocity profiles; characteristic-based split (CBS) stabilization. In Proceedings of the 2018 5th International Conference on Mathematics and Computers in Sciences and Industry (MCSI), Corfu, Greece, 25–27 August 2018; pp. 128–134. [Google Scholar]
- “World Weather Online”. Available online: https://www.worldweatheronline.com/ (accessed on 15 December 2017).
- Incropera, F.P.; Adrienne, S.L.; Theodore, L.B.; David, P.D. Fundamentals of Heat and Mass Transfer; Wiley: New York, NY, USA, 2007. [Google Scholar]
Figure 1.
Concept of Sustainable Farming Compartment (SFC) to decrease the inside temperature ambient air.
Figure 1.
Concept of Sustainable Farming Compartment (SFC) to decrease the inside temperature ambient air.

Figure 2.
Photo of prototype experimental setup for SFC: (a) Front view with exhaust fans and (b) Back view with evaporative cooling pad and water supply system.
Figure 2.
Photo of prototype experimental setup for SFC: (a) Front view with exhaust fans and (b) Back view with evaporative cooling pad and water supply system.

Figure 3.
System schematic of the simulation model.

Figure 4.
Variation of temperature and humidity: (a) Temperature and (b) Humidity.

Figure 5.
Temperature and humidity obtained from prototype SFC test for two weeks in July and August.
Figure 5.
Temperature and humidity obtained from prototype SFC test for two weeks in July and August.

Figure 6.
A contour for temperature distribution and a vector field for fluid flow inside the simulation domain as a function of time at Re = 2300. The case of t = 241 can be regarded as a steady-state.
Figure 6.
A contour for temperature distribution and a vector field for fluid flow inside the simulation domain as a function of time at Re = 2300. The case of t = 241 can be regarded as a steady-state.

Figure 7.
An area-averaged temperature inside the simulation domain as a function of time at Re = 2300. The four different initial temperatures (T0) are used, leading to the same steady-state temperature.
Figure 7.
An area-averaged temperature inside the simulation domain as a function of time at Re = 2300. The four different initial temperatures (T0) are used, leading to the same steady-state temperature.

Figure 8.
Comparisons of temperatures obtained between dynamic numerical simulation and experimental test.
Figure 8.
Comparisons of temperatures obtained between dynamic numerical simulation and experimental test.

Figure 9.
A contour for steady-state temperature distribution and a vector field for fluid flow inside the simulation domain for different combinations of inlet and outlet locations at Re = 2300. Cases A–C: An inlet location is fixed at the middle, while an outlet location is varied. Cases D–F inlets and outlets are located at the top or bottom of the domain.

Figure 10.
Spatial average temperature vs. time for different cases (a) and steady-state temperature for different cases (b).
Figure 10.
Spatial average temperature vs. time for different cases (a) and steady-state temperature for different cases (b).

Figure 11.
A contour for steady-state temperature distribution and a vector field for fluid flow inside the simulation domain for different Reynolds number.
Figure 11.
A contour for steady-state temperature distribution and a vector field for fluid flow inside the simulation domain for different Reynolds number.

Figure 12.
Spatial average temperature vs. time for different Reynolds numbers (a) and steady-state temperature for different Reynolds numbers (b).
Figure 12.
Spatial average temperature vs. time for different Reynolds numbers (a) and steady-state temperature for different Reynolds numbers (b).


Table 1.
Material Properties for Dynamic Numerical Simulation.
| Type | Material | Thermal Conductivity W·m−1·K−1 |
|---|---|---|
| Frame | Aluminum | 101.8 |
| Walls Bottom | Plexiglass Plywood | 0.20 0.16 |
| Roof | Plexiglass Styrene sheet | 0.20 0.033 |
© 2019 by the authors. Licensee MDPI, Basel, Switzerland. This article is an open access article distributed under the terms and conditions of the Creative Commons Attribution (CC BY) license (http://creativecommons.org/licenses/by/4.0/).
Share and Cite
MDPI and ACS Style
Mousavi, M.S.; Mirfendereski, S.; Park, J.S.; Eun, J. Experimental and Numerical Analysis of a Sustainable Farming Compartment with Evaporative Cooling System. Processes 2019, 7, 823. https://doi.org/10.3390/pr7110823
AMA Style
Mousavi MS, Mirfendereski S, Park JS, Eun J. Experimental and Numerical Analysis of a Sustainable Farming Compartment with Evaporative Cooling System. Processes. 2019; 7(11):823. https://doi.org/10.3390/pr7110823
Chicago/Turabian StyleMousavi, M. Sina, Siamak Mirfendereski, Jae Sung Park, and Jongwan Eun. 2019. "Experimental and Numerical Analysis of a Sustainable Farming Compartment with Evaporative Cooling System" Processes 7, no. 11: 823. https://doi.org/10.3390/pr7110823
Note that from the first issue of 2016, this journal uses article numbers instead of page numbers. See further details here.