
Structure–Activity Prediction of ACE Inhibitory/Bitter Dipeptides—A Chemometric Approach Based on Stepwise Regression


 , , and
Abstract
:1. Introduction
2. Results
3. Discussion
4. Materials and Methods
4.1. Dataset Construction
4.1.1. Peptides
4.1.2. Variables
4.2. Protocol
5. Conclusions
Author Contributions
Funding
Conflicts of Interest
Abbreviations
| ACE | Angiotensin converting enzyme |
| α-value | Significance level |
| BR | Backward regression |
| FR | Forward regression |
| F-test | Fisher–Snedecor test |
| IC50 | Concentration of peptide corresponding to its half-maximal inhibitory activity [µM] |
| MLR | Multiple regression |
| p-value | Probability of a given statistical model |
| R | Correlation coefficient |
| Rcaf. | Bitterness of peptide related to that of 1 mM caffeine solution |
| R2 | Determination coefficient |
| SW-W | Normality Shapiro–Wilk’s test |
| t-test | Student’s t test |
References
- Albenzio, M.; Santillo, A.; Caroprese, M.; della Malva, A.; Marino, R. Bioactive peptides in animal food products. Foods 2017, 6, 35. [Google Scholar] [CrossRef] [PubMed]
- Wu, J.; Liao, W.; Udenigwe, C.C. Revisiting the mechanism of ACE inhibitory peptides from food proteins. Trends Food Sci. Food Technol. 2017, 69, 214–219. [Google Scholar] [CrossRef]
- Xie, C.-L.; Kim, J.-S.; Ha, J.-M.; Choung, S.-Y.; Choi, Y.-J. Angiotensin-I-converting enzyme inhibitor derived from cross-linked oyster protein. Biomed. Res. Int. 2015, 2015, 379234. [Google Scholar] [CrossRef] [PubMed]
- Shamloo, M.; Eck, P.; Beta, T. Angiotensin converting enzyme inhibitory peptides derived from cereals. J. Hum. Nutr. Food Sci. 2015, 3, 1057. [Google Scholar]
- Iwaniak, A.; Minkiewicz, P.; Darewicz, M. Food-originating ACE inhibitors, including antihypertensive peptides, as preventive food components in blood pressure reduction. Compr. Rev. Food Sci. Food Saf. 2014, 13, 114–134. [Google Scholar] [CrossRef]
- Kumar, R.; Kumar, A.; Sharma, R.; Baruwa, A. Pharmacological review on natural ACE inhibitors. Der Pharm. Lett. 2010, 2, 273–293. [Google Scholar]
- Tidona, F.; Criscione, A.; Guastella, A.M.; Zuccaro, A.; Bordonaro, S.; Marletta, D. Bioactive peptides in dairy products. Ital. J. Anim. Sci. 2009, 8, 315–340. [Google Scholar] [CrossRef]
- Mäkinen, S.; Johannson, T.; Vegarud, E.G.; Pihlava, J.M.; Pihlanto, A. Angiotensin I-converting enzyme inhibitory and antioxidant properties of rapeseed hydrolysates. J. Funct. Foods 2012, 4, 575–583. [Google Scholar] [CrossRef]
- Antosova, Z.; Mackova, M.; Kral, V.; Macek, T. Therapeutic application of peptides and proteins: Parenteral forever? Trends Biotechnol. 2009, 27, 629–635. [Google Scholar] [CrossRef]
- Iwaniak, A.; Minkiewicz, P.; Darewicz, M.; Hrynkiewicz, M. Food protein-originating peptides as tastants—Physiological, technological, sensory, and bioinformatic approaches. Food Res. Int. 2016, 89, 27–38. [Google Scholar] [CrossRef]
- Kęska, P.; Stadnik, J. Taste-active peptides and amino acids of pork meat as components of dry-cured meat products: An in-silico study. J. Sens. Stud. 2017, 32, e12301. [Google Scholar] [CrossRef]
- Wu, J.; Aluko, R.E. Quantitative structure-activity relationship study of bitter di- and tri-peptides including relationship with angiotensin I-converting enzyme inhibitory activity. J. Pept. Sci. 2007, 13, 63–69. [Google Scholar] [CrossRef] [PubMed]
- Pripp, A.H.; Ardö, S. Modelling relationship between angiotensin-(I)-converting enzyme inhibition and the bitter taste of peptides. Food Chem. 2007, 102, 880–888. [Google Scholar] [CrossRef]
- Udenigwe, C.C. Bioinformatics approaches, prospects and challenges of food bioactive peptide research. Trends Food Sci. Technol. 2014, 36, 134–143. [Google Scholar] [CrossRef]
- Darewicz, M.; Borawska, J.; Vegarud, G.E.; Minkiewicz, P.; Iwaniak, A. Angiotensin I-converting enzyme (ACE) inhibitory activity and ACE inhibitory peptides of salmon (Salmo salar) protein hydrolysates obtained by human and porcine gastrointestinal enzymes. Int. J. Mol. Sci. 2014, 15, 14077–14101. [Google Scholar] [CrossRef] [PubMed]
- Pripp, A.H.; Isaksson, T.; Stepaniak, L.; Sørhaug, T. Quantitative structure-activity relationship modelling of ACE-inhibitory peptides derived from milk proteins. Eur. Food Res. Technol. 2004, 219, 579–583. [Google Scholar] [CrossRef]
- Wu, J.; Aluko, R.E.; Nakai, S. Structural requirements of angiotensin I-converting enzyme inhibitory peptides: Quantitative structure-activity relationship study of di- and tripeptides. J. Agric. Food Chem. 2006, 54, 732–738. [Google Scholar] [CrossRef]
- Koyama, M.; Hattori, S.; Amano, Y.; Watanabe, M.; Nakamura, K. Blood pressure-lowering peptides from neo-fermented buckwheat sprouts: A new approach to estimating ACE-inhibitory activity. PLoS ONE 2014, 9, e105802. [Google Scholar] [CrossRef]
- Iwaniak, A.; Minkiewicz, P.; Darewicz, M.; Protasiewicz, M.; Mogut, D. Chemometrics and cheminformatics in the analysis of biologically active peptides from food sources. J. Funct. Foods 2015, 16, 334–351. [Google Scholar] [CrossRef]
- Iwaniak, A.; Hrynkiewicz, M.; Bucholska, J.; Minkiewicz, P.; Darewicz, M. Understanding the nature of bitter-taste di- and tripeptides derived from food proteins based on chemometric analysis. J. Food Biochem. 2018, 42, e12500. [Google Scholar] [CrossRef]
- National Center for Biotechnology Information. Available online: http://www.ncbi.nlm.nih.gov (accessed on 1 June 2018).
- Web of Science. Available online: https://webofknowledge.com (accessed on 1 June 2018).
- Granato, D.; de Araújo Calado, V.M.; Jarvis, B. Observations on the use of statistical methods in Food science and Technology. Food Res. Int. 2014, 55, 137–149. [Google Scholar] [CrossRef]
- Latha, D.P.P.; Sharmila, D.J.S. QSAR study for the prediction of IC50 and Log P for 5-N-acetyl-beta-D-neuraminic acid structurally similar compounds using stepwise (multivariate) linear regression. Int. J. Chem. Res. 2010, 2, 32–38. [Google Scholar]
- Iwaniak, A.; Minkiewicz, P.; Darewicz, M.; Sieniawski, K.; Starowicz, P. BIOPEP database of sensory peptides and amino acids. Food Res. Int. 2016, 85, 155–161. [Google Scholar] [CrossRef] [PubMed]
- Minkiewicz, P.; Dziuba, J.; Iwaniak, A.; Dziuba, M.; Darewicz, M. BIOPEP and other programs for processing bioactive peptide sequences. J. Aoac Int. 2008, 91, 965–980. [Google Scholar] [PubMed]
- Bursac, Z.; Gauss, C.H.; Williams, D.K.; Hosmer, D.W. Purposeful selection of variables in logistic regression. Source Code Biol. Med. 2008, 3, 17. [Google Scholar] [CrossRef] [PubMed] [Green Version]
- Wang, M.; Wright, J.; Brownlee, A.; Buswell, R. A comparison of approaches to stepwise regression on variables sensitivities in building simulation and analysis. Energy Build. 2016, 127, 313–326. [Google Scholar] [CrossRef] [Green Version]
- Wiegand, R.E. Performance of using multiple stepwise algorithms for variable selection. Stat. Med. 2010, 29, 1647–1659. [Google Scholar] [CrossRef]
- Latha, D.P.P.; Sharmila, D.J.S. QSAR study for the prediction of half maximal inhibitory concentration of compounds structurally similar to glicerol. Turk. J. Biochem. 2010, 35, 289–292. [Google Scholar]
- Collantes, E.R.; Dunn, W.J. Amino acid side chain descriptors for quantitative structure-activity relationship studies of peptide analogues. J. Med. Chem. 1995, 38, 2705–2713. [Google Scholar] [CrossRef]
- Tong, J.-B.; Chang, J.; Liu, S.-L.; Bai, M. A quantitative structure-activity relationship (QSAR) study of drugs based on a new descriptor of amino acid. J. Serb. Chem. Soc. 2015, 80, 343–353. [Google Scholar] [CrossRef]
- Soltani, S.; Haghaei, H.; Shayanfar, A.; Vallipour, J.; Zeynali, K.A.; Jouyban, A. QSBR study of bitter peptides: Application of GA-PLS in combination with MLR, SVM, and ANN approaches. Biomed. Res. Int. 2013, 2013, 501310. [Google Scholar] [CrossRef] [PubMed]
- Kim, H.; Li-Chan, E.C.Y. Application of Fourier transform Raman spectroscopy for prediction of bitterness of peptides. Appl. Spectrosc. 2006, 60, 1297–1306. [Google Scholar] [CrossRef] [PubMed]
- Cheung, I.W.Y.; Li-Chan, E.C.Y. Angiotensin-I converting enzyme inhibitory activity and bitterness of enzymatically-produced hydrolysates of shrimp (Pandalopsis dispar) processing byproducts investigated by Taguchi design. Food Chem. 2010, 122, 1003–1012. [Google Scholar] [CrossRef]
- Pripp, A.H.; Isaksson, T.; Stepaniak, L.; Sørhaug, T.; Ardö, Y. Quantitative structure activity relationship modelling of peptides and proteins as a tool food science. Trends Food Sci. Technol. 2005, 16, 484–494. [Google Scholar] [CrossRef]
- FitzGerald, R.J.; Murray, B.A.; Walsh, D.J. Hypotensive peptides from milk proteins. J. Nutr. 2004, 134, 980S–988S. [Google Scholar] [CrossRef] [PubMed]
- Vermeirssen, V.; van der Bent, A.; Van Camp, J.; van Amerongen, A.; Verstraete, W. A quantitative in silico analysis calculates angiotensin I converting enzyme (ACE) inhibitory activity in pea and whey protein digests. Biochimie 2004, 86, 231–239. [Google Scholar] [CrossRef] [PubMed]
- Asao, M.; Iwamura, H.; Akamatsu, M.; Fujita, T. Quantitative structure-activity relationships of the bitter thresholds of amino acids, peptides, and their derivatives. J. Med. Chem. 1987, 30, 1873–1879. [Google Scholar] [CrossRef] [PubMed]
- Zhou, H.; Zhou, Y. Quantifying the effect of burial of amino acid residues on protein stability. Proteins 2004, 54, 315–322. [Google Scholar] [CrossRef]
- Shahidi, F.; Zhong, Y. Bioactive peptides. J. AOAC Int. 2008, 91, 914–932. [Google Scholar]
- Aluko, R.E. Structural characteristics of food protein-derived bitter peptides. In Bitterness. Perception, Chemistry and Food Processing, 1st ed.; Aliani, M., Eskin, M.N.A., Eds.; Jon Wiley & Sons, Inc.: Hoboken, NJ, USA, 2017; pp. 105–129. ISBN 978-1118590284. [Google Scholar]
- BIOPEP-UWM Database. Available online: http://www.uwm.edu.pl/biochemia (accessed on 1 April–30 June 2018).
- Neubig, R.E.; Spedding, M.; Kenakin, T.; Christopoulos, A. International Union of Pharmacology Committee on Receptor Nomenclature and Drug Classification. XXXVIII. Update on terms and symbols in quantitative pharmacology. Pharmacol. Rev. 2003, 55, 597–606. [Google Scholar] [CrossRef]
- Iwaniak, A.; Dziuba, J. Animal and plant origin proteins as the precursors of peptides with ACE inhibitory activity. Proteins evaluation by means of in silico methods. Food Technol. Biotechnol. 2009, 47, 441–449. [Google Scholar]
- Zimmerman, J.M.; Eliezer, N.; Simha, R.J. The characterization of amino acid sequences in proteins by statistical methods. Theor. Biol. 1968, 21, 170–201. [Google Scholar] [CrossRef]
- Grantham, R. Amino acid difference formula to explain protein evolution. Science 1974, 185, 862–864. [Google Scholar] [CrossRef] [PubMed]
- Kyte, J.; Doolitle, R.F. A simple method for displaying the hydrophatic character of a protein. J. Mol. Biol. 1982, 157, 105–132. [Google Scholar] [CrossRef]
- Charton, M. Protein folding and the genetic code: An alternative quantitative model. J. Theor. Biol. 1981, 91, 115–123. [Google Scholar] [CrossRef]
- Charton, M.; Charton, B.I. The structural dependence of amino acid hydrophobicity parameters. J. Theor. Biol. 1982, 99, 629–644. [Google Scholar] [CrossRef]
- Dawson, D.M. The Biochemical Genetics of Man; Brock, D.J.H., Mayo, O., Eds.; Academic Press: New York, NY, USA, 1972; pp. 1–38. [Google Scholar]
- ProtScale. Available online: http://web.expasy.org/protscale (accessed on 1 April–30 June 2018).
- Gasteiger, E.; Hoogland, C.; Gattiker, A.; Duvaud, S.; Wilkins, M.R.; Appel, R.D.; Bairoch, A. Protein identification and analysis tools on the expasy server. In The Proteomics Protocols Handbook; Walkes, J.M., Ed.; Humana Press: Totowa, NJ, USA, 2005; pp. 571–607. ISBN 978-1-58829-343-5. [Google Scholar]
- Biological Magnetic Resonance Data Bank. Available online: http://www.bmrb.wisc.edu/ref_info/aadata.dat (accessed on 1 April–30 June 2018).
- Ulrich, E.L.; Akutsu, H.; Doreleijers, J.F.; Harano, Y.; Ioannidis, Y.E.; Lin, J.; Markley, J.L. BioMagResBank. Nucl. Acids Res. 2008, 36, D402–D408. [Google Scholar] [CrossRef]
- AAindex Database. Available online: http://www.genome.jp (accessed on 1 April 2018).
- Kawashima, S.; Pokarowski, P.; Pokarowska, M.; Kolinski, A.; Katayama, T.; Kanehisa, M. AAindex: Amino acid index database, progress report 2008. Nucleic Nucl. Acids Res. 2008, 36, D202–D205. [Google Scholar] [CrossRef]
Sample Availability: Not available. |


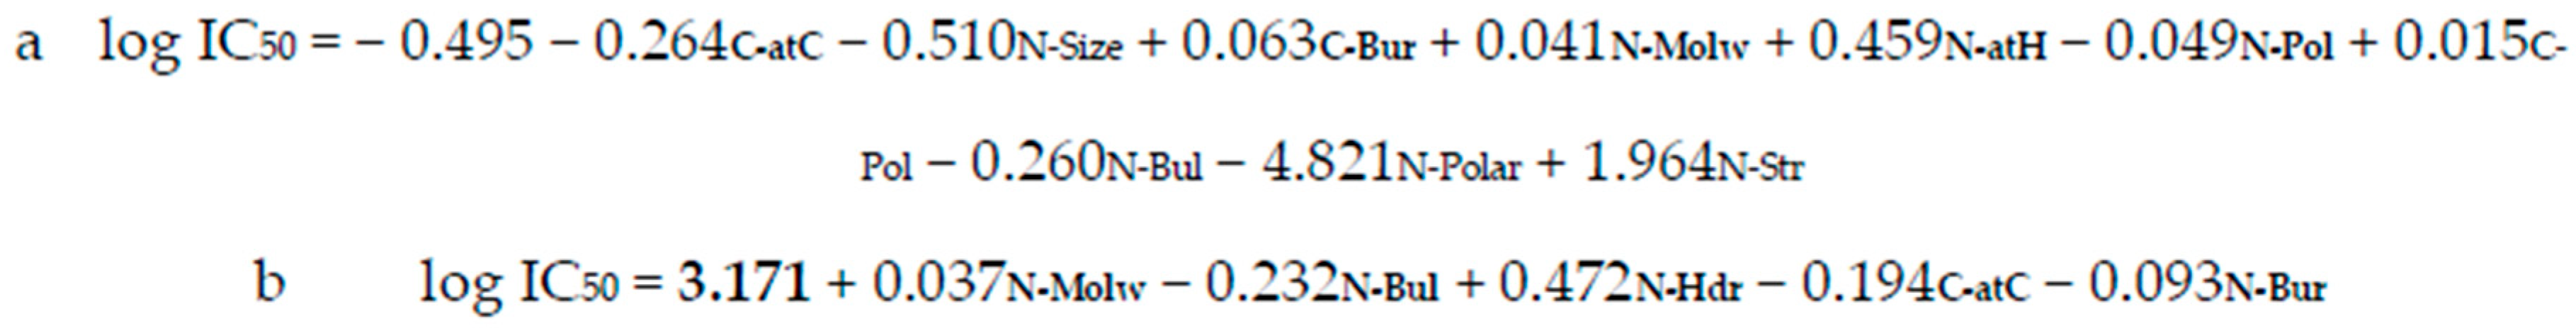
| Statistical Data | Forward Regression (FR) | Backward Regression (BR) |
|---|---|---|
| F | (10,17) 1 17.1 | (5,22) 1 14.1 |
| R | 0.95 | 0.87 |
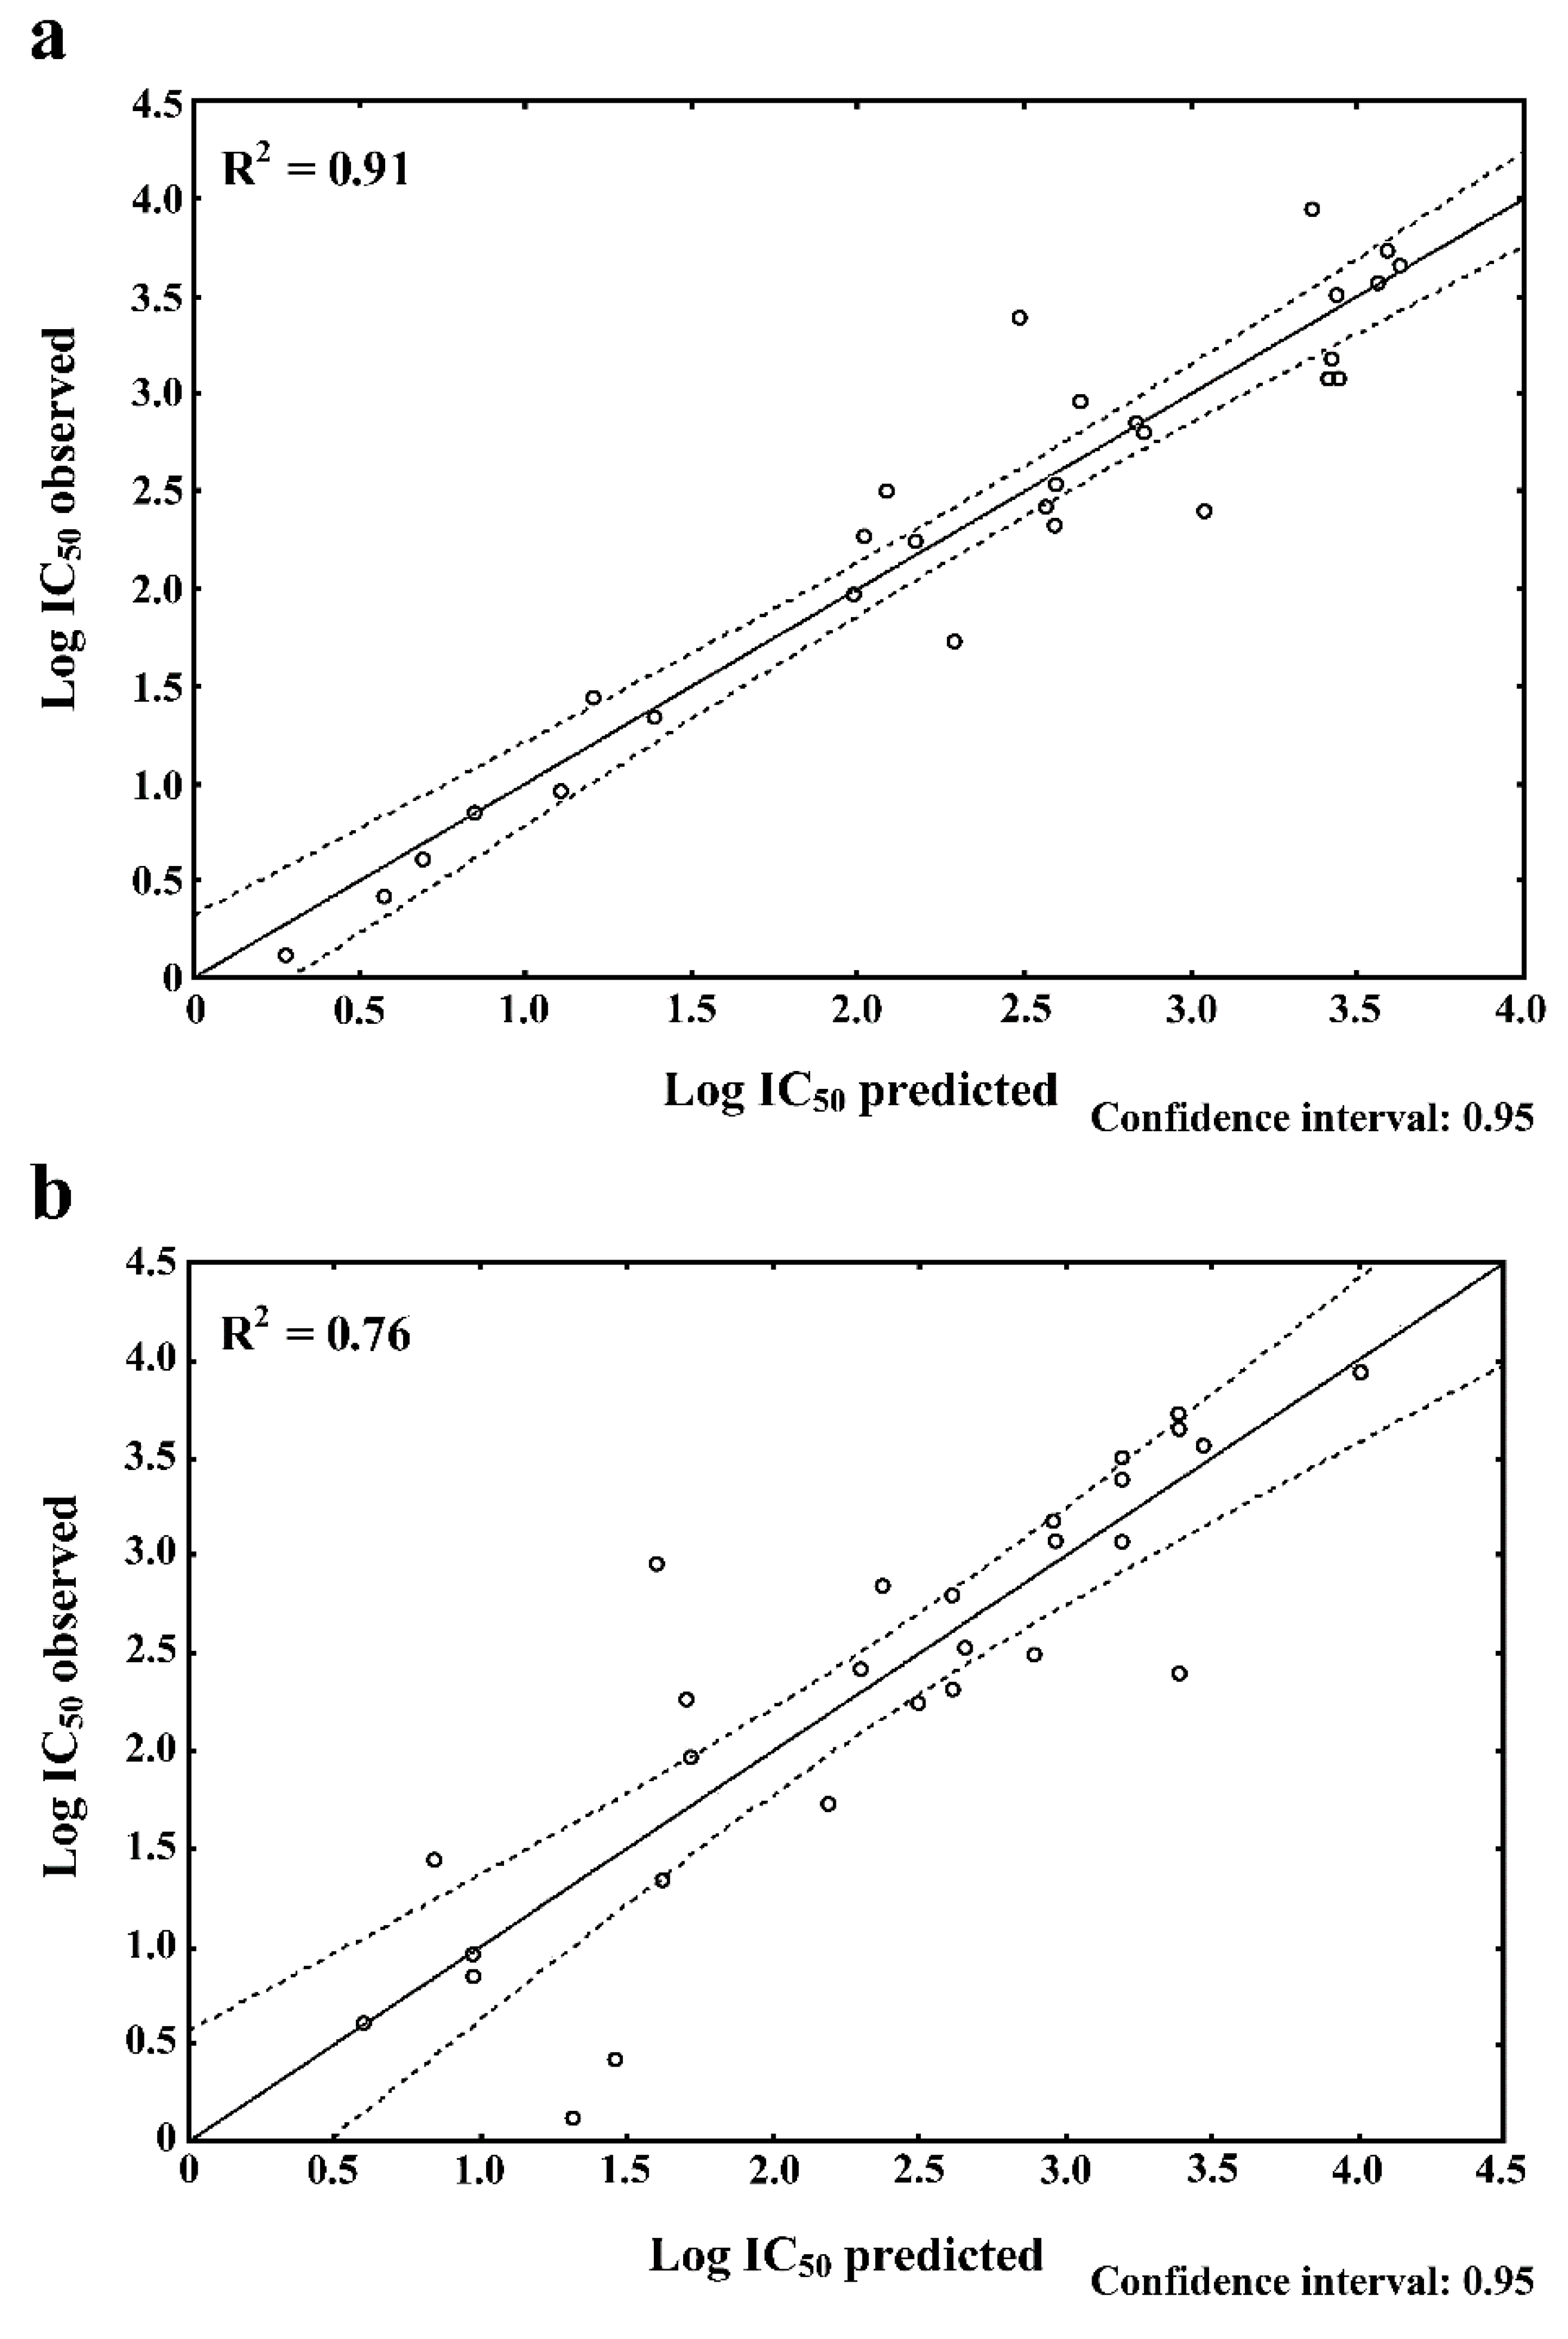
| R2 | 0.91 | 0.76 |
| Adjusted R2 | 0.86 | 0.71 |
| p | 0.000001 | 0.000003 |
| Standard estimation error | 0.41 | 0.58 |
| Statistically significant variables 2 | C-atC, C-Bur, N-Molw, N-atH, N-Pol | N-Molw, N-Bul, N-Hdr, C-atC, N-Bur |
| FR | BR | ||||||
|---|---|---|---|---|---|---|---|
| Dipeptides | Log IC50 | Rcaf. 1 | Peptides | Log IC50 | Rcaf. | ||
| Observed | Predicted | Observed | Predicted | ||||
| GR | 3.51 | 3.43 | 0.01 | GL | 3.40 | 3.19 | 0.04 |
| YP | 2.86 | 2.83 | 0.05 | LG | 3.94 | 4.00 | 0.05 |
| RR | 2.43 | 2.56 | 0.13 | RR | 2.43 | 2.30 | 0.13 |
| FG2 | 3.57 | 3.55 | 0.17 | FG | 3.57 | 3.47 | 0.17 |
| GV | 3.66 | 3.62 | 0.22 | GV | 3.66 | 3.38 | 0.22 |
| EY | 0.43 | 0.57 | 0.25 | IG | 3.08 | 2.96 | 0.22 |
| KP | 1.34 | 1.38 | 0.33 | YG | 3.18 | 2.95 | 0.33 |
| PR | 0.61 | 0.69 | 0.33 | PR2 | 0.61 | 0.59 | 0.33 |
| VY | 0.85 | 0.84 | 0.33 | VY | 0.85 | 0.97 | 0.33 |
| VF | 0.96 | 1.10 | 0.33 | VF | 0.96 | 0.97 | 0.33 |
| RF | 1.97 | 1.98 | 0.4 | RF | 1.97 | 1.72 | 0.4 |
| GE | 3.73 | 3.58 | 0.67 | GI | 3.08 | 3.19 | 0.44 |
| LF | 2.54 | 2.59 | 0.77 | LF | 2.54 | 2.65 | 0.77 |
| GF | 2.80 | 2.85 | 0.83 | GF | 2.80 | 2.61 | 0.83 |
| RP | 2.26 | 2.17 | 1.25 | ↑ Total: 14 (BR) | |||
| ↑ Total: 15 (FR) | Common dipeptides (9): PR, VY, VF, RF, RR, LF, GF, FG, GV | ||||||
| Model | Log Rcaf. = f (Observed log IC50) | Log Rcaf. = f (Predicted log IC50) | ||
|---|---|---|---|---|
| FR | R2 = 0.10 | R = −0.32 | R2 = 0.10 | R = −0.22 |
| BR | R2 = 0.05 | R = −0.32 | R2 = 0.05 | R = −0.23 |
| p | 0.09 | 0.25 | ||
© 2019 by the authors. Licensee MDPI, Basel, Switzerland. This article is an open access article distributed under the terms and conditions of the Creative Commons Attribution (CC BY) license (http://creativecommons.org/licenses/by/4.0/).
Share and Cite
Hrynkiewicz, M.; Iwaniak, A.; Bucholska, J.; Minkiewicz, P.; Darewicz, M. Structure–Activity Prediction of ACE Inhibitory/Bitter Dipeptides—A Chemometric Approach Based on Stepwise Regression. Molecules 2019, 24, 950. https://doi.org/10.3390/molecules24050950
Hrynkiewicz M, Iwaniak A, Bucholska J, Minkiewicz P, Darewicz M. Structure–Activity Prediction of ACE Inhibitory/Bitter Dipeptides—A Chemometric Approach Based on Stepwise Regression. Molecules. 2019; 24(5):950. https://doi.org/10.3390/molecules24050950
Chicago/Turabian StyleHrynkiewicz, Monika, Anna Iwaniak, Justyna Bucholska, Piotr Minkiewicz, and Małgorzata Darewicz. 2019. "Structure–Activity Prediction of ACE Inhibitory/Bitter Dipeptides—A Chemometric Approach Based on Stepwise Regression" Molecules 24, no. 5: 950. https://doi.org/10.3390/molecules24050950