On the Variability of Stratification in the Freshwater-Influenced Laptev Sea Region
 Markus A. Janout1*
  Jens Hölemann1
  Georgi Laukert2
  Alexander Smirnov3
  Thomas Krumpen1 Dorothea Bauch2,4
  Leonid Timokhov3
- 1Alfred-Wegener-Institute Helmholtz Center for Polar and Marine Research, Bremerhaven, Germany
- 2Geomar Helmholtz Center for Ocean Research, Kiel, Germany
- 3Arctic and Antarctic Research Institute, Saint Petersburg, Russia
- 4Leibniz-Laboratory, University of Kiel, Kiel, Germany
In this paper, we investigate the seasonal and spatial variability of stratification on the Siberian shelves with a case study from the Laptev Sea based on shipboard hydrographic measurements, year-round oceanographic mooring records from 2013 to 2014 and chemical tracer-based water mass analyses. In summer 2013, weak onshore-directed winds caused spreading of riverine waters throughout much of the eastern and central shelf. In contrast, strong southerly winds in summer 2014 diverted much of the freshwater to the northeast, which resulted in 50% less river water and significantly weaker stratification on the central shelf compared with the previous year. Our year-long records additionally emphasize the regional differences in water column structure and stratification, where the northwest location was well-mixed for 6 months and the central and northeast locations remained stratified into spring due to the lower initial surface salinities of the river-influenced water. A 26 year record of ocean reanalysis highlights the region’s interannual variability of stratification and its dependence on winds and sea ice. Prior the mid-2000s, river runoff to the perennially ice-covered central Laptev Sea shelf experienced little surface forcing and river water was maintained on the shelf. The transition toward less summer sea ice after the mid-2000s increased the ROFI’s (region of freshwater influence) exposure to summer winds. This greatly enhanced the variability in mixed layer depth, resulting in several years with well-mixed water columns as opposed to the often year-round shallow mixed layers before. The extent of the Lena River plume is critical for the region since it modulates nutrient fluxes and primary production, and further controls intermediate heat storage induced by lateral density gradients, which has implications for autumnal freeze-up and the eastern Arctic sea ice volume.
MAIN POINTS
1. CTD surveys and moorings highlight the regional and temporal variations in water column stratification on the Laptev Sea shelf.
2. Summer winds increasingly control the extent of the region of freshwater influence under decreasing sea ice.
3. Further reductions in sea ice increases surface warming, heat storage, and the interannual variability in mixed layer depth.
Introduction
Coincident with the retreating summer sea ice cover in the Arctic Ocean, primary production increased by 30% between 1998 and 2012, as suggested by satellite ocean color measurements (Arrigo and van Dijken, 2015). Longer open water seasons inarguably enhance the photosynthetic active radiation (PAR), which enhances the limiting role of nutrients in the future Arctic ecosystem. The supply of nutrients, however, apart from continental discharge, depends on vertical mixing rates and therefore is regulated by stratification on a Pan-Arctic scale (Randelhoff et al., 2020). Model projections by Slagstad et al. (2015) on the future state of the Arctic Ocean ecosystem predict only regional increases in new production such as along the continental slopes. The slope regions stand out as biological hotspots and are among the fastest changing Arctic regions (Bluhm et al., 2020), with increasing influence of the Pacific and Atlantic water inflows, which regionally reduces sea ice and weakens stratification (Polyakov et al., 2020a, b). Slagstad et al. (2015) predictions further imply that new production, despite increasing PAR, will not significantly change in most Arctic regions, due to stratification enhanced by ice melt and surface warming. The physical processes and conditions (vertical mixing and stratification) that provide the base for these projections, however, are generally not well-represented in large-scale models as intense measurement efforts are needed to observe the seasonal and interannual variability of stratification. These are unknown from most Arctic regions, in particular from the Siberian shelves, which are among those regions changing fastest in recent decades.
The Siberian interior shelf seas [Kara, Laptev and East Siberian Seas (ESS)] are characterized by freshwater runoff from large rivers and sea ice formation and melt (Williams and Carmack, 2015). Vast regions of these shelves are covered by landfast ice with frequent polynyas along the ice edge and large sea ice production rates (Preußer et al., 2019). The Ob and Yenisey Rivers (Kara Sea), the Lena River (Laptev Sea) and the Kolyma River (East Siberian Sea) are the four largest Siberian Asian Rivers (Shiklomanov et al., 2018) and control the surface salinity distribution on these shelves (Figure 1). In particular the Ob and Yenisey estuaries and the regions surrounding the Lena Delta feature vast areas with brackish surface waters, which form a near-contiguous fresh domain along the Arctic coasts (Carmack et al., 2015, 2016). Small parts of the Siberian river water may exit the Arctic southward through the western Bering Strait, while the majority of freshwater propagates northward via the Transpolar Drift and eastward toward the Beaufort Gyre (Morison et al., 2012), the freshwater storage system of the Arctic Ocean (Proshutinsky et al., 2009). Although different in volume, the rivers largely share their seasonality in discharge (Figure 2). Nearly 50% of the annual (Lena and Yenisey) runoff is shed between mid-May and mid-July around the spring freshet with the peak discharge occurring in early June. After a few weeks, runoff rates decrease and level out at reduced late-summer volumes before decreasing to a low winter baseline outflow. The Kolyma River outflow is nearly absent during winter, while the Lena and Ob Rivers maintain a base flow of ∼0.5 km3 day–1. The Yenisey’s winter runoff is comparatively large with ∼0.9 km3 day–1 between November and May.
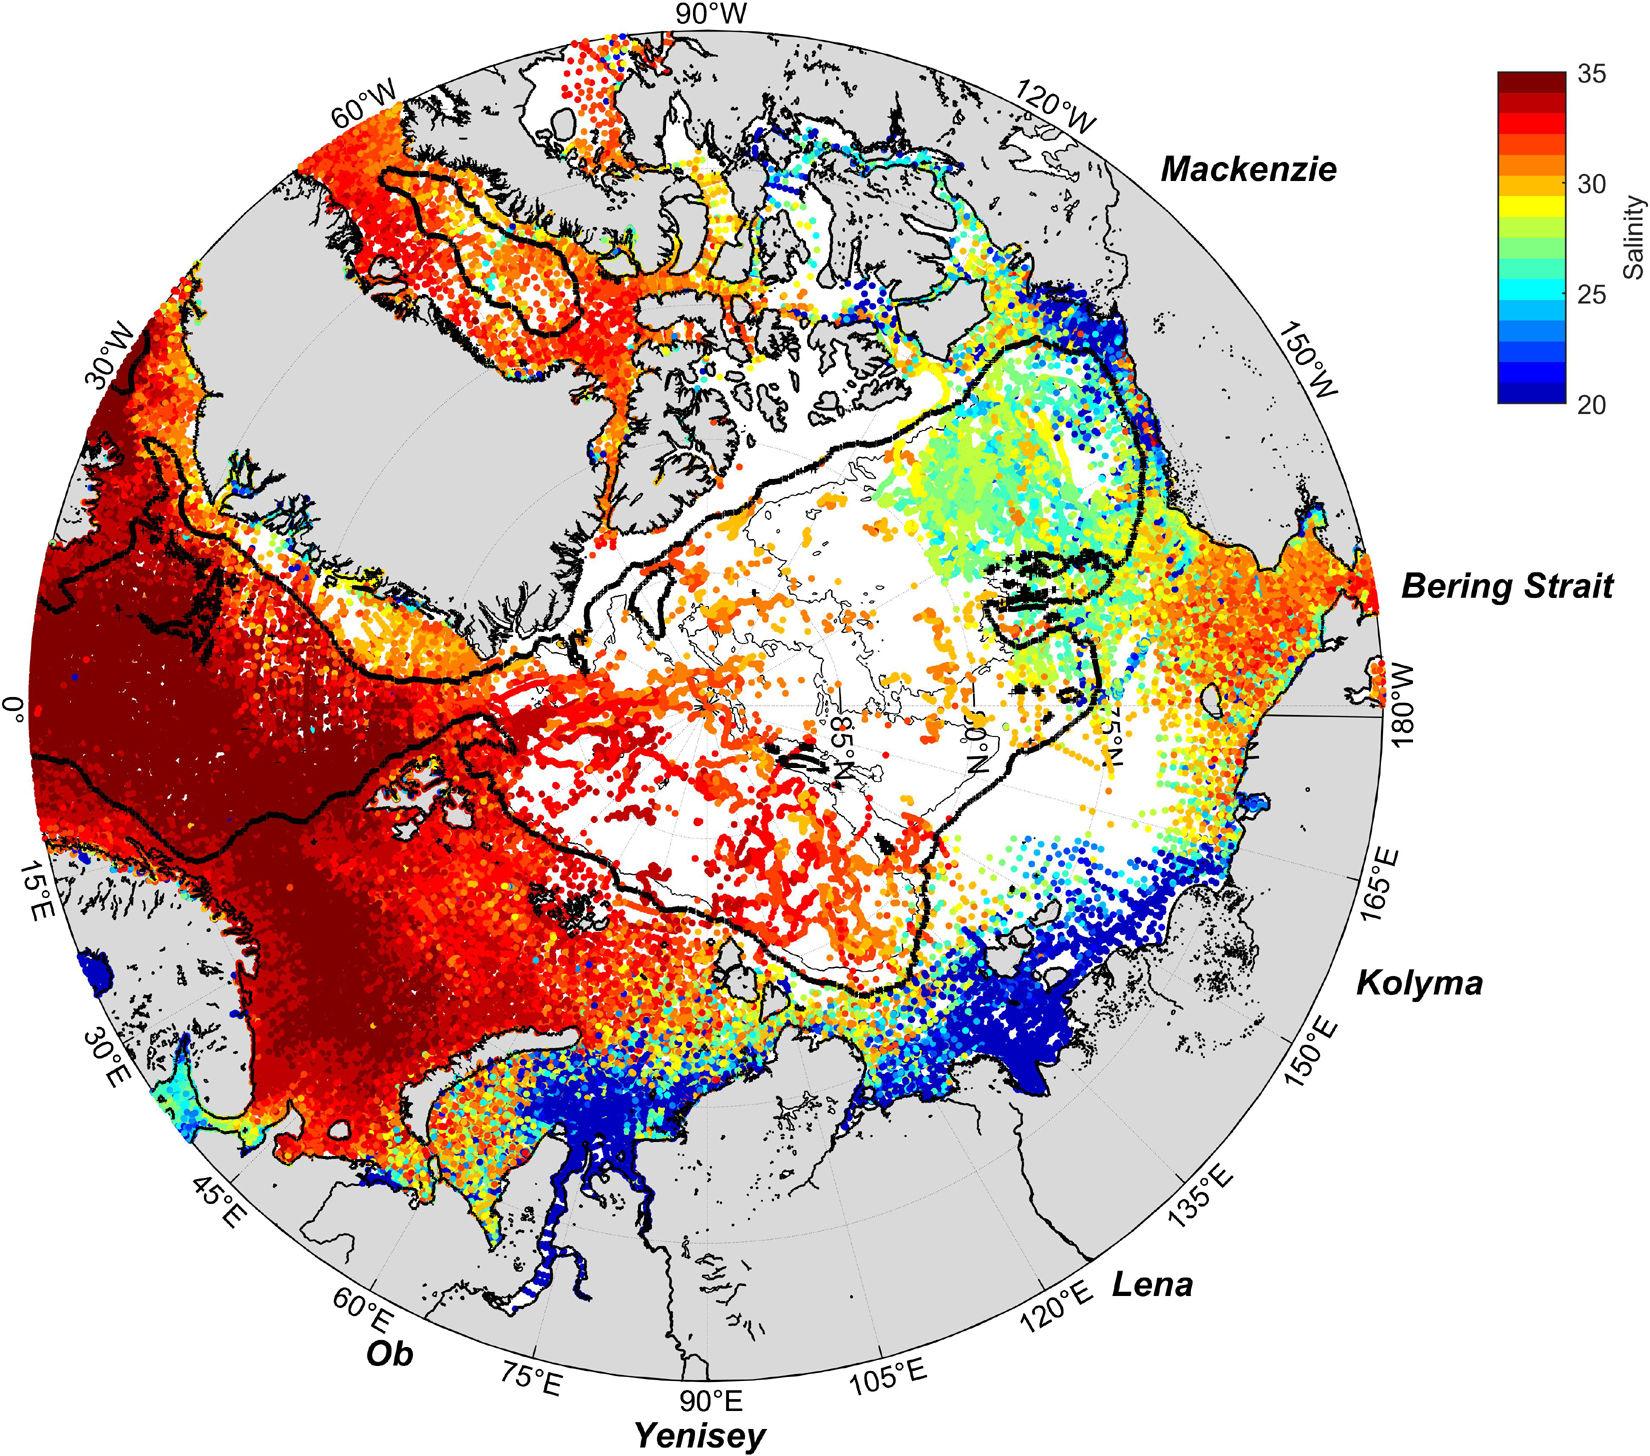
Figure 1. Sea surface salinity from the World Ocean Database. Note that the color scale limits minimum salinities to 20.
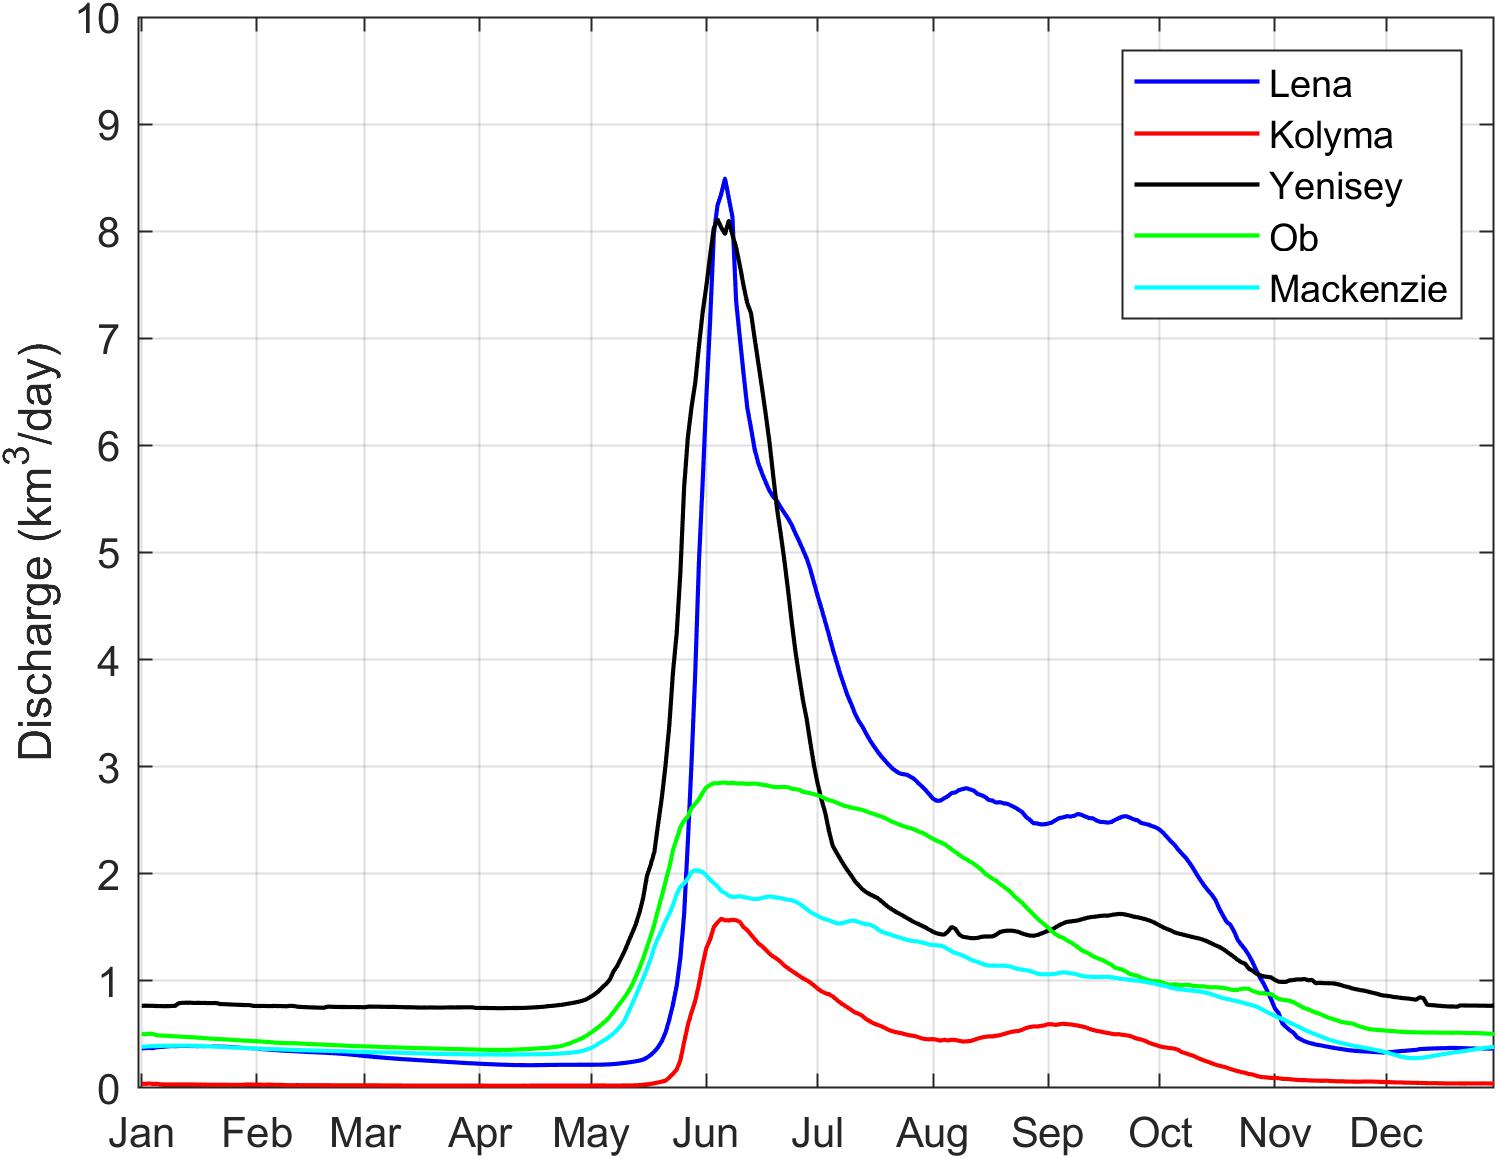
Figure 2. Mean (1999–2019) daily river discharge from the major Arctic rivers (in km3 day–1) from ArcticGRO (Shiklomanov et al., 2018).
Sea ice critically controls the momentum transfer into the ocean and thus the vertical and lateral spreading of the river water. The sea ice conditions, sea ice retreat and the length of the open water period varies significantly by region. The Barents Sea is largely kept ice-free due to the prevalence of the warm Atlantic water, except for a smaller region in the northeast (Figure 3, see “Data and Methods” for figure details). In the Kara Sea, the ice retreats first near the Ob and Yenisey estuaries around the time of maximum river discharge in mid-June. The western Kara Sea becomes free of ice thereafter, with an eastward progressing sea ice edge that reaches the western Laptev Sea on average by late July. The conditions in the Laptev Sea are quite different. There, the ice first retreats in late May in the prominent polynya region north of the landfast ice edge (Bareiss and Görgen, 2005), while the rest of the shelf’s ice retreats on average 2 weeks later. In the southeastern Laptev Sea, the ice retreats simultaneous with the ESS coast, while the rest of the ESS remains on average ice-covered well into August. The warm Pacific water inflow drives the seasonal ice edge progressively northward from Bering Strait beginning in May. The vast ESS shelf presently features the shortest open water season, likely due to its remoteness from large freshwater and heat sources such as found in the Laptev and Kara Seas. The role of the large rivers on sea ice retreat is not entirely understood, but riverine heat is assumed to be important for at least kick-starting sea ice melt (Bauch et al., 2013; Whitefield et al., 2015; Janout et al., 2016a). For instance the Lena River temperature during July and August averages at 16°C (Juhls et al., 2020). The large sediment loads in river water as well as bio-optical properties such as colored dissolved organic matter (CDOM) can further change the absorption properties of the ice and ocean (Soppa et al., 2019), which likely explains the comparatively longer open water periods near the large Siberian rivers. Furthermore, the regional differences in open water days and timing of sea ice retreat (Figure 3) partly reflects the landfast ice that generally occupies the regions between the coast and the 20–30 m isobaths. The southern Laptev Sea features extensive landfast ice regions, although the landfast ice season is getting progressively shorter (Selyuzhenok et al., 2015). Sea ice thickness of the mobile ice cover decreases (Belter et al., 2020) and late winter ice export increases (Krumpen et al., 2013), which preconditions for early spring sea ice anomalies and overall results in longer open water seasons (Itkin and Krumpen, 2017; Krumpen et al., 2020). In summary, the Siberian shelves provide a non-uniform image regarding their sea ice conditions and retreat, which however play an important role in determining how wind can affect the fate and pathways of river runoff.
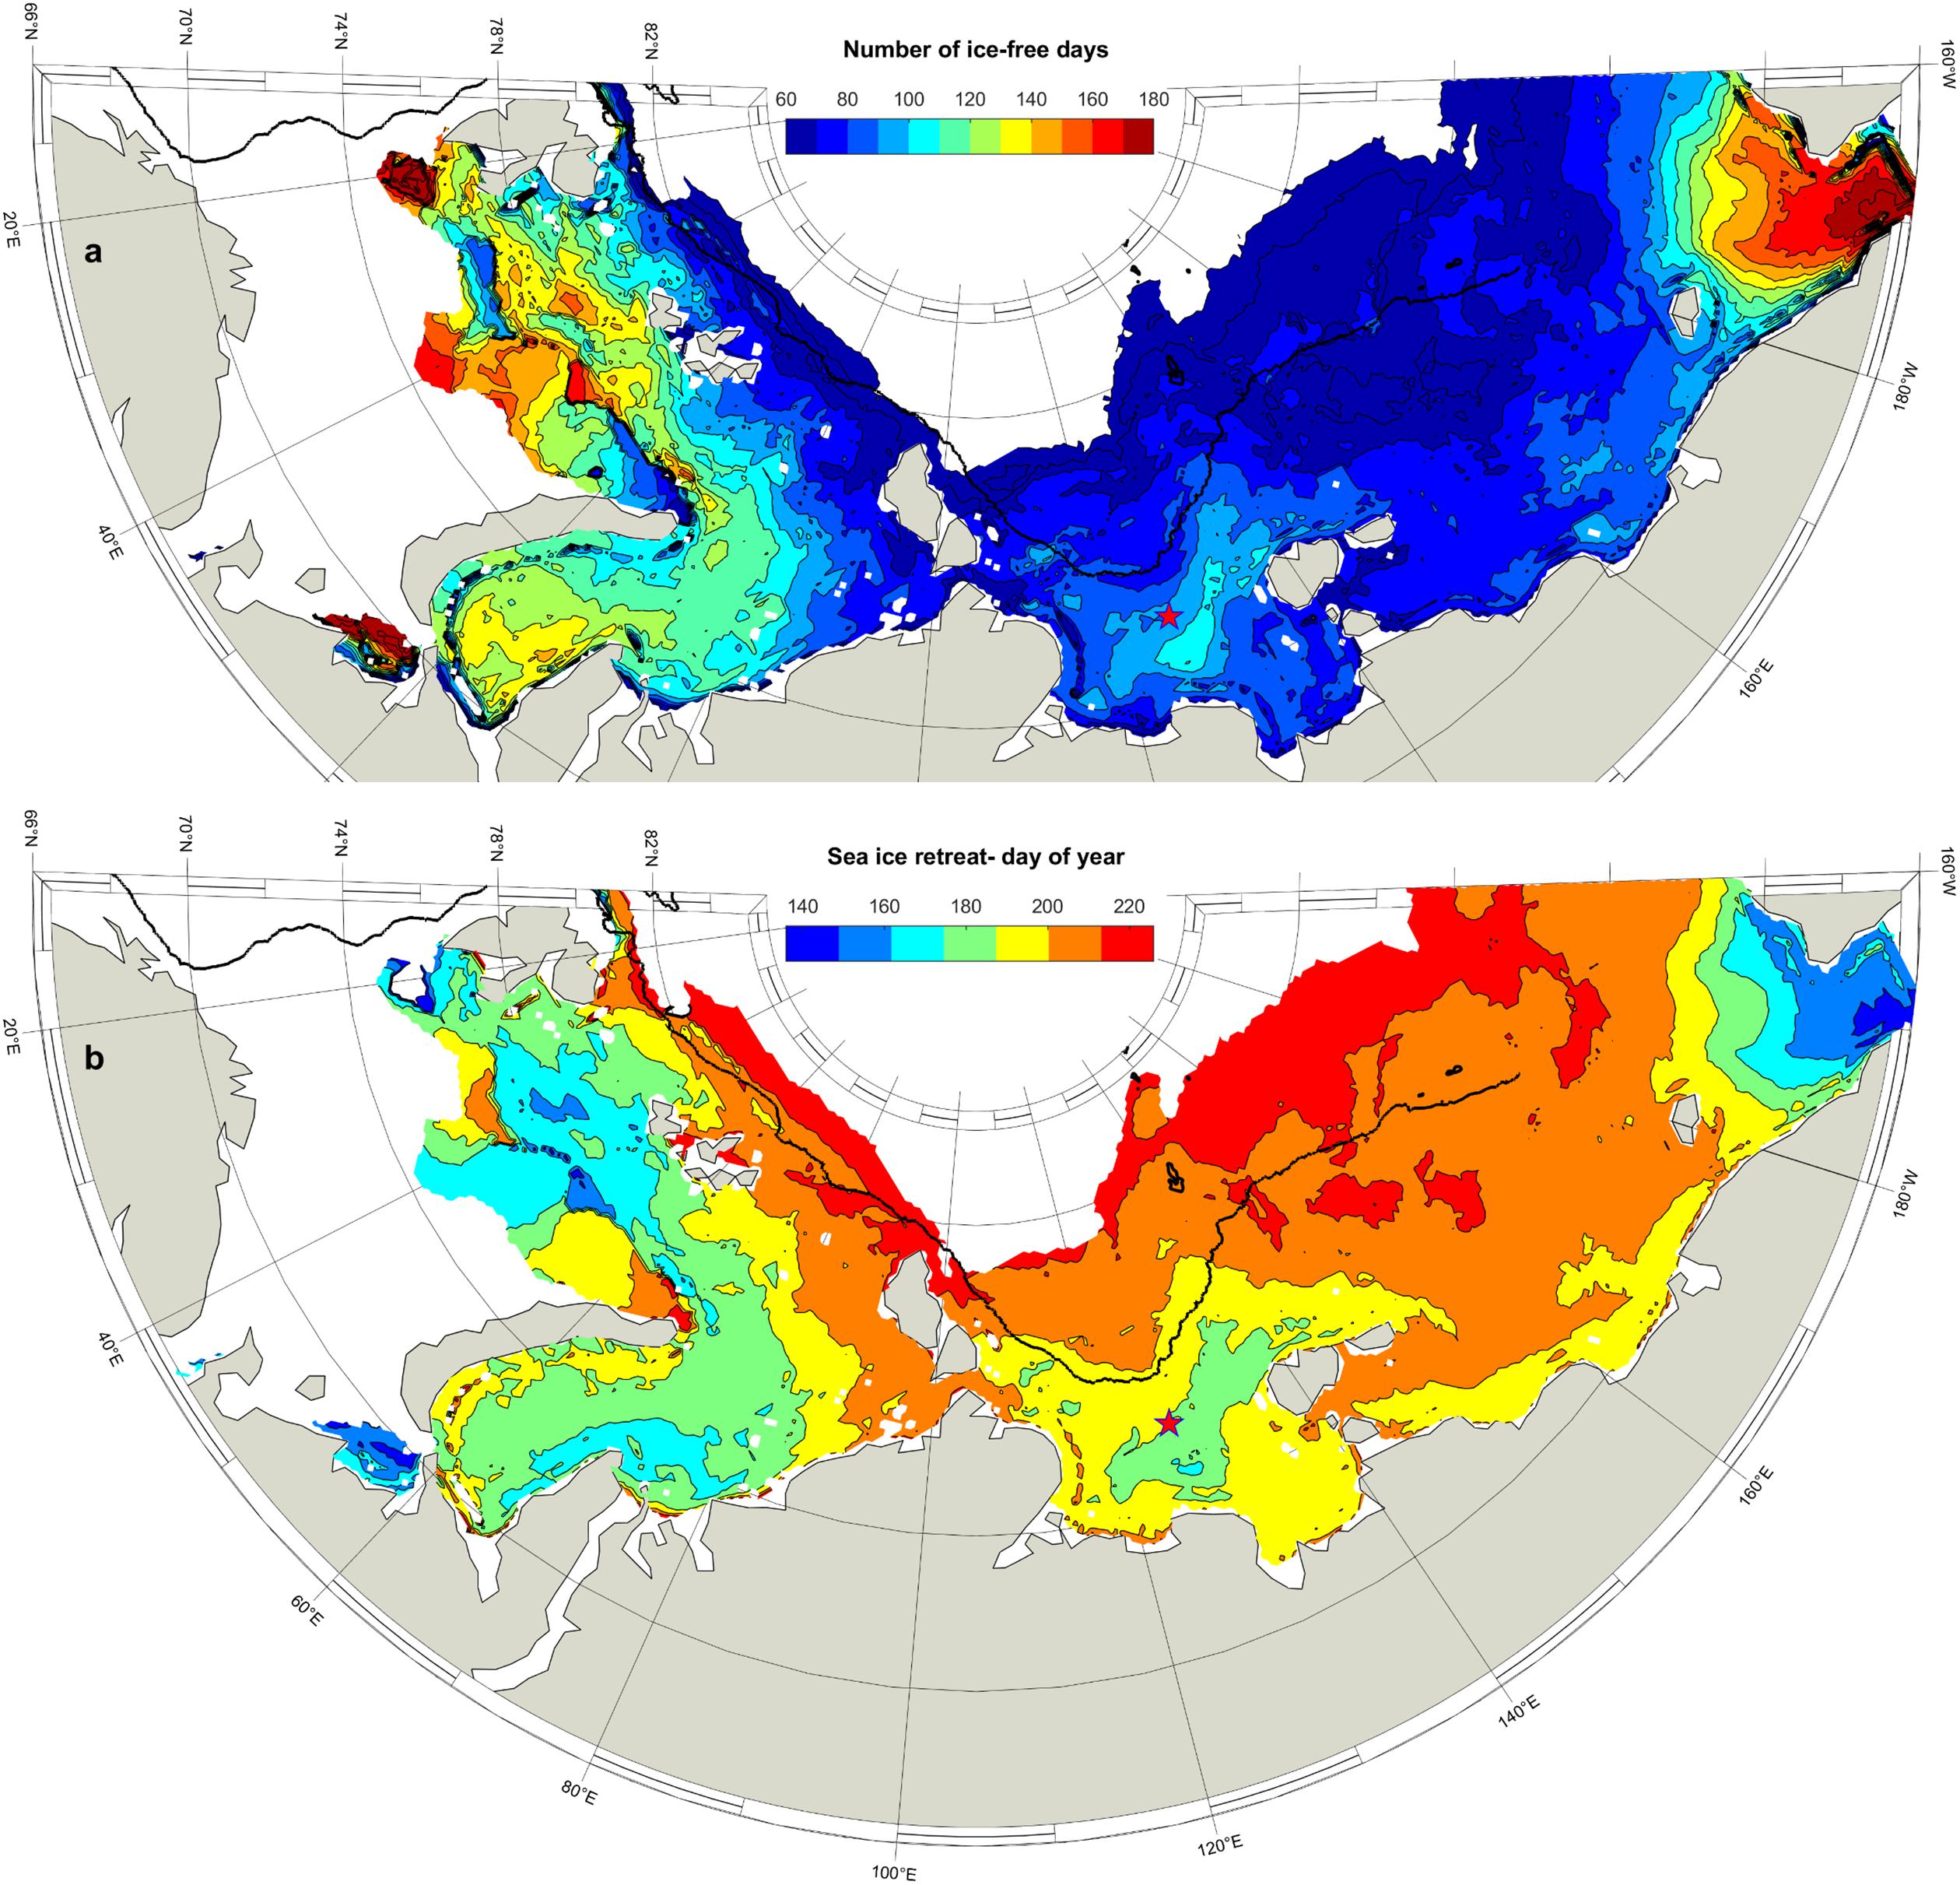
Figure 3. (a) Mean (1992–2019) number of ice-free days (in days); (b) Mean (1992–2019) timing of sea ice retreat (in day of year).
The local sea ice melt in combination with the river runoff establishes some of the largest ROFIs (region of freshwater influence) on earth, shaping the local and regional oceanographic processes and ecosystems. The interannual variability in river runoff and in the timing of the spring freshet is comparatively small, whereas there is considerable variability of the ROFI extent on the middle and outer shelves, dependent on the atmospheric summer conditions (Shpaikher et al., 1972; Proshutinsky and Johnson, 1997; Semiletov et al., 2000; Dmitrenko et al., 2005; Bauch et al., 2009). While much knowledge can be gained from satellite studies regarding sea surface temperatures, ocean color or sea ice concentration, important sub-surface ocean parameters including stratification and vertical and lateral mixing of energy and matter rely on in-situ measurements obtained from shipboard expeditions and moored or autonomous measuring systems. In this paper we report on observations obtained during two hydrographic surveys from 2013 to 2014 to shed more light on the regional and temporal variability of stratification in the freshwater-dominated Laptev Sea. A seasonal component will be assessed by use of 3 year-round oceanographic moorings deployed in three different Laptev Sea sub-regions, while a long-term (1993–2018) perspective on stratification will be assessed by use of reanalyzed Mercator ocean parameters. The findings on stratification presented in the results section will be followed by discussions on freshwater contributions from individual rivers determined with dissolved radiogenic neodymium and stable oxygen isotopes, and the implications of changes in river runoff, distribution, and climate change-induced changes in stratification on oceanic heat storage and the regional ecosystem.
Data and Methods
Ship-Board Hydrographic Surveys
Two expeditions to the Laptev Sea were carried out aboard the RV Viktor Buinitskiy. Transdrift 21 (Archangelsk to Tiksi, September 2013) and Transdrift 22 (Archangelsk to Archangelsk, September 2014) were both operated as part of the Russian-German “Laptev Sea System” partnership (Figure 4). Hydrographic measurements were obtained using a Seabird SBE19plusV2 Conductivity-Temperature-Depth (CTD)-recorder mounted on a water sampling carousel. The Seacat samples with 4 Hz and provides initial accuracies for temperature and conductivity of 0.005°C and 0.0005 S m–1, respectively. Additional CTD measurements were obtained using an Ocean Science Underway (U)CTD System. The UCTD samples with 16 Hz and allows the collection of hydrographic profiles while the ship is transitioning, and was used to collect hydrographic data at high spatial resolution. The UCTD sensors are manufactured by Seabird and record conductivity, temperature and pressure at accuracies better than 0.004°C and 0.002–0.005 S m–1. Arctic Ocean sea surface salinity (Figure 1) is based on data obtained from the World Ocean Database 2018, which is a collection of quality-controlled ocean profiles (Boyer et al., 2019). We extracted a total of 245,392 surface salinity measurements available north of 65°N for the period 1900–2018. Maps used in several of the figures were produced with the Matlab-based mapping toolbox M_Map (Pawlowicz, 2020).
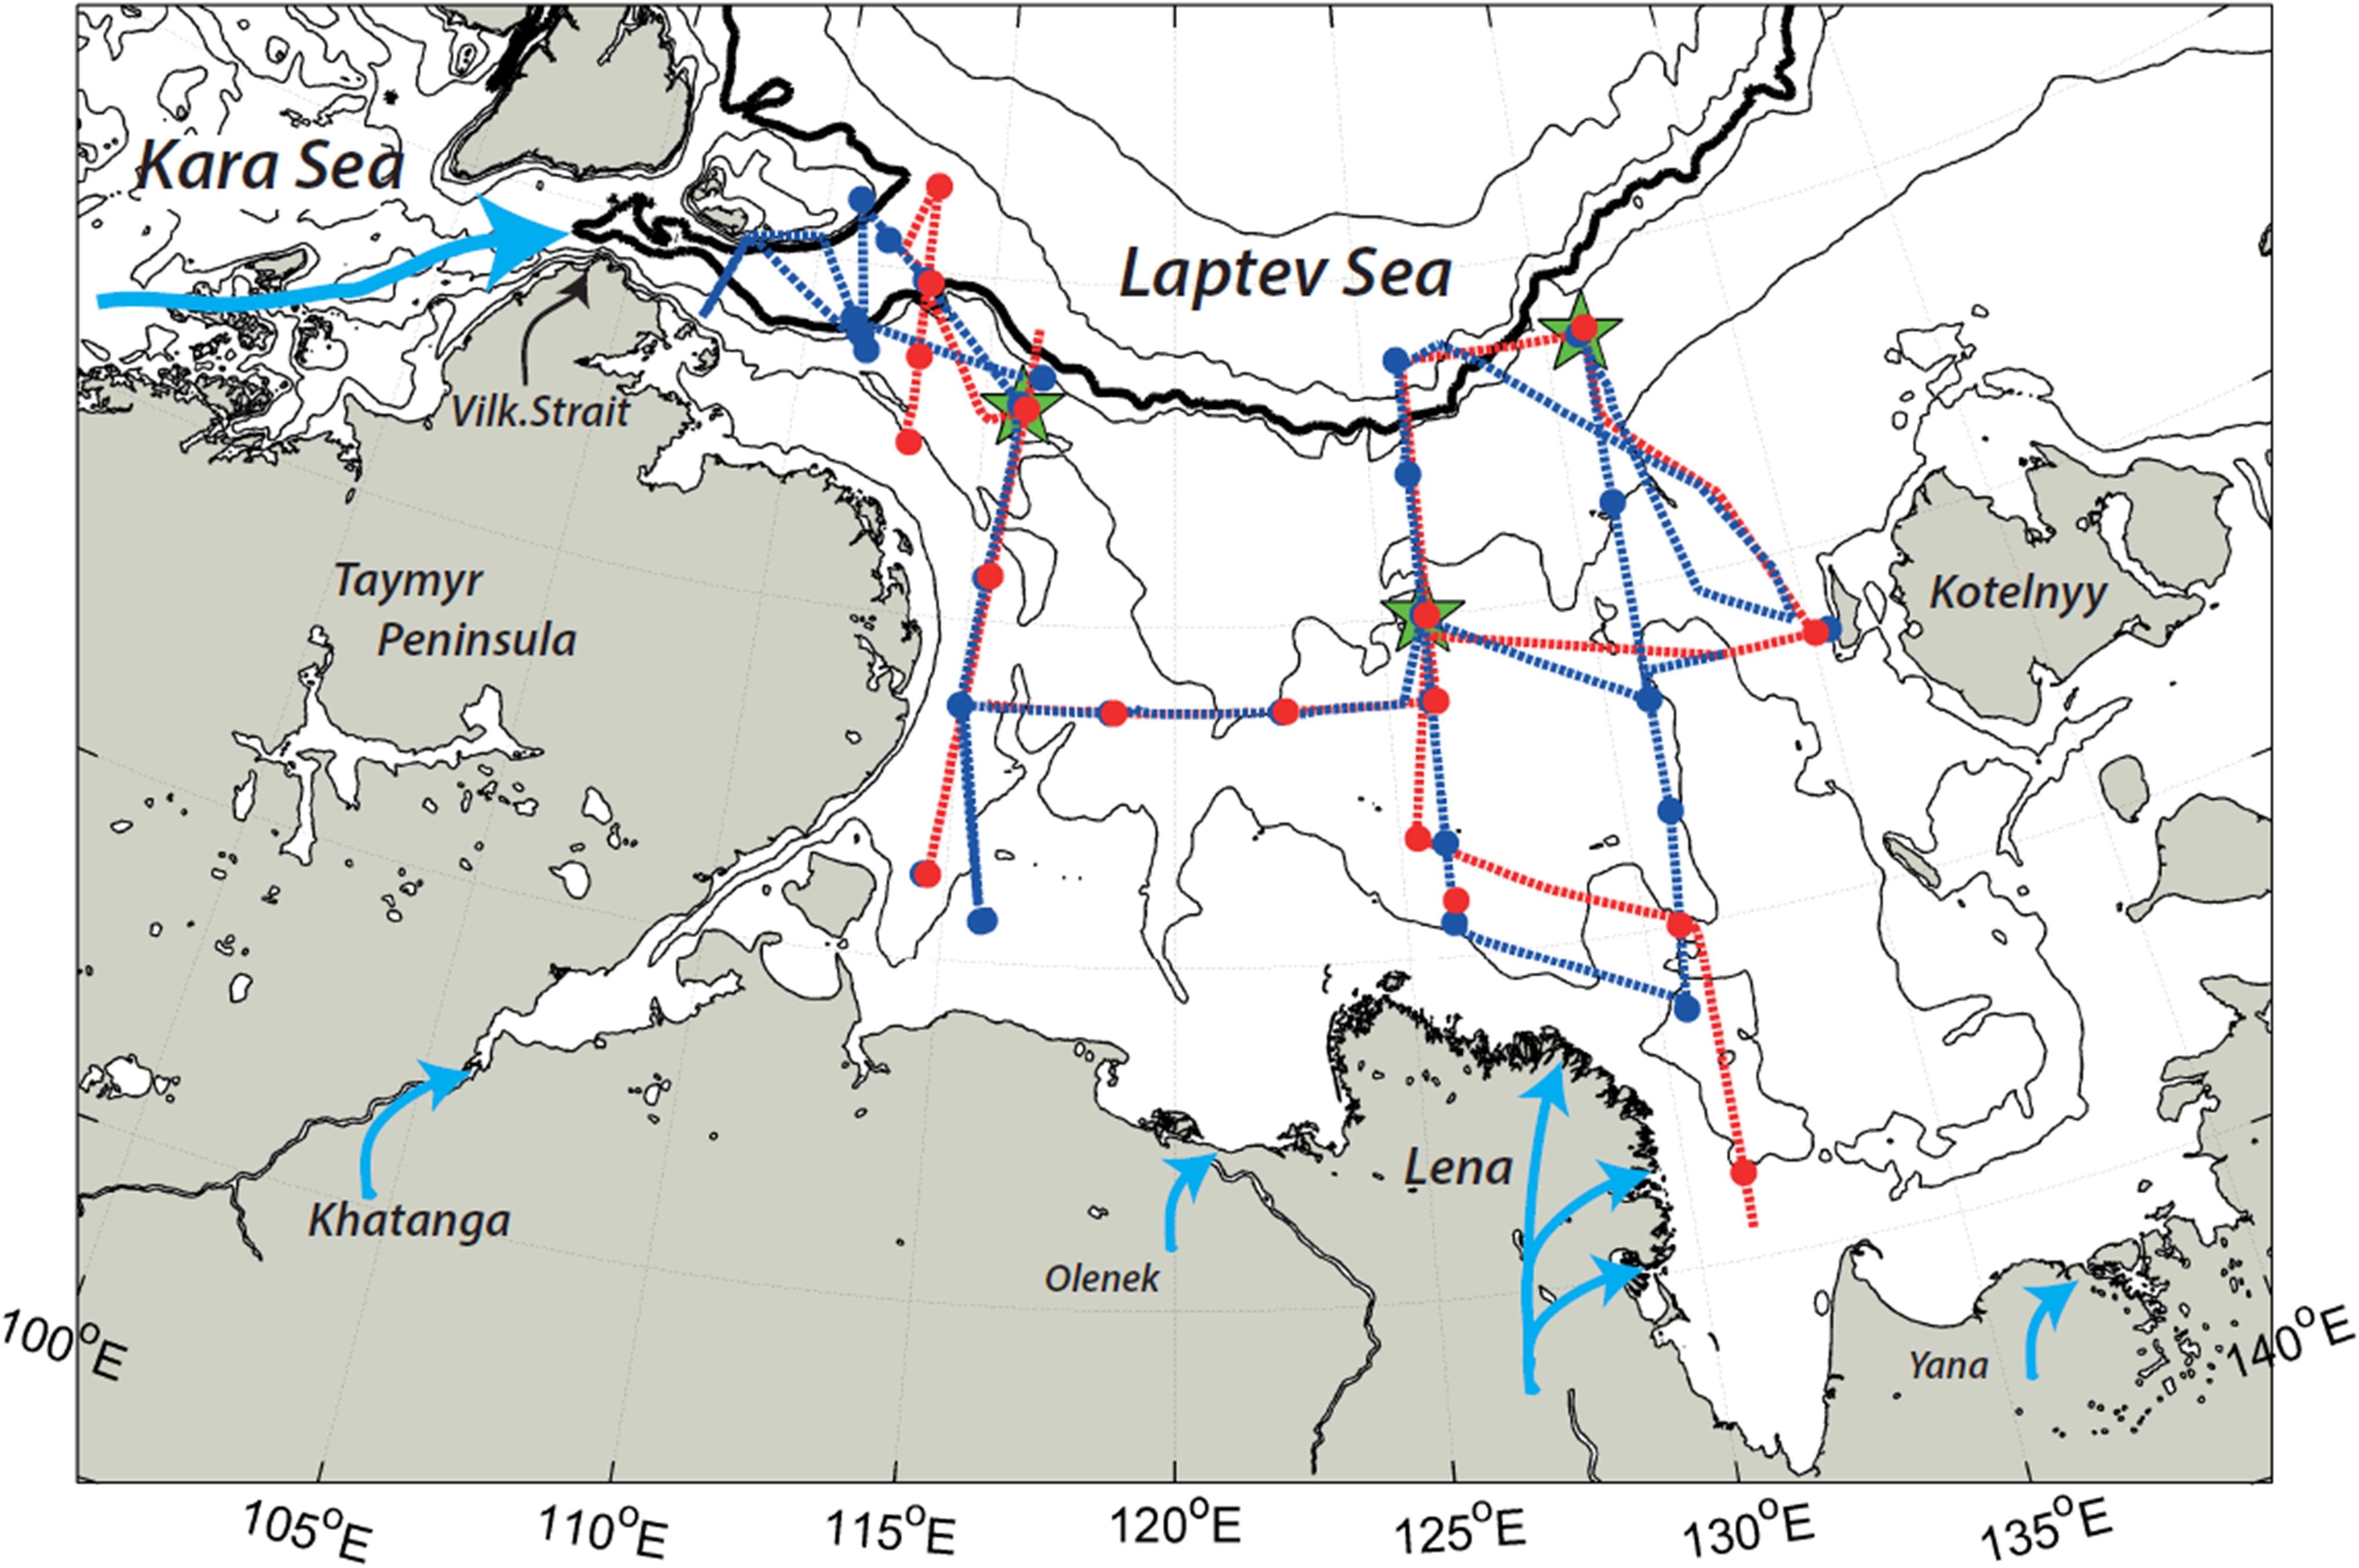
Figure 4. 2013 (red) and 2014 (blue) cruise tracks. Green stars indicate mooring locations.
Mooring-Based Measurements
Three oceanographic moorings used in this study were operated for 1 year between Septembers 2013 and 2014 on the central (76°N, 126°E, 45 m depth), northwestern (77.5°N, 116°E, 60 m depth) and northeastern (77.75°N, 131°E, 70 m depth) shelves, respectively. The official identifications for the three moorings were “Taymyr,” “1893,” and “Kotelnyy” (Janout et al., 2019), but for an easier geographic context, we refer to the three moorings as NW (northwest), CS (central shelf), and NE (northeast), respectively. The moorings were equipped with TRDI Workhorse Sentinel ADCPs (Acoustic Doppler Current Profilers) and up to five Seabird SBE37 CTD-recorders per mooring, evenly-spaced between ∼20 m and the sea floor (Table 1). Local sea ice information at the mooring sites was derived from the ADCP’s bottom track (ice track) function, which records valid ice drift and draft information when sea ice is present as a solid reflector.
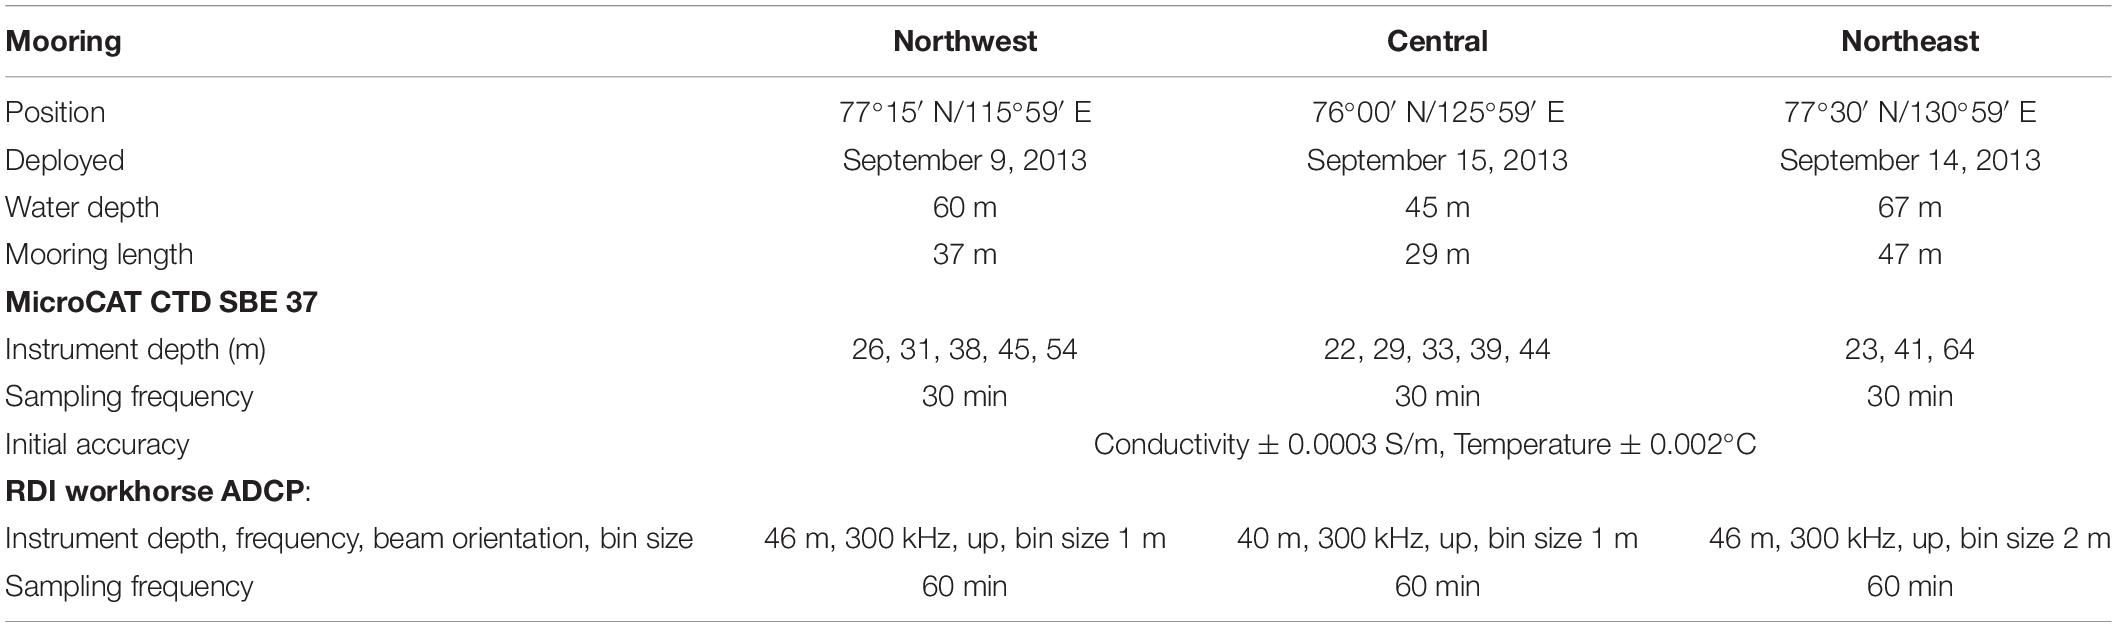
Table 1. Mooring location and information.
Earlier studies of the semidiurnal velocity structure on this shelf showed a close link between semidiurnal currents and stratification (Janout and Lenn, 2014), where an internal semidiurnal velocity maximum was generally found in the presence of a pycnocline, while the current structure was depth-independent when stratification was absent. Considering that sea ice pressure ridges can reach as far as 20 m below the surface in this region, the moorings are designed to remain below this safety depth. We hence cannot directly quantify stratification since we lack year-round temperature and salinity measurements from the important near-surface ocean. However, we qualitatively assess the water column structure by a combination of the available sub-surface hydrographic records and the full water column structure of the semidiurnal M2-tidal currents. We extract the harmonics by performing tidal analyses on the ADCP records using the Matlab-based T-Tide-toolbox (Pawlowicz et al., 2002). To resolve the fortnightly cycle due to the superposition of the solar and lunar semidiurnal tides, we run a 15 day moving analysis at each depth level and can thus produce a matrix of depth vs. time values of the relevant tidal harmonics. The Siberian shelves are located around the critical latitude of the M2-tide (∼74.5°N), which makes a separation of this constituent from inertial oscillations nearly impossible. Knowing that the semidiurnal current structure that will be used to assess the seasonal progression of stratification contains both inertial (f) and M2-tidal frequencies, we refer to them as semidiurnal currents for simplicity.
Sea Ice, Atmosphere, and River Runoff
Timing of sea ice retreat and length of the ice-free season was calculated based on ice concentration information provided by CERSAT (Centre ERS d’Archivage et de Traitement), which is a part of the French Research Institute for Exploitation of the Sea (IFREMER). The CERSAT product makes use of the 85GHz SSM/I brightness temperatures by means of the ARTIST Sea Ice (ASI) algorithm and is available on a 12.5 × 12.5km grid (Ezraty et al., 2007). The timing of sea ice break-up and freeze-up (Figure 3) in each year for the period between 1992 and 2019, is defined as the first day in a series of at least 10 days with a sea ice concentration of below and above 15%, respectively (Janout et al., 2016b). Meridional and zonal monthly wind speeds as well as monthly sea level pressure distributions were downloaded from the European Centre for Medium-Range Weather Forecasts (ECMWF) ERA-I reanalysis (Dee et al., 2011). River discharge data was downloaded from the Arctic Great River Observatory (Shiklomanov et al., 2018)1.
Mercator Ocean Reanalysis
The GLORYS12V1 product (in the following referred to as Mercator) is the Copernicus Marine Environment Monitoring Service (CMEMS) global ocean eddy-resolving (1/12° horizontal resolution and 50 vertical levels) reanalysis covering the altimetry era 1993–2018. The model component is the NEMO platform forced at the surface by ECMWF ERA-Interim reanalysis. Mercator includes daily and monthly mean fields of temperature, salinity, currents, sea level, mixed layer depth and ice parameters from the sea surface to the bottom (Fernandez and Lellouche, 2018). In this paper, we use Mercator to complement our mooring time series with near surface information, and to contrast the hydrographic conditions between the often freshwater-influenced central Laptev Sea and the northwestern shelf in a long-term (1993–2018) context. The mixed layer is defined as the depth where the density is 0.125 kg m–3 higher than at 5 m, and we further apply a 2 day moving average filter to remove high-frequency variability, which is present in the data due to the large salinity gradients found on this shelf.
Results
Case Study Lena River ROFI: Freshwater Distribution in 2013 and 2014
Both surveys were carried out during September when the Arctic sea ice is at its minimum, and neither survey encountered any sea ice in the Laptev Sea. The two summers were impacted by contrasting wind situations. The average (July–September) sea level pressure (SLP) distribution showed high pressure over the region in 2013, resulting in weak on-shore and westward-directed winds over the central Laptev shelf. In contrast, the 2014 summer was influenced by extensive low SLP centered over the Taymyr Peninsula (Figure 4), which led to some of the strongest southerly summer winds in the (1948–2019) ERA-I record (Figure 5). These contrasting prevailing pressure patterns resulted in notable differences in the shelf hydrography, especially in the surface salinity (0–10 m average, Figure 6). Minimum surface salinities were as low as 6 on the eastern Laptev Sea shelf in 2013, and salinities of 20 extended across much of the central shelf, with higher surface salinities only observed on the western shelf and near the shelf break in the northern Laptev Sea. In 2014, minimum surface salinities were ∼20 and limited to a small region in the east, while the rest of the shelf was much more saline and strongly contrasted with the conditions observed in the previous year. The water column structure sampled prior to deploying and recovering the moorings largely reflects the freshwater distribution (Figure 7). The northwest was outside of the Lena River influence in 2013, and surface salinities were high (32) with a mixed layer depth of >20 m. In 2014, Kara Sea freshwater impacted the region and mixed layers were shallower and surface salinities lower (<30). In contrast to the northwest, the central and northeast shelves featured shallow (∼10 m) mixed layers in both years, although lower salinities in 2013 in both regions. Upper layer temperatures were higher throughout the shelf in 2013, although this might be in part due to the 2 week later sampling period in 2014 under sub-zero air temperatures.
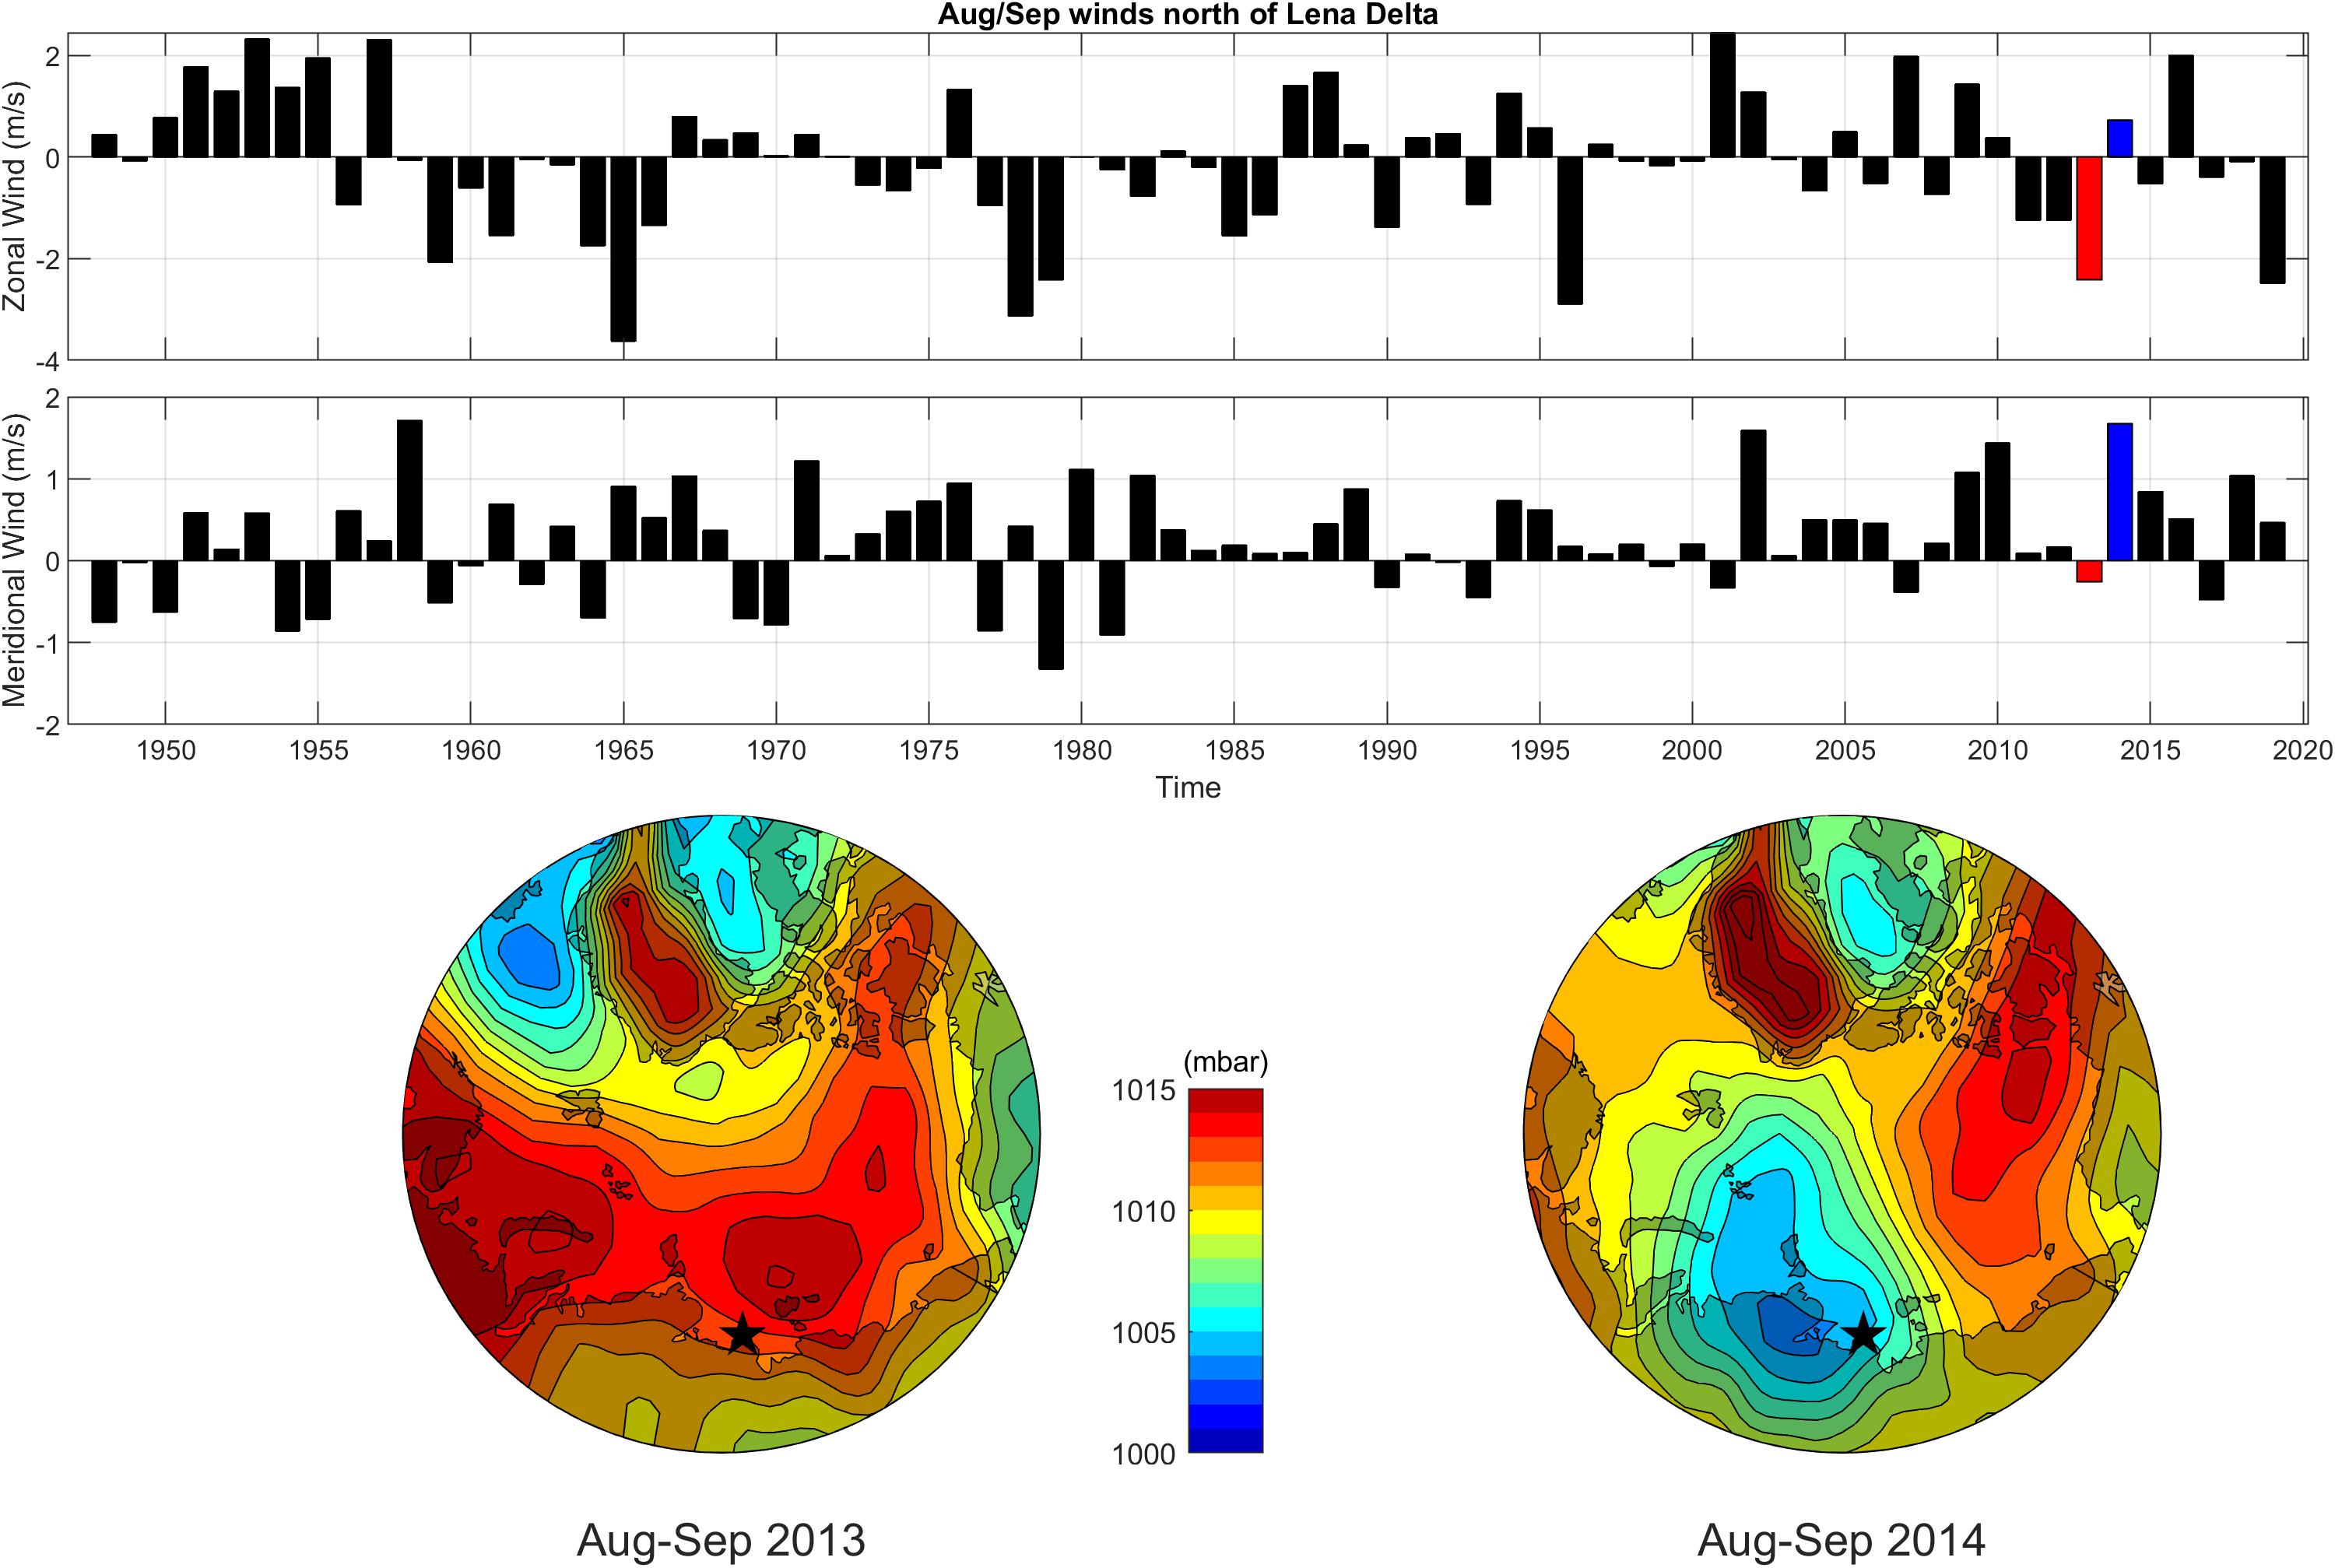
Figure 5. Mean (1948–2019) zonal (top) and meridional (bottom) August and September winds (ms–1) from ERA-I. Red and blue bars highlight 2013 and 2014, respectively. The corresponding sea level pressure (mbar) patterns for 2013 and 2014 are shown in the lower panels.
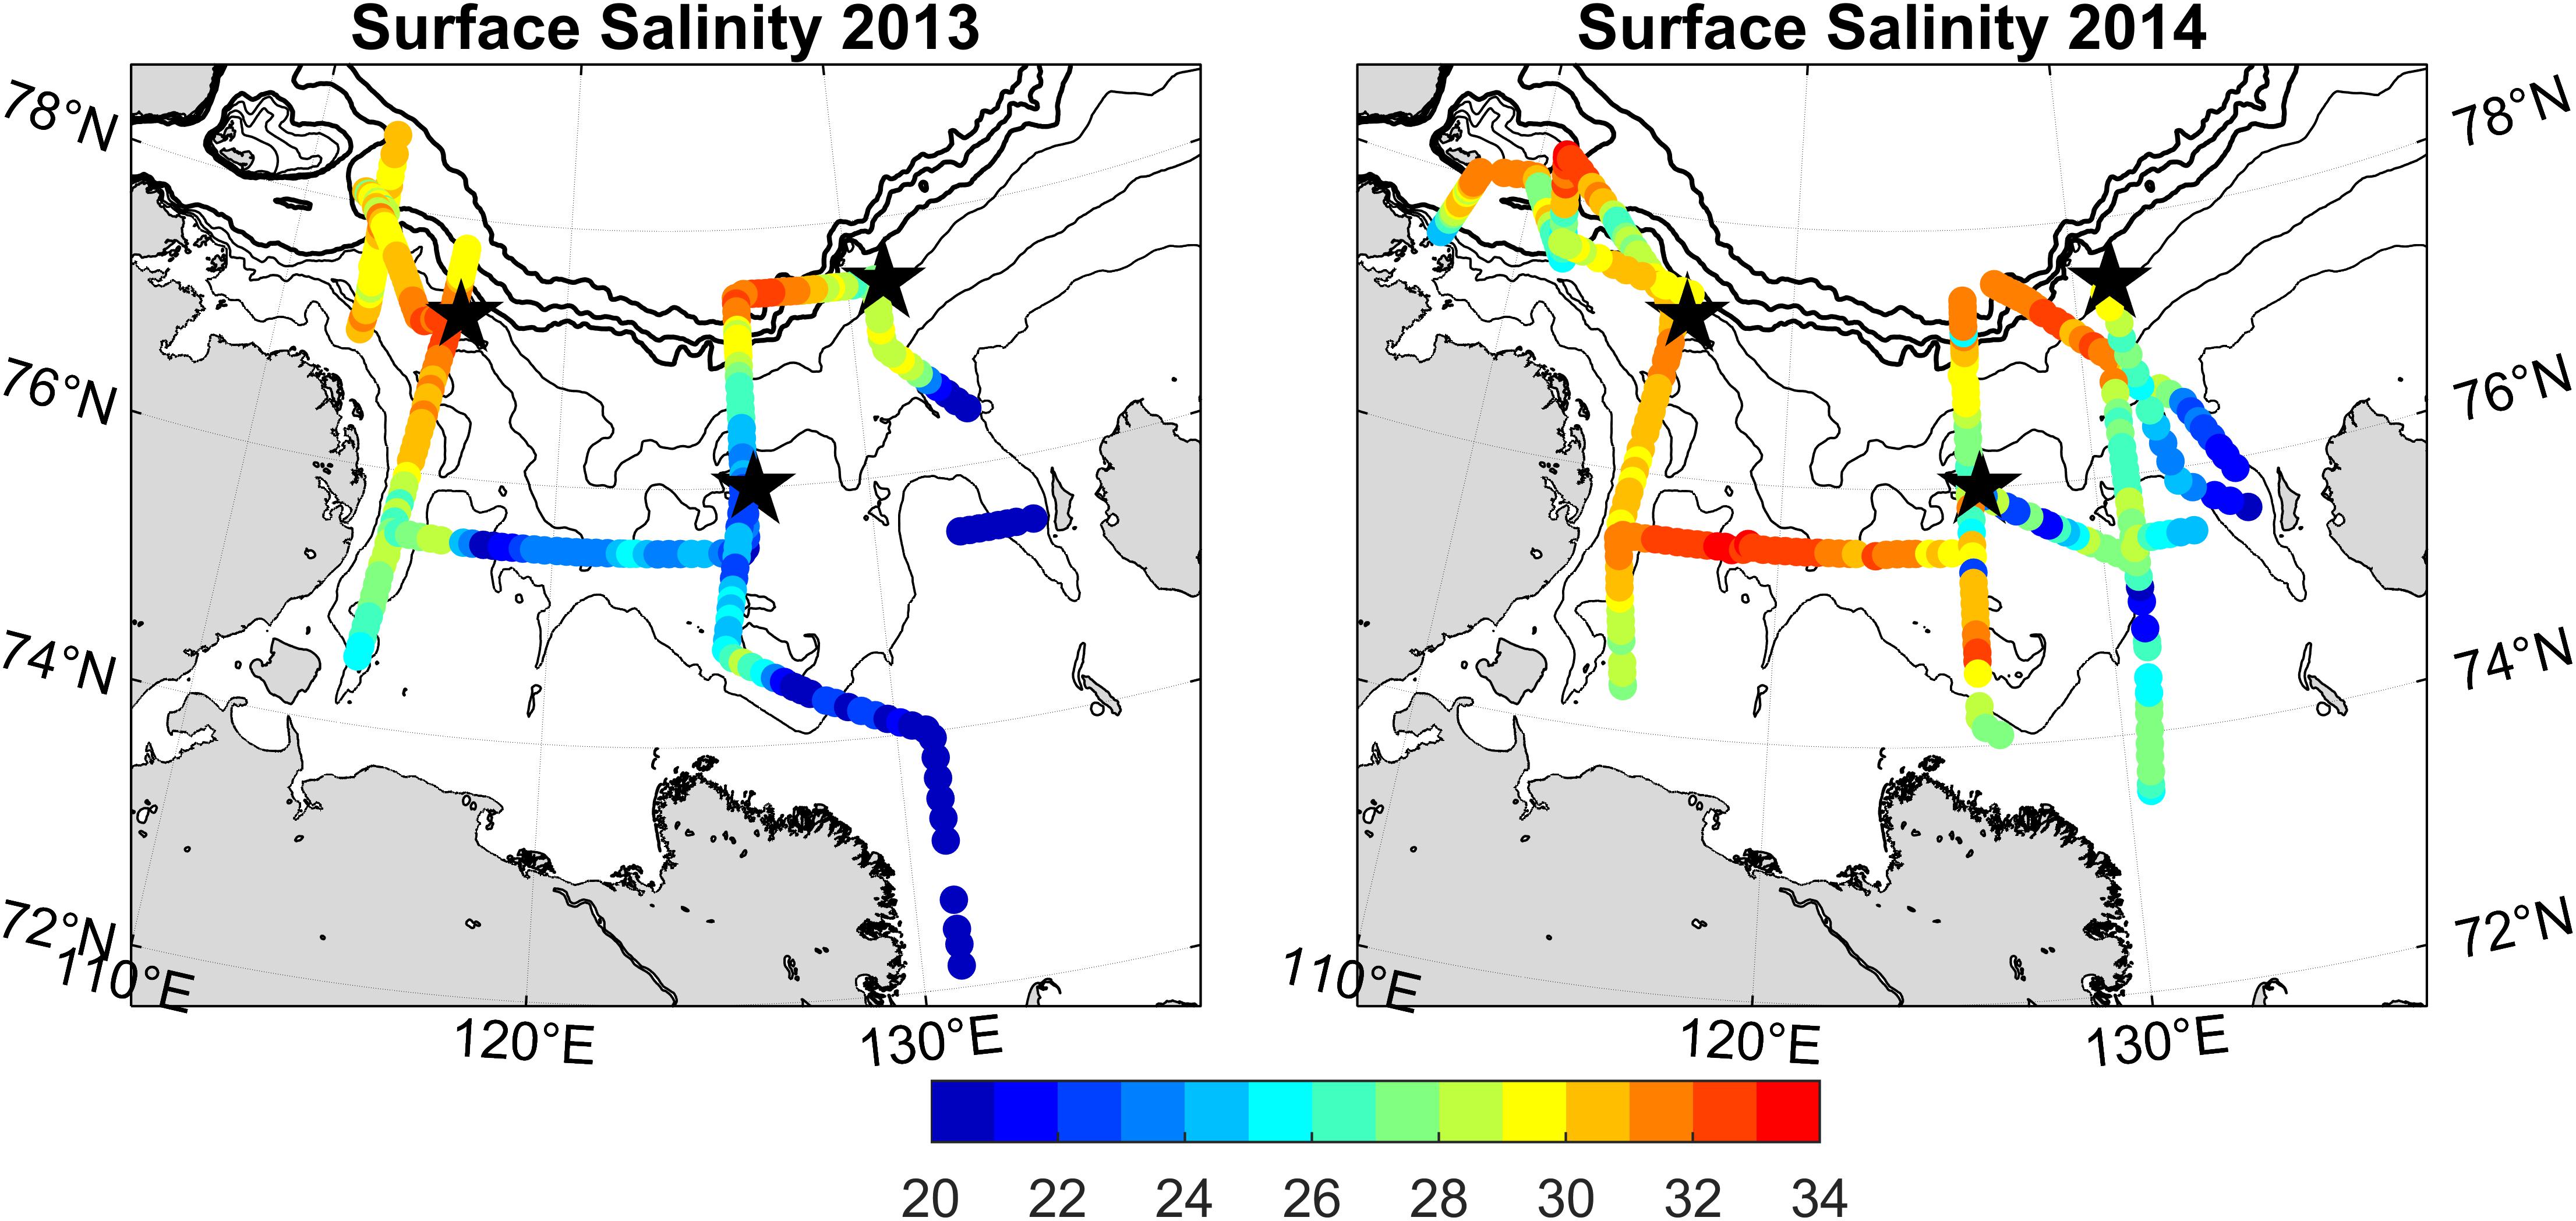
Figure 6. Sea surface (0–10 m) salinity from the underway CTD surveys in 2013 (left) and 2014 (right). The black stars indicate the mooring locations.
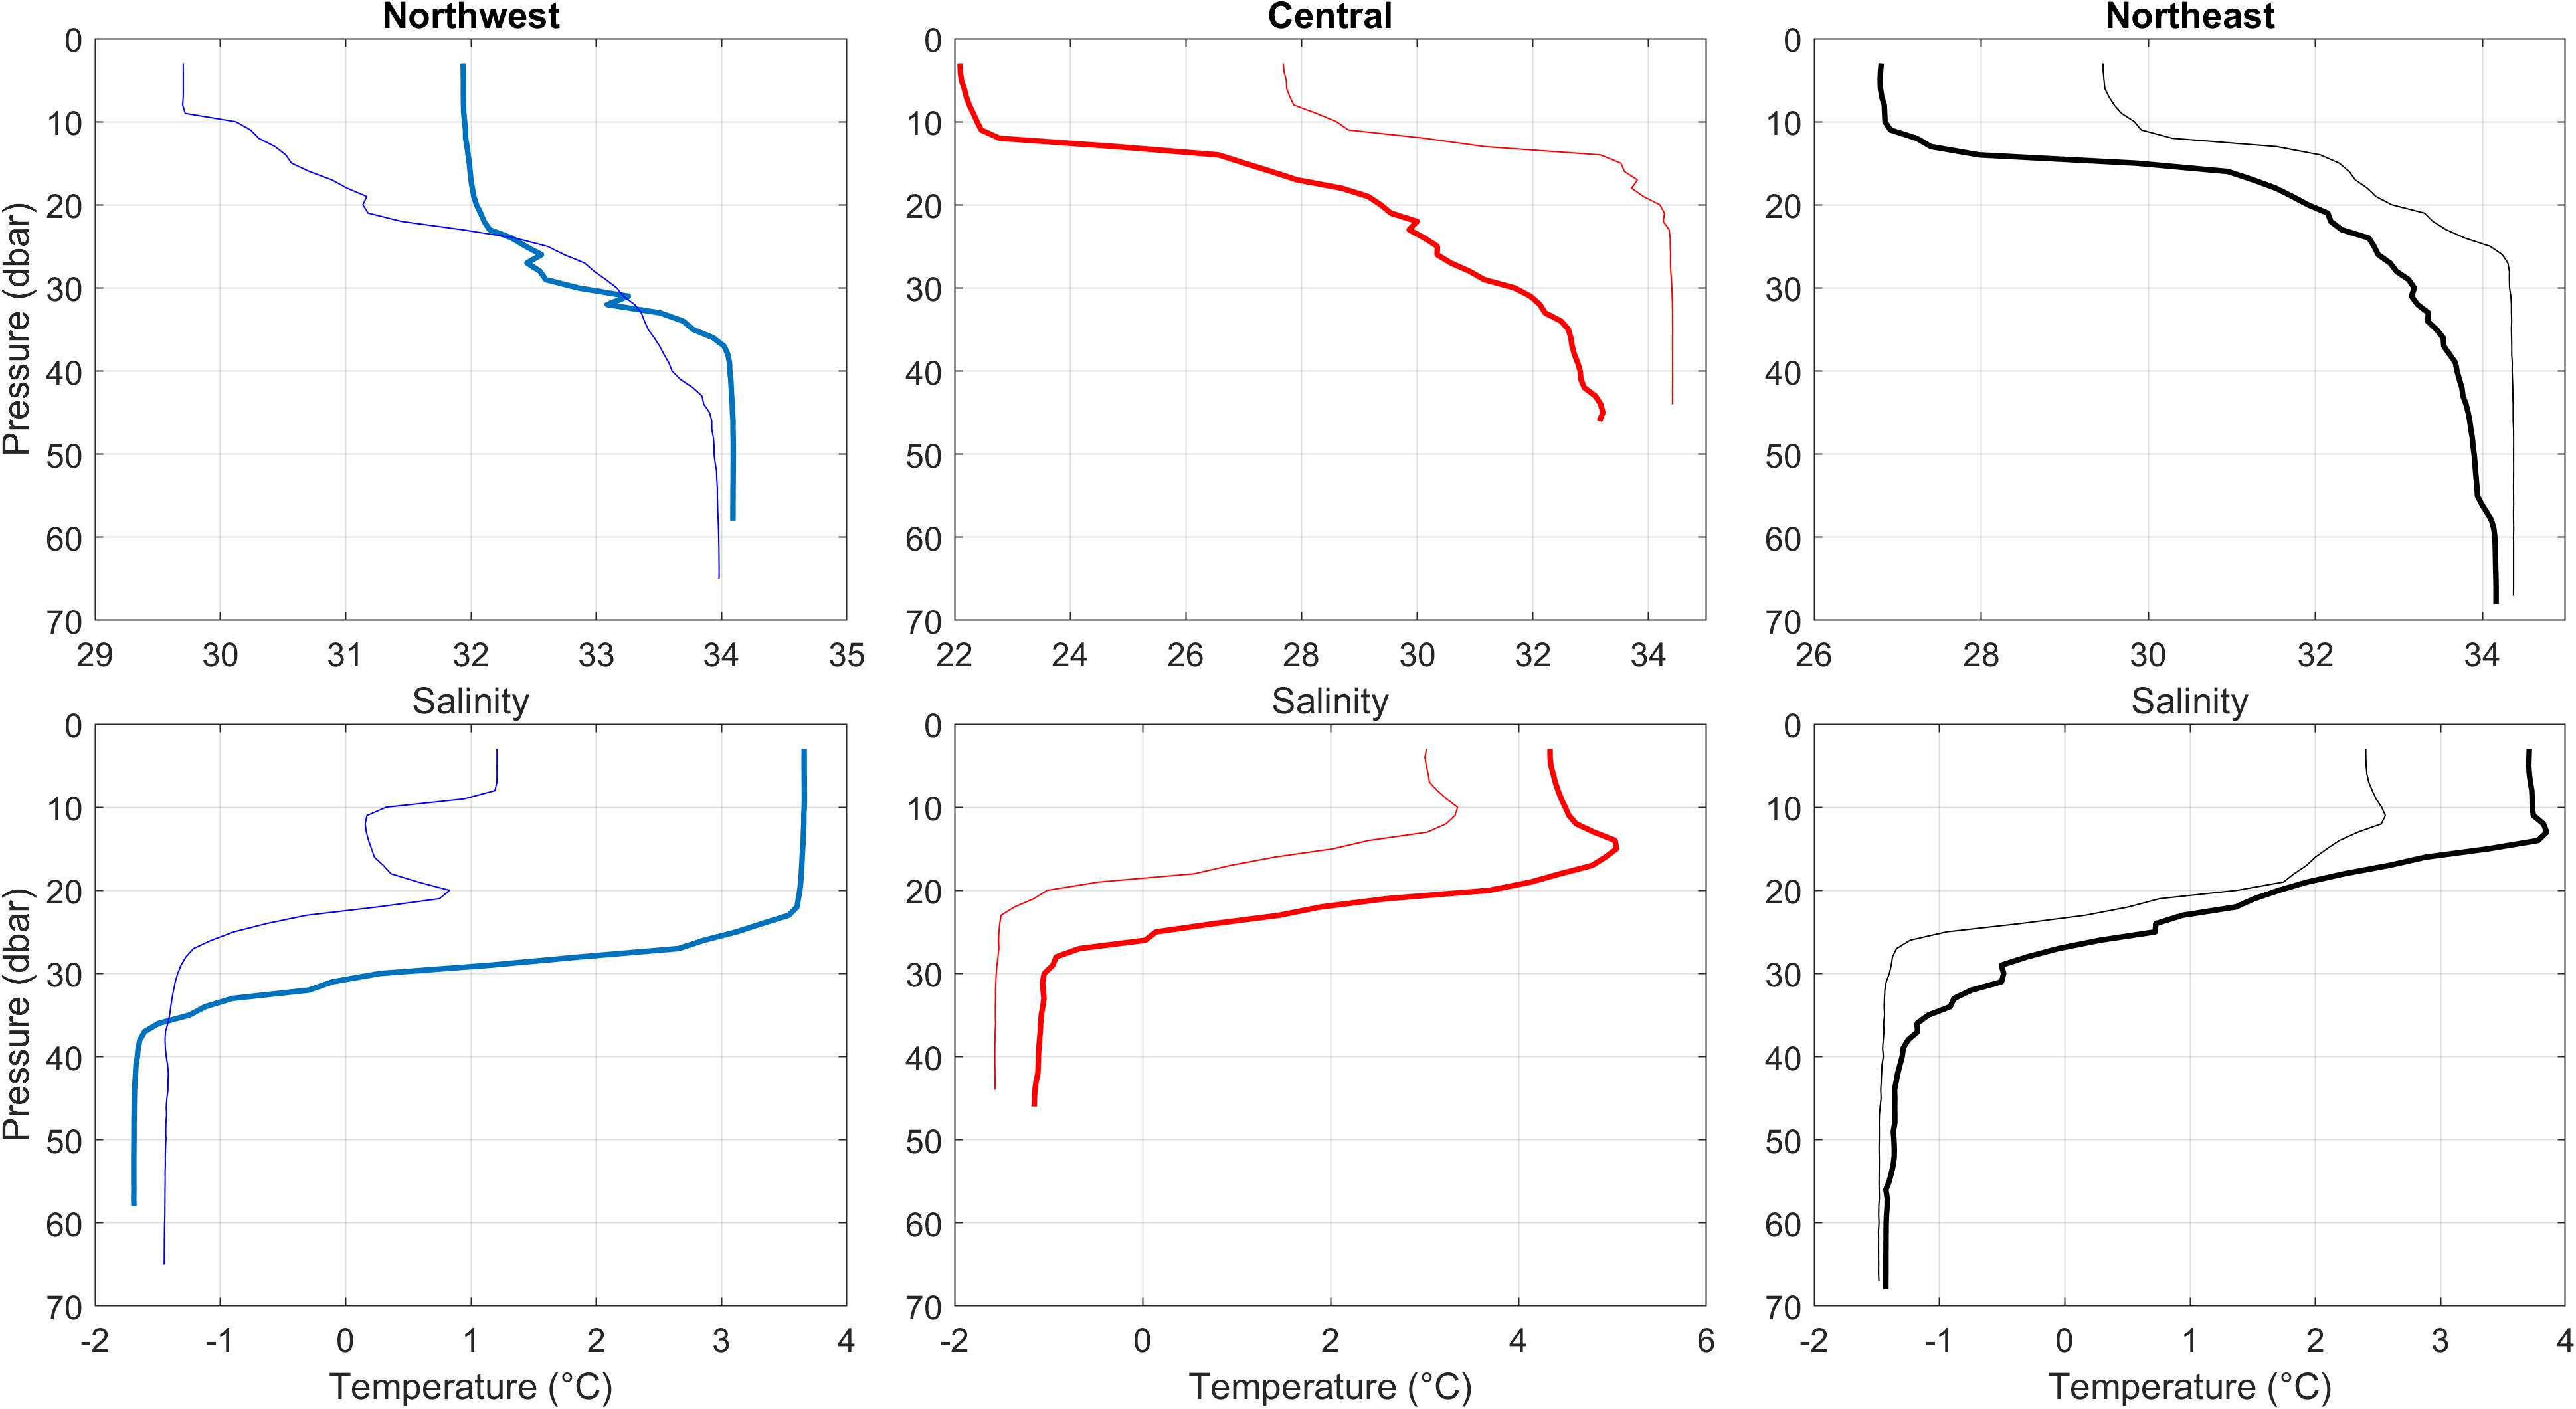
Figure 7. Salinity (top) and potential temperature (bottom) profiles from deployment in 2013 (thick lines) and recovery in 2014 (thin lines) of the three moorings.
Seasonal Cycles and Regional Contrasts in Stratification
The freshwater content observed in the upper layers of the different sub-regions may also explain the temporal difference in stratification that became apparent in the moorings (Figures 8–10). The year-long records of the finely-resolved lower water column in concert with the vertical structure of semidiurnal (tides and inertial) currents, which strongly depend on stratification (Janout and Lenn, 2014), provides sufficient insights regarding the water column structures across the shelf. Additional information is gained from reanalyzed ocean temperature and salinity (Mercator). The beginning of the Northwest-record in September 2013 shows a steady cooling of the mid-water temperatures toward the freezing point, along with variable although steadily mixing salinities. The water column was well-mixed by mid-December, based on the properties from all five CTD recorders and based on the changing semidiurnal current structure from depth-dependent to homogenous (Figure 8). The Central conditions in September 2013 were considerably different. Twenty meter waters were warmer and fresher, and stratification was maintained under the ice until March/April 2014 (Figure 9). The water column was well-mixed for a maximum of 2 months, and quickly became stratified when the ice retreated in late May as highlighted by the increase in 20 m temperatures. Remarkably, mid-water temperatures remained above freezing for nearly 3 months after the onset of sea ice, and underline how stratification traps heat in the water column, as was recently shown to affect the winter bottom waters on the central shelf (Janout et al., 2016a). Similar to the central shelf, the Northeast-mooring remained stratified under the ice until March 2014 (Figure 10). Mercator salinities at this location suggest that slightly lower (1–2 psu) salinities remain in the upper 20 m year-round, but this is not evident from the current structure. Overall, these records nicely illustrate regional differences in stratification that are mainly related to the distance to freshwater sources, in particular the Lena River. Despite the strong initial stratification in 2013, stratification on the central shelf was finally eroded 5 months after the onset of sea ice. This may be attributed to shear-driven mixing induced by sea ice drift or due to tides that dominate the currents below the sea ice and provide an energy source for vertical mixing in winter (Dmitrenko et al., 2012; Janout and Lenn, 2014).
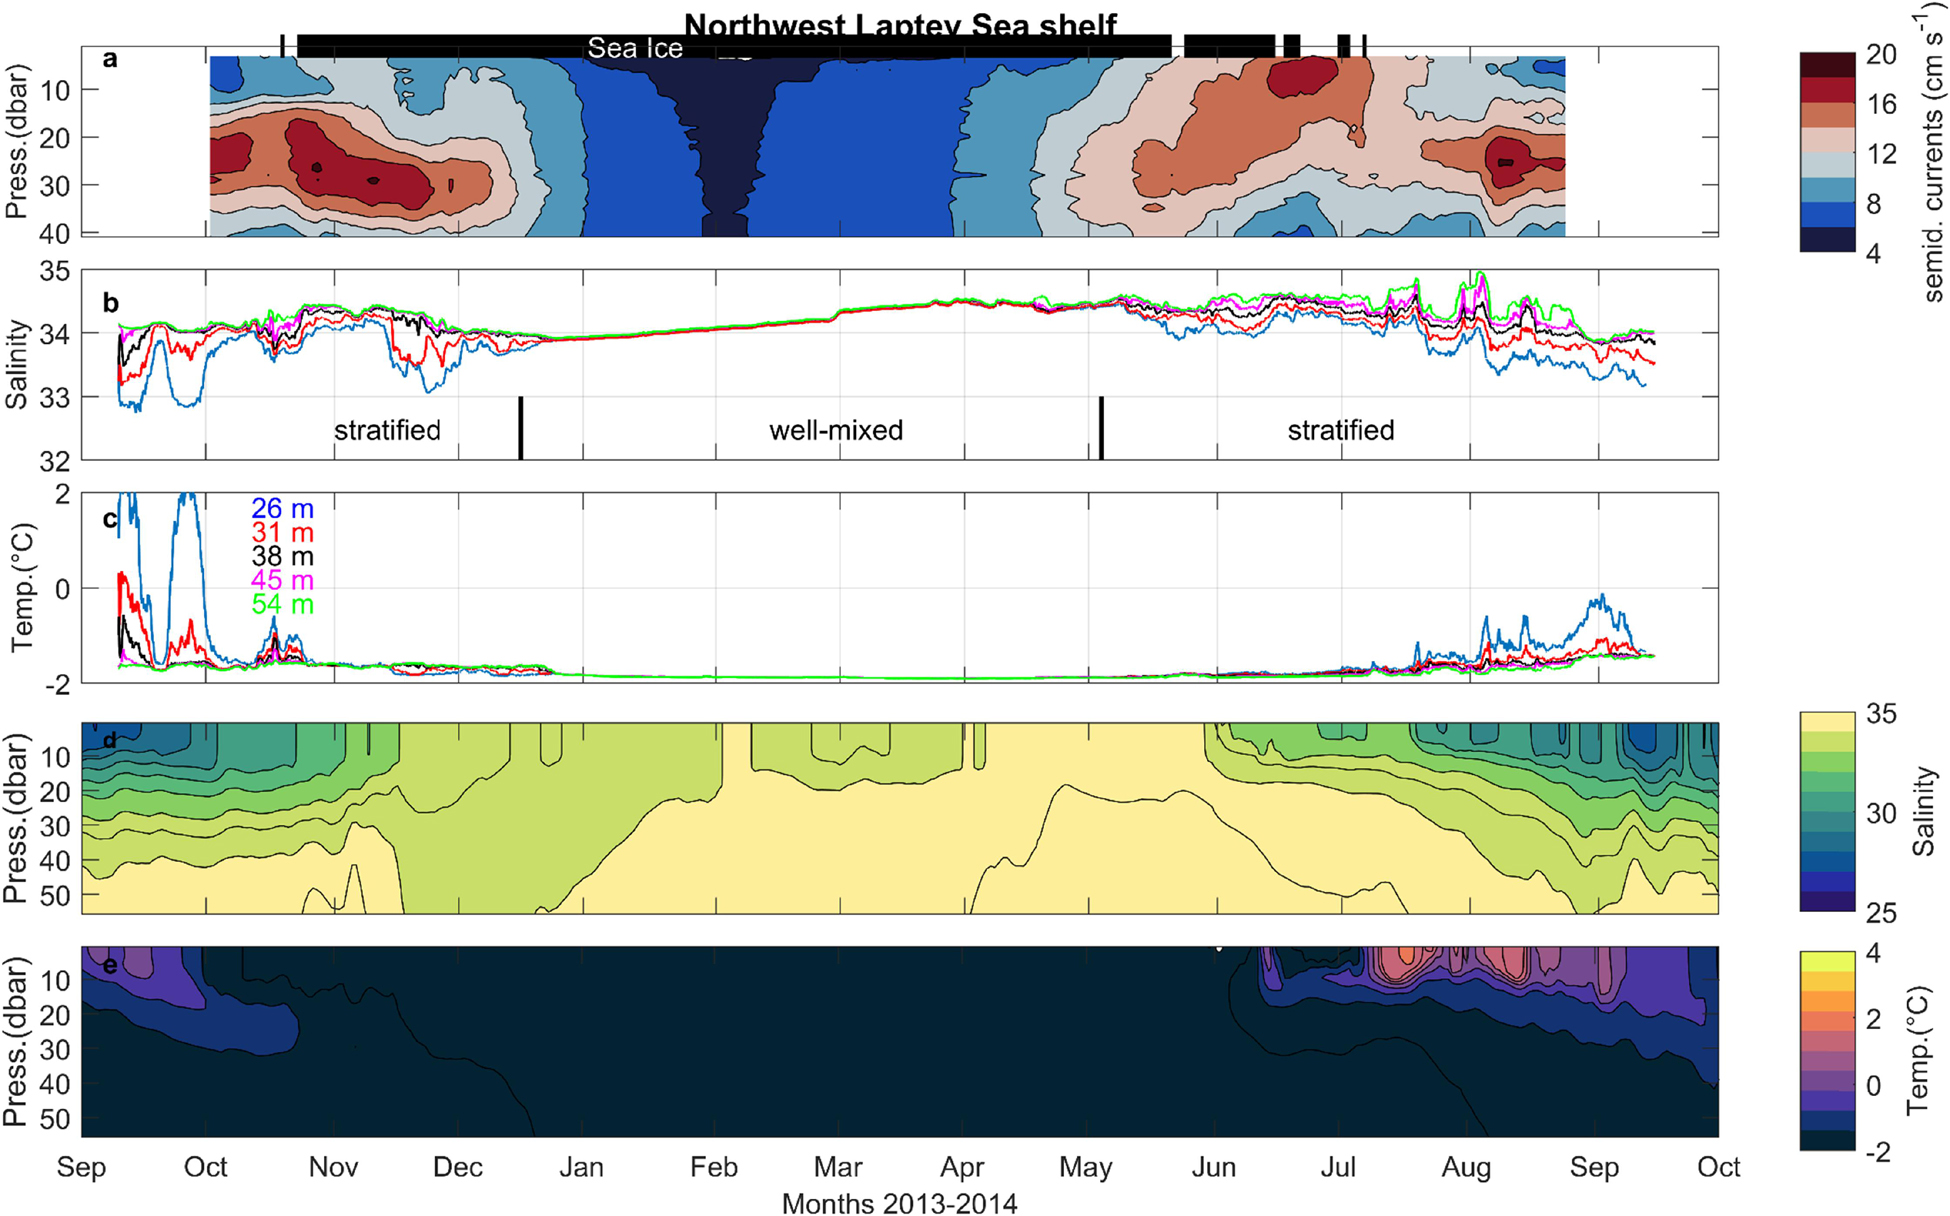
Figure 8. Northwest Laptev Sea shelf mooring record of (a) semidiurnal currents (cm s–1) overlain by sea ice cover at the top of the panel; (b) salinity and (c) temperature from SBE37 microcats moored in different depths indicated by colored text in the panel; (d) salinity and (e) temperature (°C) vs. depth (m) from Mercator from Septembers 2013 to 2014.
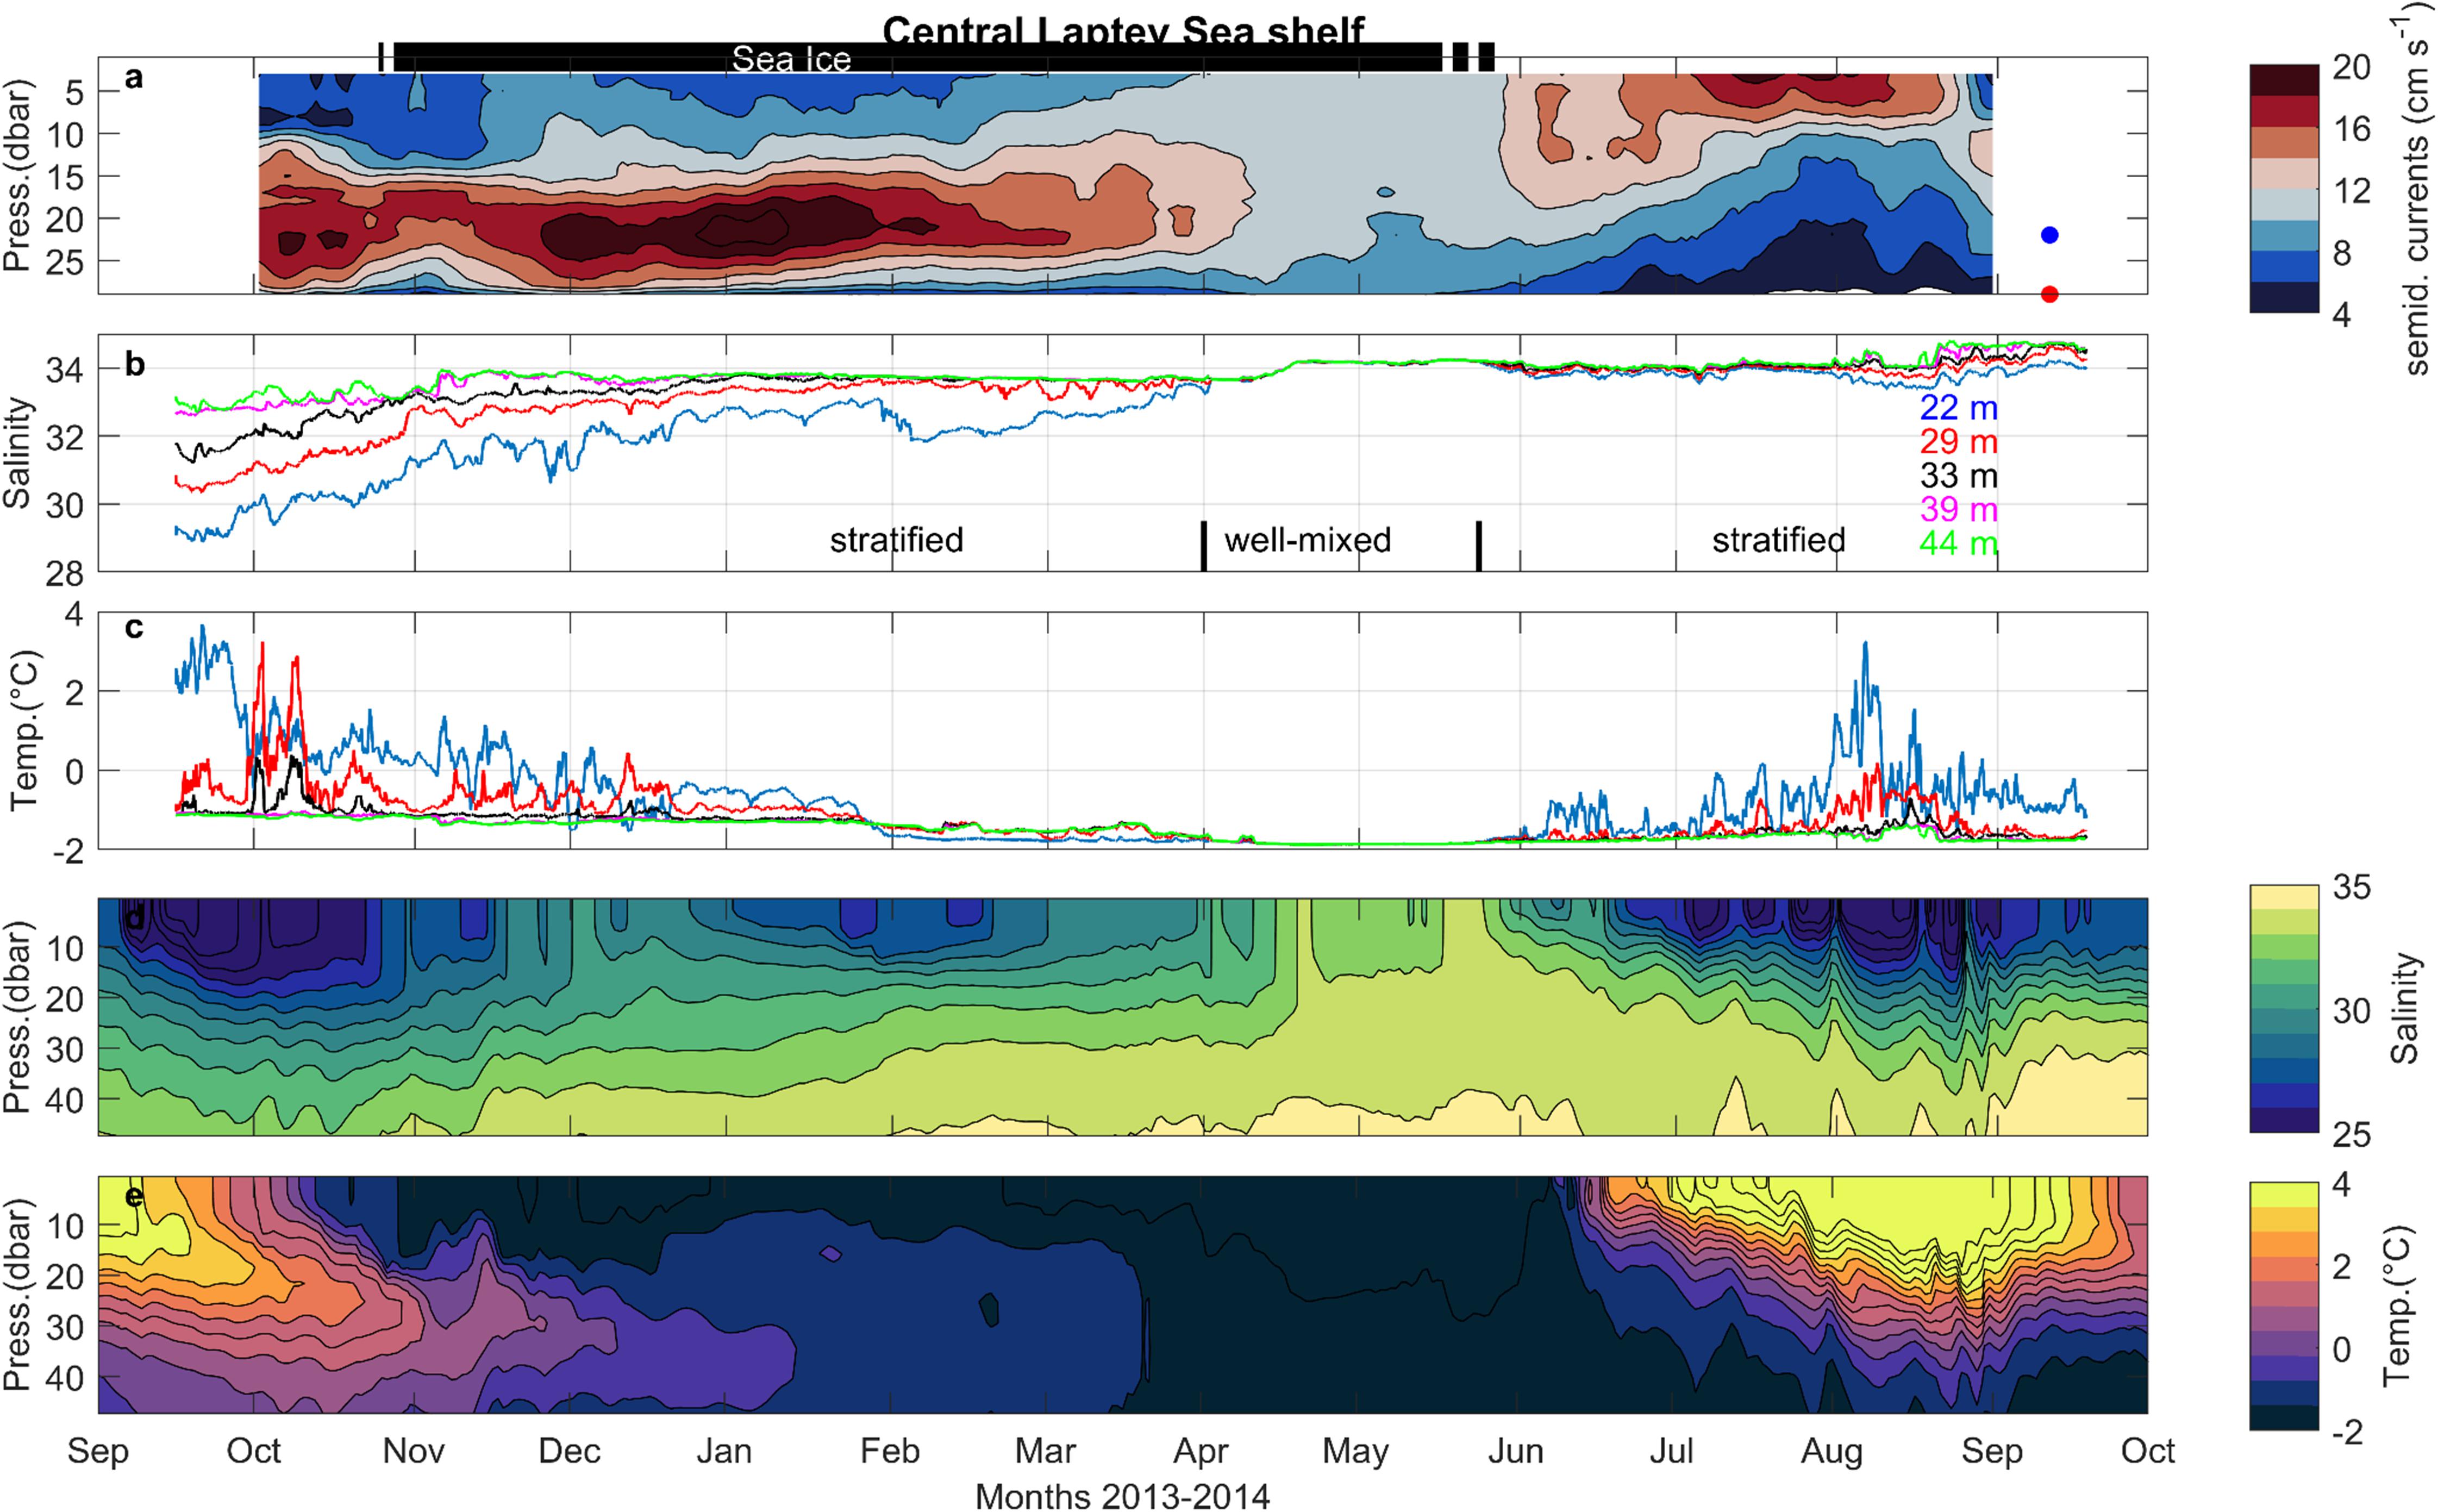
Figure 9. Same as Figure 8 but for the Central – mooring.
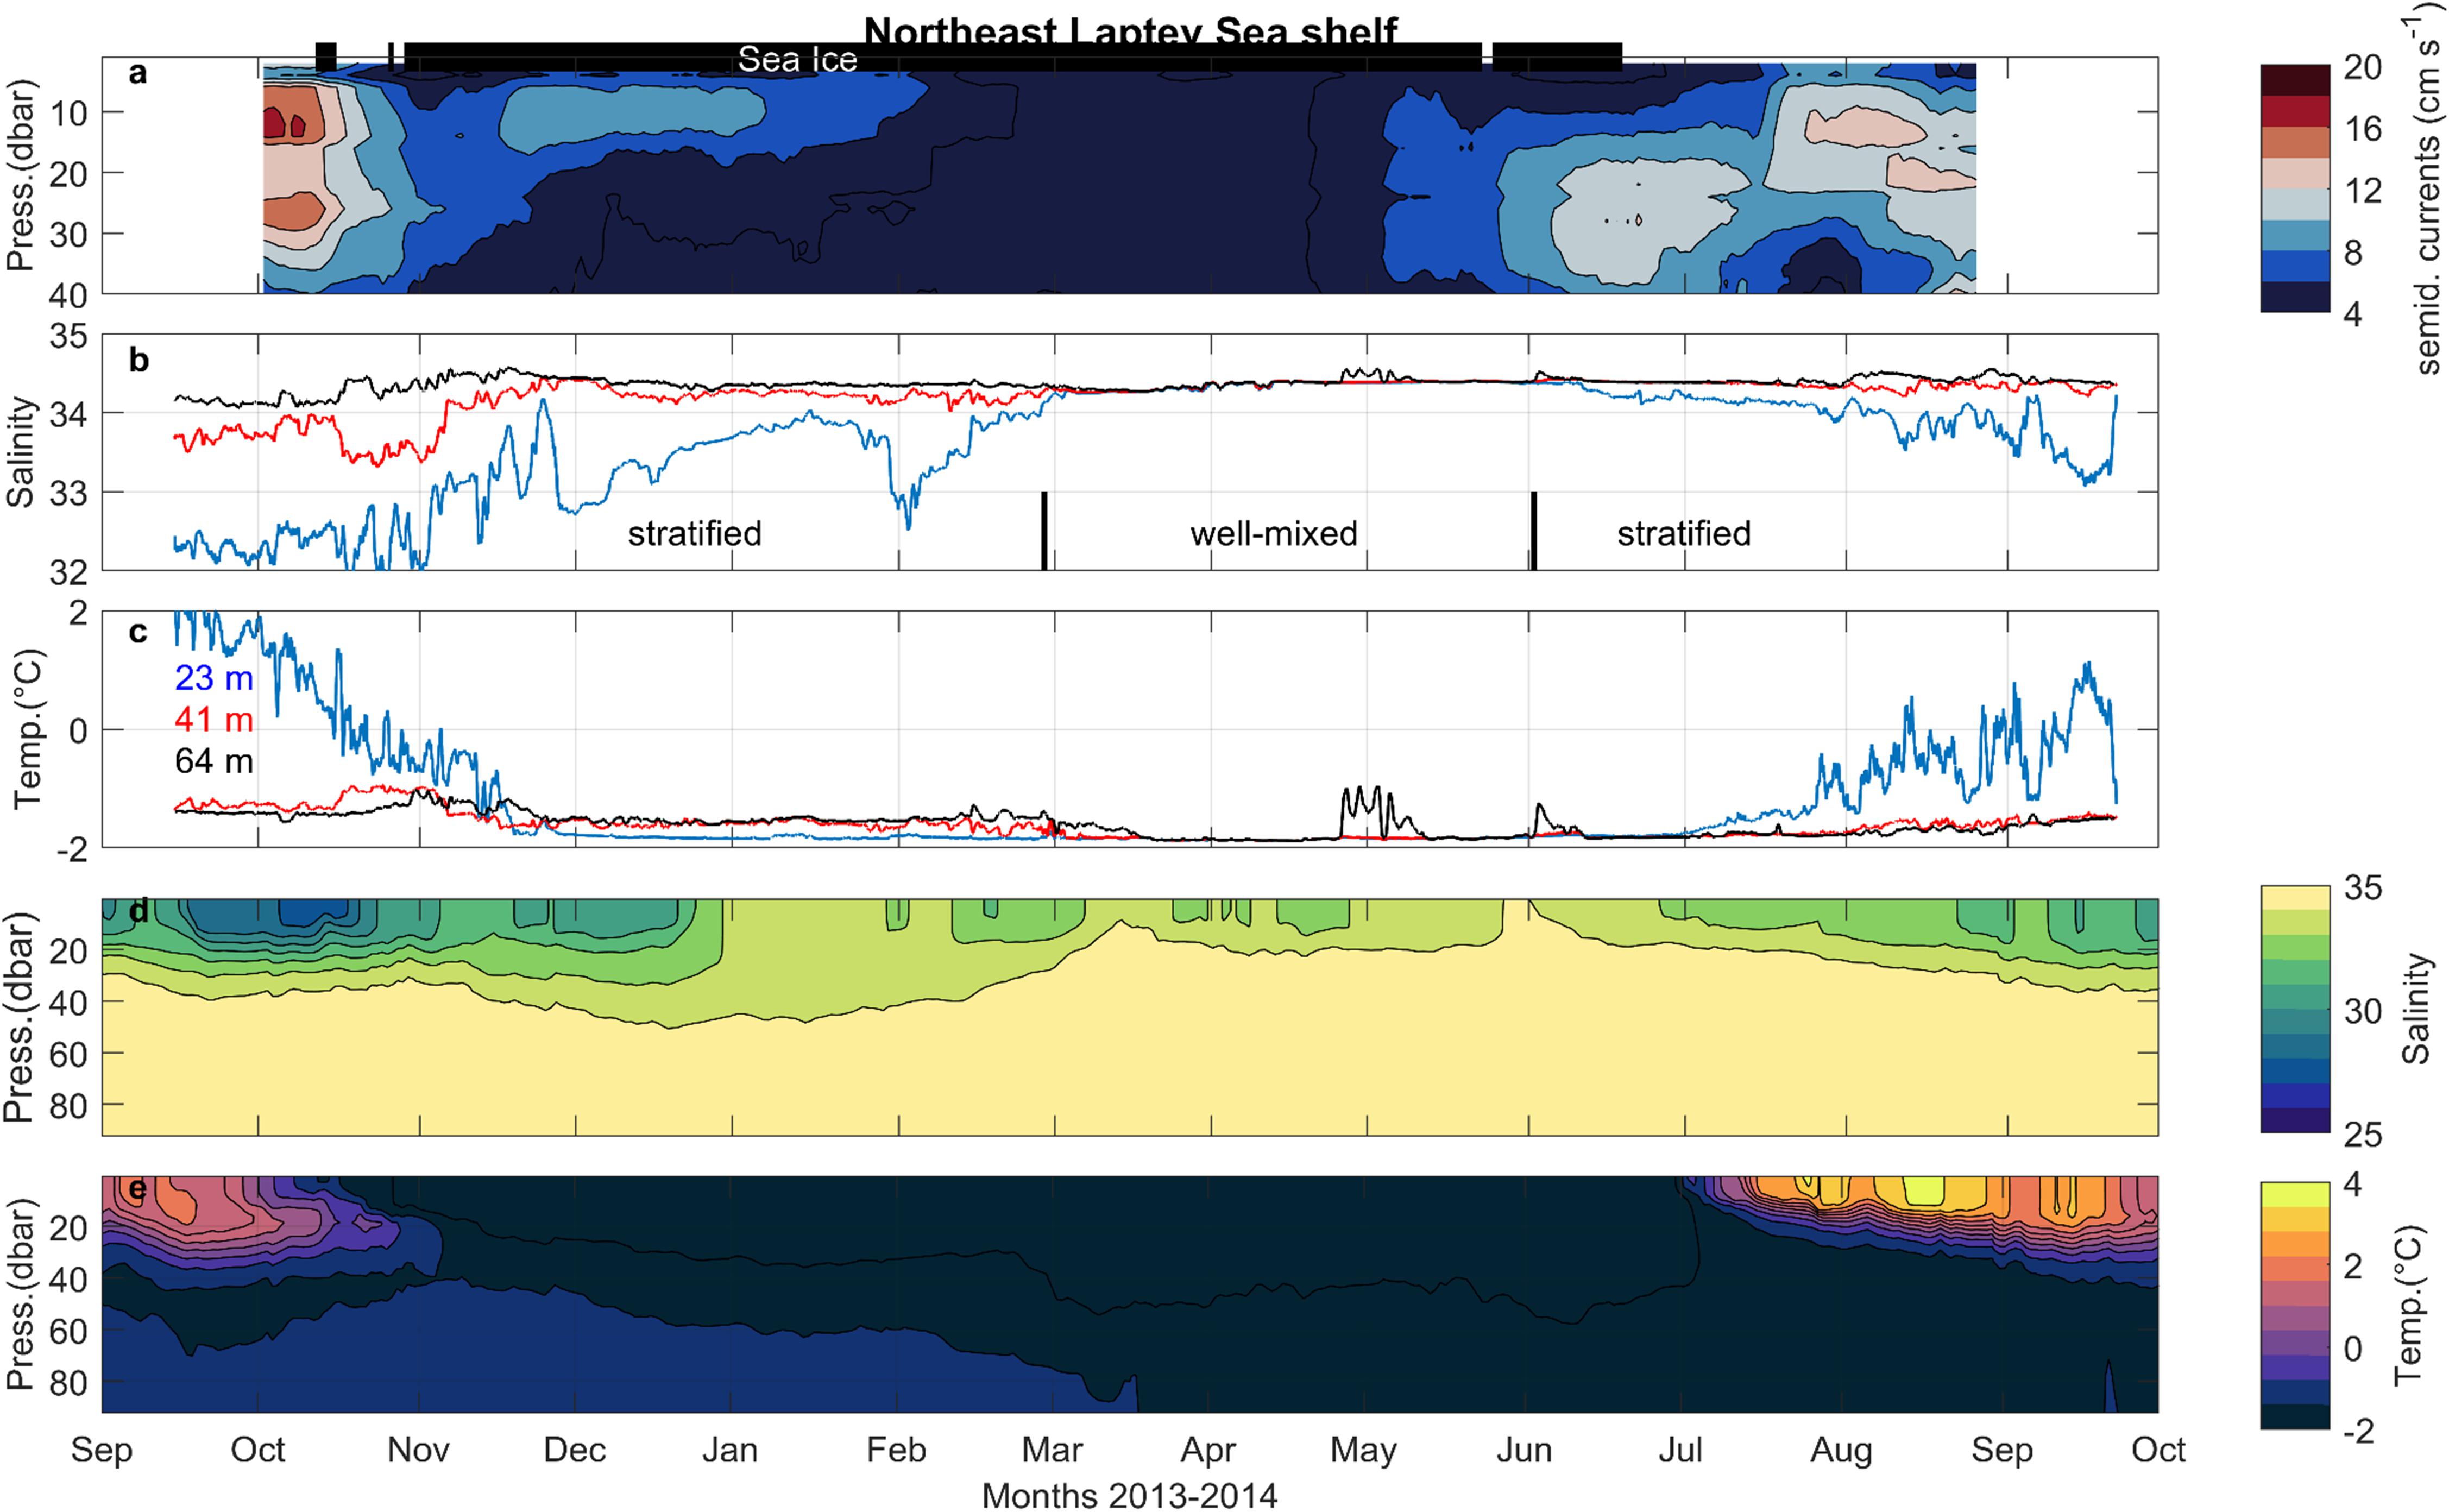
Figure 10. Same as Figure 8 but for the Northeast – mooring.
Mercator provides interesting additions to the mooring records. Since a direct comparison between measured and reanalyzed salinities may not be favorable considering the overall data sparseness in this region, we are limited to a rough comparison between the Mercator salinity (hence density) structure and the structure of semidiurnal currents at all three shelf locations. The regional contrast between the Northwest and Central locations is nicely reflected by Mercator. In particular the water column structures at the Central-mooring looks remarkably similar, except for a pocket of slightly fresher water that remains present under the ice, which is above the CTD instrument depths but also not visible in the current structure (Figure 9). Sea surface temperature and sea ice concentration are assimilated in Mercator, and we hence assume a realistic onset of stratification induced by the seasonal sea ice retreat. Considering that the relevant forcing parameters for the variability of oceanographic parameters in these shelf regions are sea ice and summer winds, we find that Mercator is a valuable tool to study trends and variability of ocean parameters under changing environmental drivers.
A Long-Term (1993–2019) Perspective on Sea Ice, Winds, and Hydrography
We explore the 26 year-long Mercator ocean reanalysis record to investigate the interannual variability of water column structure on the Laptev Sea shelf. Sea ice and winds are the two primary parameters impacting hydrographic properties and water column structure. While sea ice insulates the water column from solar radiation and wind mixing, it also regulates salinity through melting and freezing. As is widely known, winds during summer determine the distribution of the large river plumes and therefore regulate stratification. Viewing the central Laptev Sea shelf in a 26 year-long context highlights general trends in ocean properties as well as specific anomalies in concert with anomalous sea ice and wind conditions. The Laptev Sea shelf transitioned from a nearly year-round ice cover in most (but not all) years in the 1990’s and early 2000’s to a seasonally ice-free shelf (Figure 11). Consequences of ice-free summers on the thermal environment are immediately apparent in high upper ocean temperatures (mean 0–10 m) exceeding 5°C in several recent years (2011–2014, 2018), in contrast to sub-zero degree ocean temperatures in ice-dominated summers (1993, 1996, 2001, 2004). Besides variability in sea ice, offshore and onshore-directed winds (removing or maintaining freshwater on the shelf) are directly reflected in the winter mixed layer depths (Figure 11). For instance, the strong stratification and presence of the Lena River water on the shelf maintained stratification and shallow mixed layers throughout the winter season 2013/2014. The contrasting winds in summer 2014 removed freshwater from the shelf and allowed for deeper mixing in the following winter 2014/2015 (Figure 11). While these effects can be seen for individual pairs of years with opposing summer winds, we can also identify a general shift toward deeper mixed layers after the mid-2000’s. The first half of the record remains largely year-round stratified (with exceptions in 1995/1996), while the second half features several years with weak stratification. This is directly related to extended open water seasons, which now increases the ability of winds to redistribute the river plume. The dispersion of the river plume under an ice cover follows ocean dynamics constrained by bathymetry, background flow and under-ice topography (Kasper and Weingartner, 2012). Without effective atmospheric surface forcing, this leads to undistorted discharge of freshwater onto the central and eastern shelf, as can be seen from the difference in mixed layer depth between the Central and Northwest-locations in strong ice years (1997–2003). The under-ice mixing may not be sufficient to erode the halocline and hence stratification is maintained year-round. In contrast, removing the ice cover leaves the river plume at the fate of surface winds. Offshore-favorable winds such as in 2014–2016 remove the surface freshwater and reduce the strength of the seasonal halocline. When this happens, convective forcing and wind- and tide-driven mixing is sufficient to erode stratification, often by early- to mid-winter. The impact of onshore vs. offshore winds in any particular summer is difficult to quantify, as anomalous winds during single summer months (July, August, or September) can sufficiently redistribute the freshwater plume. The summer of 2016 presents a unique example in this record, when strong eastward (and partly northward) winds prevailed throughout summer (July–September, Figure 11) under near-average sea ice conditions. These winds prevented the river plume from reaching the central shelf location entirely and led to a well-mixed water column already by fall. The summers of 2001 and 2002 were also dominated by offshore-favorable wind anomalies, but a heavy ice cover in 2001 weakened the wind-effect on the freshwater, while only average ice conditions in 2002 resulted in a well-mixed water column by January 2003. The presence or absence of low salinity surface water in fall and early winter has profound implications for the formation of dense shelf waters during freeze-up and the depth levels that they may reach depending on their density. Overall, the shift to more ice-free summers may likely increase the variability in water column structure due to a more variable wind-influence and overall higher chances for deeper mixed layers. Transitioning from heavily ice-covered to seasonally ice-free regions, such as the northwest Laptev Sea, results in changes in water mass formation and transformation due to enhanced sea ice formation in fall and early winter (Preußer et al., 2019). In fact, the near-bottom salinity record on the northwestern shelf (not shown) shows a shifting increase by 0.5 just before 2013, which could be related to the seasonal sea ice changes there (Figure 11).
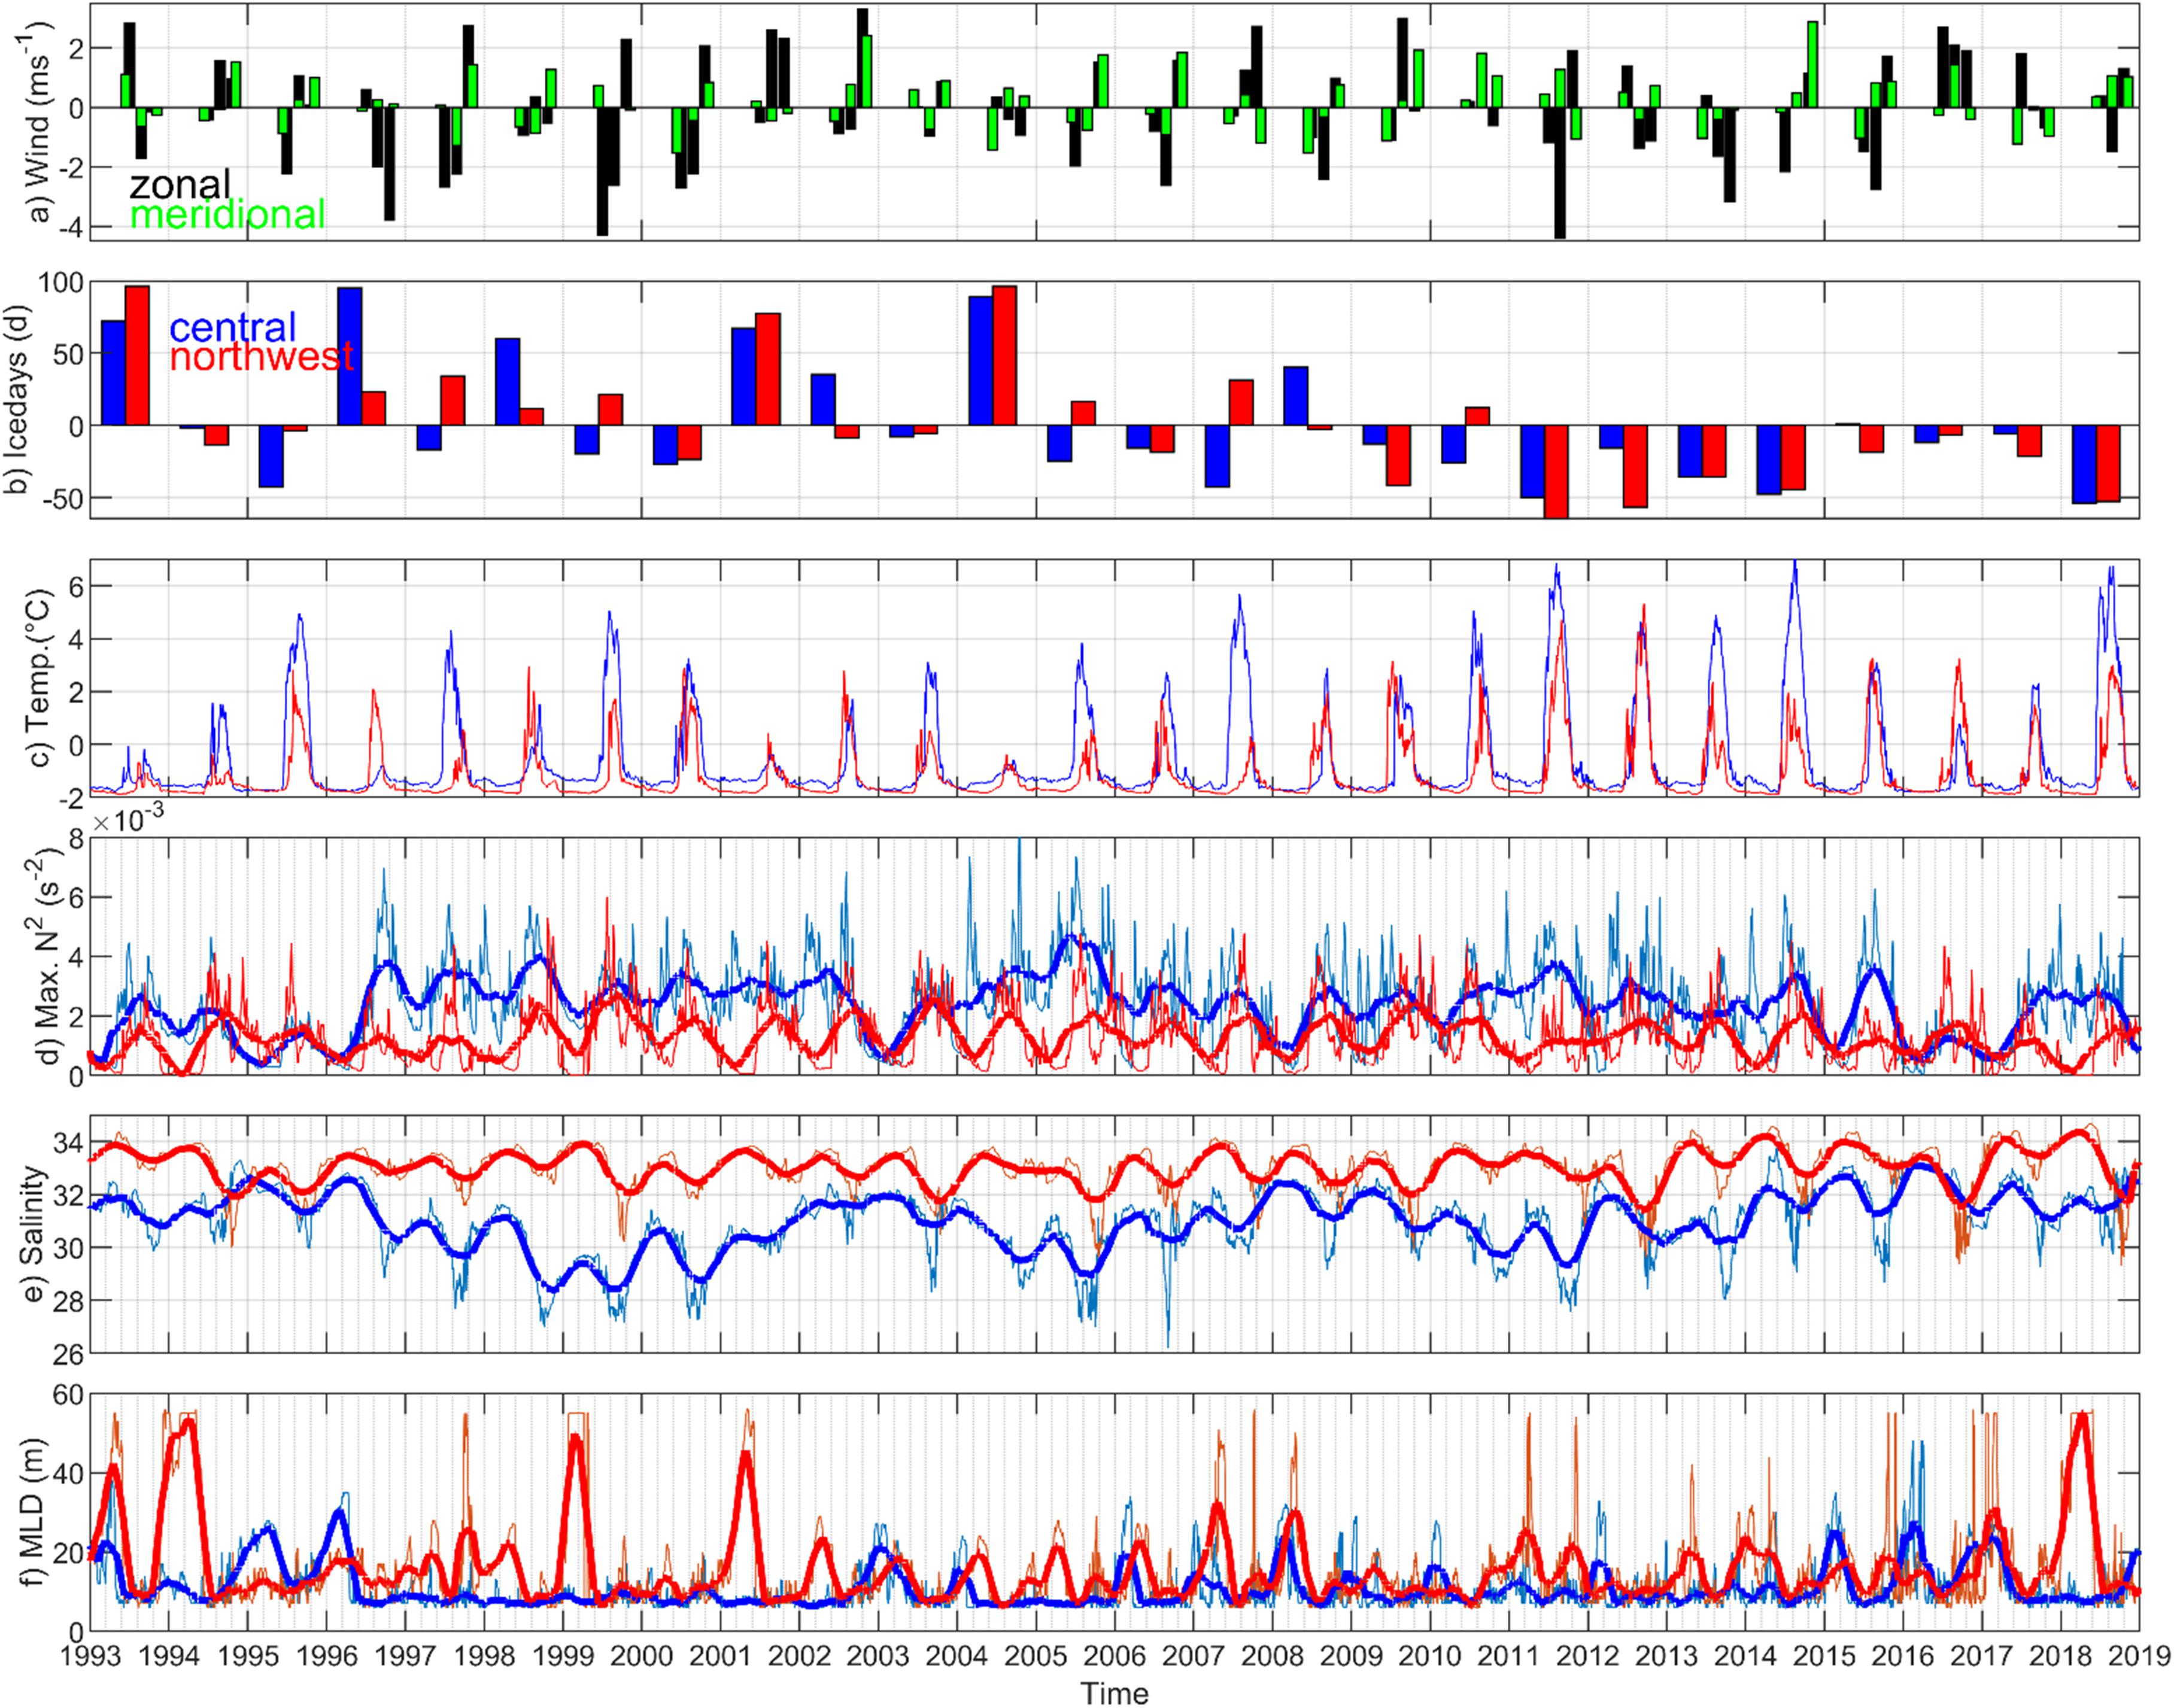
Figure 11. 1993–2019 Mercator record of winds, sea ice and hydrographic parameters. (a) U (black) and V (green) monthly mean July, August, and September ERA-I winds at 73.3°N, 127.5°E; (b) Yearly anomalies of days when sea ice was present in concentrations of >70% on the central Laptev Sea shelf (blue bars) and on the northwestern Laptev Sea shelf (red bars); (c) daily mean upper layer (0–10 m) temperature (°C); (d) maximum Brunt-Vaisala-frequency N2 (s– 2); (e) mean (surface-to-bottom) salinity; (f) mixed layer depth (m). Note thin lines in (d–f) show daily values, while the thick lines are smooth using a 3 month running mean filter.
Discussion
The low-salinity water largely outlines the extent of the Lena River freshwater plume, as confirmed by a water component analysis based on combined dissolved radiogenic neodymium and stable oxygen isotope data obtained for the summers of 2013 and 2014 (Laukert et al., 2017). This analysis is in line with results from a principal components analysis based on stable oxygen isotopes and nutrients (Bauch and Cherniavskaia, 2018) and indicates river water fractions in 2013 between ∼40% on the central shelf and ∼75% in the southeastern Laptev Sea that almost exclusively can be attributed to the Lena River (Figure 12). The western and northwestern shelf with river water fractions of <25% was influenced by Kara Sea freshwater (i.e., Yenisey and Ob river water, Laukert et al., 2017), which enters the region through Vilkitsky Strait (Janout et al., 2015). In the southwestern Laptev Sea, Khatanga River freshwater may also have been present in surface waters in minor quantities, as indicated by deviating tracer data (Laukert et al., 2017). In 2014, maximum river water fractions were <50% and limited to the far eastern shelf and near the Lena River outflow. While the Lena River dominance was strongly reduced, the Kara Sea influence on the northwestern shelf increased to nearly 20%. The comparatively larger influence of the Lena plume in 2013 also controlled stratification throughout much of the shelf, in particular in the eastern and southeastern Laptev Sea where river water fractions were highest. There, the water column remained mostly stratified despite the low water depth (∼20 m) because tides in this region are weak (Fofonova et al., 2014; Janout and Lenn, 2014) and wind-driven mixing only occasionally breaks up the stratification (Hölemann et al., 2011; Shakhova et al., 2014). The relative contributions of temperature and salinity to stratification can be quantified by relating the stratification (Brunt-Vaisala-frequency N2) computed from the observed temperature profile and the vertical average of the measured salinity to the stratification computed from the measured CTD profile. Unsurprisingly, salinity controls >90% of stratification throughout most of the shelf in both 2013 and 2014 (not shown), except for the western and northwestern region farthest away from riverine sources, where temperature stratification becomes slightly more relevant (15–20%).
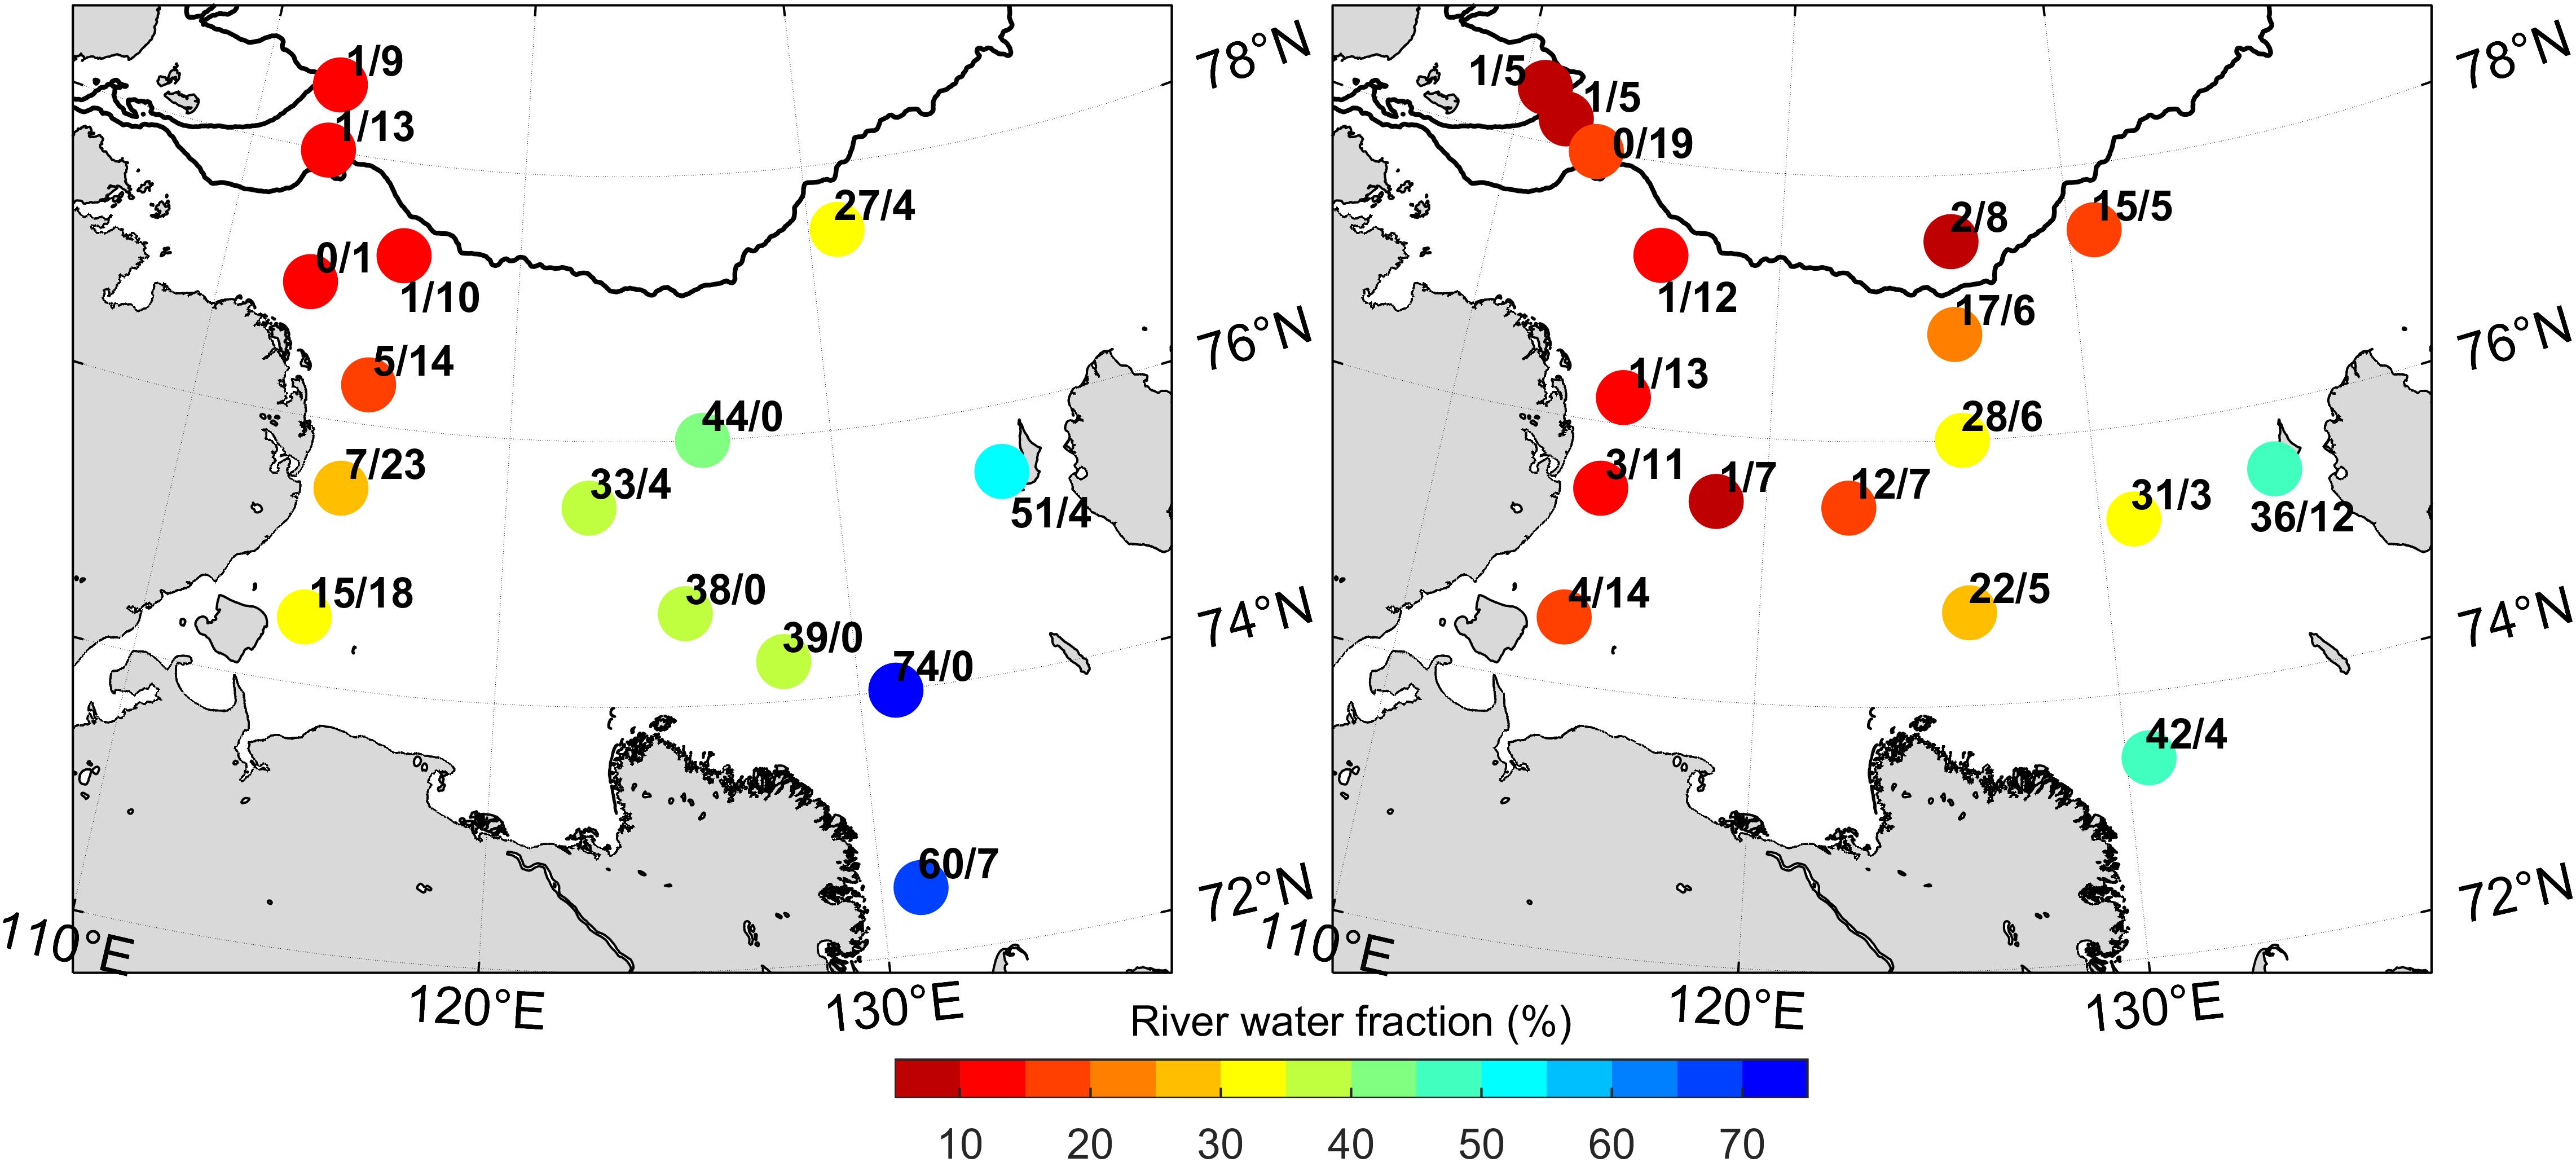
Figure 12. Total river water fraction (in %) (color-coded dots) and contributions (in %) of individual rivers (numbers: first and second number quantify Lena and Ob/Yenisey contributions, respectively) based on a water mass assessment previously reported by Laukert et al. (2017) for the late summers of 2013 (left) and 2014 (right).
The water column structure and seasonal and interannual variability of stratification is a key regulator for the ecosystem’s physical and biogeochemical processes. In summer, the surface mixed layer (SML) in the Laptev and Kara Sea ROFIs shows generally low concentrations of dissolved inorganic nitrate and phosphate and thus only low to intermediate chlorophyll concentrations (Pivovarov et al., 2005; Demidov et al., 2014). In contrast, higher concentrations of these nutrients were observed in bottom waters of the ROFI below the pycnocline (Pivovarov et al., 2005). The strong stratification within the ROFI inhibits vertical mixing and consequently vertical turbulent nitrate fluxes (Randelhoff et al., 2020). Thus, the concentration of inorganic nitrogen, which decreases strongly during the spring bloom, remains at low levels in the SML (Pivovarov et al., 2005; Nitishinsky et al., 2007; Thibodeau et al., 2017). Compared with the inflow shelves of the Arctic Ocean, new primary production on the interior shelves of the Siberian Arctic (Kara, Laptev and ESS) is low (Sakshaug, 2004; Mosharov, 2010; Williams and Carmack, 2015). Remote sensing-based estimates of primary production in the Laptev Sea also indicate that despite the decrease in sea ice cover, primary production on the central shelf decreased between 1998–2012 (Arrigo and van Dijken, 2015) and 2002–2018 (Demidov et al., 2020).
Soppa et al. (2019) showed that the observed high concentration of CDOM in the Laptev Sea ROFI (Heim et al., 2014) has a significant effect on the underwater light field absorbing most of the solar energy in the uppermost 2 m of the water column. Thus, for surface salinities <10 the depth of the euphotic surface layer (1% PAR) is ∼5 m and thus within the SML (Sorokin and Sorokin, 1996). Consequently, below this depth no primary production is possible although the bottom water has high concentrations of nutrients (Mosharov, 2010). Outside of the Laptev and Kara Sea ROFIs, the depth of the euphotic zone exceeds 20 m (Sorokin and Sorokin, 1996; Demidov et al., 2014), reaching the depth of the nutricline at ∼20–30 m (Pivovarov et al., 2005). In these more transparent waters with sufficient light below the SML, a subsurface chlorophyll maximum (SCM) can develop during the summer, when the nutrients in the SML are depleted (Demidov et al., 2018). This phenomenon has already been described in other marginal seas of the Arctic Ocean that are strongly influenced by riverine input, such as the Beaufort Sea (Carmack et al., 2004). Due to the generally high content of light-absorbing substances in the Siberian Shelf Seas, the depth of the photic zone outside of the ROFI is also limited, thus limiting the potential water depths of SCMs to a relatively narrow layer between 20 and 30 m (Mosharov, 2010; Demidov et al., 2014).
The general surface circulation in the Laptev Sea is characterized by a cyclonic (eastward) flow pattern (Timokhov, 1994). This circulation causes an inflow of more saline water masses from Vilkitsky Strait and the Nansen Basin into the northwestern Laptev Sea while the salinity of the eastern Laptev Sea’s surface water is strongly influenced by the freshwater discharge from the Lena River. The strong sea ice formation additionally contributes to the comparatively higher salinity in the western Laptev Sea (Churun and Timokhov, 1995; Janout et al., 2017, Figure 11). The frontal system between the ROFI in the eastern Laptev Sea and the denser waters of the western Laptev Sea is of importance for the formation of an intermediate temperature maximum (ITM) that was frequently observed in fall and winter below the ROFI (Figures 13, 14). The ITM is characterized by relatively high temperatures (up to 5°C) and low nutrient concentrations (Pivovarov et al., 2005) and forms in summer at the surface of the western Laptev Sea. When the wind forces the buoyant river plume and meltwater westward or the western Laptev Sea waters eastward it overflows the denser warm surface waters of the western Laptev Sea. The (now) intermediate water mass below the ROFI is isolated from the atmosphere, and thus able to maintain the higher temperatures (thermal energy) longer than it could under fall and winter cooling within the SML. Traces of the ITM remain visible well into winter (Figure 9) and may then influence sea ice formation (Timmermans, 2015) and bottom water temperatures (Janout et al., 2016a).
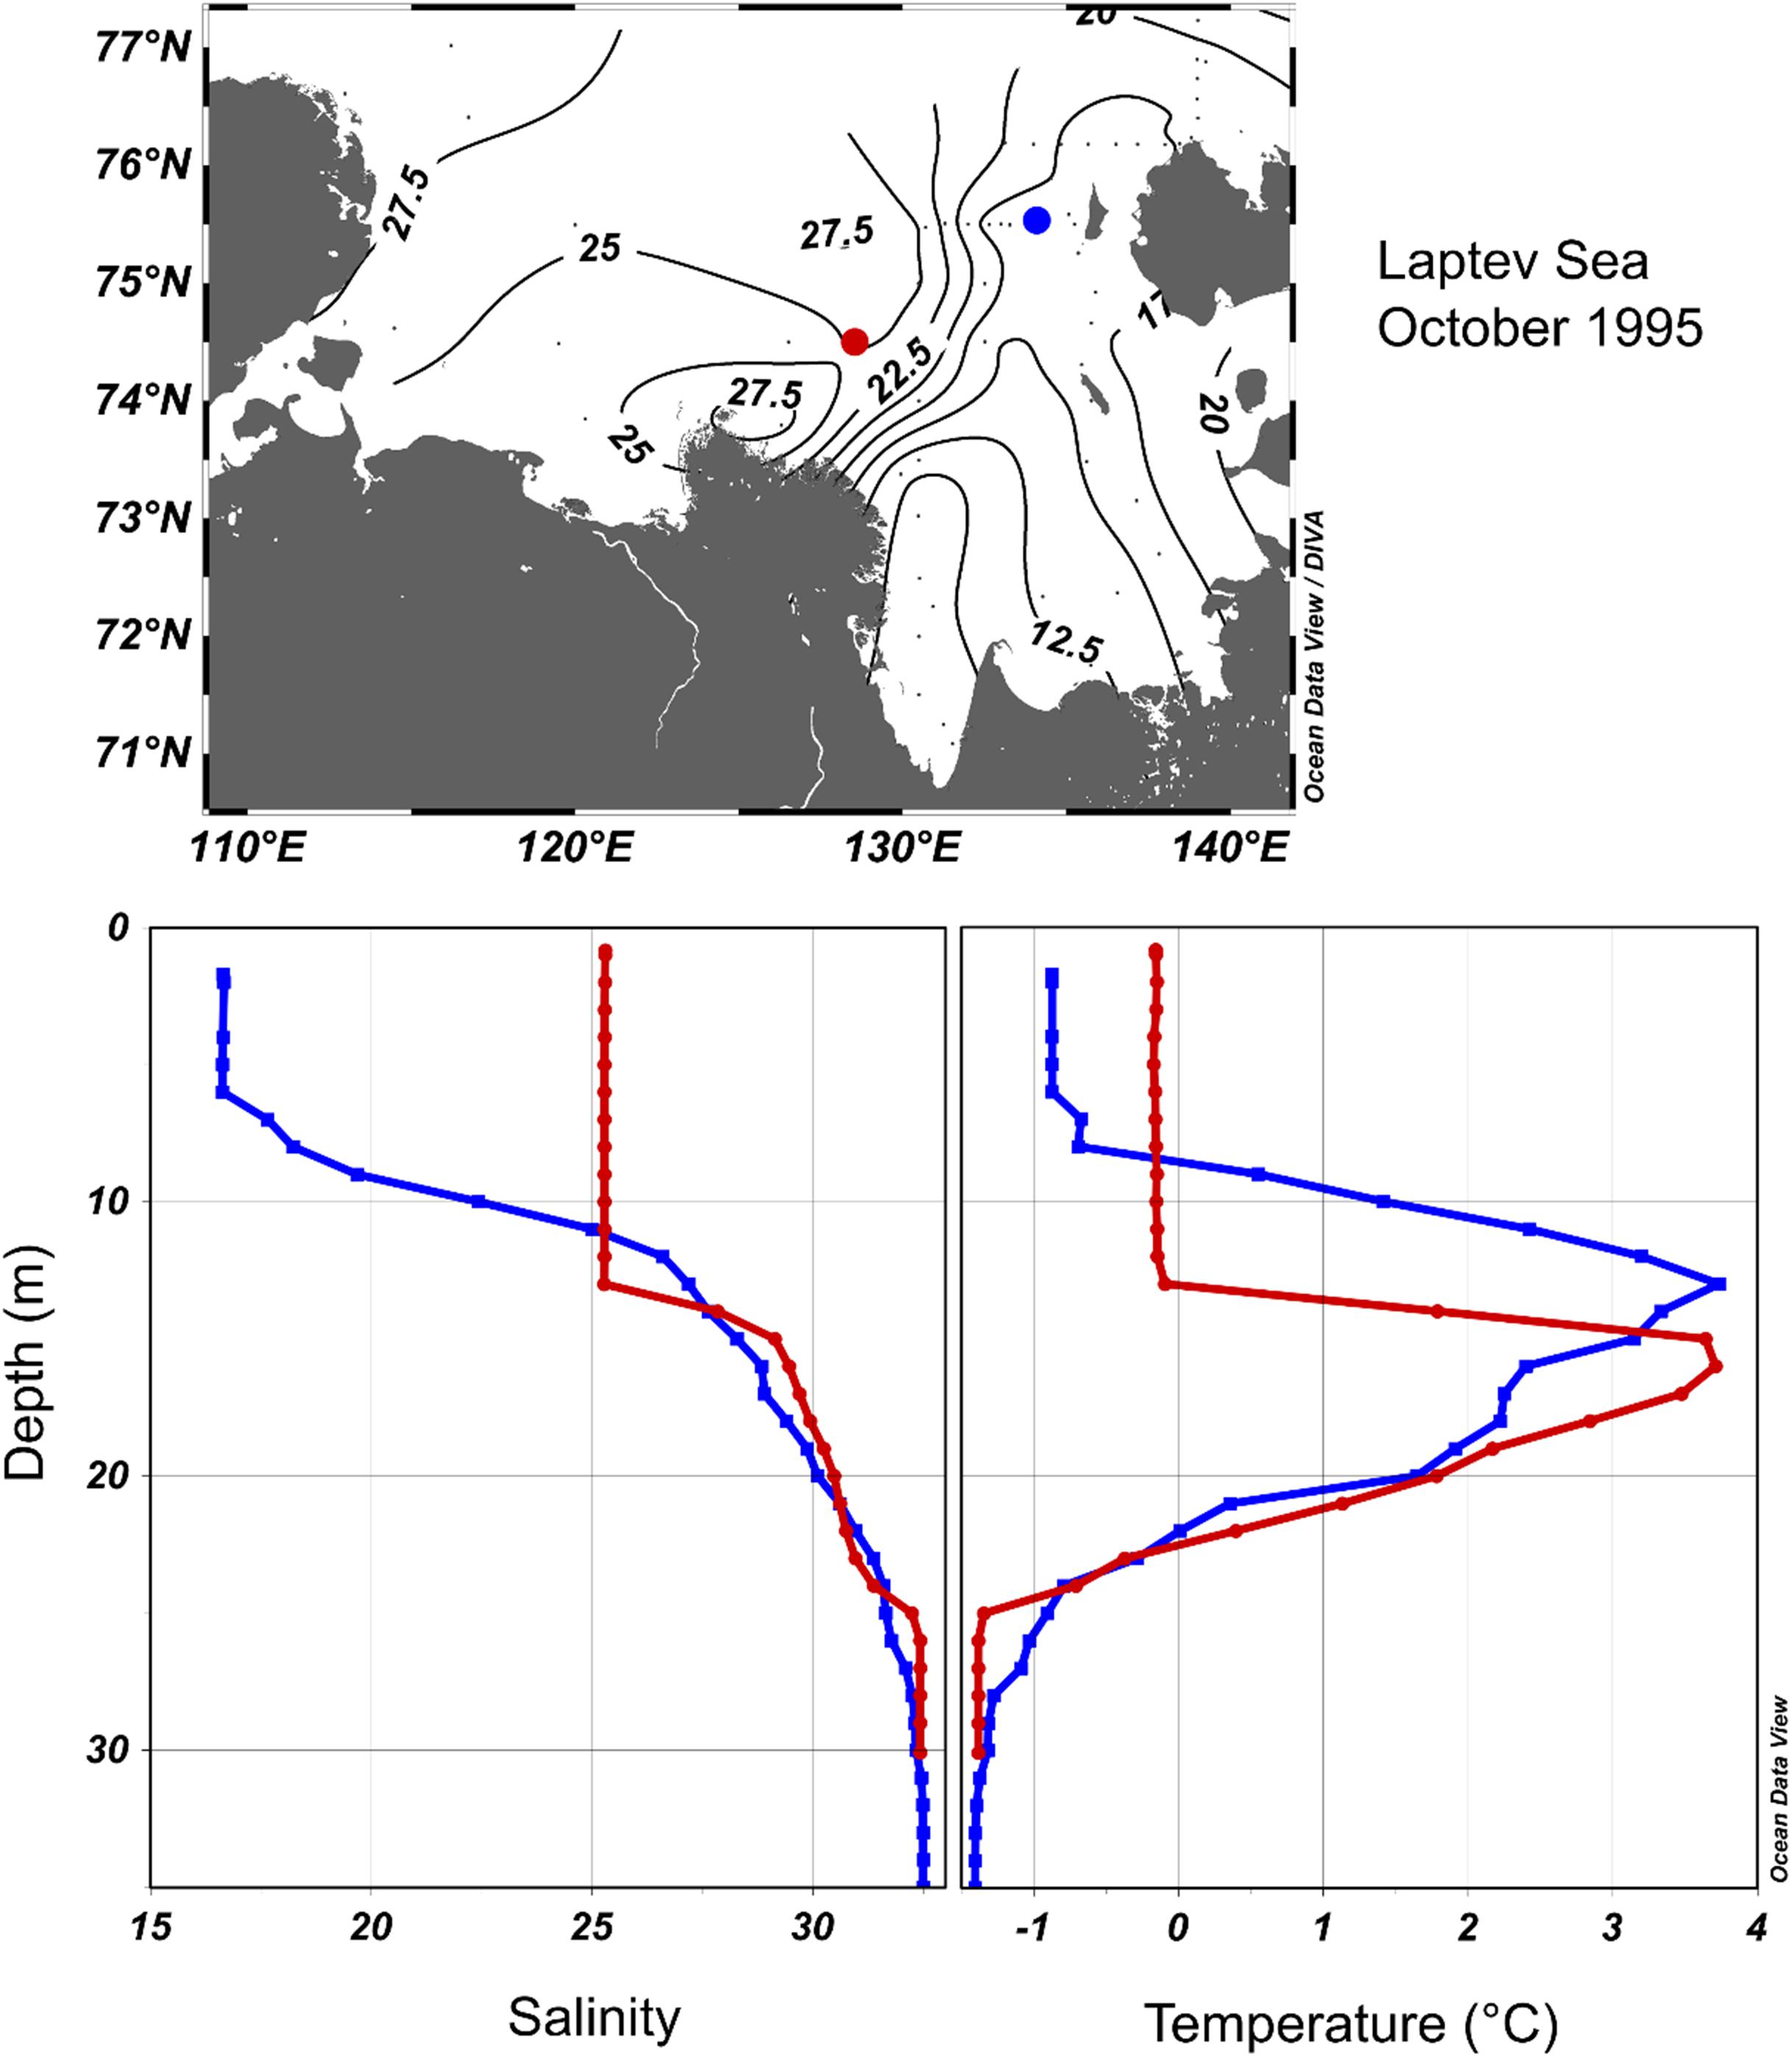
Figure 13. Example from intermediate temperature maximum observed during a survey in October 1995. The map shows the surface salinity distribution and location of two CTD profiles, shown in the respective colors in the lower panels (left: salinity; right: temperature).
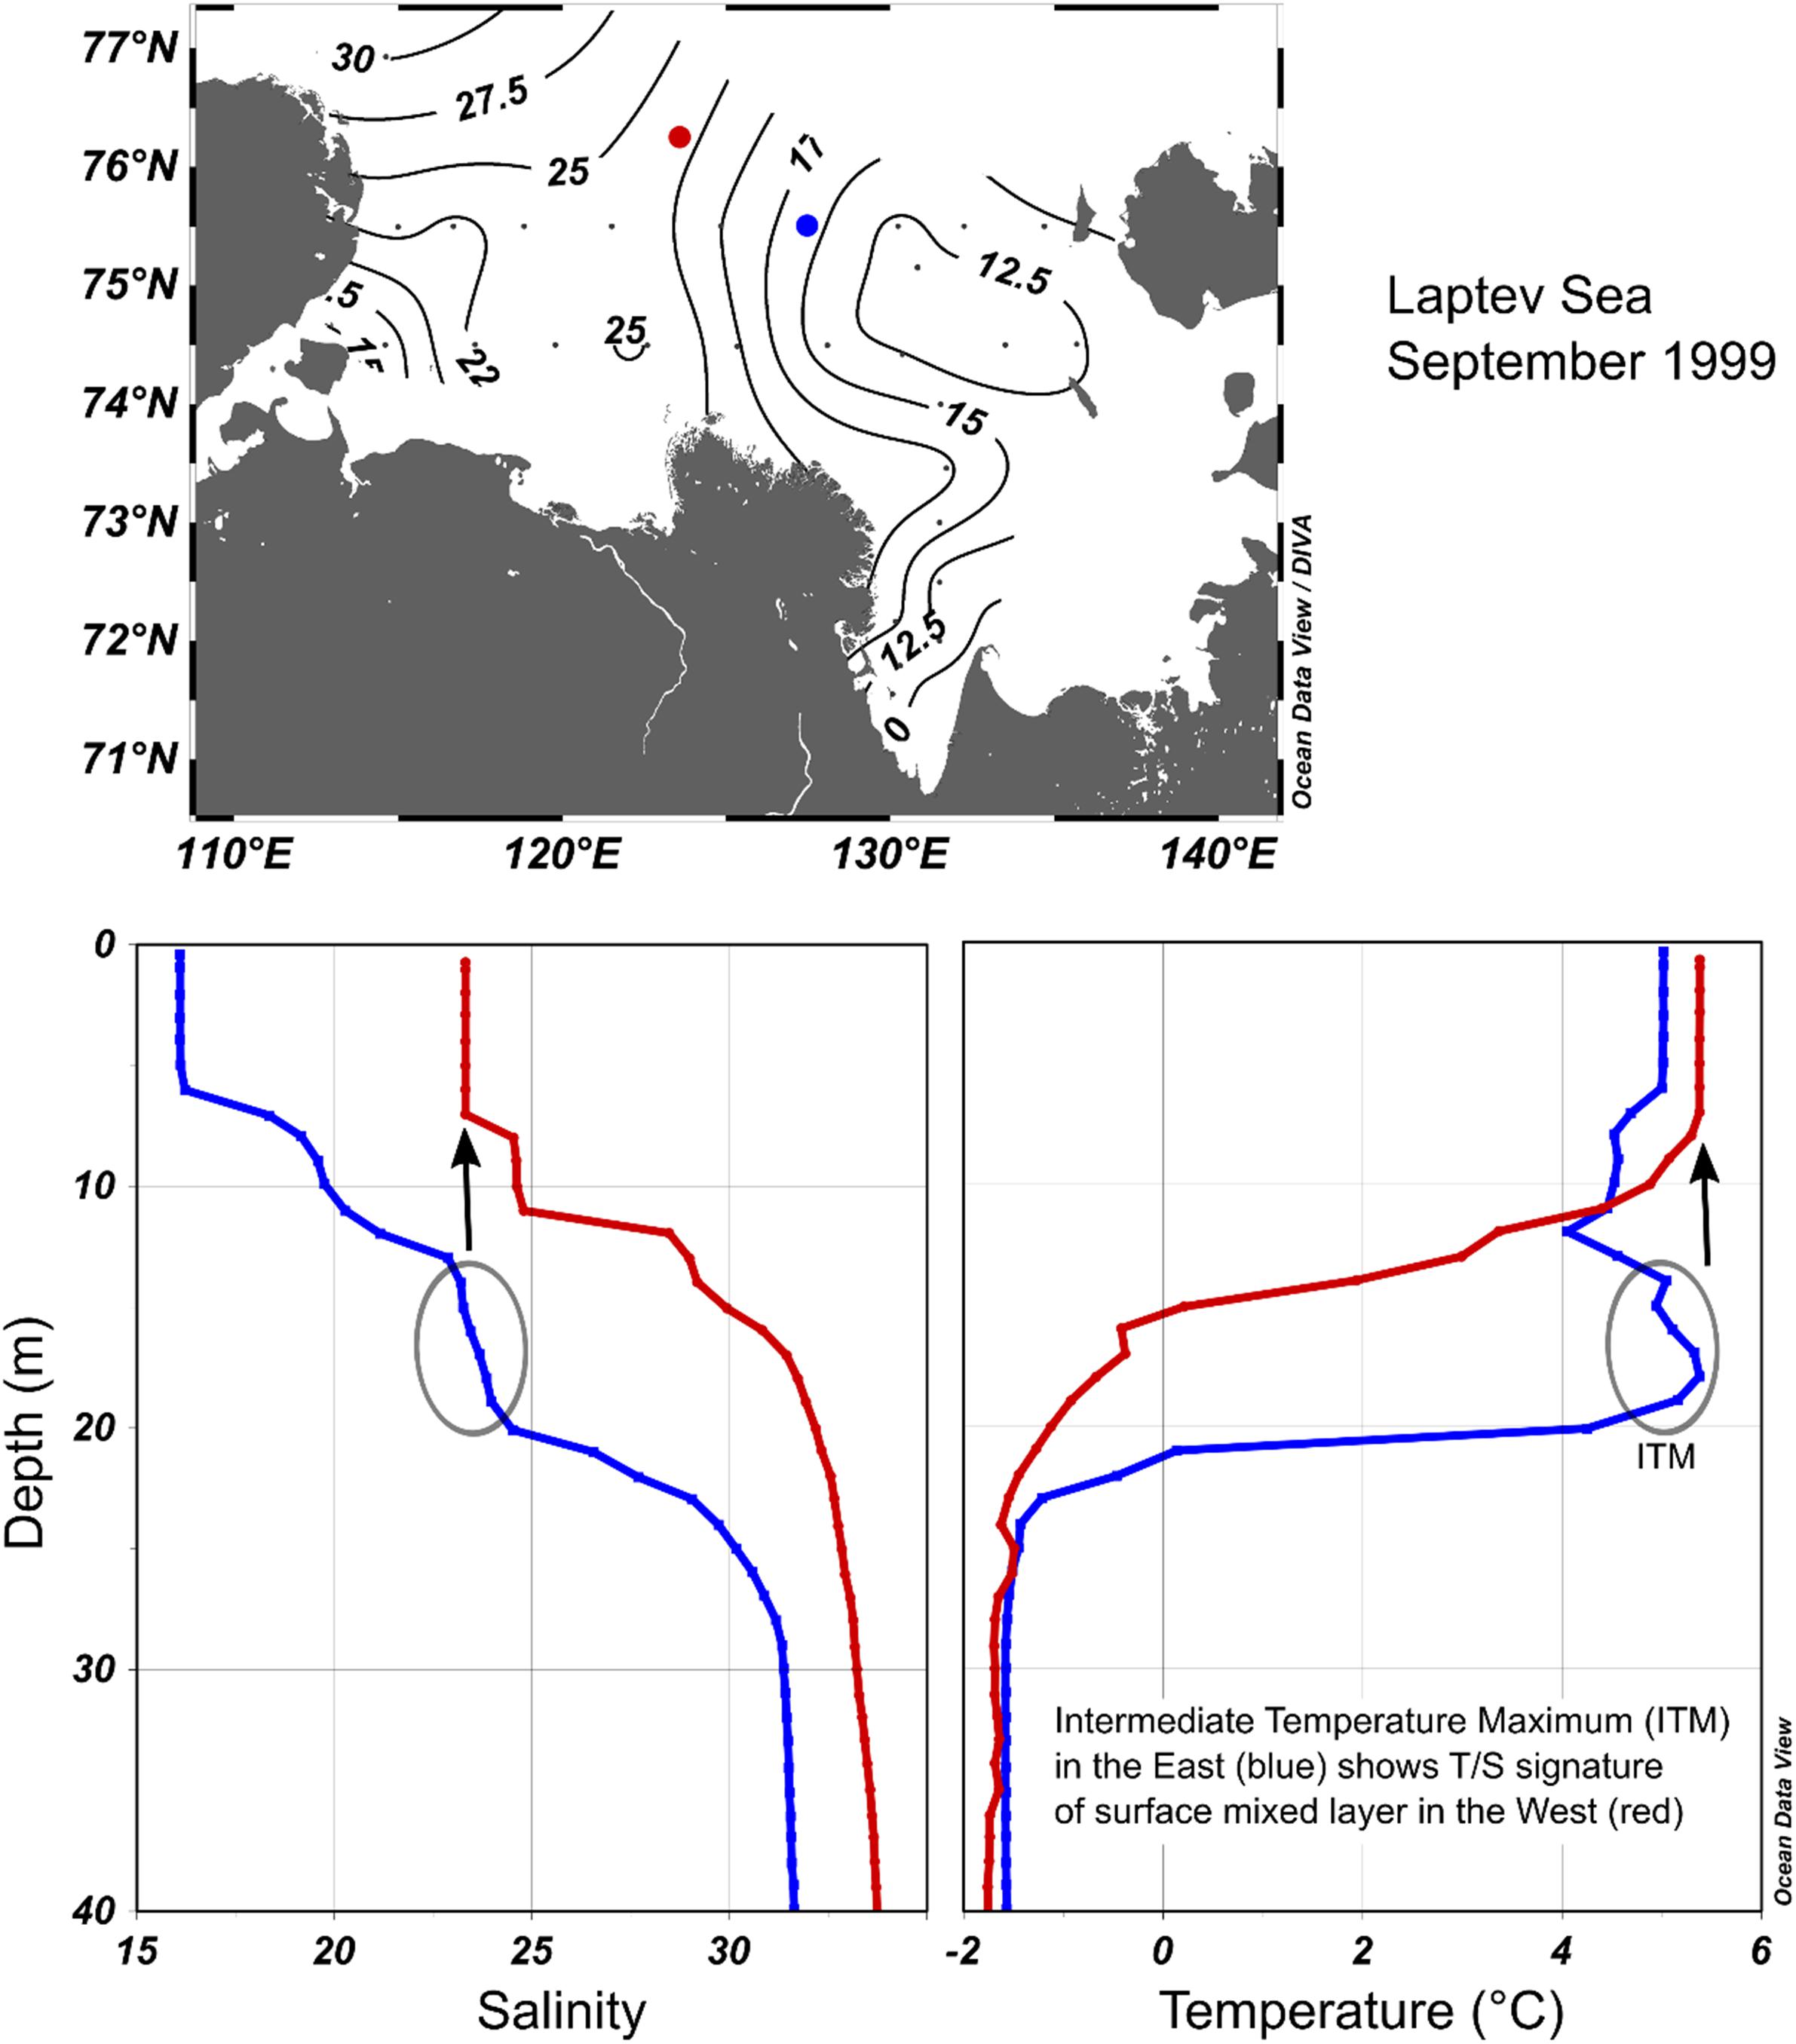
Figure 14. Same as Figure 13 but from a survey in September 1999.
With the overall increase in light availability under retreating Arctic sea ice, nutrients will become a more limiting factor for future primary production. Nutrient budgets depend on utilization and cycling and most importantly on the supply through lateral and vertical fluxes. These are controlled by stratification in most regions (Randelhoff et al., 2020), underlining the role of stratification as a key ecosystem parameter. Our investigation of the two and a half decade-long Mercator record suggests increasing variability and tentatively weaker stratification on the Laptev Sea shelf. This contrasts expectations of increasing stratification in other Arctic regions due to sea ice melt and thermal warming. The future ecosystem may experience an increase in PAR, but this will be countered by enhanced riverine input (Holmes et al., 2019), which may strengthen stratification and reduce the euphotic depth due to enhanced levels of CDOM. Further, considering that Atlantic water is the main source of nutrients along the Eurasian continental slope, shelf-basin exchange processes may gain importance within the Siberian shelf ecosystem. In addition, it remains an open question how changes in sea ice, brine production, and the eastward progression of the Atlantic water influence will affect the shelf-basin interaction along the continental slope (Anderson et al., 2017; Polyakov et al., 2017; Bluhm et al., 2020).
Summary
We investigated the seasonal and interannual variability of stratification on the Laptev Sea shelf as a major Siberian ROFI (Figure 1). Detailed hydrographic surveys were carried out in 2013 and 2014 (Figures 6, 7) under contrasting summer winds (Figure 5), which led to clear contrasts in the freshwater distribution. Neodymium and stable oxygen isotope measurements helped to quantify freshwater contributions from individual rivers. The surveys were bridged by oceanographic moorings in three different shelf locations and highlight the transition period from a stratified to a well-mixed water column (Figures 8–10). The central shelf is generally influenced by the ROFI and remained stratified year-round except for a short 2 month period before the seasonal sea ice retreat in spring (Figure 9). In contrast, a northwestern shelf location outside of the ROFI becomes well-mixed by mid-December until sea ice break-up and therefore highlights the ROFI as a prime regulator for stratification (Figure 8). A 26 year-long record of reanalyzed Mercator ocean parameters was used to fill the upper ocean gap in the mooring measurements, as well as to investigate oceanographic properties under variable winds and changing sea ice conditions (Figure 11). The reanalysis highlights the shift from an often year-round ice-covered shelf before the mid-2000s to one that is largely ice-free in summer since then. The most obvious changes are reflected in increasing upper-ocean temperatures, which directly correspond to increasing solar input during the extended open water season. Less intuitive consequences include the enhanced variability in water column stratification. A near-permanent ice cover largely decouples the ocean from the atmosphere, and under-ice discharge of river water follows dynamic constraints bounded by bathymetry and background flow. Removing the summer ice cover puts the freshwater at the fate of surface winds, which then controls the freshwater distribution and hence the strength and persistence of water column stratification. The transition in the sea ice regime also marked a transition from predominantly year-round stratified conditions toward enhanced mixed layer depth variability and often well-mixed water columns after the mid-2000s (Figure 11).
Data Availability Statement
The datasets generated for this study are available on request to the corresponding author. The time series and shipboard data used in this paper can be downloaded from the Pangaea website at: https://doi.org/10.1594/PANGAEA.908837; https://doi.org/10.1594/PANGAEA.907934; and https://doi.org/10.1594/PANGAEA.907936.
Author Contributions
MJ was responsible for organizing, data analysis, and writing the manuscript. JH, DB, and GL contributed with discussions and data collection at sea. AS prepared and analyzed the ocean reanalysis records. LT contributed with discussions and data records. All authors contributed to the article and approved the submitted version.
Funding
Financial support for the Laptev Sea System project was provided by the German Federal Ministry of Education and Research (Grants BMBF 03F0776 and 03G0833) and the Ministry of Science and Higher Education of the Russian Federation (project RFMEFI61619X0108) to AS and LT.
Conflict of Interest
The authors declare that the research was conducted in the absence of any commercial or financial relationships that could be construed as a potential conflict of interest.
Acknowledgments
We greatly acknowledge the captain and crew of the R/V Viktor Buinitskiy for safe and successful expeditions, Heidi Kassens for coordinating the German-Russian partnership, and Matthias Monsees for mooring work at sea. This paper was further developed during the 4th Pan-Arctic Symposium in October 2017 in Motovun, Croatia, and we greatly appreciate the enthusiasm and motivation of Paul Wassmann to organize this workshop. We greatly appreciate the review comments and constructive criticism from Lee Cooper and Igor Semiletov, and we thank Paul Wassmann for editing this paper.
Footnotes
References
Anderson, L. G., Björk, G., Holby, O., Jutterström, S., Mörth, C. M., O’Regan, M., et al. (2017). Shelf–basin interaction along the East Siberian Sea. Ocean Sci. 13, 349–363. doi: 10.5194/os-13-349-2017
Arrigo, K. R., and van Dijken, G. L. (2015). Continued increases in Arctic Ocean primary production. Prog. Oceanogr. Synth. Arctic Res. 136, 60–70. doi: 10.1016/j.pocean.2015.05.002
Bareiss, J., and Görgen, K. (2005). Spatial and temporal variability of sea ice in the Laptev Sea: analyses and review of satellite passive-microwave data and model results, 1979 to 2002. Glob. Planet. Change Arctic Siber. Shelf Environ. 48, 28–54. doi: 10.1016/j.gloplacha.2004.12.004
Bauch, D., and Cherniavskaia, E. (2018). Water mass classification on a highly variable arctic shelf region: origin of laptev sea water masses and implications for the nutrient budget. J. Geophys. Res. Oceans 123, 1896–1906. doi: 10.1002/2017JC013524
Bauch, D., Dmitrenko, I. A., Wegner, C., Hölemann, J., Kirillov, S. A., Timokhov, L. A., et al. (2009). Exchange of Laptev Sea and Arctic Ocean halocline waters in response to atmospheric forcing. J. Geophys. Res. 114:C05008. doi: 10.1029/2008JC005062
Bauch, D., Hölemann, J. A., Nikulina, A., Wegner, C., Janout, M. A., Timokhov, L. A., et al. (2013). Correlation of river water and local sea-ice melting on the Laptev Sea shelf (Siberian Arctic). J. Geophys. Res. 118, 550–561. doi: 10.1002/jgrc.20076
Belter, H. J., Krumpen, T., Hendricks, S., Hölemann, J. A., Janout, M. A., Ricker, R., et al. (2020). Satellite-based sea ice thickness changes in the Laptev Sea from 2002 to 2017: Comparison to mooring observations. Sea Ice/Sea Ice [preprint]. doi: 10.5194/tc-2019-307
Bluhm, B. A., Janout, M. A., Danielson, S., Ellingsen, I., Gavrilo, M., Grebmeier, J. M., et al. (2020). The pan-Arctic continental slope: a narrow band of strong physical gradients affecting pelagic and benthic ecosystems. Front. Mar. Sci.
Boyer, T. P., Baranova, O. K., Coleman, C., Garcia, H. E., Grodsky, S. A., Locarnini, R. A., et al. (2019). “World ocean database 2018,” in NOAA Atlas NESDIS 87, ed. A. V. Mishonov (Maryland: Silver Spring).
Carmack, E., Winsor, P., and Williams, W. (2015). The contiguous panarctic riverine coastal domain: a unifying concept. Prog. Oceanogr. 139, 13–23. doi: 10.1016/j.pocean.2015.07.014
Carmack, E. C., Macdonald, R. W., and Jasper, S. (2004). Phytoplankton productivity on the Canadian shelf of the Beaufort Sea. Mar. Ecol. Prog. Ser. 277, 37–50. doi: 10.3354/meps277037
Carmack, E. C., Yamamoto-Kawai, M., Haine, T. W. N., Bacon, S., Bluhm, B. A., Lique, C., et al. (2016). Freshwater and its role in the arctic marine system: sources, disposition, storage, export, and physical and biogeochemical consequences in the Arctic and global oceans. J. Geophys. Res. Biogeosci. 121, 675–717. doi: 10.1002/2015JG003140
Churun, V. N., and Timokhov, L. A. (1995). Cold bottom water in the southern Laptev Sea.-Rep. Polar Res. 176, 107–113.
Dee, D. P., Uppala, S. M., Simmons, A. J., Berrisford, P., Poli, P., Kobayashi, S., et al. (2011). The ERA-Interim reanalysis: configuration and performance of the data assimilation system. Q. J. R. Meteorol. Soc. 137, 553–597. doi: 10.1002/qj.828
Demidov, A. B., Gagarin, V. I., Vorobieva, O. V., Makkaveev, P. N., Artemiev, V. A., Khrapko, A. N., et al. (2018). Spatial and vertical variability of primary production in the Kara Sea in July and August 2016: the influence of the river plume and subsurface chlorophyll maxima. Polar Biol. 41, 563–578. doi: 10.1007/s00300-017-2217-x
Demidov, A. B., Mosharov, S. A., and Makkaveev, P. N. (2014). Patterns of the Kara Sea primary production in autumn: biotic and abiotic forcing of subsurface layer. J. Marine Syst. 132, 130–149. doi: 10.1016/j.jmarsys.2014.01.014
Demidov, A. B., Sheberstov, S. V., and Gagarin, V. I. (2020). Interannual variability of primary production in the Laptev Sea. Oceanology 60, 50–61. doi: 10.1134/S0001437020010075
Dmitrenko, I., Kirillov, S., Eicken, H., and Markova, N. (2005). Wind-driven summer surface hydrography of the eastern Siberian shelf. Geophys. Res. Lett. 32:L14613. doi: 10.1029/2005GL023022
Dmitrenko, I. A., Kirillov, S. A., Bloshkina, E., and Lenn, Y. D. (2012). Tide-induced vertical mixing in the Laptev Sea coastal polynya. J. Geophys. Res. 117:C00G14. doi: 10.1029/2011JC006966
Ezraty, R., Girard-Ardhuin, F., Piollé, J. F., Kaleschke, L., and Heygster, G. (2007). Arctic and Antarctic sea ice Concentration and Arctic Sea ice drift Estimated From Special Sensor Microwave Data, Département d’Océanographie Physique et Spatiale, IFREMER, Brest, France and University of Bremen, Germany, 21 Edn. Available online at: ftp://ftp.ifremer.fr/ifremer/cersat/products/gridded/psi-drift/documentation/ssmi.pdf.
Fernandez, E., and Lellouche, J. M. (2018). Product User Manual for the Global Ocean Physical Reanalysis product GLOBAL_REANALYSIS_PHY_001_030. Available online at: http://resources.marine.copernicus.eu/documents/PUM/CMEMS-GLO-PUM-001-030.pdf (accessed January 12, 2020).
Fofonova, V., Androsov, A., Danilov, S., Janout, M., Sofina, E., and Wiltshire, K. (2014). Semidiurnal tides in the Laptev Sea shelf zone in the summer season. Continental Shelf Res. 73, 119–132. doi: 10.1016/j.csr.2013.11.010
Heim, B., Abramova, E., Doerffer, R., Günther, F., Hölemann, J., Kraberg, A., et al. (2014). Ocean colour remote sensing in the southern Laptev Sea: evaluation and applications. Biogeosciences 11, 4191–4210. doi: 10.5194/bg-11-4191-2014
Hölemann, J. A., Kirillov, S., Klagge, T., Novikhin, A., Kassens, H., and Timokhov, L. (2011). Near-bottom water warming in the Laptev Sea in response to atmospheric and sea-ice conditions in 2007. Polar Res. 30:6425. doi: 10.3402/polar.v30i0.6425
Holmes, R. M., Shiklomanov, A. I., Suslova, A., Tretiakov, M., McClelland, J. W., and Spencer, R. G. M. (2019). [The Arctic] River discharge [in “State of the Climate in 2018”]. Bull. Amer. Meteor. Soc. 100, S161–S163. doi: 10.1175/2019BAMSStateoftheClimate.1
Itkin, P., and Krumpen, T. (2017). Winter sea ice export from the Laptev Sea preconditions the local summer sea ice cover and fast ice decay. Cryosphere 11, 2383–2391. doi: 10.5194/tc-11-2383-2017
Janout, M., Hölemann, J., Juhls, B., Krumpen, T., Rabe, B., Bauch, D., et al. (2016a). Episodic warming of near-bottom waters under the Arctic sea ice on the central Laptev Sea shelf. Geophys. Res. Lett. 43, 264–272. doi: 10.1002/2015GL066565
Janout, M. A., Hölemann, J., Waite, A. M., Krumpen, T., von Appen, W. J., and Martynov, F. (2016b). Sea-ice retreat controls timing of summer plankton blooms in the Eastern Arctic Ocean. Geophys. Res. Lett. 43:501. doi: 10.1002/2016GL071232
Janout, M. A., Aksenov, Y., Hölemann, J. A., Rabe, B., Schauer, U., Polyakov, I. V., et al. (2015). Kara Sea freshwater transport through Vilkitsky Strait: variability, forcing, and further pathways toward the western Arctic Ocean from a model and observations. J. Geophys. Res. Oceans 120, 4925–4944. doi: 10.1002/2014JC010635
Janout, M. A., Hölemann, J., Timokhov, L., Gutjahr, O., and Heinemann, G. (2017). Circulation in the northwest Laptev Sea in the eastern Arctic Ocean: crossroads between siberian river water, Atlantic water and polynya-formed dense water. J. Geophys. Res. Oceans 122, 6630–6647. doi: 10.1002/2017JC013159
Janout, M. A., and Lenn, Y. D. (2014). Semidiurnal tides on the Laptev Sea shelf with implications for shear and vertical mixing. J. Phys. Oceanogr. 44, 202–219. doi: 10.1175/JPO-D-12-0240.1
Janout, M., Hölemann, J. A., Timokhov, L., and Kassens, H. (2019). Moored measurements of current, temperature and salinity on the Laptev Sea shelf in 2013-2014. PANGAEA doi: 10.1594/PANGAEA.908837
Juhls, B., Stedmon, C. A., Morgenstern, A., Meyer, H., Hölemann, J., Heim, B., et al. (2020). Identifying drivers of seasonality in Lena river biogeochemistry and dissolved organic matter fluxes. Front. Environ. Sci. 8:53. doi: 10.3389/fenvs.2020.00053
Kasper, J. L., and Weingartner, T. J. (2012). Modeling winter circulation under landfast ice: the interaction of winds with landfast ice. J. Geophys. Res. 117:C04006. doi: 10.1029/2011JC007649
Krumpen, T., Birrien, F., Kauker, F., Rackow, T., von Albedyll, L., and Angelopoulos, M. (2020). The MOSAiC ice floe: sediment-laden survivor from the Siberian shelf. Cryosph. 14, 2173–2187. doi: 10.5194/tc-14-2173-2020
Krumpen, T., Janout, M., Hodges, K. I., Gerdes, R., Girard-Ardhuin, F., Hölemann, J. A., et al. (2013). Variability and trends in Laptev Sea ice outflow between 1992–2011. Cryosph. 7, 349–363. doi: 10.5194/tc-7-349-2013
Laukert, G., Frank, M., Bauch, D., Hathorne, E. C., Gutjahr, M., Janout, M., et al. (2017). Transport and transformation of riverine neodymium isotope and rare earth element signatures in high latitude estuaries: a case study from the Laptev Sea. Earth Planet. Sci. Lett. 477, 205–217. doi: 10.1016/j.epsl.2017.08.010
Morison, J., Kwok, R., Peralta-Ferriz, C., Alkire, M., Rigor, I., Andersen, R., et al. (2012). Changing Arctic Ocean freshwater pathways. Nature 481, 66–70. doi: 10.1038/nature10705
Mosharov, S. A. (2010). Distribution of the primary production and chlorophyll a in the Kara Sea in September of 2007. Oceanology 50, 884–892. doi: 10.1134/S0001437010060081
Nitishinsky, M., Anderson, L. G., and Hölemann, J. A. (2007). Inorganic carbon and nutrient fluxes on the Arctic Shelf. Contin. Shelf Res. 27, 1584–1599. doi: 10.1016/j.csr.2007.01.019
Pawlowicz, R. (2020). M_Map: A Mapping Package for MATLAB, Version 1.4m. Available online at: www.eoas.ubc.ca/∼rich/map.html (accessed February 10, 2020).
Pawlowicz, R., Beardsley, B., and Lentz, S. (2002). Classical tidal harmonic analysis including error estimates in MATLAB using T_TIDE. Comput. Geosci. 28, 929–937. doi: 10.1016/S0098-3004(02)00013-4
Pivovarov, S., Hölemann, J. A., Kassens, H., Piepenburg, D., and Schmid, M. K. (2005). “Laptev and East Siberian Seas,” in The Sea, Vol. 14, eds A. R. Robinson and K. H. Brink (Cambridge: Harvard University Press), 1111–1137.
Polyakov, I. V., Pnyushkov, A. V., Alkire, M. B., Ashik, I. M., Baumann, T. M., and Carmack, E. C. (2017). Greater role for Atlantic inflows on sea-ice loss in the Eurasian Basin of the Arctic Ocean. Science 356, 285–291. doi: 10.1126/science.aai8204
Polyakov, I. V., Rippeth, T. P., Fer, I., Alkire, M. B., Baumann, T. M., and Carmack, E. C. (2020a). Weakening of cold halocline layer exposes sea ice to oceanic heat in the eastern Arctic Ocean. J. Clim. 33, 8107–8123. doi: 10.1175/JCLI-D-19-0976.1
Polyakov, I. V., Alkire, M. B., Bluhm, B. A., Brown, K. A., Carmack, E. C., Chierici, M., et al. (2020b). Borealization of the Arctic Ocean in response to anomalous advection from sub-arctic Seas. Front. Mar. Sci. 7:491. doi: 10.3389/fmars.2020.00491
Preußer, A., Ohshima, K. I., Iwamoto, K., Willmes, S., and Heinemann, G. (2019). Retrieval of wintertime sea ice production in arctic polynyas using thermal infrared and passive microwave remote sensing data. J. Geophys. Res. 124, 5503–5528. doi: 10.1029/2019JC014976
Proshutinsky, A., Krishfield, R., Timmermans, M. L., Toole, J., Carmack, E., McLaughlin, F., et al. (2009). Beaufort Gyre freshwater reservoir: state and variability from observations. J. Geophys. Res. 114:C00A10. doi: 10.1029/2008JC005104
Proshutinsky, A. Y., and Johnson, M. A. (1997). Two circulation regimes of the wind-driven Arctic Ocean. J. Geophys. Res. 102, 12493–12514. doi: 10.1029/97JC00738
Randelhoff, A., Holding, J., Janout, M., Sejr, M. K., Babin, M., Tremblay, J. É, et al. (2020). Pan-arctic ocean primary production constrained by turbulent nitrate fluxes. Front. Mar. Sci. 7:150. doi: 10.3389/fmars.2020.00150
Sakshaug, E. (2004). “Primary and secondary production in the Arctic seas,” in The Organic Carbon Cycle in the Arctic Ocean, eds R. Stein and R. W. Macdonald (New York, NY: Springer), 57–81. doi: 10.1007/978-3-642-18912-8_3
Selyuzhenok, V., Krumpen, T., Mahoney, A., Janout, M., and Gerdes, R. (2015). Seasonal and interannual variability of fast ice extent in the southeastern Laptev Sea between 1999 and 2013. J. Geophys. Res. Oceans 120, 7791–7806. doi: 10.1002/2015JC011135
Semiletov, I. P., Savelieva, N. I., Weller, G. E., Pipko, I. I., Pugach, S. P., Gukov, A. Y., et al. (2000). “The dispersion of siberian river flows into coastal waters: meteorological, hydrological and hydrochemical aspects,” in The Freshwater Budget of the Arctic Ocean, NATO Science Series, eds E. L. Lewis, E. P. Jones, P. Lemke, T. D. Prowse, and P. Wadhams (Netherlands: Springer), 323–366. doi: 10.1007/978-94-011-4132-1_15
Shakhova, N., Semiletov, I., Leifer, I., Sergienko, V., Salyuk, A., Kosmach, D., et al. (2014). Ebullition and storm-induced methane release from the East Siberian Arctic Shelf. Nat. Geosci. 7, 64–70. doi: 10.1038/ngeo2007
Shiklomanov, A. I., Holmes, R. M., McClelland, J. W., Tank, S. E., and Spencer, R. G. M. (2018). Arctic Great Rivers Observatory. Discharge Dataset, Version 20200213. Avaliable at: https://arcticgreatrivers.org/data/.
Shpaikher, O., Fedorova, Z. P., and Yankina, Z. S. (1972). Interannual variability of hydrological regime of the Siberian shelf seas in response to atmospheric processes (in Russian). Proc. AARI 306, 5–17.
Slagstad, D., Wassmann, P. F. J., and Ellingsen, I. (2015). Physical constrains and productivity in the future Arctic Ocean. Front. Mar. Sci. 2:85. doi: 10.3389/fmars.2015.00085
Soppa, M. A., Pefanis, V., Hellmann, S., Losa, S. N., Hölemann, J., Martynov, F., et al. (2019). Assessing the influence of water constituents on the radiative heating of laptev sea shelf waters. Front. Mar. Sci. 6:221. doi: 10.3389/fmars.2019.00221
Sorokin, Y. I., and Sorokin, P. Y. (1996). Plankton and primary production in the lena river estuary and in the south-eastern laptev Sea. Estuar. Coas. Shelf Sci. 43, 399–418. doi: 10.1006/ecss.1996.0078
Thibodeau, B., Bauch, D., and Voss, M. (2017). Nitrogen dynamic in Eurasian coastal Arctic ecosystem: Insight from nitrogen isotope. Glob. Biogeochem. CY 31, 836–849. doi: 10.1002/2016gb005593
Timmermans, M. L. (2015). The impact of stored solar heat on Arctic sea ice growth. Geophys. Res. Lett. 42, 6399–6406. doi: 10.1002/2015GL064541
Timokhov, L. A. (1994). Regional characteristics of the Laptev and the East Siberian Seas: climate, topography, ice phases, thermohaline regime, circulation. Ber. Polarforsch. 144, 15–31.
Whitefield, J., Winsor, P., McClelland, J., and Menemenlis, D. (2015). A new river discharge and river temperature climatology data set for the pan-Arctic region. Ocean Modelling 88, 1–15. doi: 10.1016/j.ocemod.2014.12.012
Keywords: Arctic Ocean, Siberian shelves, Laptev Sea, freshwater, stratification, sea ice
Citation: Janout MA, Hölemann J, Laukert G, Smirnov A, Krumpen T, Bauch D and Timokhov L (2020) On the Variability of Stratification in the Freshwater-Influenced Laptev Sea Region. Front. Mar. Sci. 7:543489. doi: 10.3389/fmars.2020.543489
Received: 17 March 2020; Accepted: 18 August 2020;
Published: 15 September 2020.
Edited by:
Paul F. J. Wassmann, Arctic University of Norway, NorwayReviewed by:
Lee W. Cooper, University of Maryland Center for Environmental Science (UMCES), United StatesIgor Semiletov, V. I. Il’ichev Pacific Oceanological Institute (RAS), Russia
Copyright © 2020 Janout, Hölemann, Laukert, Smirnov, Krumpen, Bauch and Timokhov. This is an open-access article distributed under the terms of the Creative Commons Attribution License (CC BY). The use, distribution or reproduction in other forums is permitted, provided the original author(s) and the copyright owner(s) are credited and that the original publication in this journal is cited, in accordance with accepted academic practice. No use, distribution or reproduction is permitted which does not comply with these terms.
*Correspondence: Markus A. Janout, markus.janout@awi.de