Article

Reproducibility of Gaseous Phase Area on Journal Bearing Utilizing Multi-Phase Flow CFD Analysis under Flooded and Starved Lubrication Conditions

1
Department of Mechanical Engineering, Tokai University, Hiratsuka-shi, Kanagawa 259-1292, Japan
2
Mechanical Elements, Vibration and Acoustics Section, Fundamental Technologies Research Department, Technologies, R&D Division, Ebara Corporation, Honfujisawa, Fujisawa-shi, Kanagawa 251-8502, Japan
*
Author to whom correspondence should be addressed.
Lubricants 2019, 7(9), 74; https://doi.org/10.3390/lubricants7090074
Submission received: 25 June 2019 / Revised: 14 August 2019 / Accepted: 19 August 2019 / Published: 27 August 2019
(This article belongs to the Special Issue Fluid-Film Lubrication II)

Abstract

:
It is important to predict the gaseous phase area of journal bearing. However, a detailed calculation method for such gaseous phase areas has not yet been proposed. In this study, the gaseous-phase areas in small bore journal bearings under flooded and starved lubrication conditions are analyzed in terms of the computational fluid dynamics (CFD) of two-phase flow while using a volume of fluid (VOF) method. Furthermore, the influence of surface tension and vapor pressure conditions were investigated, and the analytical and experimental results were compared. The analytical results of VOF for vapor pressure and surface tension were observed to be consistent with the experimental observations under both flooded and starved lubrication conditions. Furthermore, under starved lubrication condition, the analytical results agree well with the observed results for the interface of the oil film and cavitation upon the rupture of the oil film. While using these results, CFD analysis of the two-phase flow of the VOF can be conducted in terms of vapor pressure and surface tension to estimate the gaseous-phase areas of journal bearings under flooded and starved lubrication conditions.

1. Introduction

Many researchers have studied the cavitation area prediction of hydrodynamic journal bearing, because the characteristics of the bearings are strongly affected by the gaseous-phase areas. For example, it is known that the gaseous-phase areas of journal bearings expand under starved lubrication conditions; therefore, the stability characteristics under starved lubrication increases, whereas the friction torque decreases. Hashimoto and Ochiai studied the stability characteristics under starved lubrication both theoretically and experimentally [1]. Furthermore, Ochiai has reported that the gaseous phase has a cooling effect upon the oil film under the starved lubrication condition [2]. The characteristics of temperature and friction under starved lubrication have been experimentally studied; however, these observations have not been theoretically investigated [3], because the calculation method for the detailed gaseous-phase area has not yet been proposed. In addition, in actual bearing systems, there are cases where lubrication oil is not able to supply sufficiently and the kind of starved lubrication phenomenon occurs. In the case of strong starved conditions, there is also high possibility to be serious erosion damage on the bearing surfaces. Therefore, it is important to predict the gaseous area.
Generally, the Reynolds equation is used to analyze the journal bearings, and the half-Sommerfeld’s condition or the Swift-Stieber condition have been applied as the simplest method for determining the cavitation areas for the Reynolds equation [4,5]. However, these methods ignore the oil films of diverging clearance, because the negative-pressure area is assumed to be the cavitation area. Therefore, the flow-rate conservation does not hold. Coyne and Elrod’s condition is additionally used as a more advanced method; Coyne and Elrod proposed a calculation model that assumes a two phase flow of oil-film rupture to calculate the surface tension between the oil film and cavitation [6,7]. The condition is closer to practical bearings than that of the half-Sommerfeld or Swift-Stieber conditions; however, it is impossible to estimate the cavitation area of the entire journal bearing. Therefore, several researchers have proposed boundary condition models that consider the cavitation. For example, Ikeuchi and Mori have analyzed the oil film cavitation areas while using the modified Reynolds equation [8,9]. This equation is derived by considering the two-phase flow as an averaged single-phase flow of oil and gas. However, this theoretical model depicts difficulty in converging in the case of a high eccentricity ratio and a starved lubrication condition. Furthermore, Ikeuchi and Mori did not confirm the agreement of their analytical results with the actual cavitation area. However, Boncompine et al. and Hatakenaka et al. have proposed an analytical method by assuming a finger-type cavitation [10,11]. However, bearing designers are not able to estimate the variation of the gaseous-phase area when the amount of oil lubricant is changed. Furthermore, some journal bearings contain an oil filler port, which modifies the bearing characteristics [12,13]. However, the internal flow of the oil-filler port and the bearing clearance cannot be solved while using the Reynolds equation. Therefore, a different approach is required to analyze the journal bearing while considering the internal flow of an oil-filler port.
Recently, two phase flow computational fluid dynamics (CFD) analysis models that consider vapor pressure and interfacial transport equations have been proposed [14]. Among other methodologies, the volume of fluid (VOF) method offers good convergence and allows bearings to be evaluated in a relatively short time [15]. Furthermore, the VOF method can be applied to a journal bearing environment, because it can analyze the flow of slag. To date, analysis utilizing VOF has been utilized to investigate the characteristics of journal bearings while using the reported analytical results. For example, Zhai et al. and Dhande et al. have analyzed the cavitation area of a journal bearing using the VOF method by considering the vapor pressure. Additionally, they have investigated the influence of rotational speed upon the cavitation area [16,17]. However, the validity of the calculation method that has been used in this study has not been verified, because the analytical cavitation area has not been compared with that observed in the experiment. On the other hand, Egbers et al. analyzed the journal bearings while using the analytical method that depicted a combination of the Reynolds equation and CFD analysis by considering the two-phase flows [18]. Furthermore, the cavitation area in the oil-filler port and the opposite load side that was obtained by the analytical method in this study have been compared with that obtained in the experimental results. However, the analytical results cannot precisely produce the cavitation scale and shape, because the influence of the surface tension has not been calculated.
In this situation, the current study visualized the gaseous-phase area on both the bearing surface and the oil-filler port in a small-bore journal bearing under the flooded and starved lubrication conditions. The journal bearing is further analyzed while using a CFD model that is based on the volume of oil, eccentricity ratio, and attitude angle that were obtained from the experiment. Further, the impacts of VOF, surface tension, and vapor pressure of the setting condition were studied, and the analytical and experimental results were compared. Finally, authors considered the influence of surface tension on journal bearing from the Weber number, We.

2. Experiment

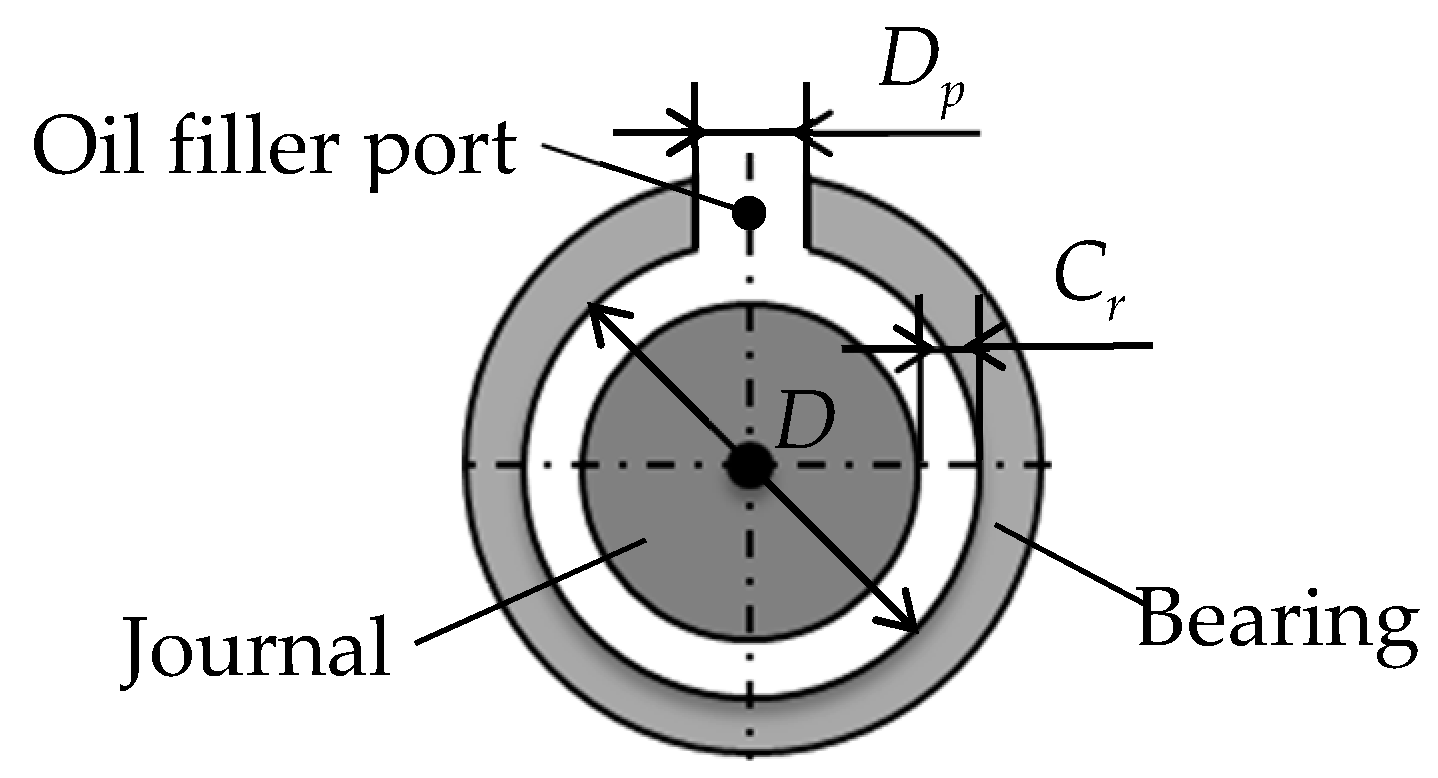
Figure 1 depicts the geometry of the test journal bearing that was used in the experiments. Table 1 lists its major dimensions. The upper part of the test bearing is provided with an oil filler port, allowing for the lubricating oil to flow into the bearing clearance. The diameter of the bearing (D), clearance of the bearing (Cr), bearing width (L), width diameter ratio (L/D), and the diameter of the oil-filler port (Dp) are 25.0 mm, 125 μm, 14.5 mm, 0.58, and 8.2 mm, respectively. The test bearing is manufactured while using transparent acryl, which allows for us to observe the formation of the oil film and the generation of the gas.
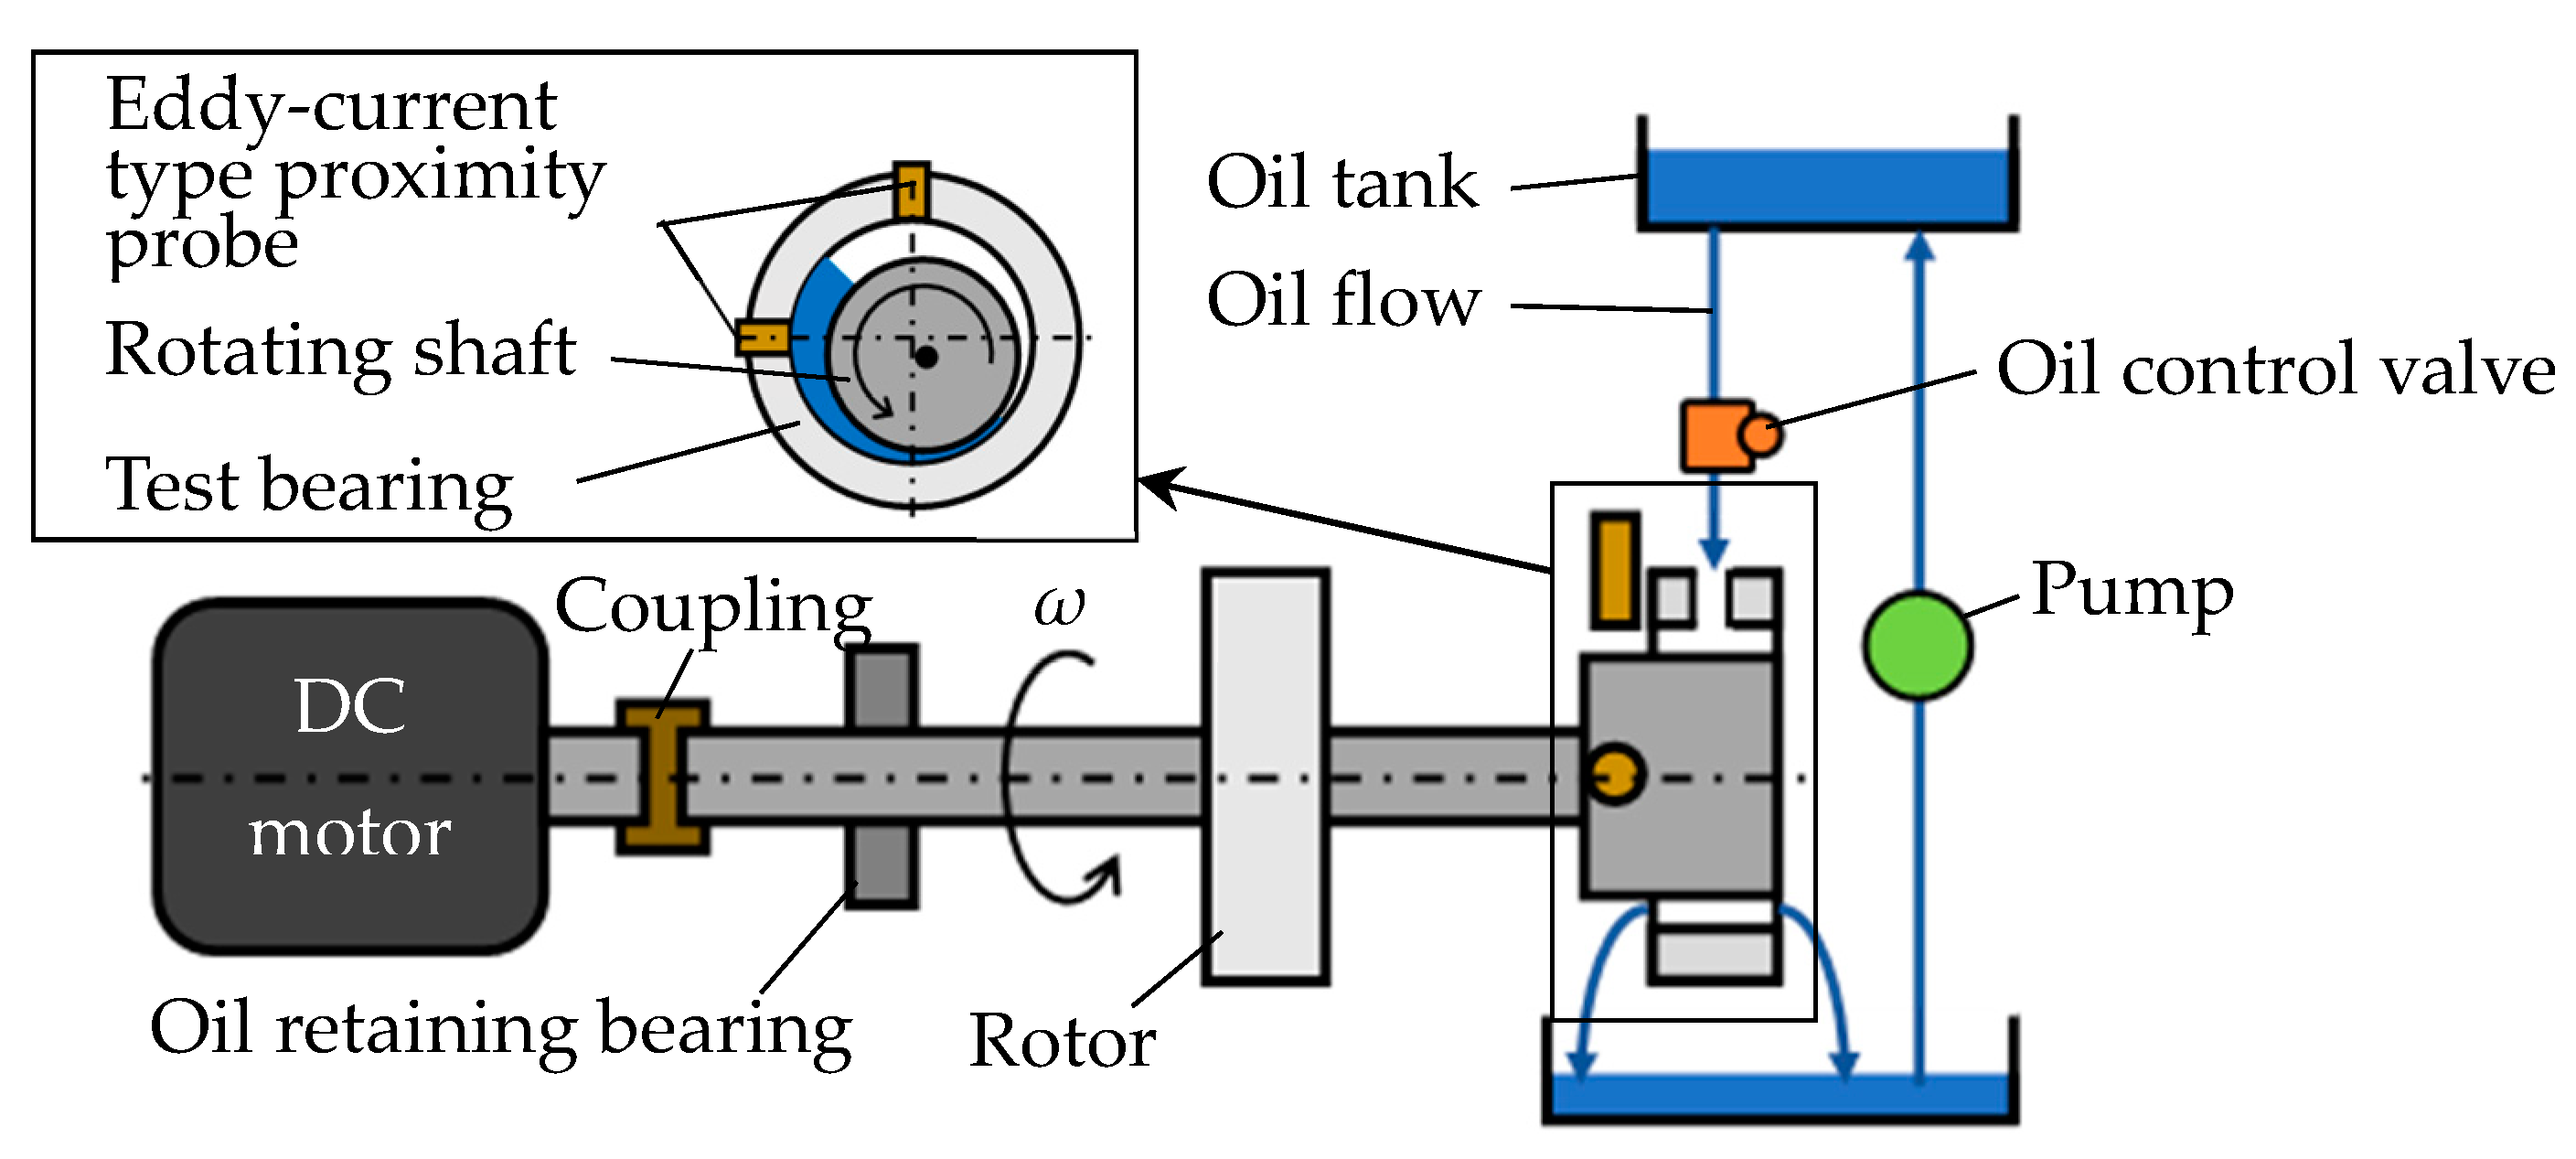
Figure 2 depicts the schematic of the entire experimental test rig. This rig has a rotor installed at its center and a revolving shaft that is supported by two bearings on its left and righthand sides. The test bearing for visualizations is installed on the right-hand side. The shaft is driven while using a DC motor that is capable of controlling the rotational speed continuously up to a speed of 10,000 rpm. Eddy current type proximity probes are placed in both the horizontal and the vertical direction of the bearing, which allows the journal position to be measured. An oil tank is placed on the top of the bearing, the lubricating oil is supplied through a control valve, and the oil that is leaking from the side end of the bearing is returned to the oil tank while using the pump. The viscosity grade of the lubricant oil is VG22 and the temperature of the supplied oil is fixed to 40 °C. The application of a blue lubricant oil using xylene makes it possible to visualize the region where the gas is being generated.
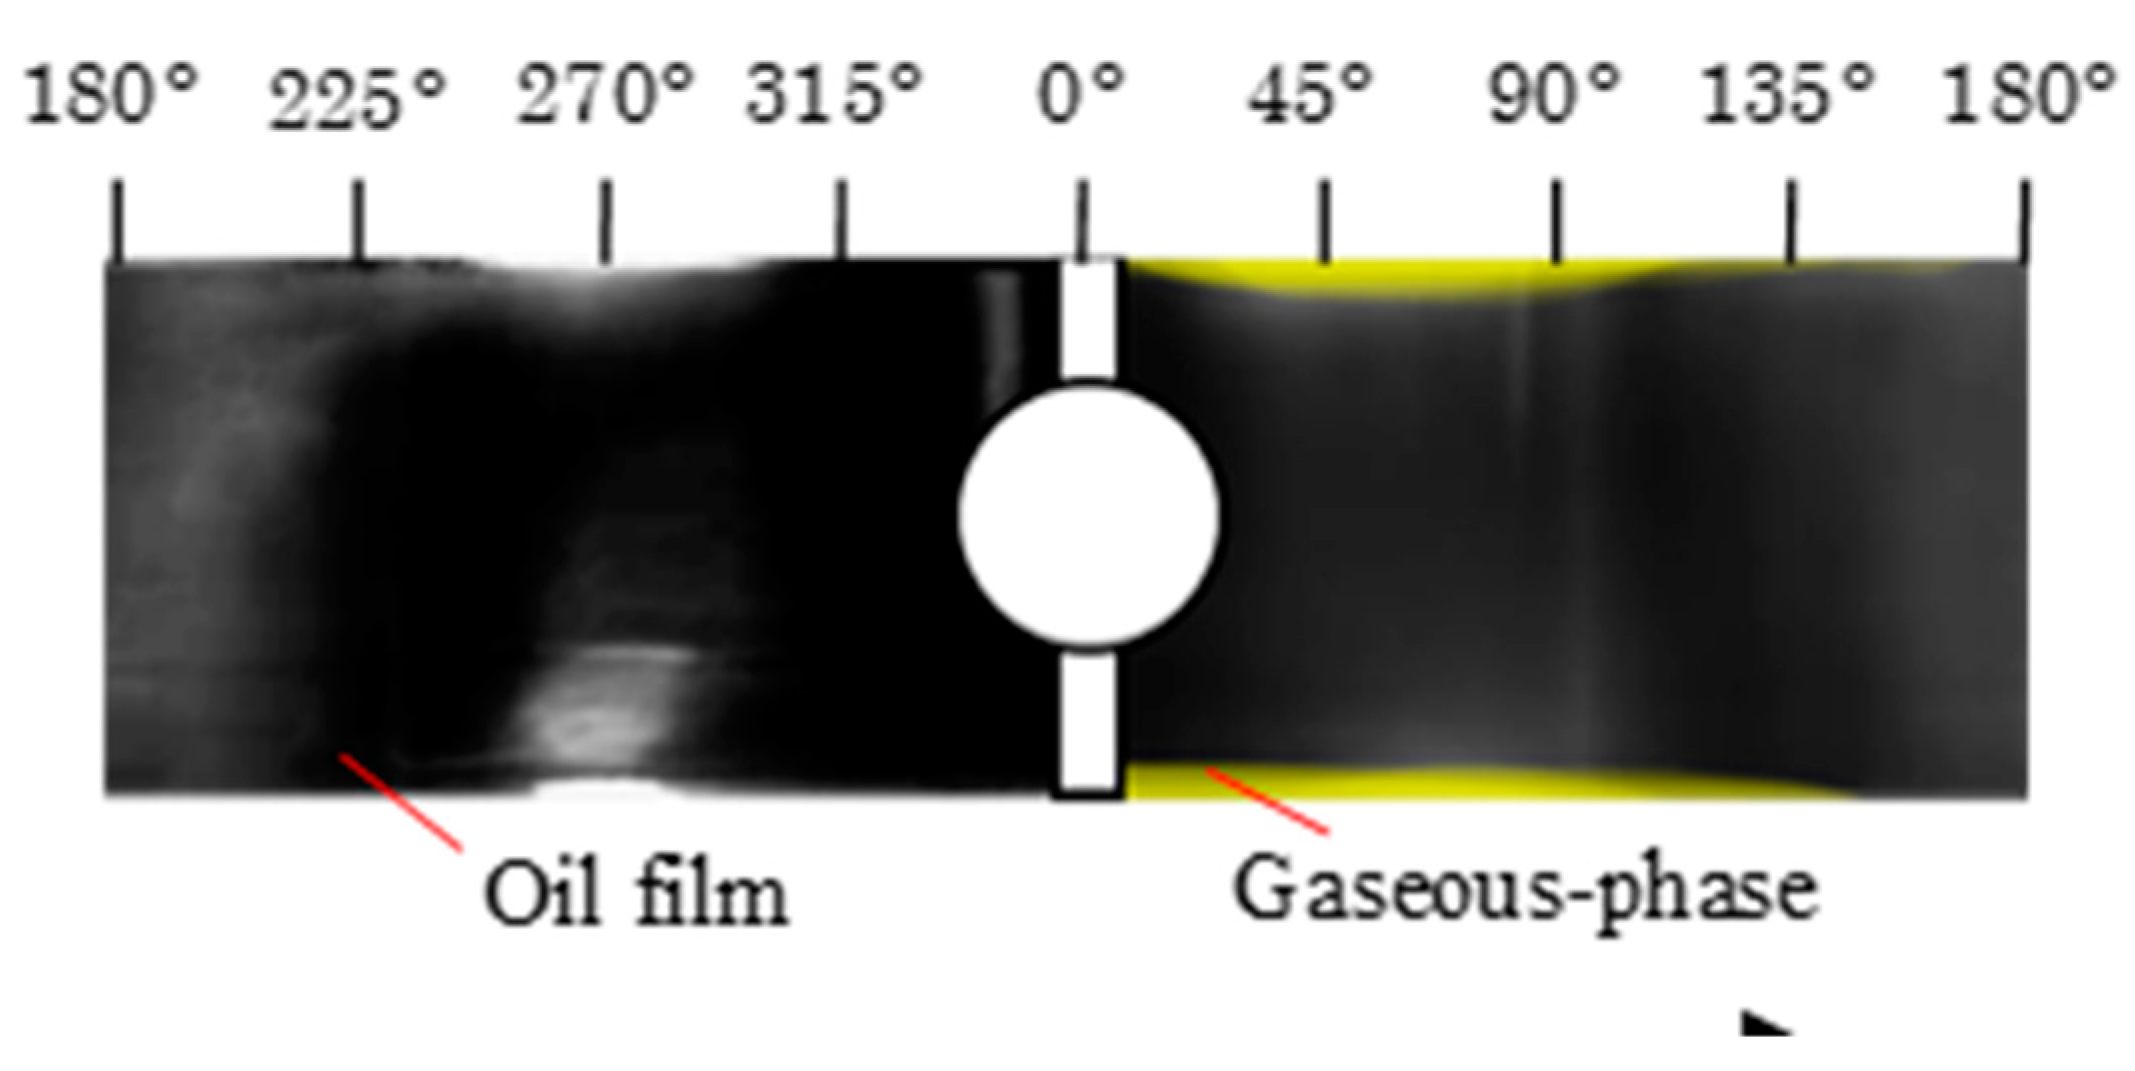
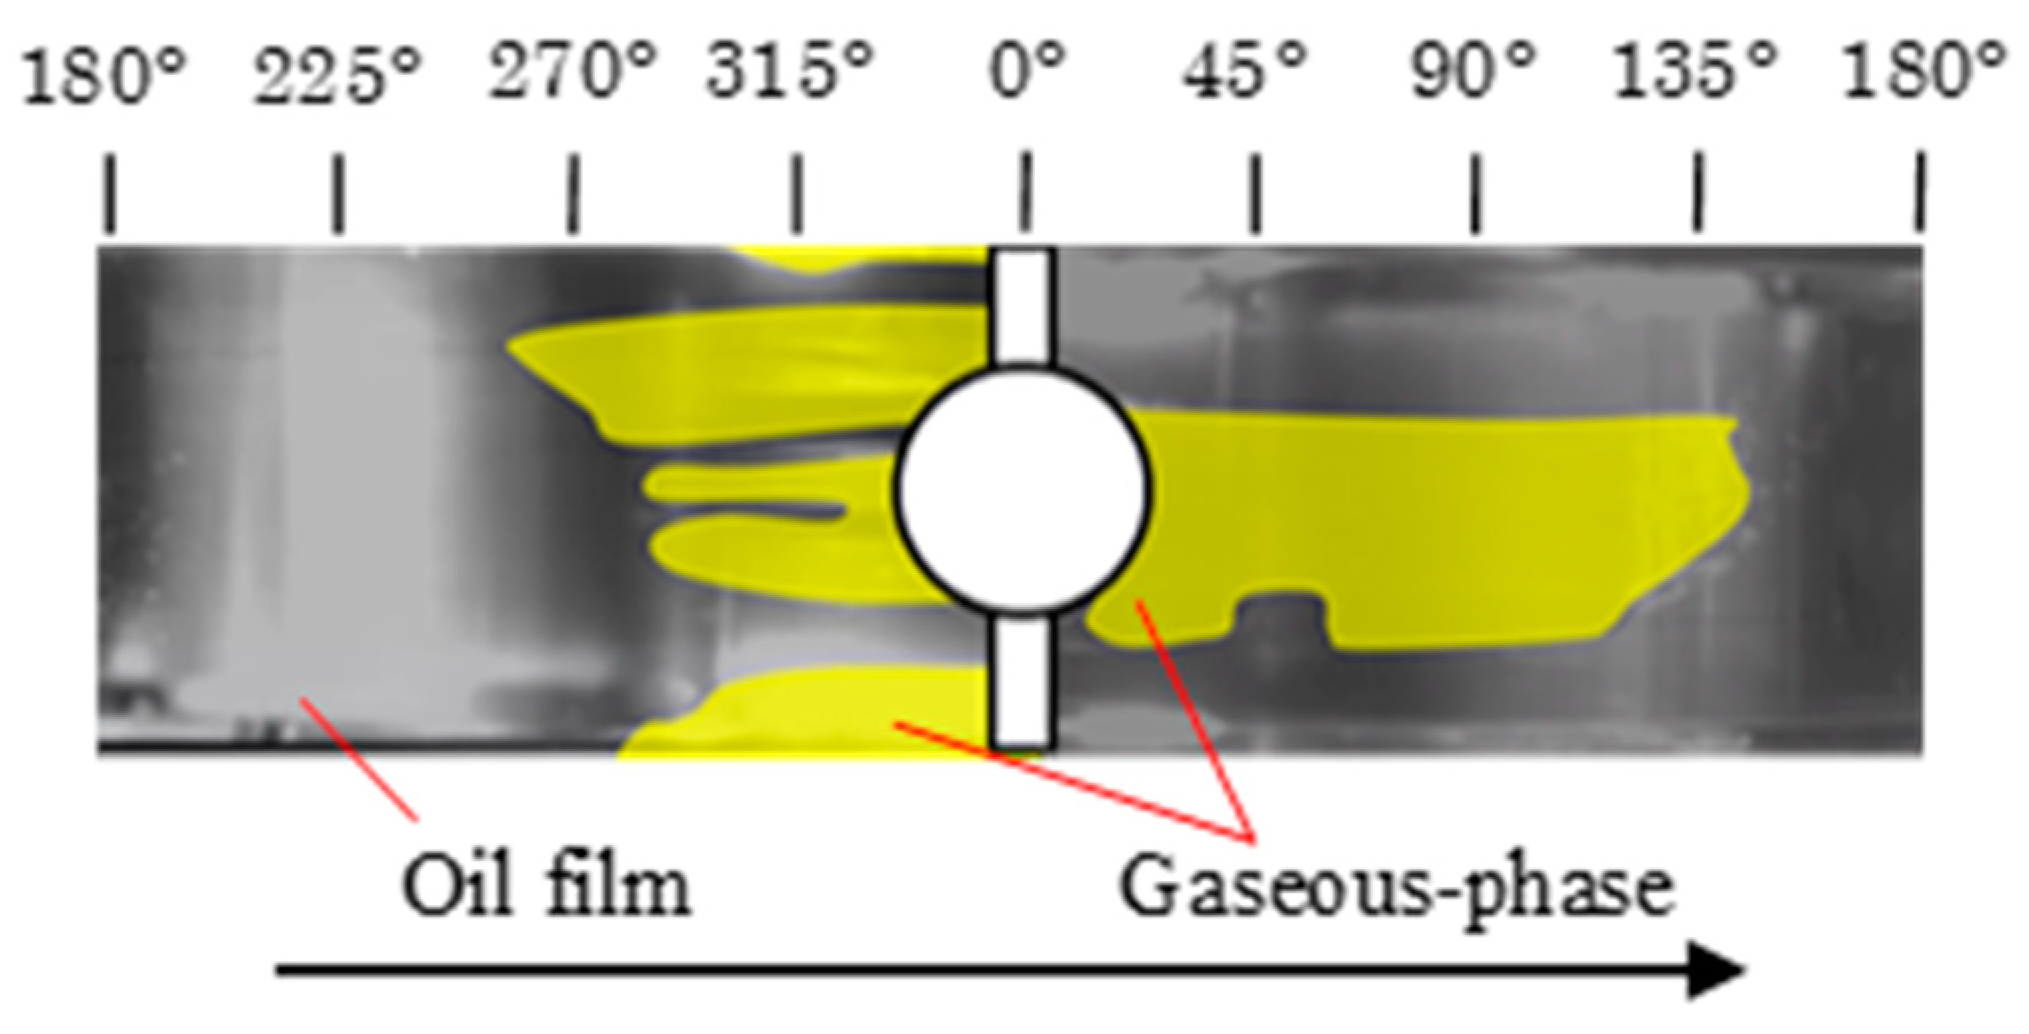
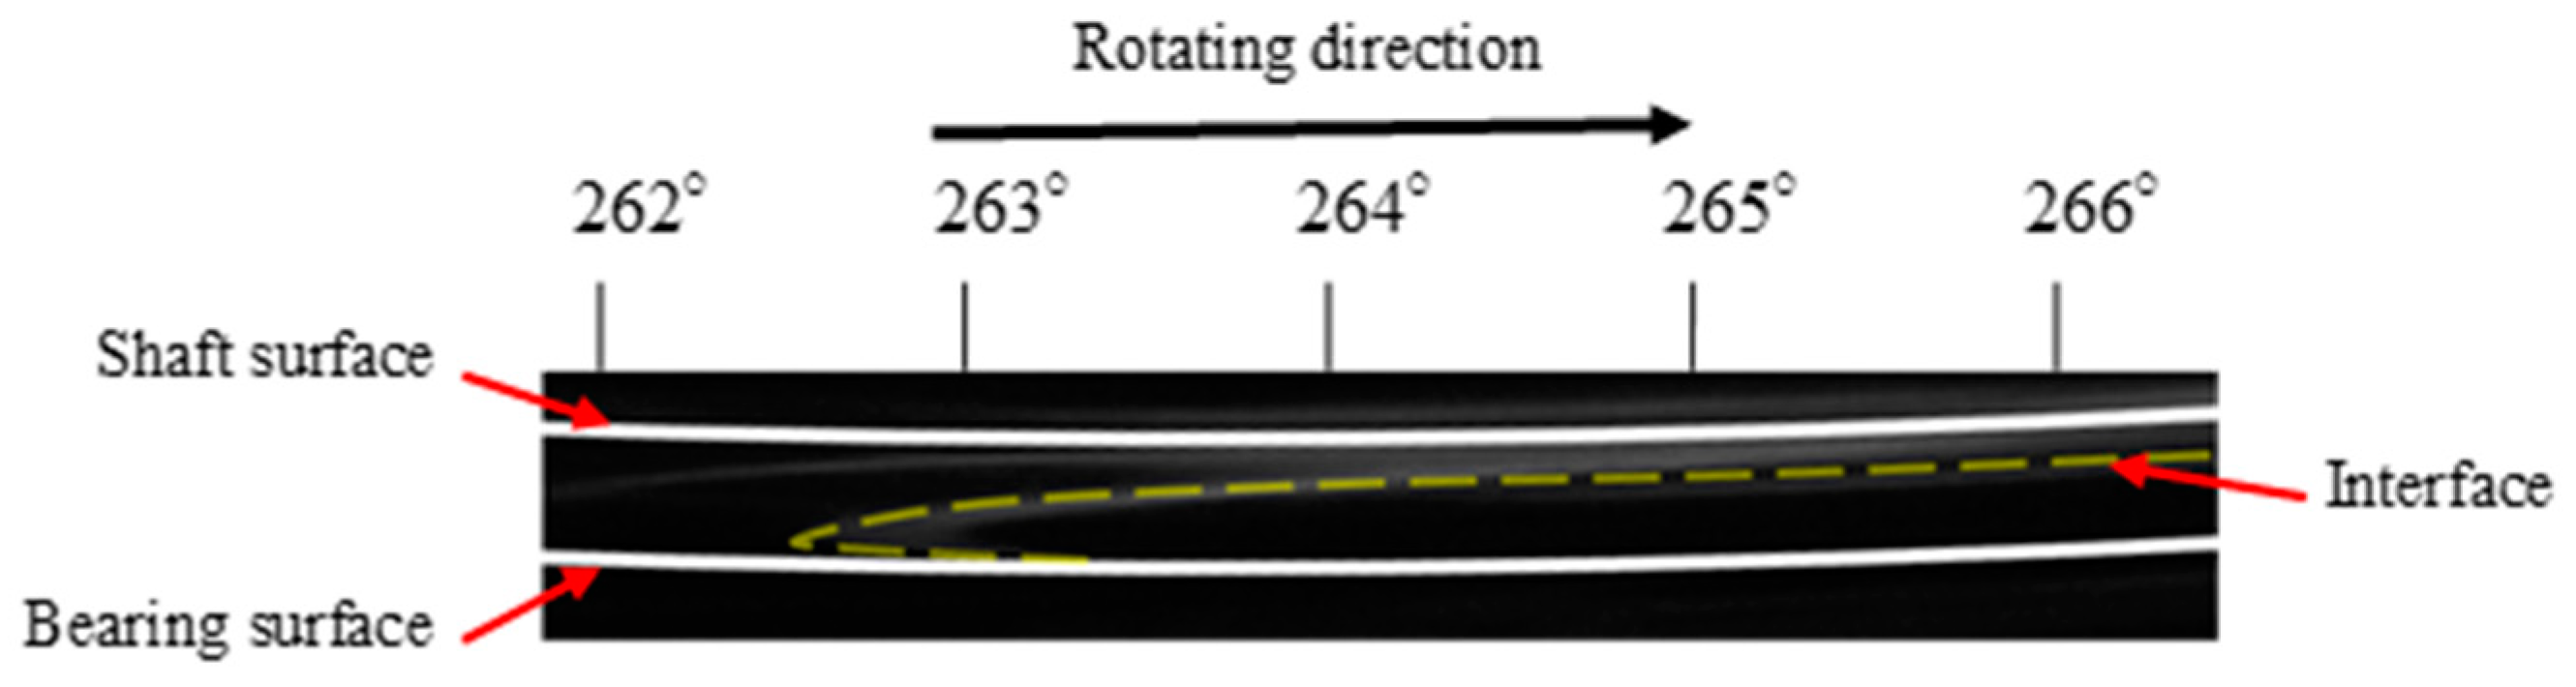
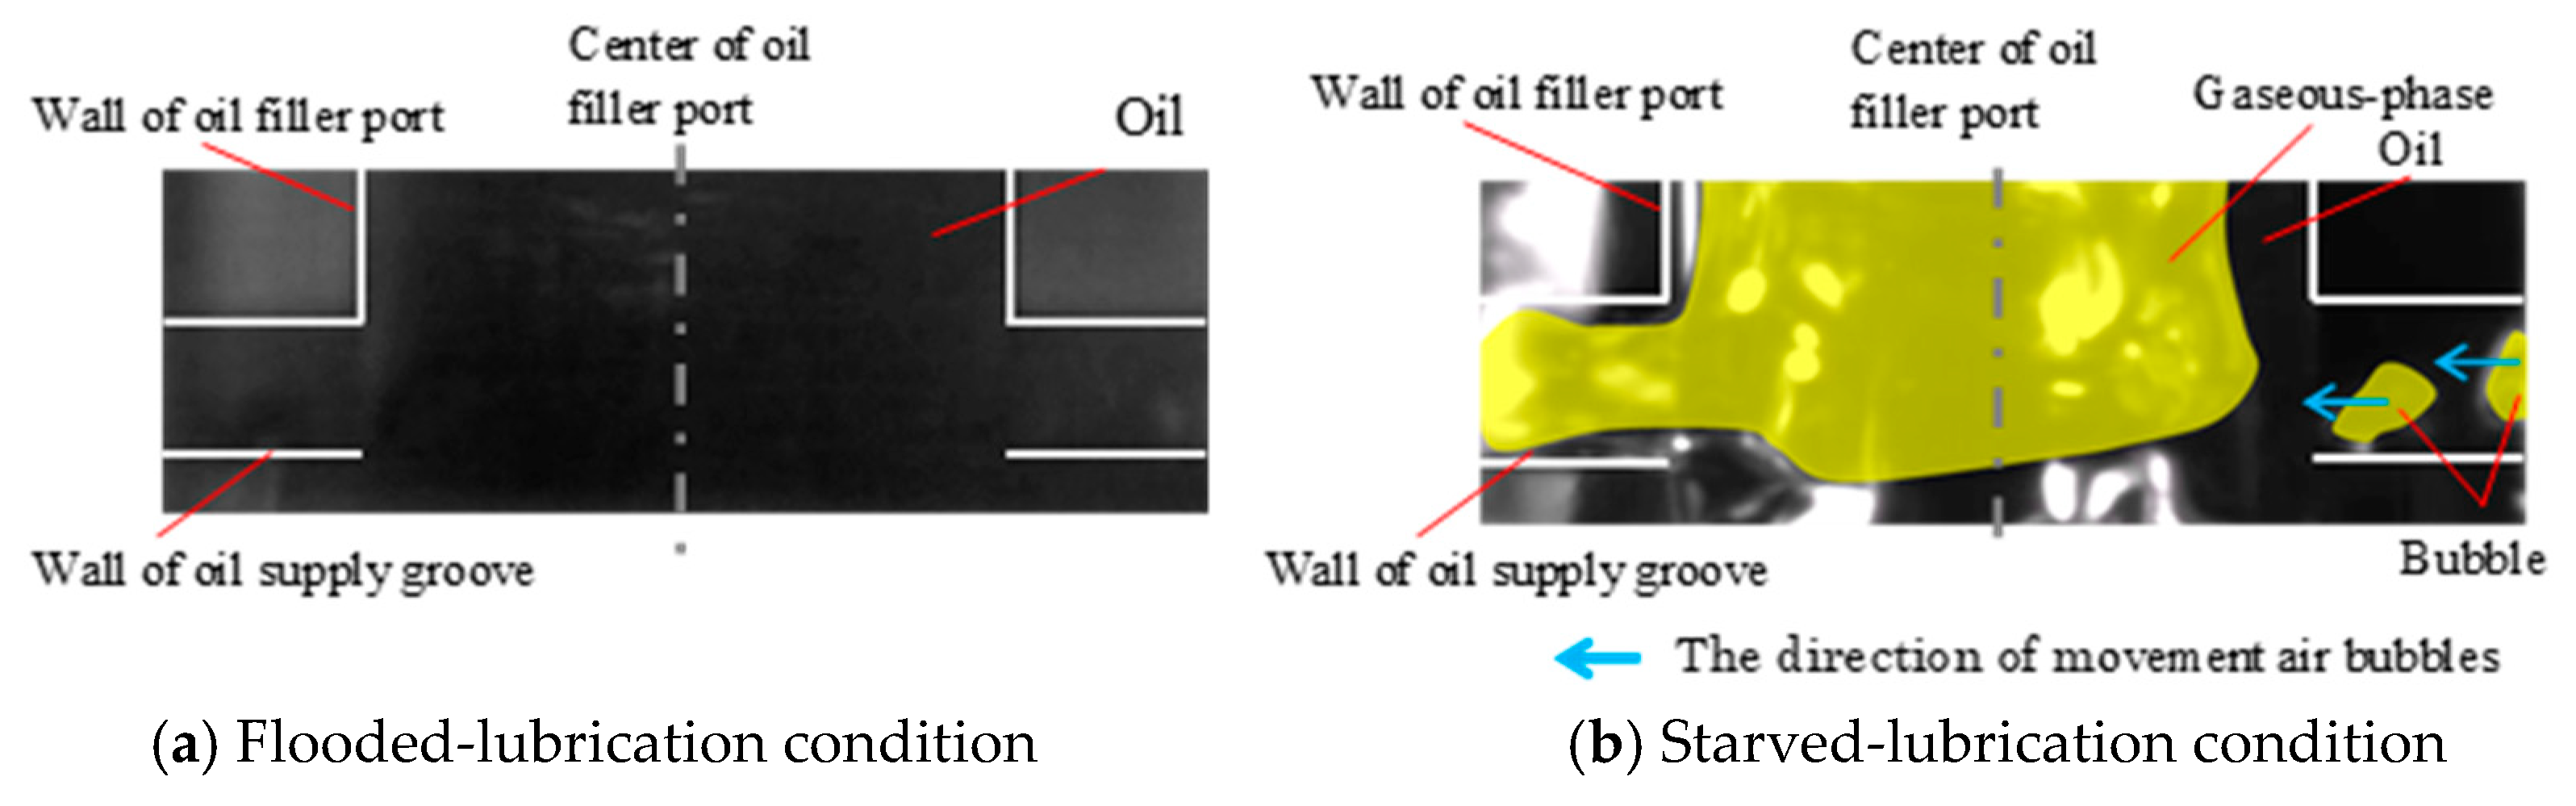
The oil supply flow rate is measured based on the oil leakage from the side end. A halogen light is used to visualize the gaseous-phase areas on the surface of the bearing, whereas the sheet laser designator is used to visualize the oil film rupture. In the experiment, oil film rupture under the flooded lubrication conditions could not be identified, because the oil leakage from the side end was observed to be large. However, the impact of the interface was large under the starved lubrication conditions, because the gaseous-phase area was observed to broaden. Therefore, in this study, the oil film rupture under a starved lubrication condition has been visualized. In the experiment, the rotational speed, volume of fluid under flooded lubrication, and volume of fluid under starved lubrication are n = 3500 rpm, q = 2.6 cm3/s, and 0.5 cm3/s, respectively.

3. Theory

At present, there are two types of methods for numerically analyzing flows, regardless of the multiphase flow, which are the level set [19], VOF [20], front tracking method [21], and the lattice Boltzmann method [22] as multiphase flow analysis. The former is a method of treating fluid as a continuum and solving it by discretizing the conservation law of mass, momentum, and energy represented by a partial differential equation. The other is a method of determining the flow by treating the fluid as a collection of virtual particles with a finite number of velocities, and sequentially calculating the collisions and translations that are performed by the virtual particles. The multiphase flow analysis that was developed from the former is the level set, the VOF, and the front tracking, and the latter is the lattice Boltzmann method. In particular, representative examples of the method include the finite-difference method, the finite-element method, and the boundary-element method. Among them, the VOF method can guarantee the volume preservation of fluid at the basic equation stage, and the convergence of gas phase is expressed by volume fraction, and the calculation cost is better when compared with level set method and front tracking method. It is low cost. From the above, in this study, the flow of the journal bearing is analyzed by the VOF method using ANSYS FLUENT 15.0.

3.1. Governing Equation

The Navier–Stokes equation considering the surface tension is used to analyze the journal bearing instead of the Reynolds equation in this study. The mass conservation equation and the momentum equation are shown, as follows;
u = 0
ρ [ u t + ( u u ) ] = p + μ 2 u + ρ g + ( σ + σ γ n ) δ i n t
= ( x + y + z )
where ρ fluid density, u velocity vector, p fluid pressure, μ fluid viscosity, ρ g gravitational force, σ surface tension, n normal vector, γ curvature of the boundary surface, and δ i n t Dirac’s delta-function.
Here, in the VOF model, using the volume fraction F, the fluid density and fluid viscosity are expressed, as follows,
ρ = F ρ 1 + ( 1 F ) ρ 2
μ = F μ 1 + ( 1 F ) μ 2
where subscription 1 means oil and 2 means gaseous phase.
This CFD analysis can analyze the internal flow of an oil-filler port with bearing clearance simultaneously, because the inertia term is considered in the basic equation.

3.2. Surface Tension and Cavitation Model

The effect of surface tension was considered in this analysis. The continuum surface force (CSF) model that was proposed by Brackbill et al. [23] was used as the surface tension model implemented in FLUENT out of the box. The last term in Equation (2) ( σ + σ γ n ) δ i n t means surface tension. In Brackbill et al.’s CSF model, the effect of surface tension is included as the surface tension term in the Navier–Stokes equation.
In addition, the cavitation model of Schnerr and Sauer [18] was used. The equation for the volume fraction of steam is as follows.
t ( F ρ 2 ) + ( F ρ 2 ) = ρ 1 ρ 2 ρ D F D t
This cavitation model used the following equation to relate the vapor volume fraction F to the number of bubbles n b per unit volume of liquid and bubble radius.
F = n b 4 3 π R b 3 1 + n b 4 3 π R b 3
where n b number of bubbles was set as 1013 in this study.
While considering the vapor pressure, the volume of air that is dissolved in oil expanded and negative pressure was observed in the journal bearing. In this study, the vapor pressure was set to zero. Further, the flow was laminar and the analysis was conducted in a steady state condition.

3.3. Calculation Model

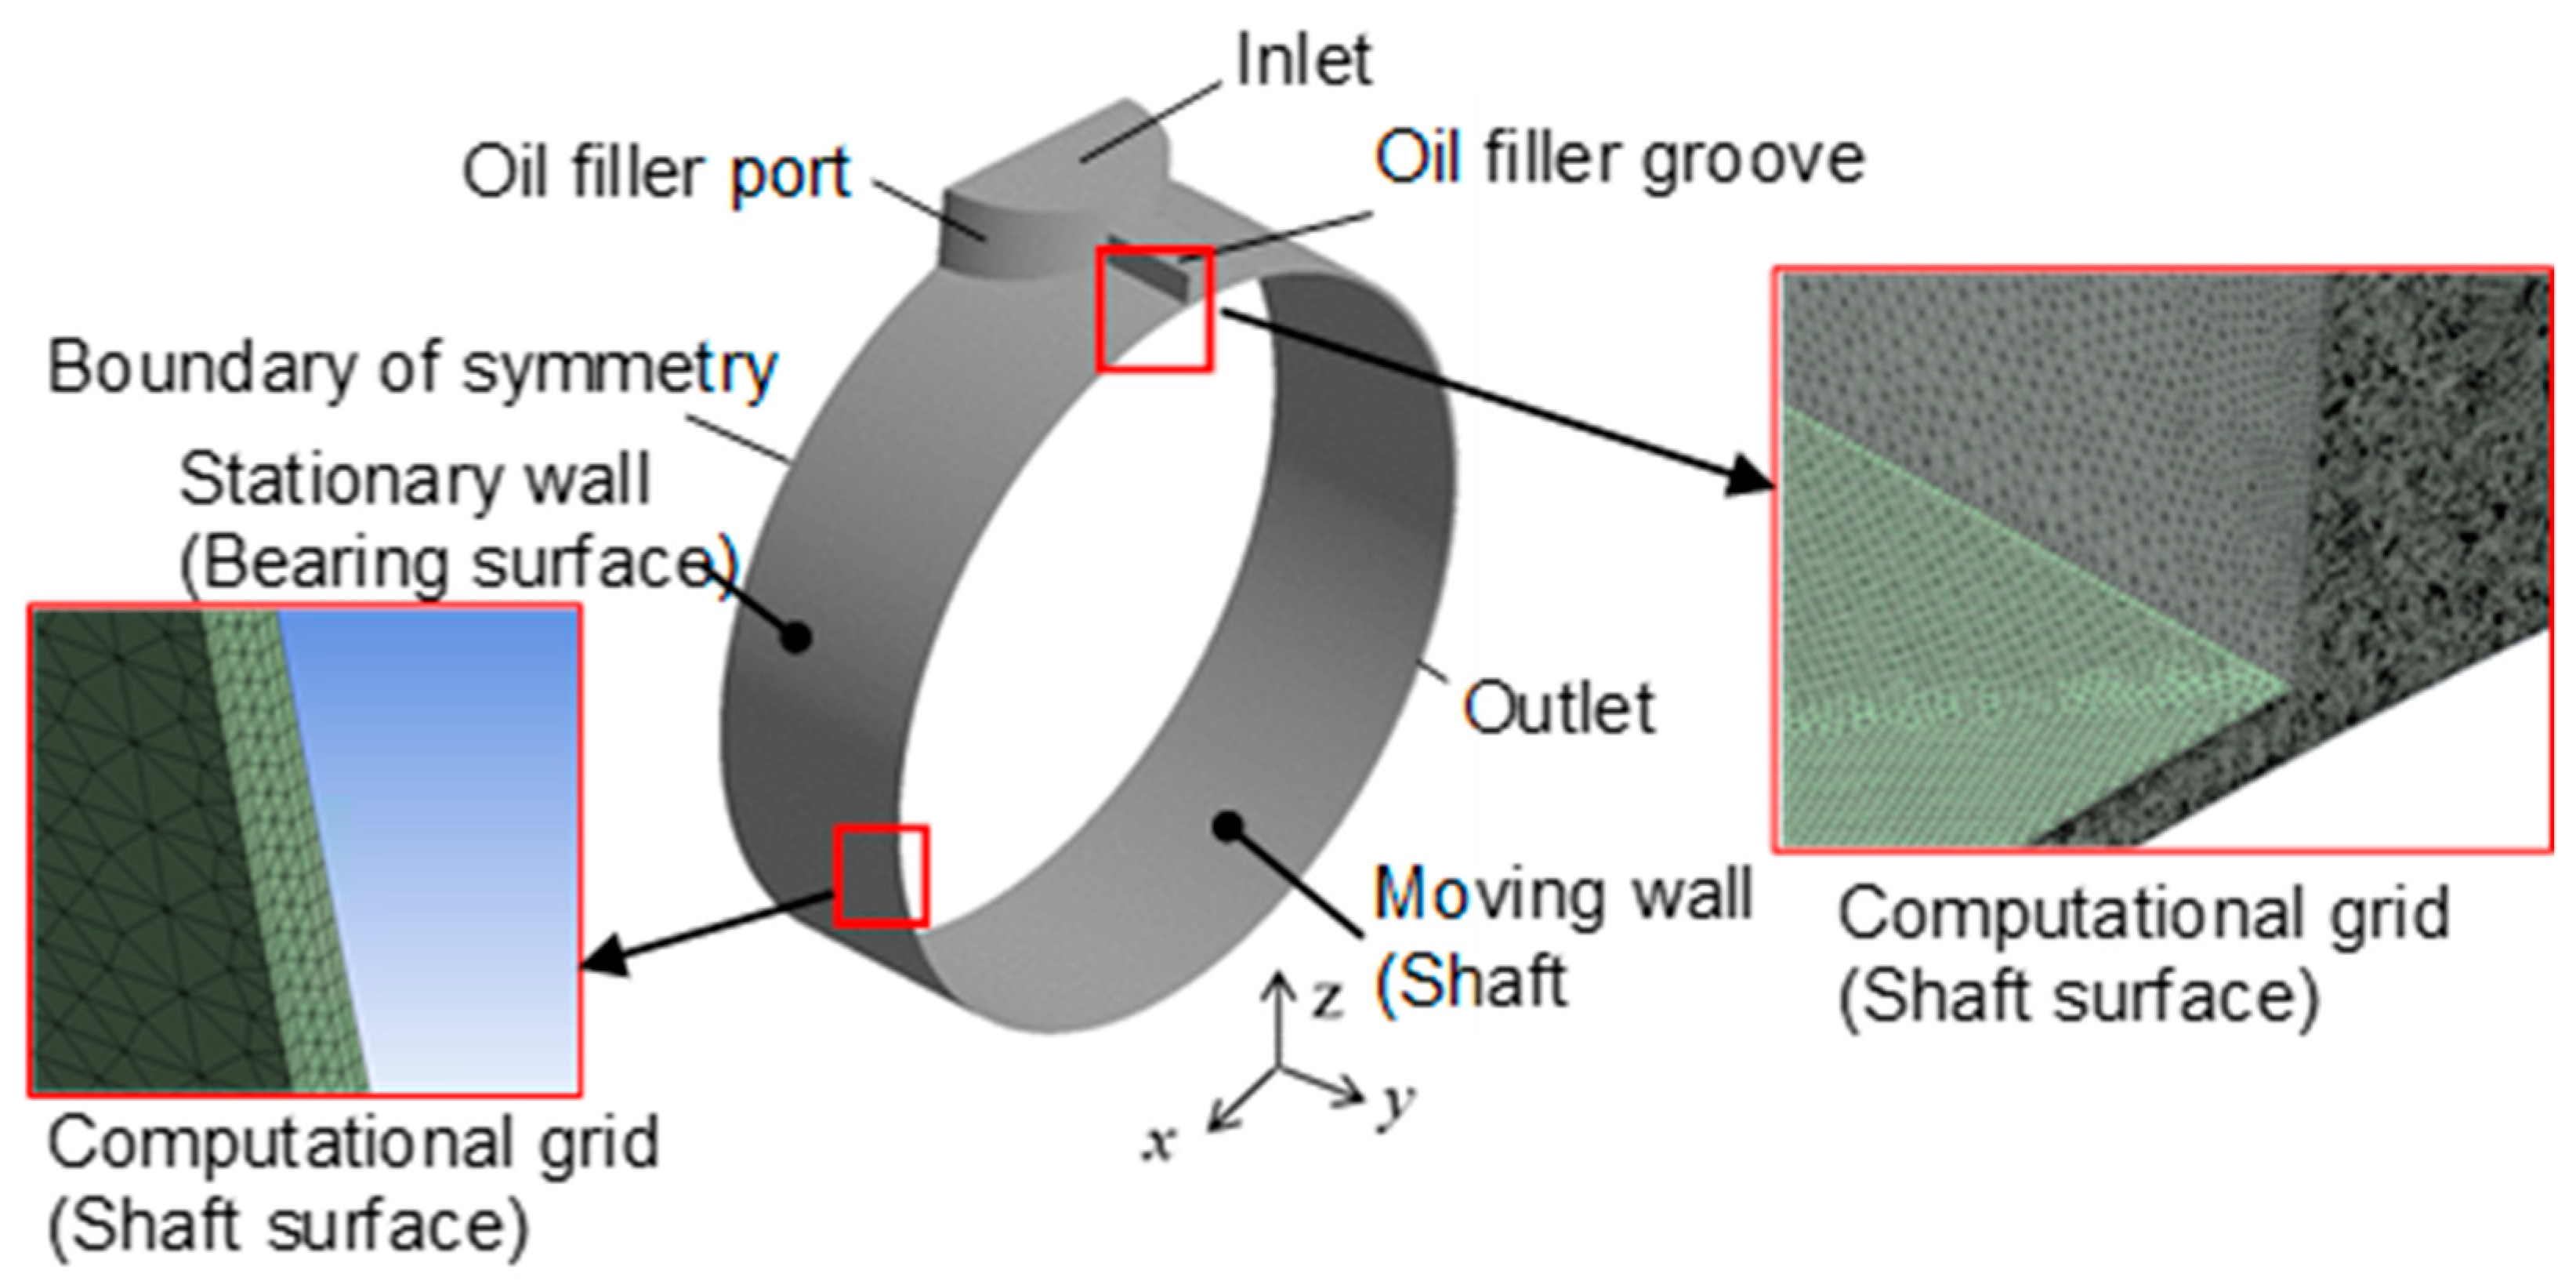
Figure 3 depicts the bearing CFD calculation model. The clearance of the bearing, oil-filler port, and oil supply groove were modeled, and the overall flow in the bearing could be calculated. The calculation model was symmetrically configured against the bearing center. The volume of oil supply, eccentricity ratio, and attitude angle are q = 2.6 cm3/s, ε = 0.54, and φ = 72.9°, respectively, under flooded lubrication conditions. Further, the volume of oil supply under starved lubrication was q = 0.5 cm3/s, the eccentricity ratio was ε = 0.76, and the attitude angle was φ = 71.5°. The rotating shaft speed was n = 3500 rpm. These values were determined based on the experimental results. The computational grid in the minimum clearance contains six layers in the direction of the bearing clearance. The total mesh number under flooded and starved lubrication conditions were 64 × 105 and 18 × 106, respectively. Previously, we confirmed that mesh size was sufficient for the calculations. Table 2 shows the calculation conditions. The tension between oil and air was also considered while performing the calculations. The surface tension was set to 0.04 N/m, which was measured while using the du Noüy method (ASTM 971-50).
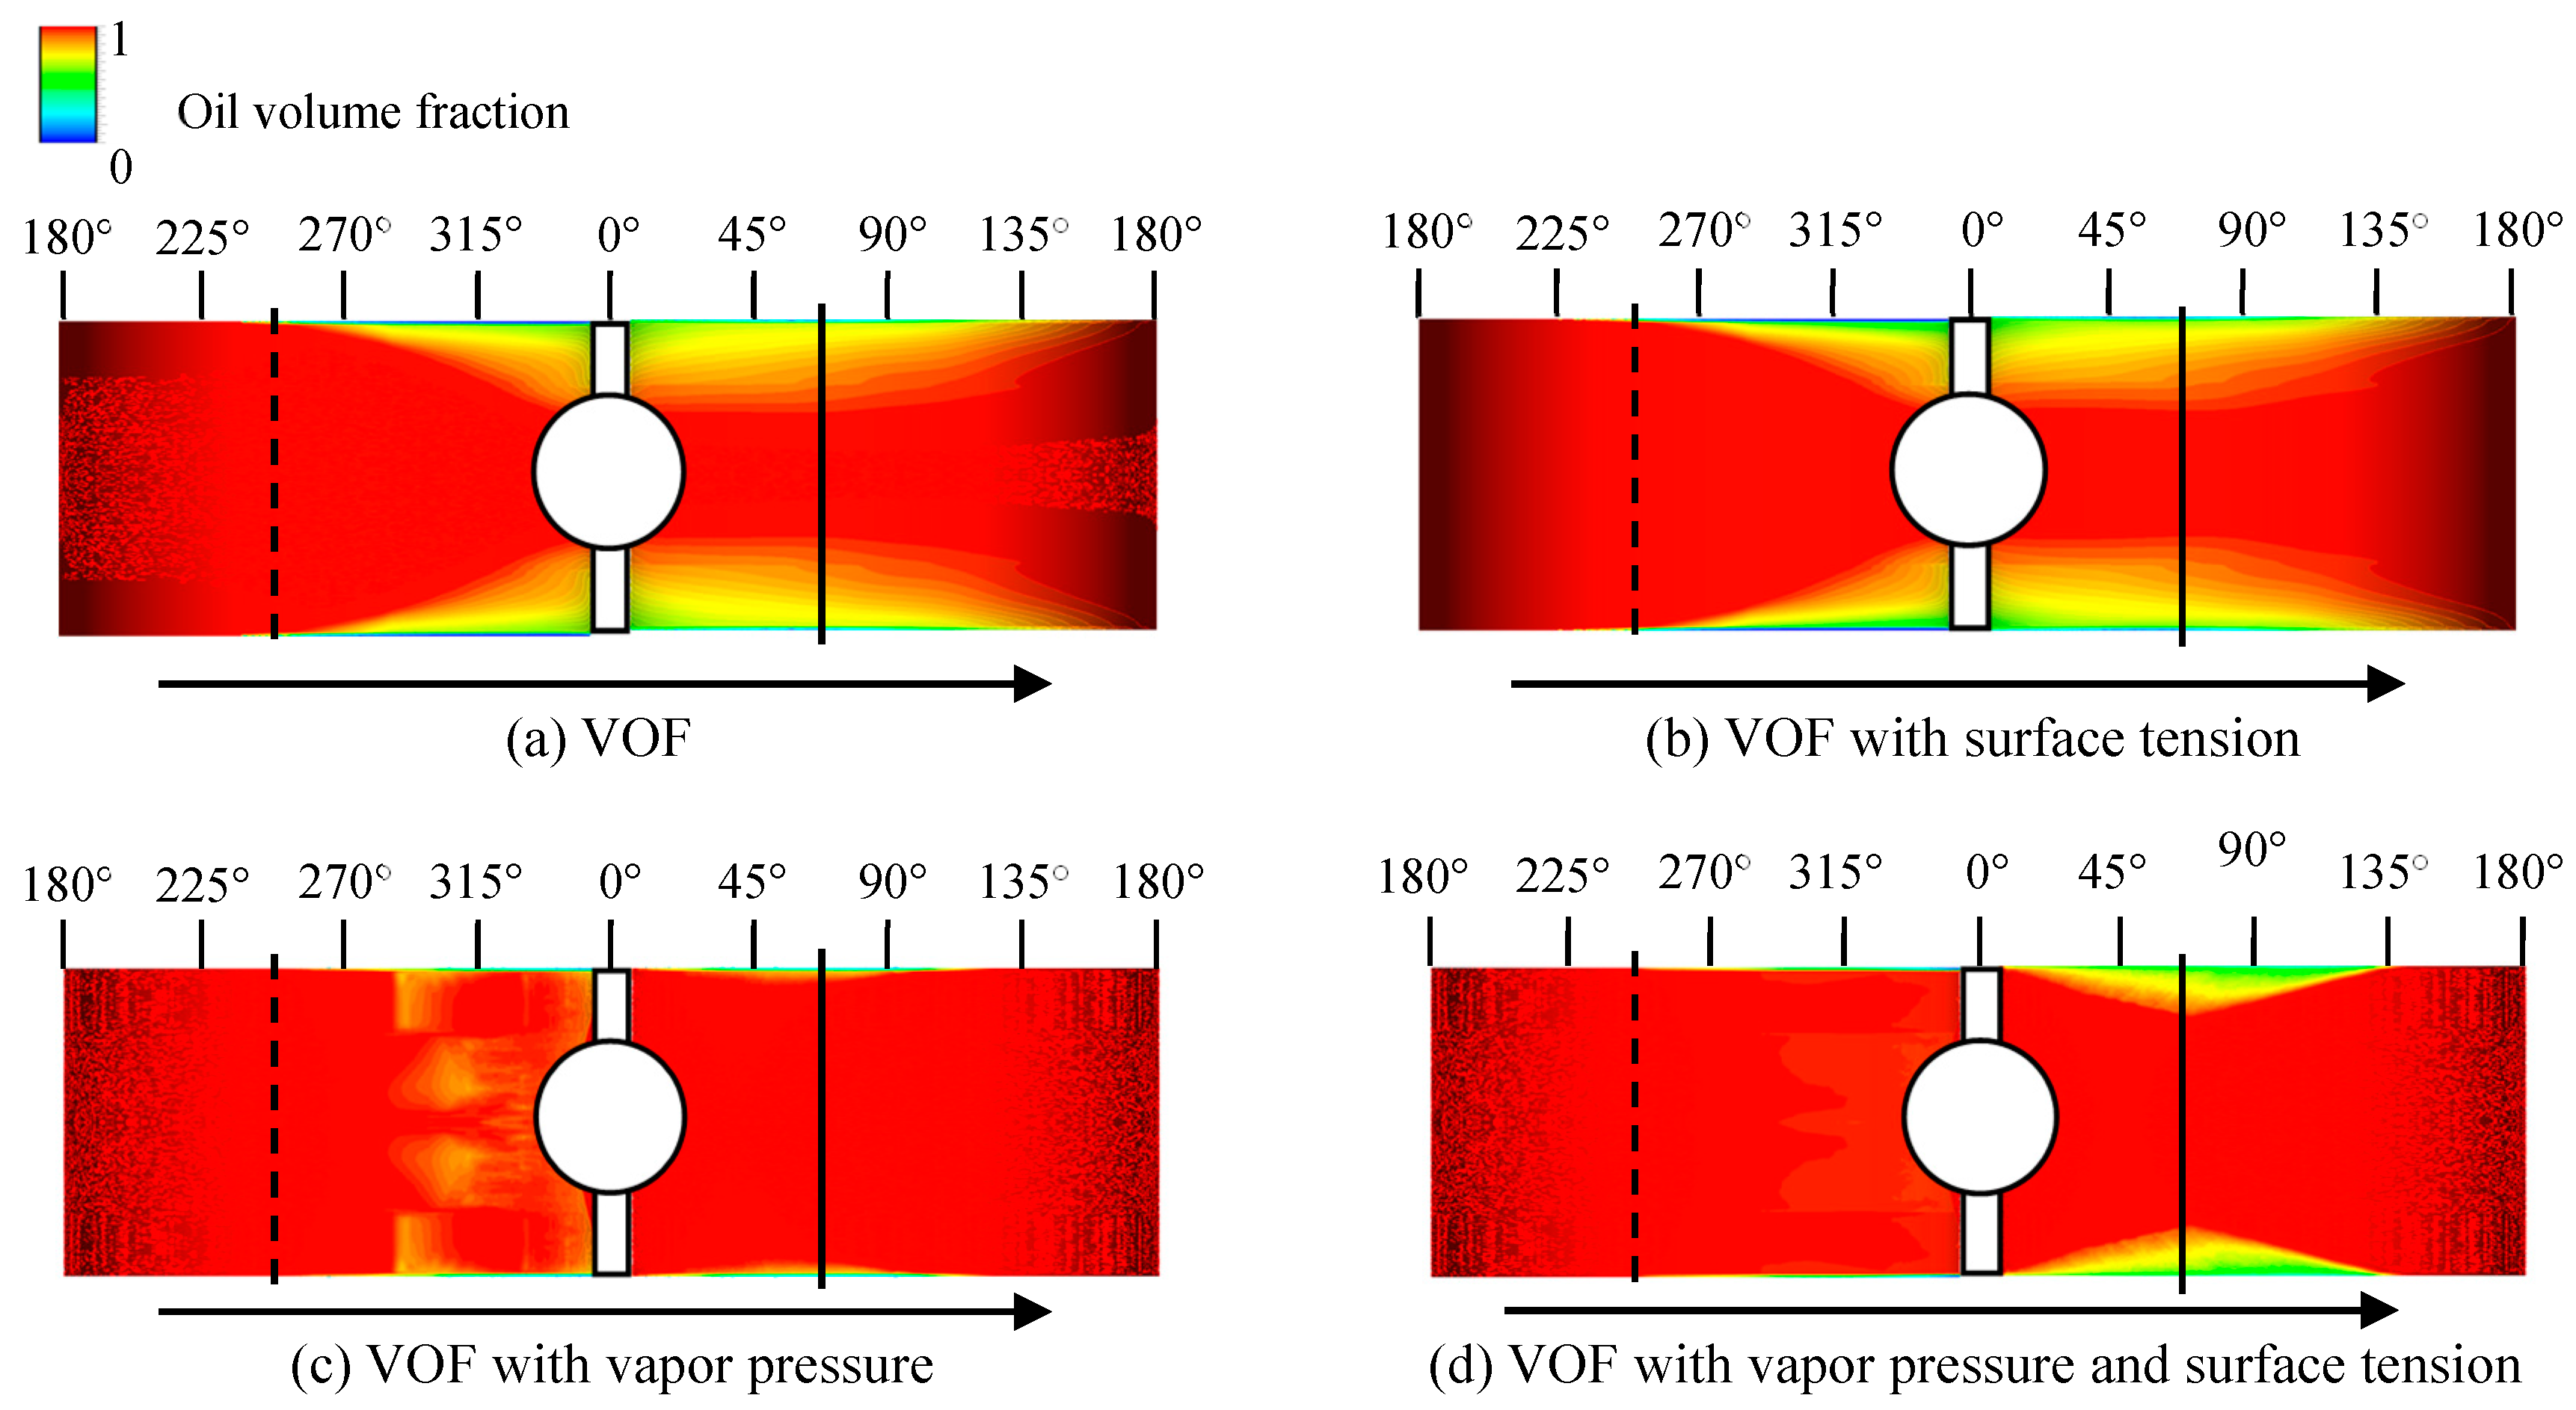
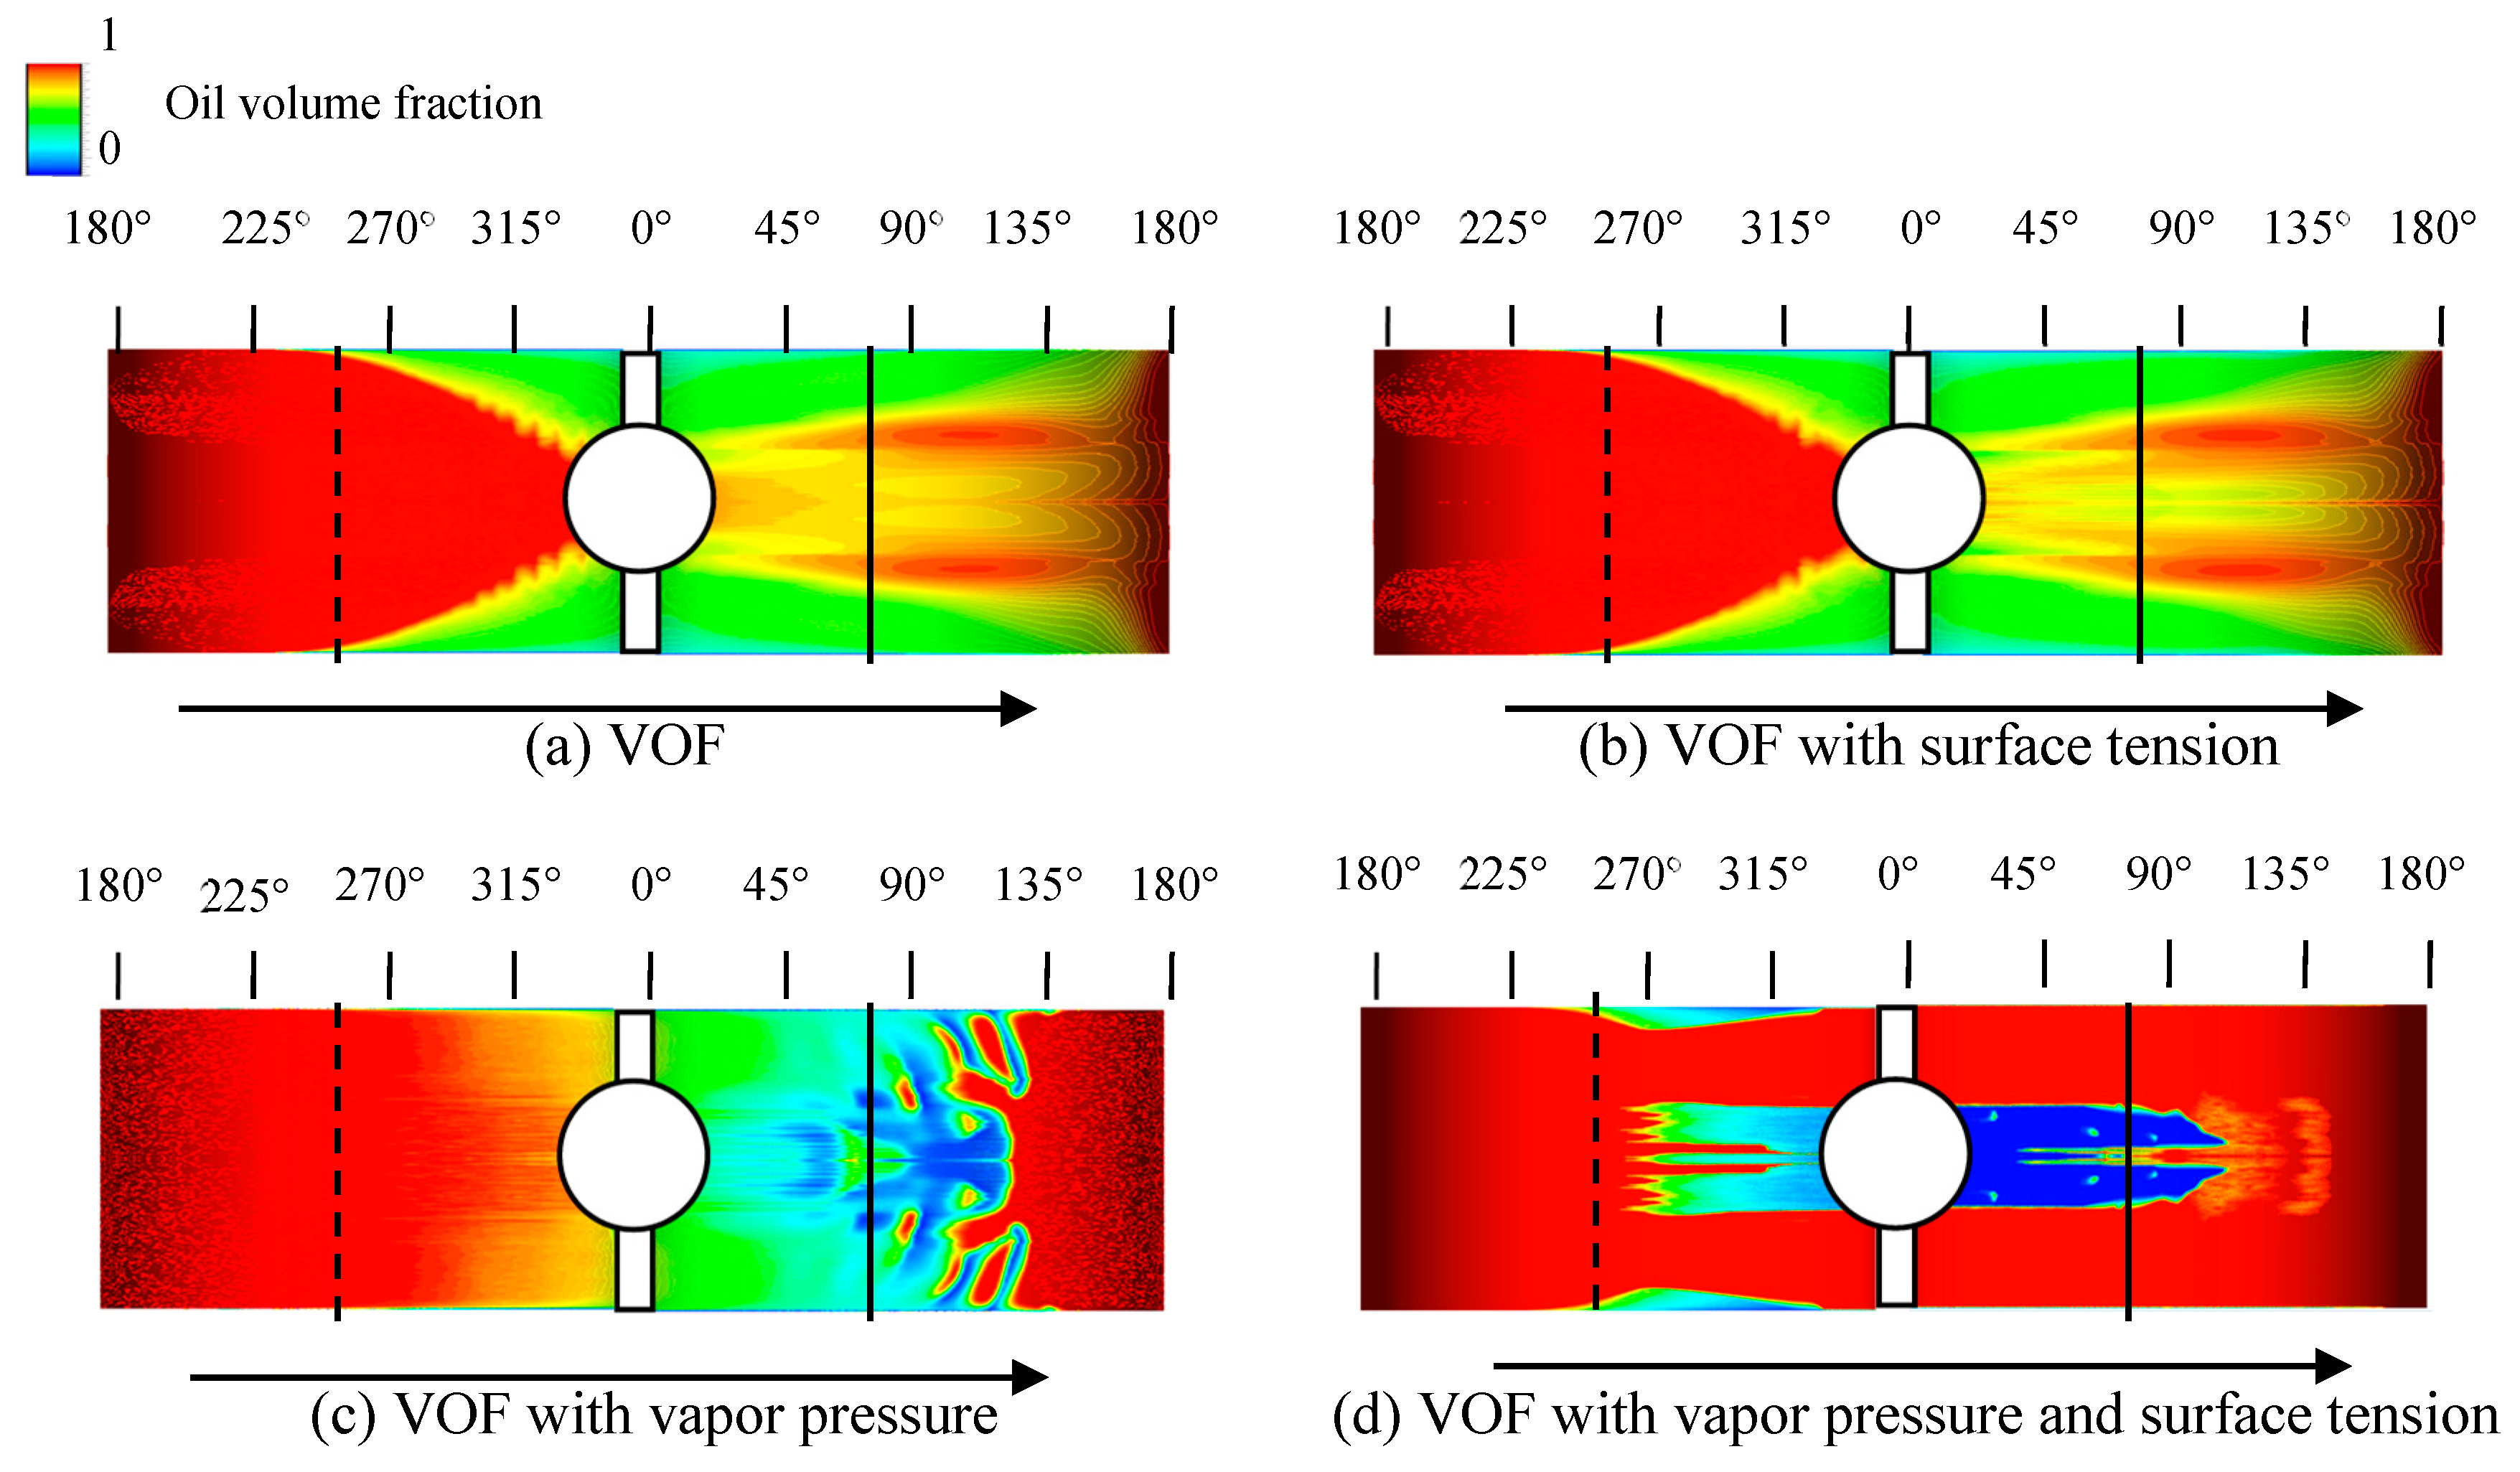
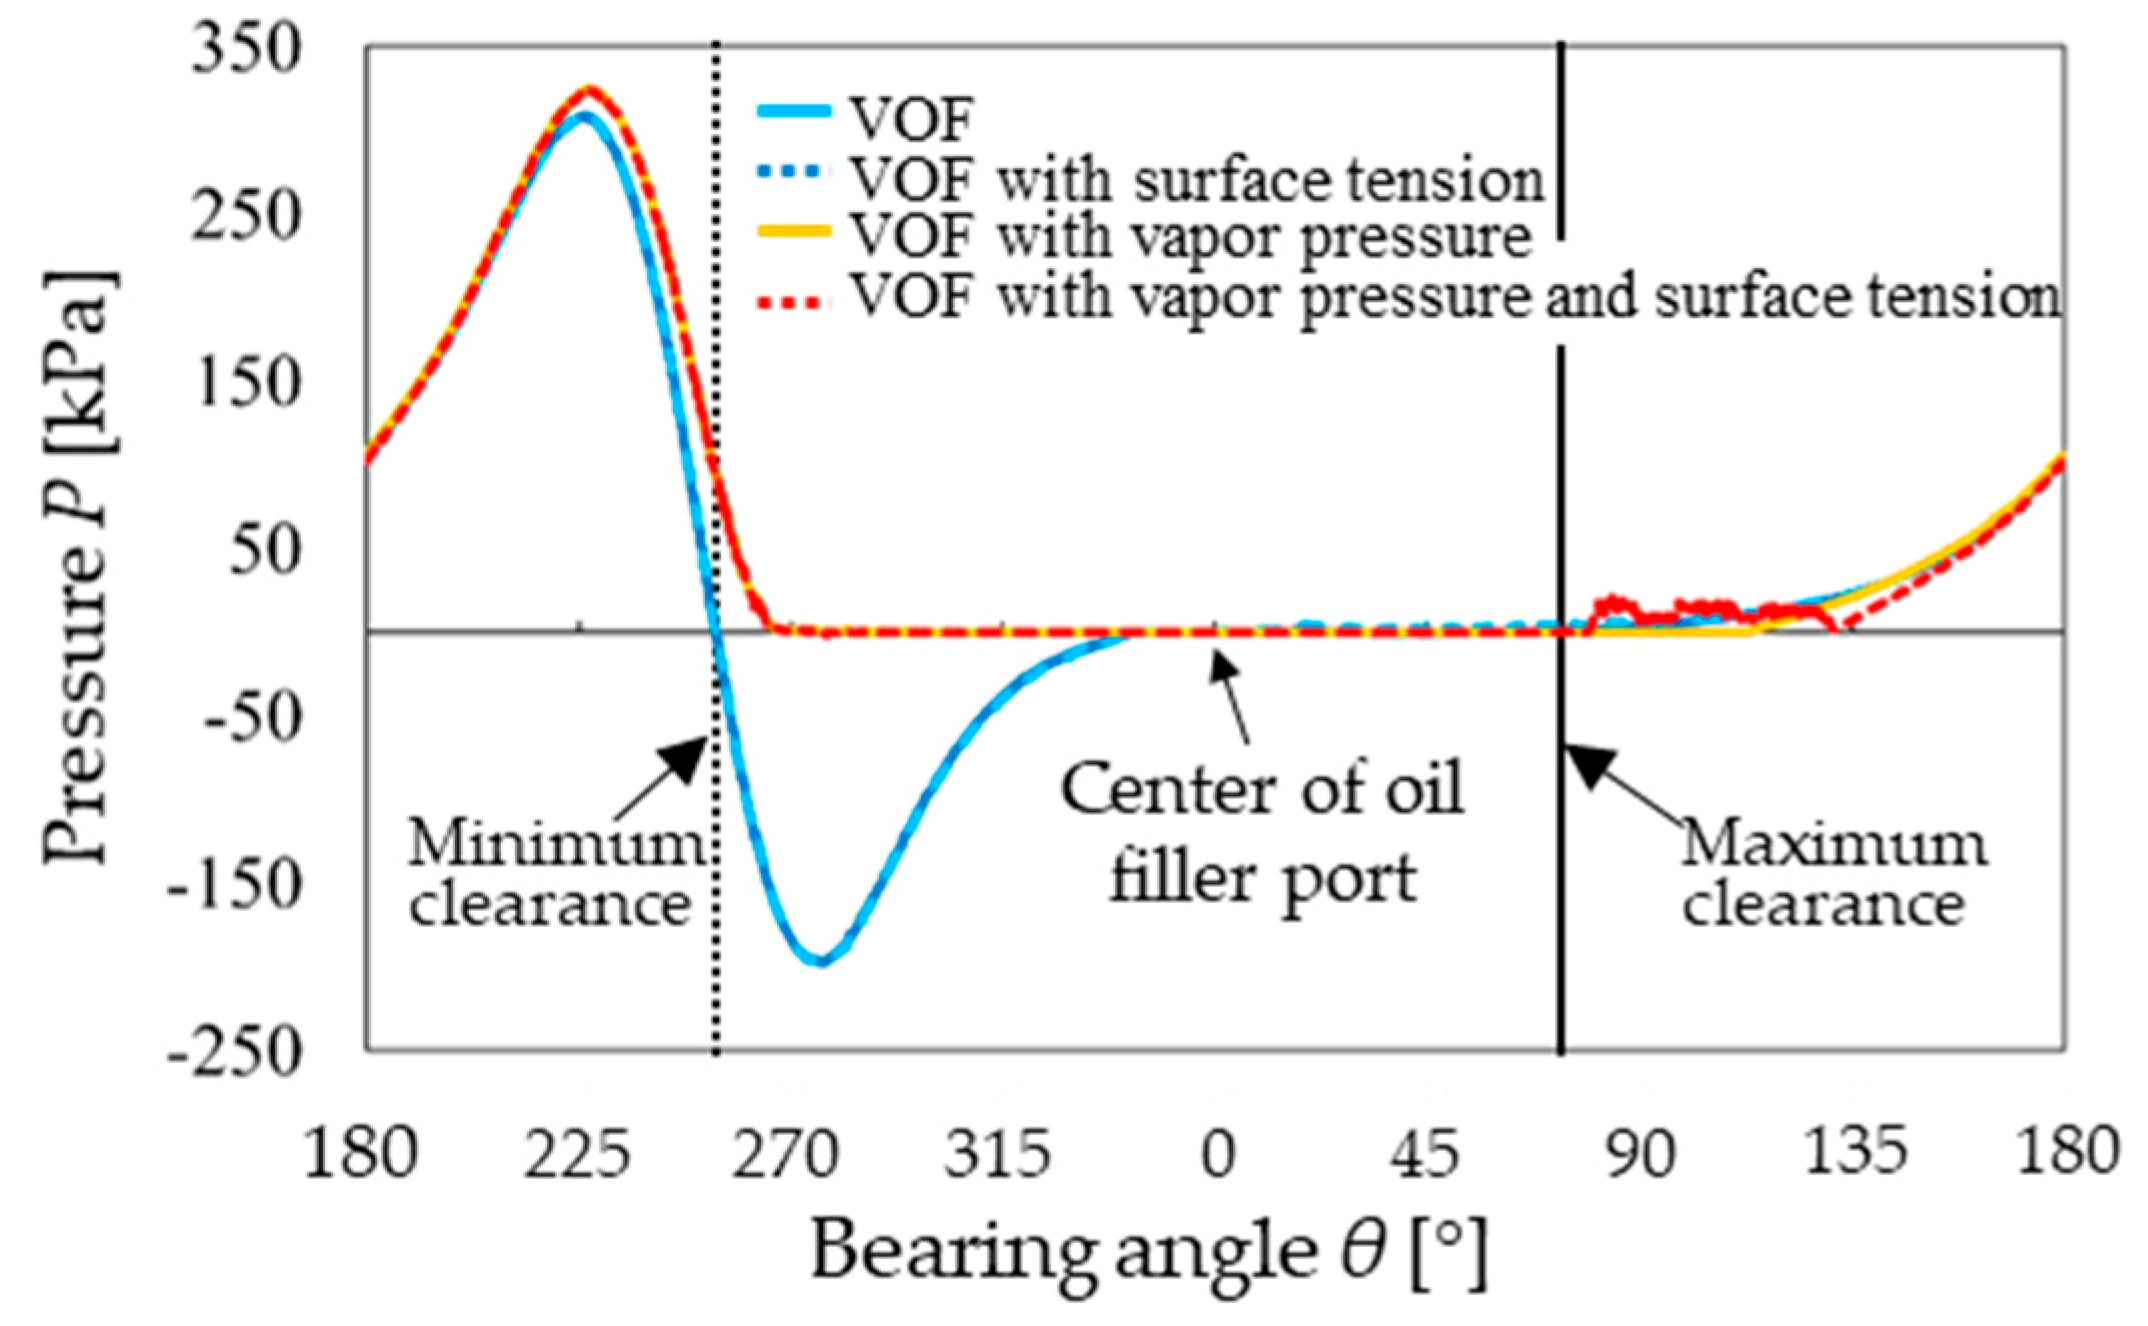
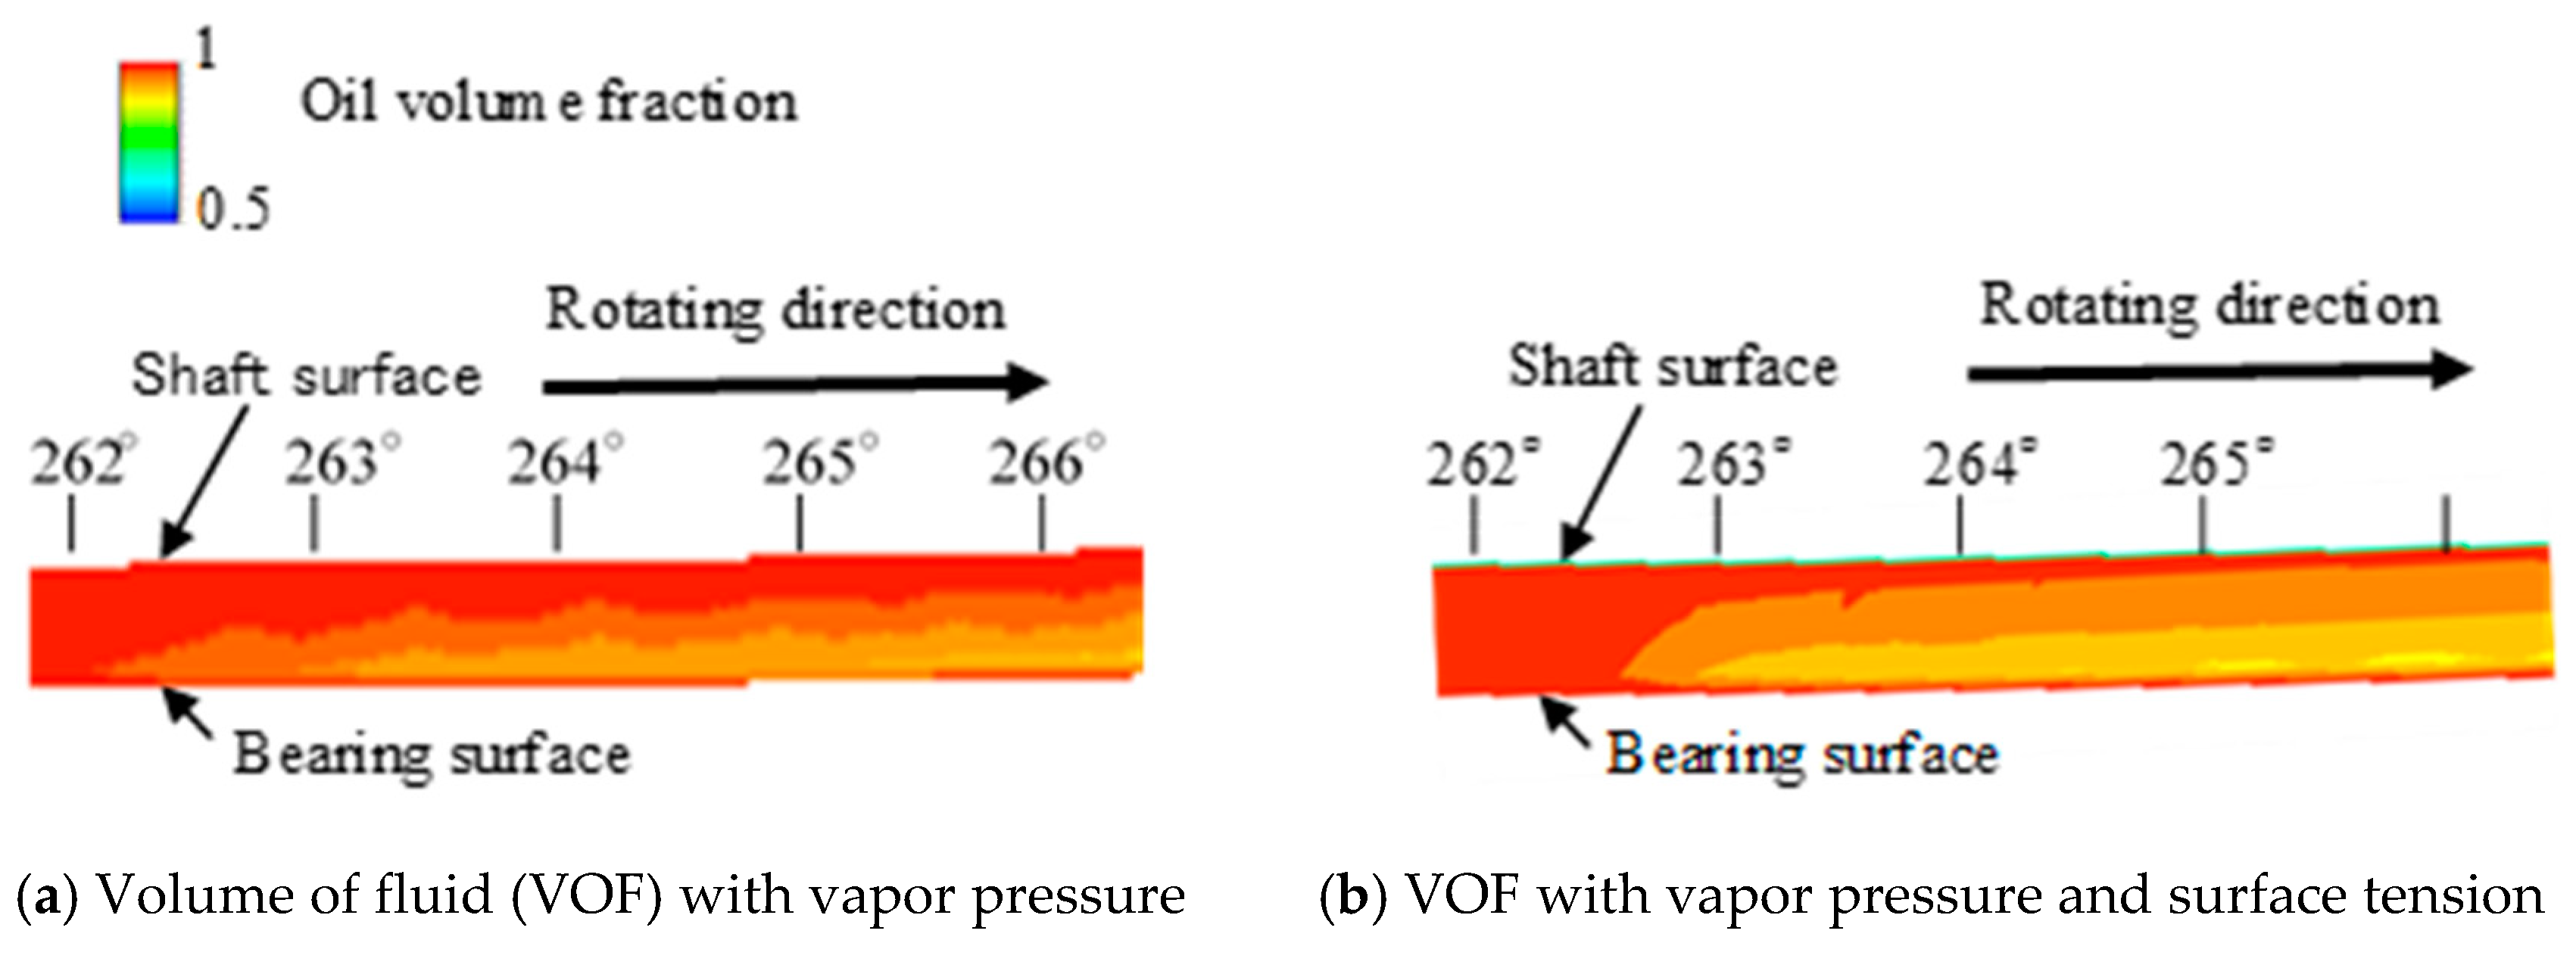
In this study, to clarify the effects of vapor pressure and surface tension, four types of calculations, which are (i) VOF (negative pressures are allowed), (ii) VOF with vapor pressure, (iii) VOF with surface tension; and, (iv) VOF with vapor pressure and surface tension are conducted.

4. Results and Discussion

4.1. Comparison of Experiment with CFD-Analysis under Flooded Lubrication Condition

Figure 4 illustrates the experimental visualization results of the gaseous-phase area on a bearing surface under flooded lubrication conditions. The yellow areas denote the gaseous phase, and the remaining areas indicate the oil film. The arrows indicate the rotating directions. The repeatability was confirmed over ten times in our experiment. The gaseous area in the visualized photos adopted averaged values, because the gaseous area fluctuated a little.
As shown in Figure 4, the gaseous-phase occurs at the side end of the bearing between 0° and 135°, whereas the oil film exists in the other area. The white color is also observed between 225°, 270°, and 315°. This is not gaseous-area, but caused by light reflection.
The shape of gaseous area is not completely symmetric caused by misalignment and vibration from shaft deformation. However, it is considered that the influence is little.
Figure 5 depicts the analytical results for the volume fraction F distribution of oil under flooded lubrication conditions. In this figure, red color indicates the fully oil phase, whereas the blue color indicates the fully gaseous phase. Figure 5a indicates the result while using VOF, whereas Figure 5b indicates the result using VOF with surface tension. Further, Figure 5c indicates the result of VOF with vapor pressure and Figure 5d indicates the result of VOF with vapor pressure and surface tension. The arrows are used to indicate the rotating direction. Further, the black lines that are perpendicular to the circumferential direction of the bearing indicate the maximum clearance, whereas the dotted lines indicate the minimum clearance. The uppermost part of the bearing is at 0° and the oil-filler port exists at this location. The results of CFD analysis vary between the rotating shaft and the bearing. In this study, we have presented the results for the surface of the rotating shaft.
As shown in Figure 5a,b, when using VOF and VOF with surface tension, the volume fraction around the side end of the bearing decreases to a value between 270° and 135°, and the volume fraction of the remaining area is approximately one, which means complete oil. The decreasing range of the volume fraction between 270° and 0° increases in the vicinity of the oil filler port. Moreover, the decreasing range of volume fraction is between 0° and 135°, whereas it increases in degree values that are close to 135°. As depicted in Figure 5c, the volume fraction around the side end of the bearing slightly decreases to a value that is between 300° and 100° in the case of VOF with vapor pressure. The range of the volume-fraction decrease in the results of VOF with vapor pressure is smaller than that observed in the case of VOF alone or in the case of VOF with surface tension. In Figure 5d, the volume fraction around the bearing end is slightly decreased to a value that is between 300° and 0° in the case of VOF with vapor pressure and surface tension. This range of decrease of the volume fraction exhibits the same scale as of VOF with vapor pressure. Further, the range of decrease of the volume fraction between 0° and 135° is larger than that observed in the case of VOF with vapor pressure. Moreover, it becomes the widest at the position of maximum clearance. It is found that the gaseous-phase state in the case of VOF with vapor pressure Figure 5d is in good agreement with the experiment that is shown in Figure 5, when compared with other experiments shown in Figure 5a–c.
Figure 6 depicts the analytical results for the pressure distribution under flooded lubrication conditions. The cross axis of the graph indicates the bearing angle and 0° indicates the upper part of the bearing. From Figure 6, the values of pressure that are depicted by the results using VOF and VOF with surface tension illustrate a similar tendency, and negative pressure is seen to occur between 250° and 340°. Therefore, the gaseous phase around the side end of the bearing in Figure 5a,b is considered to be regurgitated gas from the side end of the bearing that causes negative pressure. In the case of VOF with vapor pressure, the pressure value is higher than that obtained from the results while using VOF and VOF with surface tension, which reached zero at 270°. Furthermore, the pressure between 270° and the oil filler port becomes constant. Therefore, we infer that the volume fraction at the side end of the bearing increases as compared to the results using VOF and VOF with surface tension. The pressure values of VOF with vapor pressure and VOF with vapor pressure and surface tension exhibit a similar tendency between 0° and 270°, but a slight variation in pressure occurs between 270° and the oil-filler port. Thus, in the case of VOF with vapor pressure and surface tension, the gaseous phase that occurs at the side end of the bearing of the wedge is considered to arise from the interface of the air phase from the side end of the bearing and the contractile force of the oil phase.

4.2. Comparison of Experiment with CFD-Analysis under Starved Lubrication Condition

Figure 7 indicates the visualization results under the starved lubrication conditions. In the case of starved lubrication, it is found that the gaseous-phase area was larger than that of flooded lubrication conditions, and streaky oil films exist. Finger-type cavitation and the gaseous phase at the side end of the bearing occur between 260° and 0°, and the gaseous phase at the center of the bearing is found to be between 0° and 135°.
Figure 8 and Figure 9 depict the volume fraction and pressure distributions of oil under starved lubrication conditions, respectively. The analytical results of the volume fraction and pressure distribution under starved lubrication differ from the results under flooded lubrication. As can be seen Figure 8a, in the case of VOF, the volume fraction is one at 180°, and the minimum clearance and range of the decrease of volume fraction increases for the remaining ranges. The volume fraction at the side end of the bearing in the wedge decreases when compared to the side end of the opposite wedge and it increases between the bearing center and its side. However, pressure begins to increase at 90° as shown in Figure 9; thus, this observation indicates that pressure occurs, even if the area is not completely occupied by oil. Moreover, the volume fraction around the side end of the bearing of the opposite wedge decreases by a greater amount than that observed under the flooded lubrication conditions.
In Figure 8b, in the case of VOF with surface tension, the range of decrease of the volume fraction between the minimum clearance and 0° depicts a similar tendency to that observed in the case of VOF. However, the volume fraction at the wedge side in the vicinity of the bearing’s center decreases as compared to that of the VOF. However, small differences in the volume fraction appear to cause an insignificant effect upon pressure. In contrast, from Figure 8c we observe that the volume fraction at the side end of the opposite wedge increases, and the volume fraction between 0° and 130° decreases at a greater rate than that observed in the cases of VOF and VOF with surface tension, whereas pressure in this area is zero in the case of VOF with vapor pressure. Further, the volume fraction of the opposite wedge is observed to moderately decrease between 180° and 295°. Furthermore, the pressure values are zero, regardless of the volume fraction between 265° and 0°.
From Figure 8d, in the case of VOF with vapor pressure and surface tension, the range of decrease of the volume fraction between the bearing center and its side increases, and the streaky oil film (a concentrated striped band of oil) is observed to exist in the vicinity of the bearing center. The volume of fraction in the vicinity of the bearing center between 0° and 120° is zero, and this range is observed to be the full air phase. Further, imperceptible small pressure occurs in this area.
In the case of Figure 8d, the tendency of the gaseous-phase area is in good agreement with that of the experiment that is shown in Figure 7, against other experiments that are shown in (Figure 8a–c, which are very different. The difference is more clear when comparing to the case of the flooded lubrication condition. Therefore, it is important to consider both vapor pressure and surface tension in the case of starved lubrication conditions in particular. From these results, we next focused on the boundary shape of the oil film and gaseous phase at the end of the wedge side considered to be strongly affected.
Figure 10 illustrates the experimental visualization results of the oil-film rupture under starved lubrication conditions. The white line indicates the boundary of the rotating shaft and bearing, whereas the yellow chain line indicates the interface of the oil film and cavitation. From Figure 10, this interface is confirmed to exist between the rotating shaft and the bearing, and the oil-film thickness continuously decreases in the rotational direction, which further goes on to become constant in a manner that is similar to the Coyne and Elrod model. Further, the cavitation is separated from the surface of the bearing at the forefront interface, which depicts a large curve. As far as the authors know, this kind of experimental visualization result has not been shown in journal bearings, and it is considered that the applicability of the Coyne and Elrod model was confirmed in an actual high-speed journal bearing from this result for the first time.
Figure 11 illustrates the analytical results of the volume fraction in an oil-film rupture under the starved lubrication conditions. As shown in Figure 11a, in the case of VOF with vapor pressure, the volume fraction is one at the shaft surface, and it decreases at the bearing surface. The Coyne and Elrod model also exhibits this result. However, the interface between the oil film and cavitation strongly fluctuated in the clearance direction
From Figure 11b, in the case of VOF with vapor pressure and surface tension, two phase flow exhibits a similar tendency as that exhibited by VOF with vapor pressure. The interface between the oil film and cavitation is smoothly curved with an increase in clearance. From these results, it is confirmed that our proposed 3D CFD calculation model that considers the vapor and the surface tension can reproduce the oil-gas boundary.

4.3. Inner Flow Difference of Oil Filler Port between Flooded and Starved Lubrication Conditions

In addition to the above results, we also focused on the inner state of the oil-filler port, because the gaseous area round the oil-filler port was large under the starved lubrication conditions. Figure 12 depicts the experimental visualization results for the gaseous-phase area in the oil-filler port. The white lines indicate the wall surface of the oil-filler port and oil supply groove. In Figure 12a, it is observed that the gaseous-phase does not exist, and that oil occupies the place of the oil-filler port and the oil-supply groove. However, in the case of starved lubrication conditions, gas mostly exists in the center area in the oil-filler port, whereas oil exists on the wall of the oil-filler port and oil-supply groove. Furthermore, it was observed that the bubbles in the oil supply groove flow from the side end of the bearing to the center, whereas the oil flows in the opposite direction.
Figure 13 depicts the analytical results of Figure 13a volume fraction and Figure 13b velocity distribution at a cross section of the oil-filler port Figure 13(a1,b1) under flooded lubrication conditions and Figure 13(a2,b2) under starved lubrication conditions. This figure depicts the oil-supply groove from the front. The dash-dotted lines indicate the surface of symmetry.
From Figure 13(a1,b1), it can be seen that the gaseous phase is absent in the oil-filler port and oil-supply groove, whereas the oil phase is observed throughout the structure. Furthermore, velocity vectors are directed from the outlet surface. Hence, the gaseous-phase area in the bearing clearance is not so large. Here, the comparison between the analytical and experimental visualization results shows that the obtained results are close to the experimental results under the flooded lubrication conditions.
As shown in Figure 13(a2,b2), under starved lubrication conditions, air exists in the major area of the oil filler port, whereas oil exists around the inlet of oil-filler port and it is found at the upper center area of oil-supply groove. Further, the air in the oil supply groove flows from the side end of the bearing to the center, whereas oil flows in the opposite direction. This is due to the surface tension of oil and air, and the effects appear to be especially significant in the case of starved lubrication. Furthermore, oil is supplied from the oil-supply groove to the bearing, thereby causing the occurrence of the gaseous-phase at the center of the bearing of the wedge side of the journal bearing under starved lubrication conditions. The same tendency is confirmed in the experimental visualization results.

5. Influence of Surface Tension in Journal Bearing

In the previous section, it was found that the surface tension strongly influenced the gaseous-phase areas in journal bearings under starved lubrication. We considered surface tension influence journal bearing from Weber number We, which is a dimensionless number, and it is expressed in the following equation:
W e = ρ U 2 H σ
where U represents speed and H represents length.
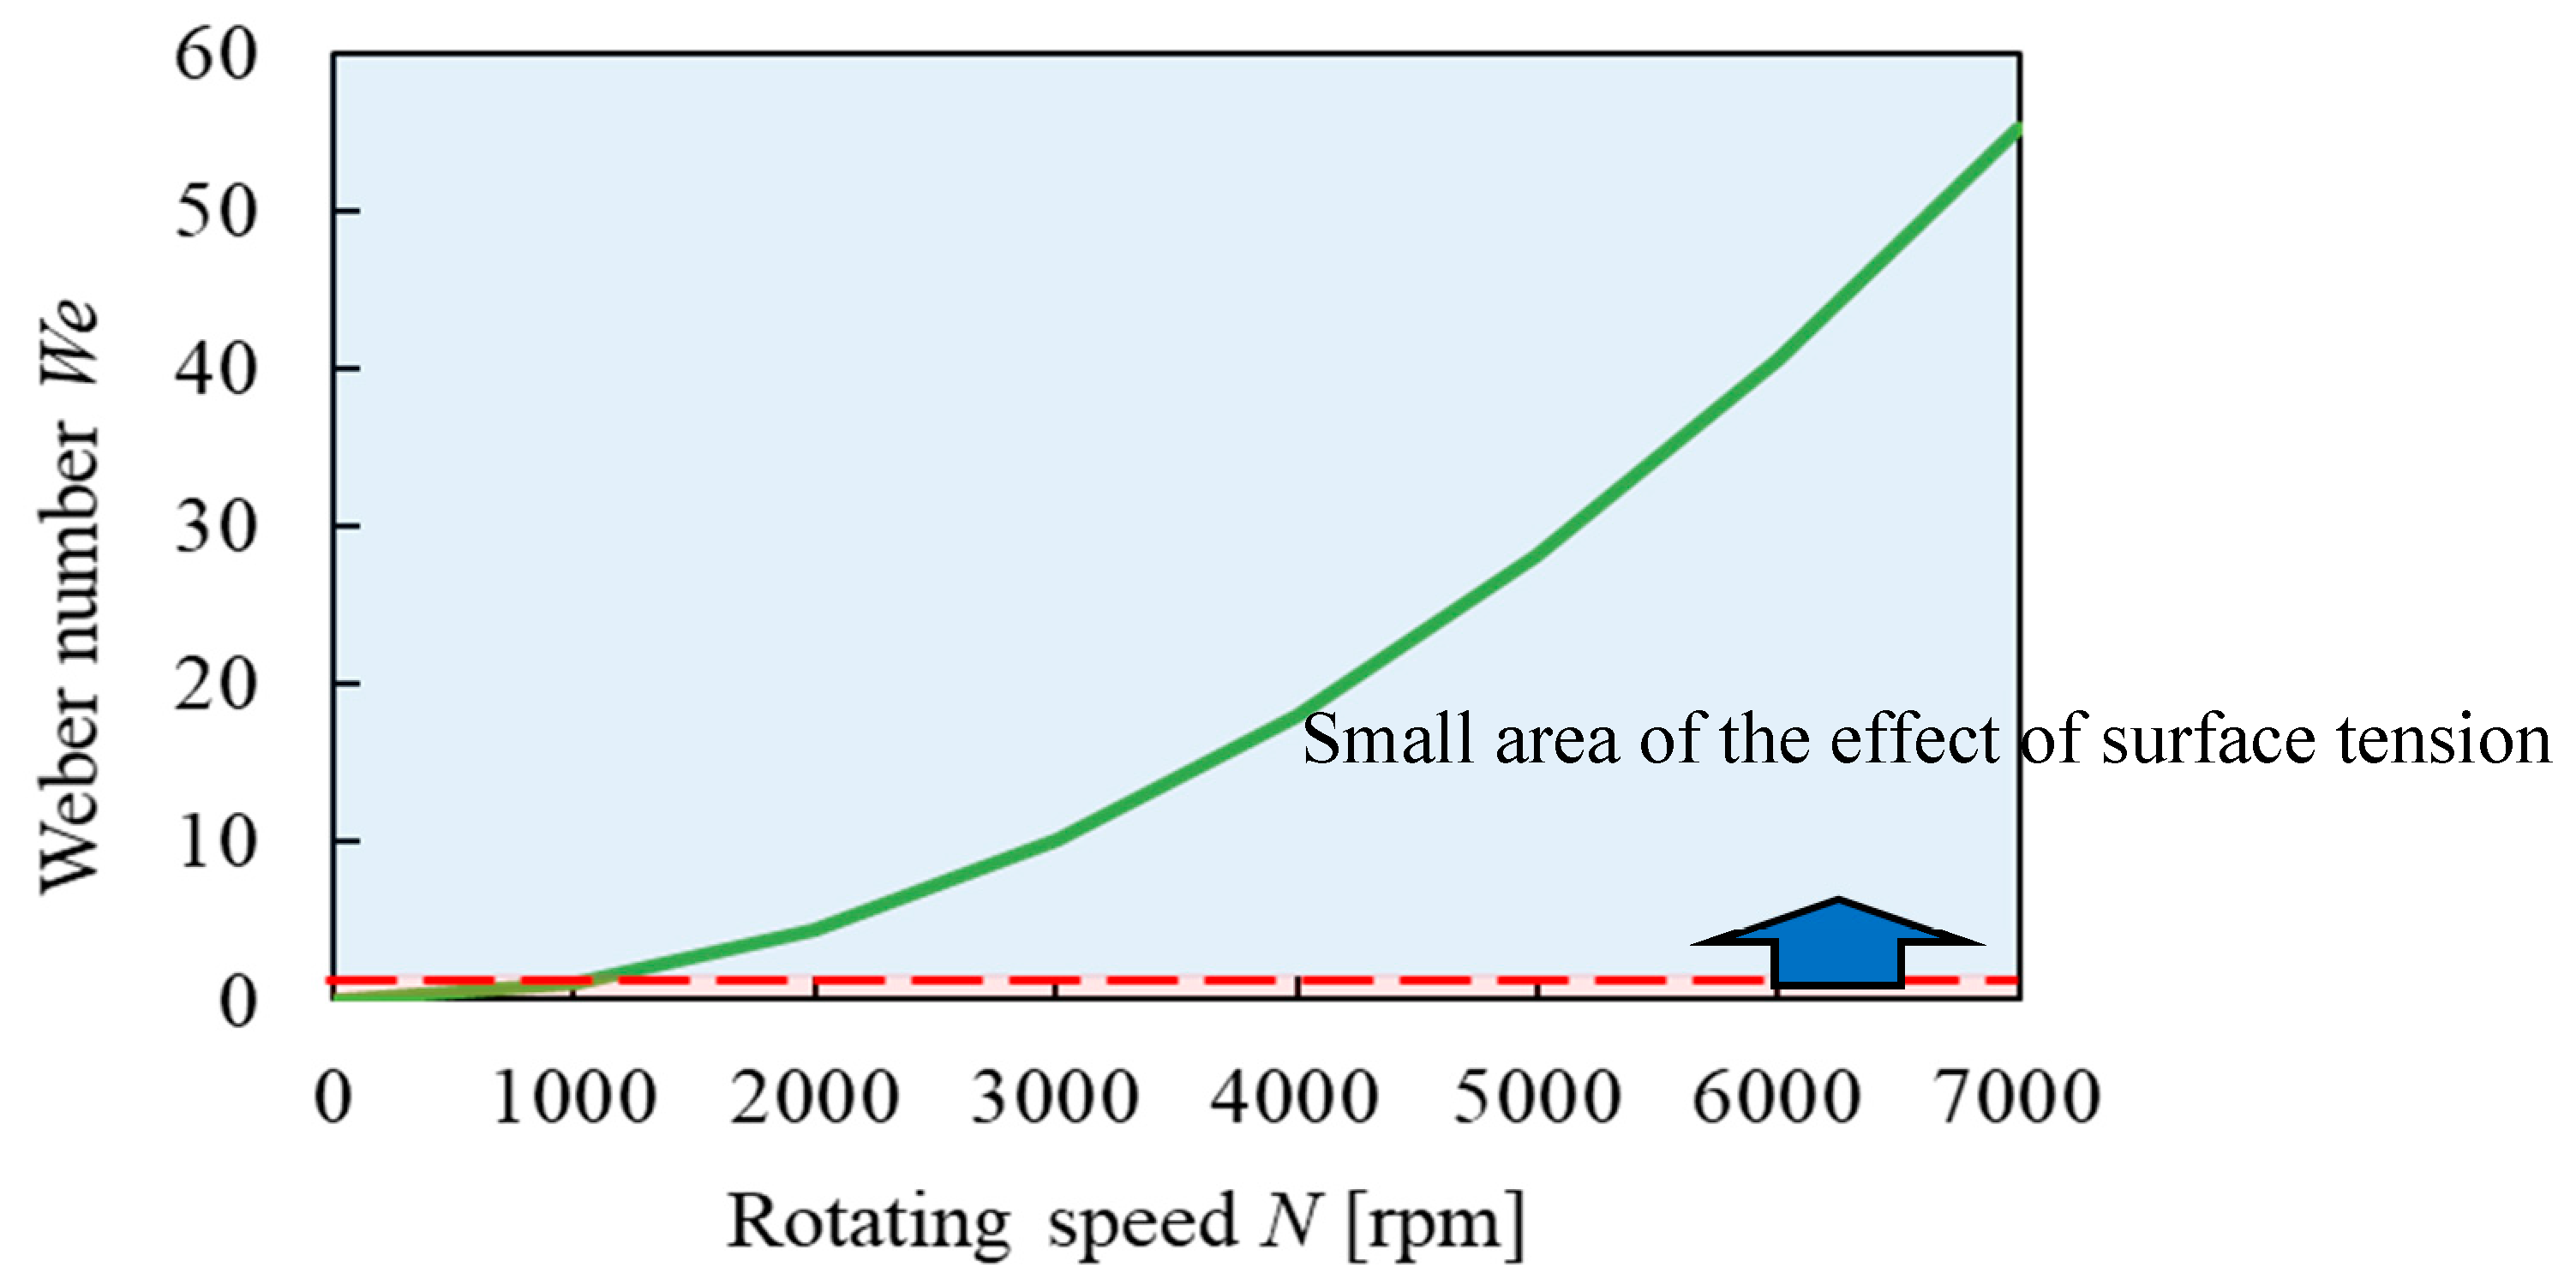
The Weber number We is a value that is obtained by driving the fluid inertia force by the surface tension. Generally, if We is less than one, the surface tension strongly influences the gas-liquid two-phase flow. This means that the inertial force of the fluid becomes smaller than the surface tension, so the influence of the surface tension becomes remarkable.
First, we examined the surface tension influence on bearing clearance. In this study, it was assumed that the journal center coincided with the bearing center and determined the representative speed U(=R(2πN/60)) and representative length H. Figure 14 depicts the relationship between the Weber number We and the internal flow of bearing clearance. From this figure, the Weber number approximately exceed one in rotating speed 1 m/s, so it is found that surface tension does not have significant influence on flow in the bearing clearance under the analysis condition in the previous section under both lubrication conditions.
However, it has been confirmed by analysis results that the influence of surface tension is significant to gaseous-phase areas under starved lubrications. Therefore, we focused on the Weber number We of the internal flow of an oil-filler port. In terms of representative speed, it was assumed that the flowing lubricating oil speed in an oil-filler port is uniform and it determined representative speed from supply flow rate. 
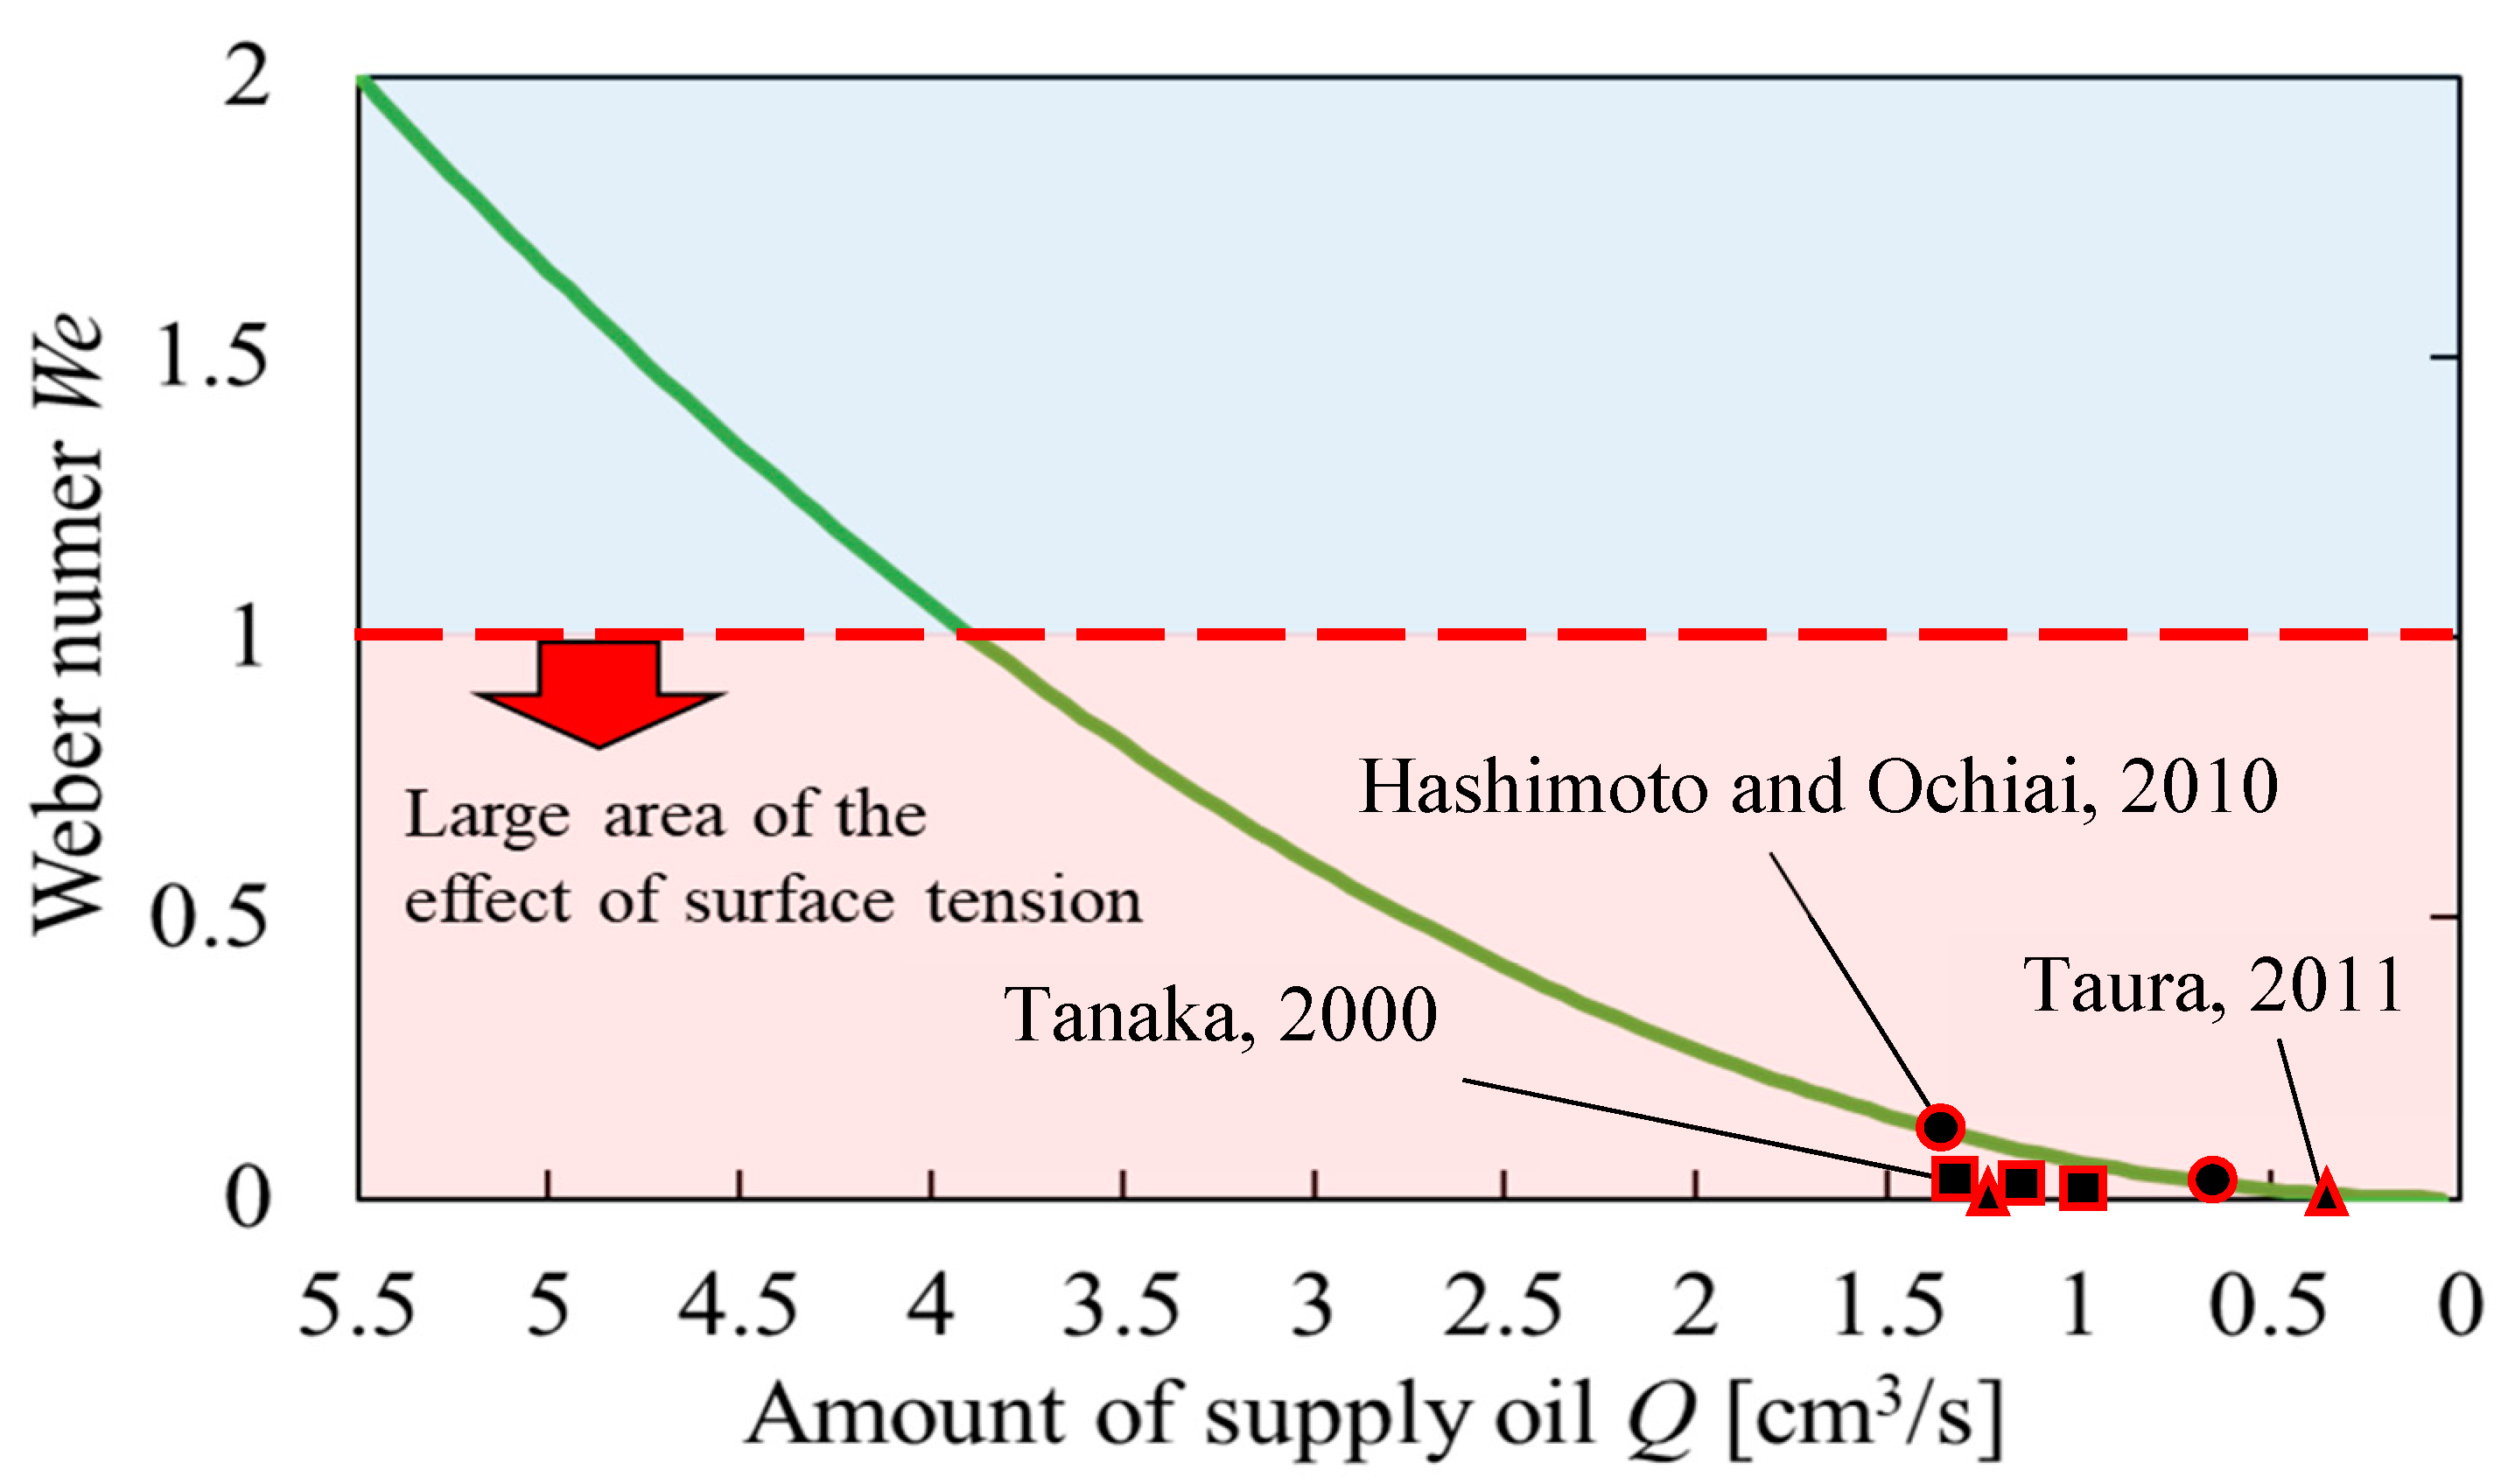
Figure 15 depicts the relationship between the Weber number We and the oil flow rate. The continuous line in this figure indicates the value in this study as a reference, whereas several plots indicate the value in other studies of journal bearings under the starved lubrication conditions (Hashimoto and Ochiai [1], Tanaka [24], Taura [25]). Focusing on the continuous line, the Weber number We drop below 1 approximately under 4 cm3/s and the influence of surface tension in the internal flow of the oil-filler port become too large to ignore. Moreover, it is found that the Weber number We is remarkably small in other research of journal bearing under starved lubrications.
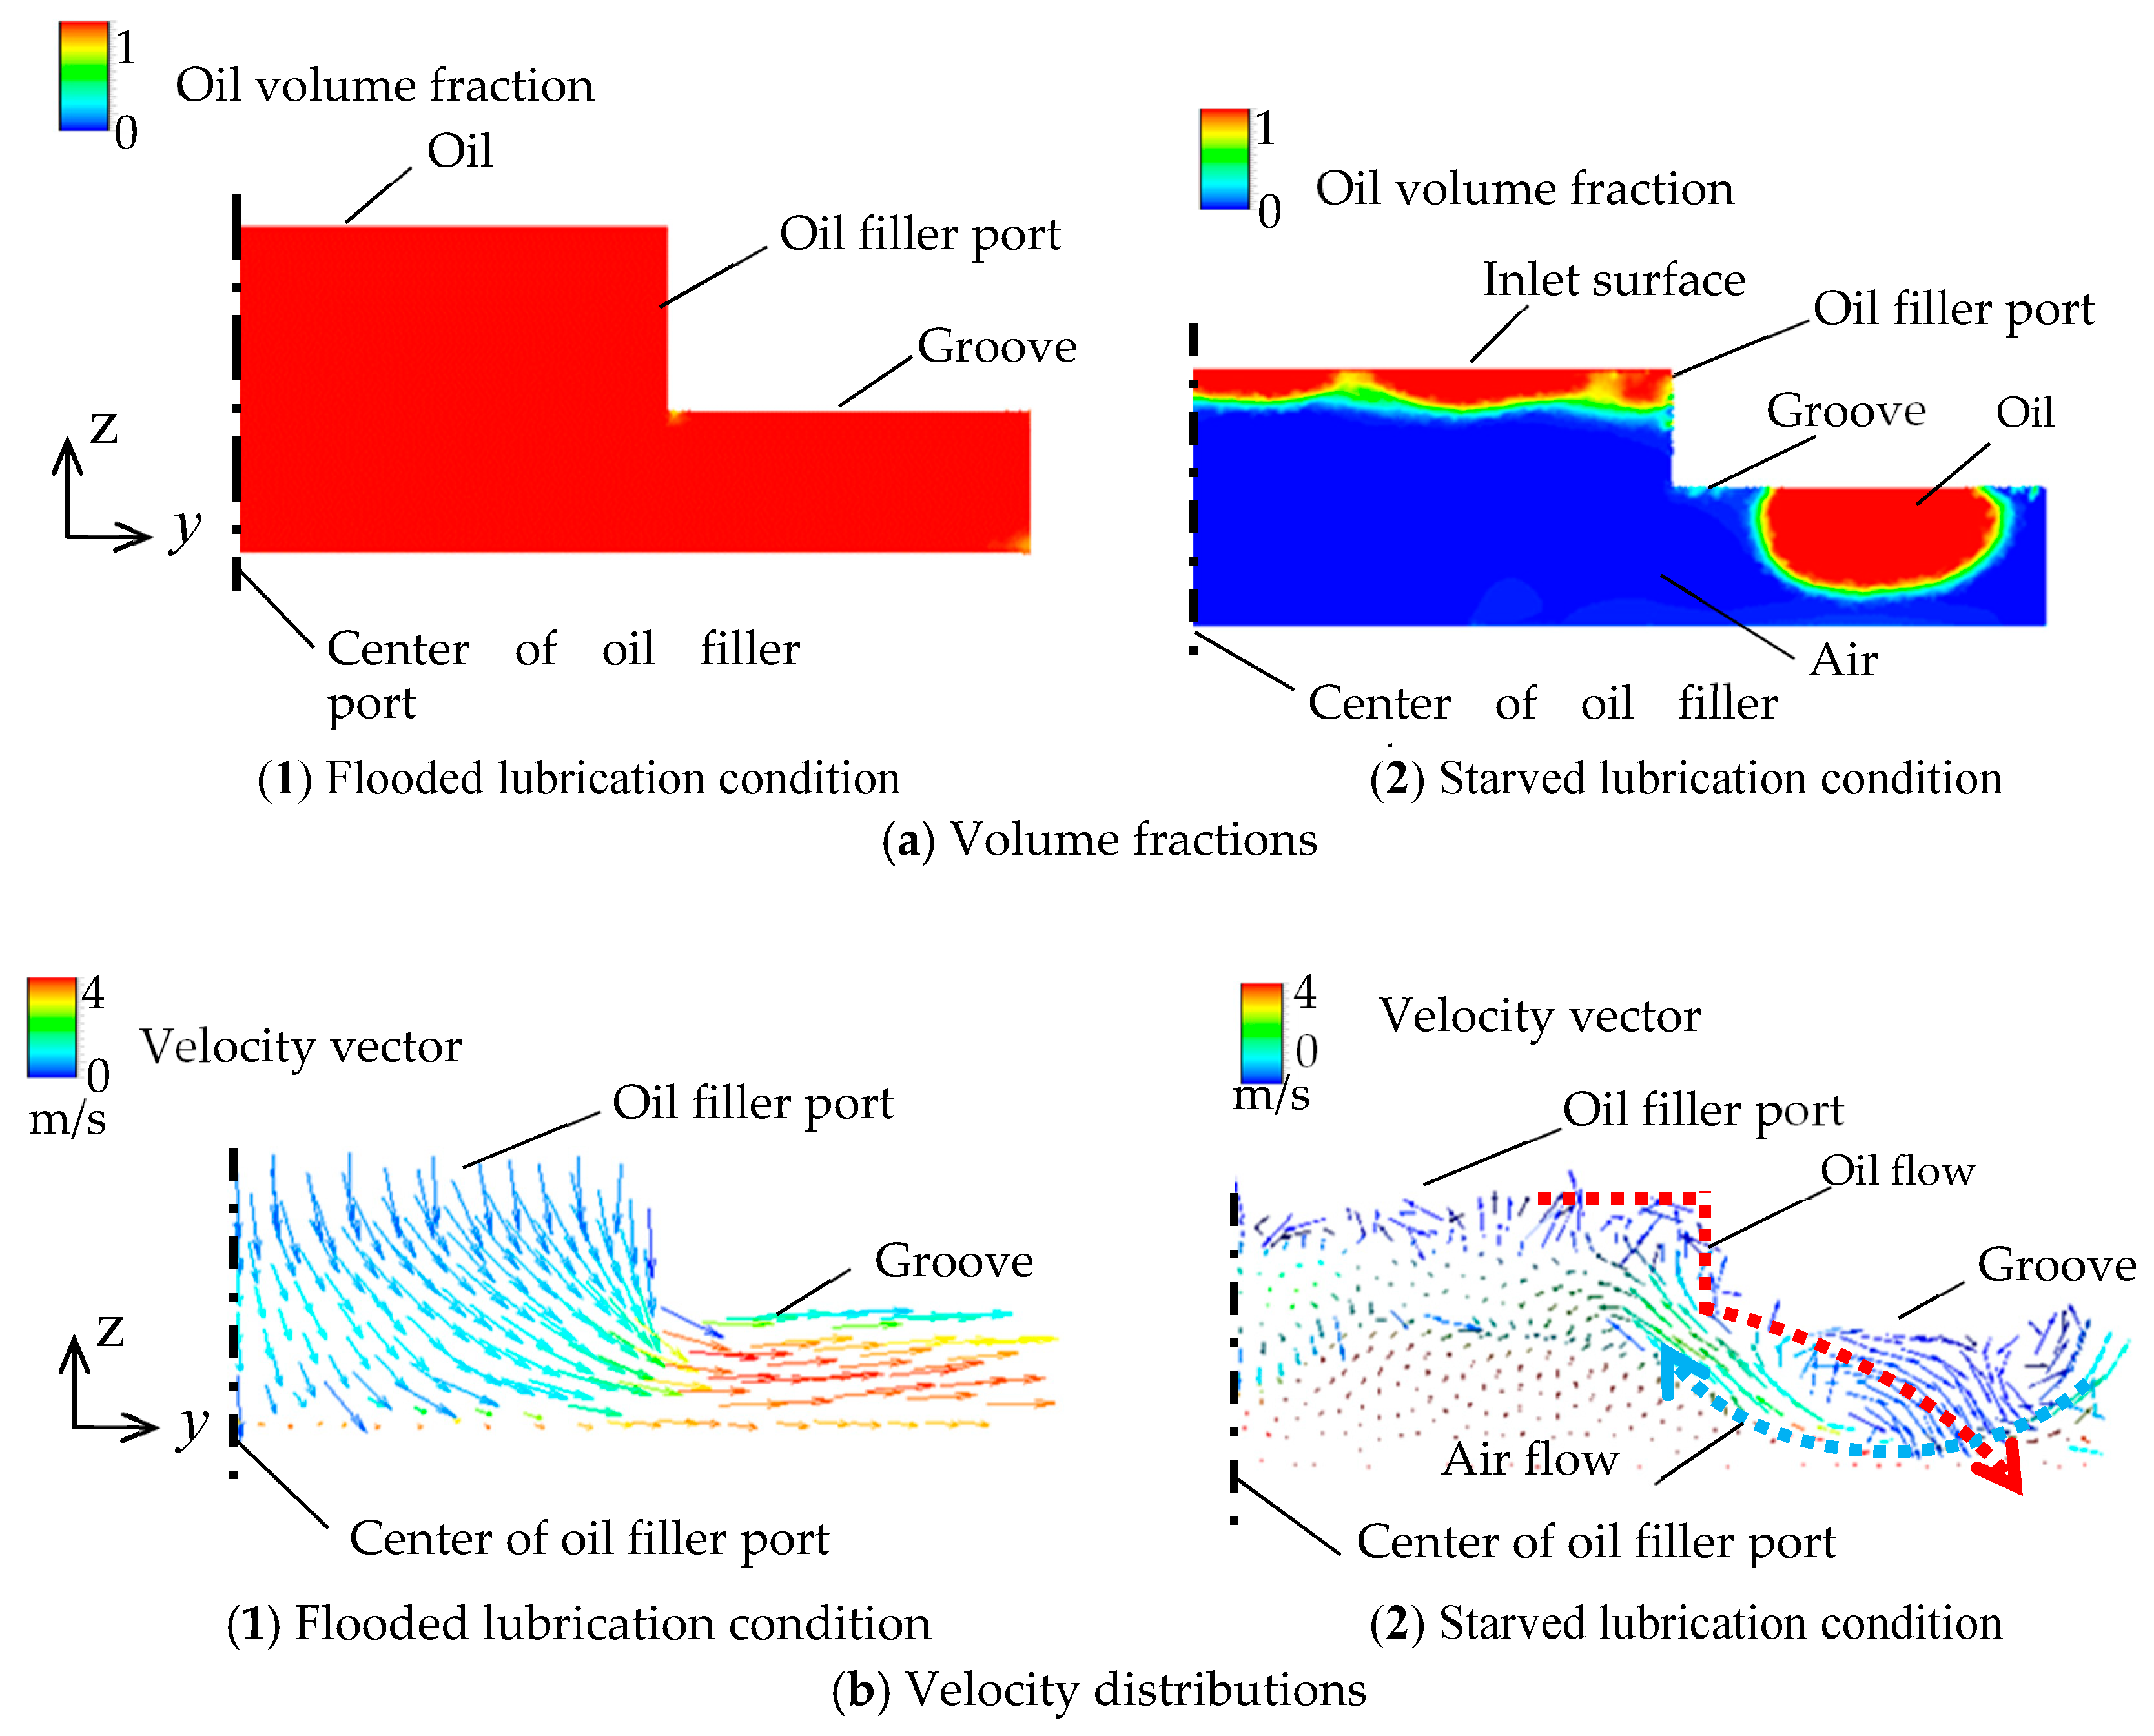
From these results, in the case of flooded lubrication conditions, it is considered that the gaseous-phase of analysis condition with surface tension and without surface tension do not greatly differ because the Weber number We of flooded lubrication conditions is larger than the starved lubrication conditions. On the other hand, in the case of starved lubrication condition, the oil flow of the oil-filler port is directly influenced by the surface tension, so it is considered that the gaseous-phase of the upstream region remarkably changed.

6. Conclusions

In this study, gaseous-phase areas in journal bearings under flooded and starved lubrication conditions were analyzed while using two-phase flow CFD analysis. Further, the influence of surface tension and vapor settings on journal-bearing analysis were studied. The analytical results were compared with the experimental results, and the VOF calculation was observed to be in good agreement while considering the vapor pressure and surface tension under both lubrication conditions. Furthermore, under starved lubrication, the gaseous-phase area exhibited the same tendency during the analysis and the experiment, and the analytical results agree rather well with the interface of the oil film and cavitation during oil-film rupture. While using these results, CFD analysis of the two-phase flow of VOF with vapor pressure and surface tension allowed for the calculation of the cavitation area of the journal bearing under flooded and starved lubrication conditions. Moreover, it was found that the oil flow of the oil-filler port was directly influenced by the surface tension, so it is considered that the gaseous phase of the upstream region remarkably changed.

Author Contributions

M.O., H.H., and F.S. equally contributed to planning this research. M.O. and F.S. equally contributed to writing this report. Numerical analysis and experiment were performed by F.S.

Funding

This research received no external funding.

Conflicts of Interest

The authors declare no conflict of interest.

References

  1. Hashimoto, H.; Ochiai, M. Stabilization method for small-bore journal bearing utilizing starved lubrication. ASME J. Tribol. 2010, 132, 1–7. [Google Scholar] [CrossRef]
  2. Naruse, Y.; Ochiai, M. Experimental study of safety supply flow rate on a small bore cylindrical journal sliding bearing. J. Adv. Sci. 2012, 24, 24–28. [Google Scholar] [CrossRef]
  3. Heshmat, H.; Pinkus, O. Performance of starved journal bearings with oil ring lubrication. ASME J. Tribol. 1985, 107, 23–31. [Google Scholar] [CrossRef]
  4. Gümbel, L.; Everling, E. Reibung und Schmierung im Maschinenbau. Gebundene Ausgade 1925, 80–82. [Google Scholar]
  5. Swift, W.H. The stability of lubricating films in journal bearings. In Minutes of the Proceedings of the Institution of Civil Engineers; Thomas Telford-ICE Virtual Library: London, UK, 1932; Volume 233, pp. 267–288. [Google Scholar]
  6. Coyne, J.C.; Elrod, H.G. Condition for the rupture of a lubricating film Part i: Theoretical model. ASME J. Lubr. Technol. 1970, 92, 451–456. [Google Scholar] [CrossRef]
  7. Coyne, J.C.; Elrod, H.G. Condition for the rupture of a lubricating film Part ii: New boundary conditions for Reynolds equation. ASME J. Lubr. Technol. 1971, 93, 156–167. [Google Scholar] [CrossRef]
  8. Ikeuchi, K.; Mori, H. Hydrodynamic lubrication in seals with cavitation: 1st report, effect of cavity pressure on lubricating film. Bull. JSME 1982, 25, 1002–1007. (In Japanese) [Google Scholar] [CrossRef]
  9. Ikeuchi, K.; Mori, H. An analysis of the lubricating films in journal barings—Effects of oil supply condition on the static performance. Lubrication 1982, 27, 533–540. (In Japanese) [Google Scholar]
  10. Boncompine, R.; Fillon, M.; Frene, J. Analysis of thermal effects in hydrodynamics bearing. ASME J. Tribol. 1986, 108, 219–224. [Google Scholar] [CrossRef]
  11. Hatakenaka, K.; Tanaka, M.; Sizuki, K. Thermo-hydrodynamic performance of journal bearings with partial reverse flow and finger-type cavitation being considered. J. Jpn Soc. Tribol. 2000, 45, 628–635. (In Japanese) [Google Scholar]
  12. Hashimoto, H.; Ochiai, M. Experimental study on the stabilization of small-bore journal bearings by controlling starved lubrication and bearing orientation angle. ASME J. Tribol. 2009, 131, 011705. [Google Scholar] [CrossRef]
  13. Sakai, F.; Ochiai, M.; Hashimoto, H. Stability characteristics and CFD analysis of two-phase flow of oil film journal bearing having two oil filler holes. Trans. JSME 2017, 83, 16-00457. (In Japanese) [Google Scholar]
  14. Schnerr, G.H.; Sauer, J. Physical and numerical modeling of unsteady cavitation dynamics. In Proceedings of the 4th International Conference on Multiphase Flow, New Orleans, LA, USA, 27 May–1 June 2001. [Google Scholar]
  15. Ohta, M.; Sakai, M.; Shimada, N.; Honma, S. Numerical Simulation of Multiphase Flow; Maruzen-publishing: Tokyo, Japan, 2015. (In Japanese) [Google Scholar]
  16. Zhai, L.M.; Luo, Y.Y.; Wang, Z.W. Study about the influence of cavitation on the dynamic characteristics for the sliding bearing. IOP Conf. Ser. Mater. Sci. Eng. 2015, 72, 1–10. [Google Scholar] [CrossRef]
  17. Dhande, Y.D.; Pande, W.D. Multiphase flow analysis of hydrodynamic journal bearing using CFD coupled Fluid Structure Interaction considering cavitation. J. King Sand Univ. Eng. Sci. 2016, 30, 345–354. [Google Scholar] [CrossRef]
  18. Egbers, C.; Gorenz, P.; Schmidt, M.; Wolf, C. 3-D CFD simulation of the lubrication film in a journal bearing. Tribol. Int. 2008, 76, 40–47. [Google Scholar] [CrossRef]
  19. Olsson, E.; Kreiss, G.; Zahedi, S. A conservative level set method for two phase flow II. J. Comput. Phys. 2007, 225, 785–807. [Google Scholar] [CrossRef]
  20. Hirt, C.W.; Nichols, B.D. Volume of fluid (VOF) method for the dynamics of free boundaries. J. Comput. Phys. 1981, 39, 201–225. [Google Scholar] [CrossRef]
  21. Tryggvasona, G.; Bunner, B.; Esmaeelic, A.; Juricd, D.; Al-Rawahi, D.; Tauber, W.; Han, J.; Nas, S.; Jan, Y.-J. A front-tracking method for the computations of multiphase flow. J. Comput. Phys. 2001, 169, 708–759. [Google Scholar] [CrossRef]
  22. Bogdan, R.K.; Abdollah, A.A. A Lattice-Boltzmann approach to fluid film lubrication. Asme J. Tribol. 2010, 132, 1–7. [Google Scholar]
  23. Brackbill, J.; Douglas, U.; Koth, B.; Zemach, C. A continuum method for modeling surface tension. J. Comput. Phys. 1992, 100, 335–354. [Google Scholar] [CrossRef]
  24. Tanaka, M. Journal bearing performance under starved lubrication. Tribol. Int. 2000, 33, 259–264. [Google Scholar] [CrossRef]
  25. Taura, H.; Kaneko, S. Static characteristics of journal bearings under starved lubricating conditions. Trans. Jpn. Soc. Mech. Eng. C 2011, 77, 3511–3521. [Google Scholar] [CrossRef]
Figure 1. Geometry of the test journal bearing.
Lubricants 07 00074 g001
Figure 2. Geometry of an experimental test rig.
Lubricants 07 00074 g002
Figure 3. Calculation model of the journal bearing.
Lubricants 07 00074 g003
Figure 4. Visualization results of the flooded lubrication conditions.
Lubricants 07 00074 g004
Figure 5. Contour of oil volume fraction of bearing clearance under flooded lubrication condition.
Lubricants 07 00074 g005
Figure 6. Pressure distributions under the flooded-lubrication condition.
Lubricants 07 00074 g006
Figure 7. Visualization results of the flooded lubrication conditions.
Lubricants 07 00074 g007
Figure 8. Contour of oil volume fraction of bearing clearance under starved lubrication condition.
Lubricants 07 00074 g008
Figure 9. Pressure distributions under the starved lubrication condition.
Lubricants 07 00074 g009
Figure 10. Visualization result of the oil film rupture under starved lubrication.
Lubricants 07 00074 g010
Figure 11. Contour of volume fraction of the oil-film rupture.
Lubricants 07 00074 g011
Figure 12. Visualization result of the oil-filler port under the flooded lubrication condition.
Lubricants 07 00074 g012
Figure 13. Analytical results of inner flow of oil-filler port.
Lubricants 07 00074 g013
Figure 14. Relationship between Weber number and bearing clearance.
Lubricants 07 00074 g014
Figure 15. Relationship between Weber number and amount of supply oil.
Lubricants 07 00074 g015
Table 1. Specifications of bearing.
Diameter D, [mm]25.0
Length L, [mm]14.5
Clearance Cr, [mm]0.125
Diameter of oil filler hole Dp, [mm]8.2
Table 2. Calculation conditions.
Multiphase ModelVolume of Fluid
Calculation ProcedureImplicit Method
Calculation conditionsVaporization pressure Pv [Pa]0
Surface tension S [N/m]0.04
Fluid propertyDensity ρ [kg/m3]Oil860
Air1.23
Viscosity μ [Pa·s]Oil0.019
Air1.75 × 10 −5

