Ablation-Dominated Arcs in CO2 Atmosphere—Part II: Molecule Emission and Absorption


1
Leibniz Institute for Plasma Science and Technology (INP), Felix-Hausdorff-Str. 2, 17489 Greifswald, Germany
2
Institute for High Voltage Technology, RWTH Aachen University, Schinkelstrasse 2, 52056 Aachen, Germany
*
Author to whom correspondence should be addressed.
†
These authors contributed equally to this work.
Energies 2020, 13(18), 4720; https://doi.org/10.3390/en13184720
Submission received: 11 August 2020
/
Revised: 4 September 2020
/
Accepted: 9 September 2020
/
Published: 10 September 2020
(This article belongs to the Special Issue Environmental Compatible Circuit Breaker Technologies)
Abstract
:Molecule radiation can be used as a tool to study colder regions in switching arc plasmas like arc fringes in contact to walls and ranges around current zero (CZ). This is demonstrated in the present study for the first time for the case of ablation-dominated high-current arcs as key elements of self-blast circuit breakers. The arc in a model circuit breaker (MCB) in CO with and an arc in a long nozzle under ambient conditions with peak currents between 5 and 10 kA were studied by emission and absorption spectroscopy in the visible spectral range. The nozzle material was polytetrafluoroethylene (PTFE) in both cases. Imaging spectroscopy was carried out either with high-speed cameras or with intensified CCD cameras. A pulsed high-intensity Xe lamp was applied as a background radiator for the broad-band absorption spectroscopy. Emission of Swan bands from carbon dimers was observed at the edge of nozzles only or across the whole nozzle radius with highest intensity in the arc center, depending on current and nozzle geometry. Furthermore, absorption of C Swan bands and CuF bands were found with the arc plasma serving as background radiator. After CZ, only CuF was detected in absorption experiments.
1. Introduction
Self-blast circuit breakers represent one of the main technologies for high-current interruption at high voltage. After contact separation, intense radiation emitted from the high-current arc leads to a considerable photo-ablation of the surrounding nozzle which causes a pressure buildup and finally a strong gas flow necessary for arc quenching around current zero (CZ) [1,2]. Polytetrafluoroethylene (PTFE) is typically used as the nozzle material and SF as the filling gas. However, the substitution of the greenhouse gas SF by more environmentally-friendly gases like CO is an actual trend. The pressure buildup due to strong arc radiation and nozzle ablation, as well as the arc quenching processes, are key issues of the successful current breaking and have been subject to a large number of scientific studies. The main questions concern the properties of the arc and the hot gas regions like temperatures and species densities which are required for a sufficient understanding of the processes. Optical methods, like emission and absorption spectroscopy, can provide such quantities under the demand that arc and hot gas regions are optically accessible. However, an optical access can only be realized by adapted construction of specific model circuit breakers (MCB) or by appropriate model experiments [3,4,5].
Meanwhile, a sufficiently good knowledge of the arc properties during the high-current phase and in the high-temperature regions (above 6000 K) of the arc has been developed from spectroscopic studies of switching arc experiments and MCBs (see e.g., [3]). This is because atomic and ionic species dominate in the high-temperature regions and generate an intense spectral line radiation which can be well used for the determination of temperature and species densities [6,7,8]. However, the analysis of low-temperature regions of the arc fringes, of the regions near nozzle walls and of the temporal phase of arc quenching is much more challenging due to low line radiation intensities.
The investigation of the phase around current zero by optical emission spectroscopy (OES) and the determination of arc temperatures during the arc quenching as close as possible to CZ was a topic of our accompanying paper [9]. An MCB using CO as a filling gas and a PTFE-nozzle experiment under ambient air were used for the analysis of line radiation of oxygen and fluorine atoms as well as of carbon ions. Both setups will also be used in this study and explained shortly in Section 2.
It is well-known from composition calculations of thermal plasmas that the dissociation of filling gases like SF and CO, reactions with the ablation product CF and metal vapor from electrode erosion can produce a number of molecular species in an intermediate temperature range before an almost complete dissociation of atoms occurs at higher temperatures (see e.g., [10]). Mixtures of CO with higher amount of CF are expected to contain considerable amounts of molecules at temperatures above 3000 K, namely CF, CF, CF, CF, C, C, CF, and CO (in order of dissociation with increasing temperatures) [11]. Hence, the study of molecule radiation can help to analyze the interesting ranges of lower temperatures near the nozzle boundaries and in the arc quenching phases. Unfortunately, there is a very low number of such studies for arcs in corresponding gas mixtures and particularly for switching arcs.
Interesting candidates for the study of molecule radiation are the Swan bands of the C molecule (around 500 nm) or the violet band of CN (around 385 nm) because of the relatively intense radiation in the optical range. Emission and absorption spectroscopy of the C radiation have been used for example to study the structure of carbon arcs for nanoparticle synthesis [12,13,14]. The radiation of CN was analyzed in a study of the arc ablation of organic materials in ambient air with close relation to low-voltage switching [15]. Furthermore, both molecules have been more intensely studied in plasmas produced by laser ablation or in the laser-induced breakdown [16,17,18,19,20].
The occurrence of C molecules is expected in switching arcs in CO atmosphere or in the case of ablation of PTFE or organic wall materials. However, most of the recent research on Swan bands C was carried out by laser-induced breakdown spectroscopy. In case of lower laser irradiance, the production of C molecules is dominated by excitation of larger molecules like C, C with electrons followed by photo-defragmentation, delivering exited C molecules. In case of higher power, excitation resulting from electron–ion and ion–ion recombination dominates [16]. The intensity distribution of the emission pattern varies depending on pressure and temperature. Thus, an estimation of the vibrational temperature can be realized by comparison of measured and simulated spectra [17,19]. Temperatures in a thermal argon plasma interacting with various insulating plastic materials at magnetically-forced arc movement [21] and temperature decay of thermal plasmas caused by polymer ablation using inductively coupled plasma irradiation [22] were investigated experimentally and numerically. As an example of a switching arc study, the absorption spectrum of the C Swan bands was analyzed in a low-voltage circuit breaker model [23]. An arc moving between polyethylene walls was considered, and the density and the rotational temperature of the C molecules were determined from the absorption spectrum, which indicates the ablation of the plastic walls. Reports on the analysis of molecule radiation, the C Swan bands in particular, in high-voltage switching experiments as representative for high-voltage circuit breakers are missing so far.
During the OES study of an MCB and a nozzle experiment described in our first paper [9], molecule radiation of C and CuF was recorded under different conditions and to some extent in unexpected ranges of the arc. The occurrence of strong temperature gradients in the arc are already known as well as a number of molecules that might be expected to appear favorably at lower temperatures, i.e., either in the vicinity to the nozzle walls or at low currents. However, the occurrence of molecular species has been described by theoretical models (see, e.g., [11]), with a lack of experimental confirmation in many cases. In the present paper, it should be shown that some molecules are detectable under strongly varying conditions. The molecule CuF is expected when copper vapor from the electrode erosion is mixed with the dissociated PTFE vapor from the nozzle ablation [10]. The results for molecule emission and absorption should be given in this second paper in detail. The aim is to demonstrate the occurrence of molecule radiation as a possible candidate to characterize low-temperature regions in self-blast circuit breakers as well as ablation processes. However, the determination of quantities like rotational temperatures and densities is out of the scope of the present paper. The MCB and nozzle experiment setups will be presented shortly in Section 2 together with the setup for spectroscopic measurements because details can be found in [9]. Results are given in Section 3 followed by a discussion in Section 4.
2. Materials and Methods
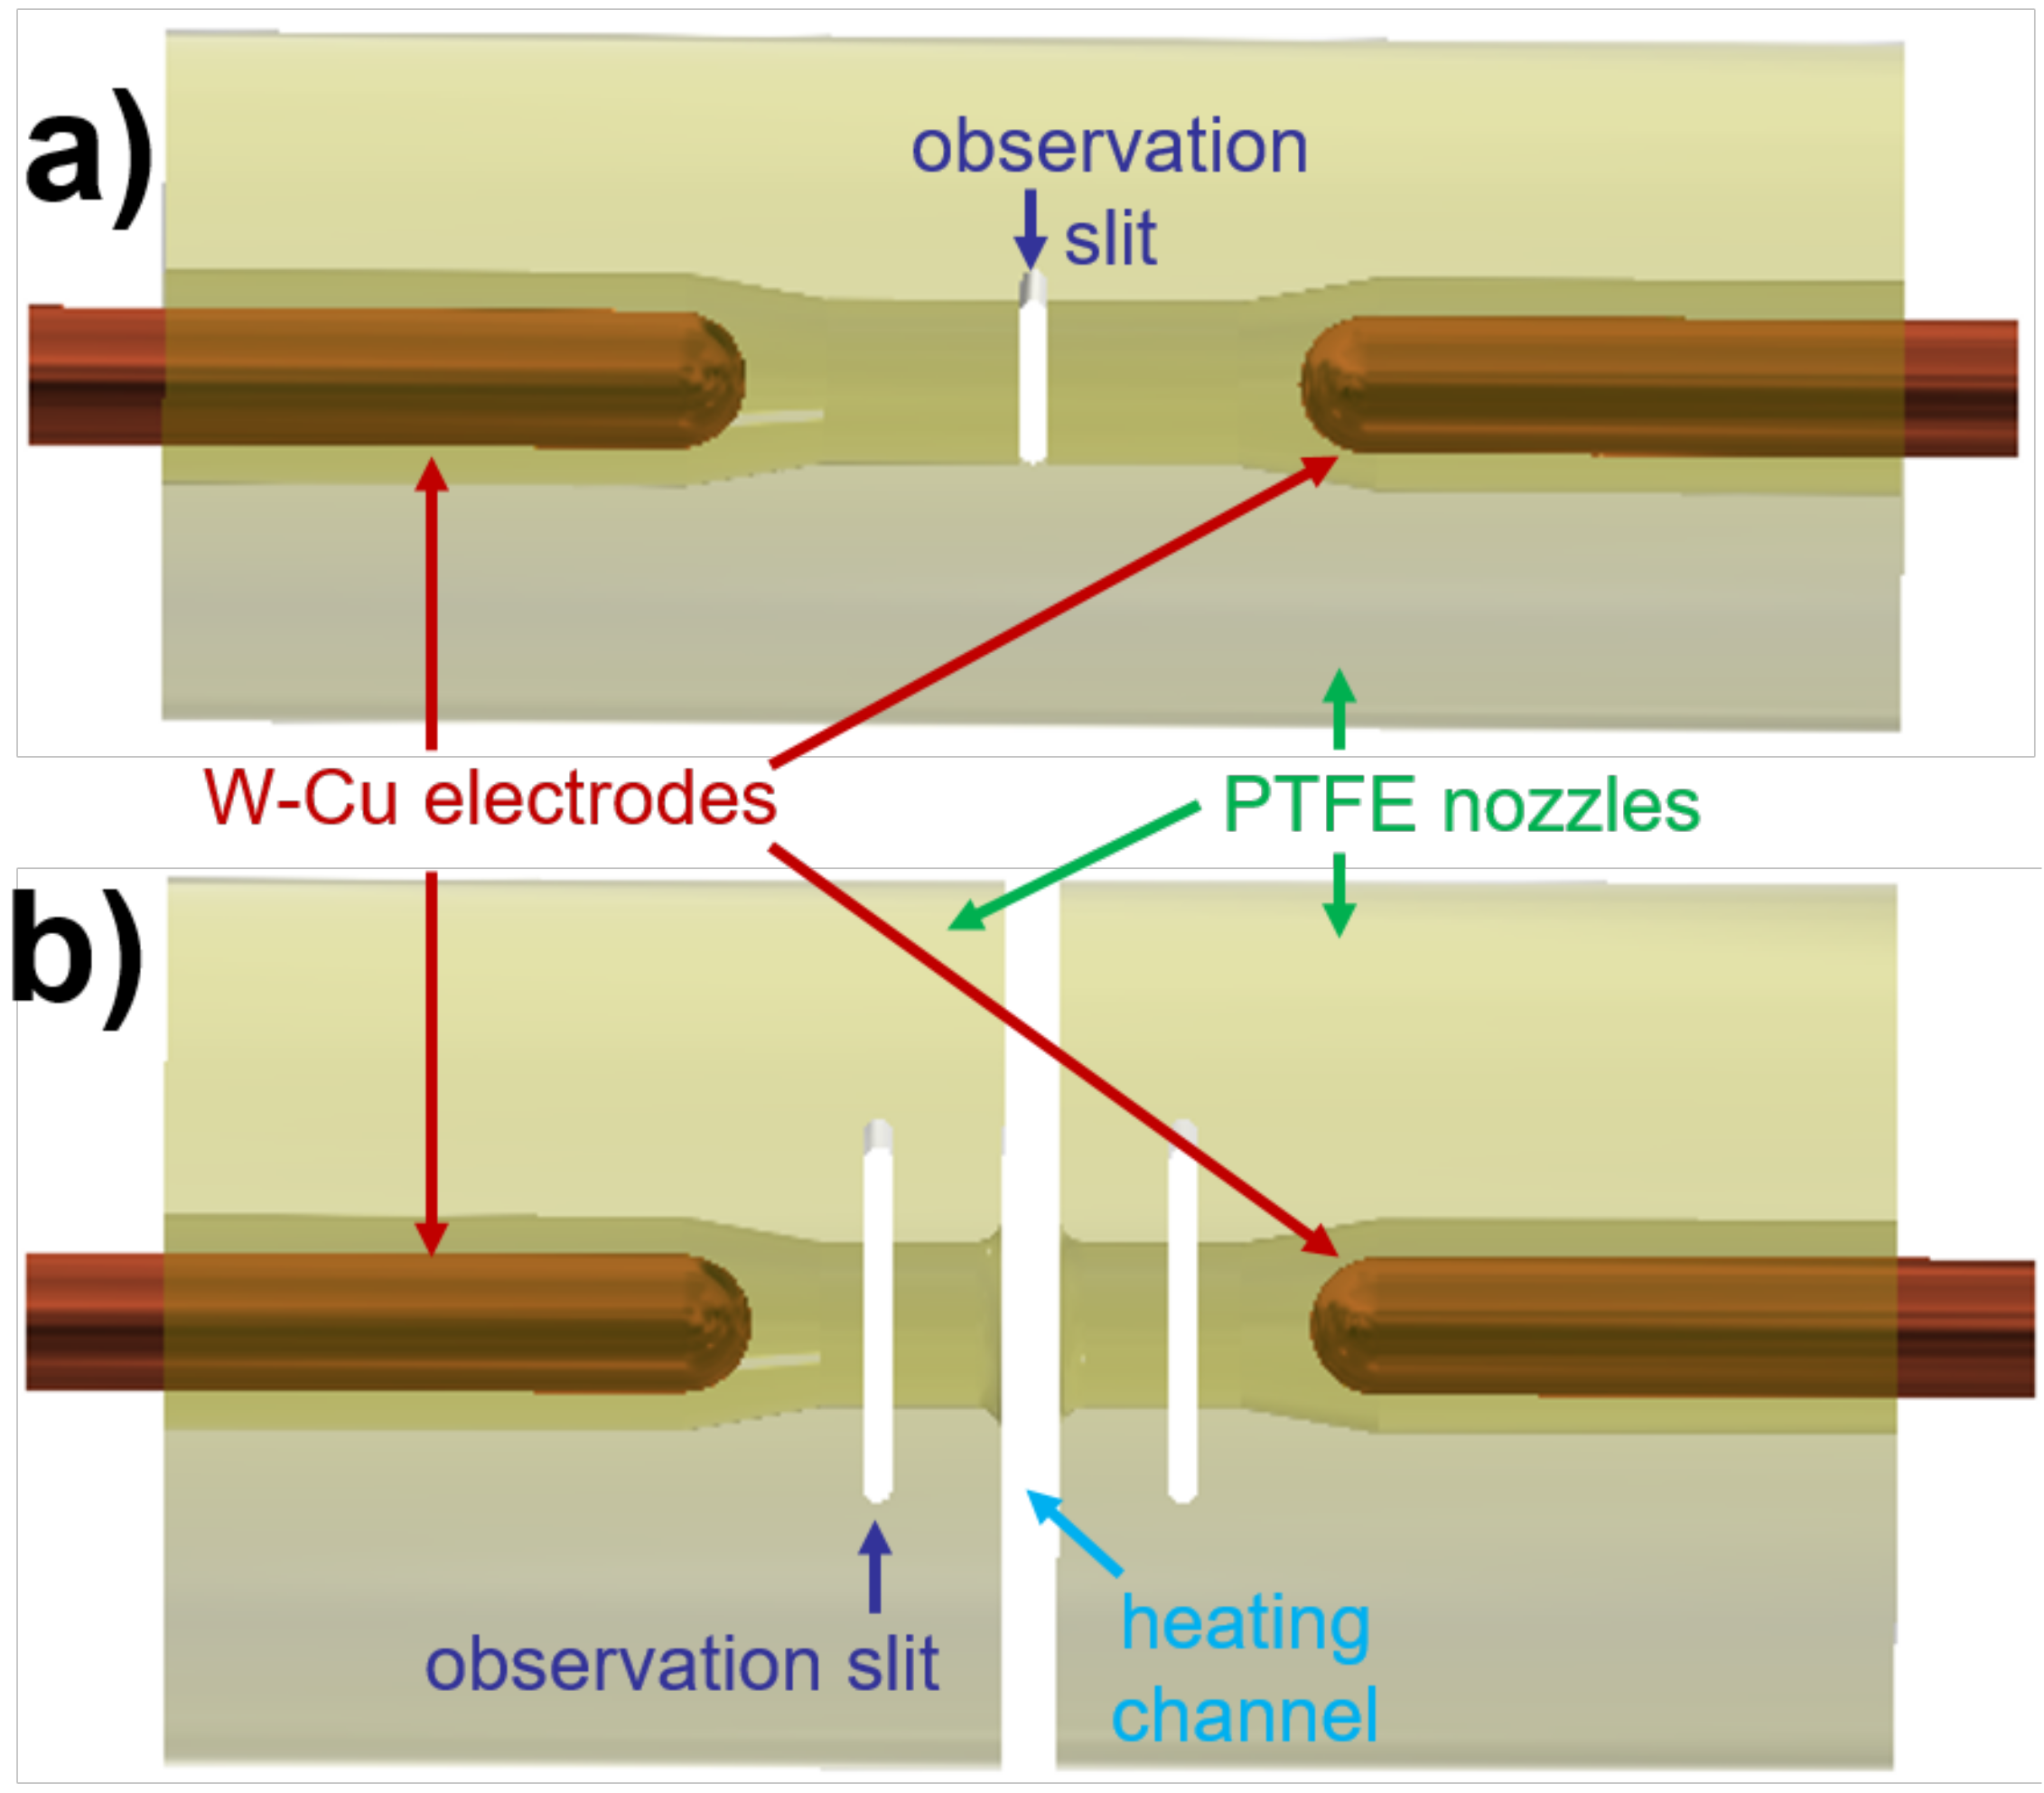
Two setups of electrodes and nozzles were used. They are described in detail in an accompanying paper [9]; basic features are sketched in Figure 1. Actually, the majority of experiments described in this paper were carried out with setup (b) and only a few with setup (a). The electrodes were made of W–Cu with a 10 mm diameter and had a fixed distance of 40 mm. Nozzles made of PTFE doped with <0.5 wt% molybdenum disulfide (MoS) with an inner diameter of 12 mm were placed around the electrodes: Either setup (a) was applied with one 126 mm long, tubular-shaped nozzle of 50 mm outer diameter for strong ablation and high pressure built-up or setup (b) was used with two nozzles of about 50 mm length and 104 mm outer diameter separated by 4 mm distance to form a heating channel. At the electrode positions, the nozzle diameter was increased to about 16 mm for an exhaust gas flow.
The arcs were operated either under ambient conditions (setup (a)) or in a vessel filled with 1 bar CO (setup (b)) as part of a model circuit breaker similar to [3]. Windows in both the model chamber and the vessel allowed a free view through the nozzle and hence absorption experiments.
Sine-like currents were applied for setup (a) with about 100 Hz frequency and 11 kA peak current. For setup (b) with 50 Hz and 5.3 kA. Thin Cu wires were used to initiate the arc discharges. Currents were measured using Rogowski coils. In case of setup (b), a pressure sensor (603 A from Kistler) was placed in the heating volume of the model circuit breaker.
Optical access was realized by vertical slits of 2 mm width that were sealed by 2 mm-thick quartz plates, ranging over the complete nozzle diameter. After each shot, the sealing plates were checked visually and exchanged; the transmission was measured regularly. Pairwise placement at opposite positions enabled background illumination and absorption measurements. For setup (a) the observation slits were placed in the middle between both electrodes. In setup (b), the observation point was positioned in one of the nozzles at half distance between electrode tip and nozzle exhaust, i.e., ∼9 mm away from both.
Different methods were applied for the optical analysis. Firstly, high-speed cameras (HSC) from Integrated Design Tools (IDT) were used to observe the general discharge behavior: Y6 with 24-bits color or Y4 with 10-bits monochrome. Secondly, optical emission spectroscopy was carried out by means of an imaging spectrograph with 0.5 m focal length (Roper Acton SpectraPro SP2500i). The nozzle slit was imaged on the entrance slit of the spectrograph to spectrally investigate arc cross sections, i.e., perpendicular to the arc axis. Using the spectrograph with Y4 HSC enabled to record series of 2D-spectra with typical repetition rates of 100 s (frame rate 10 kfps), allowing rather long exposure times up to 98 s that were necessary due to limited camera sensitivity. Alternatively, the HSC could be replaced by an intensified CCD camera (PI-MAX4 from Princeton Instruments) with higher sensitivity, allowing single frame acquisition of shorter exposure times even at lower intensities, e.g., around current zero. In a compromise between light intensity, spectral resolution, and exposure time, the entrance slit of the spectrograph was set to 50 m. With gratings of 150 lines per mm for overview and 1800 L/mm for detailed spectra, the spectral range was 150 nm and 10 nm and the spectral resolution 0.3 nm and <0.1 nm, respectively. The intensity of side-on spectra was calibrated in units of spectral radiance by means of a tungsten strip lamp (OSRAM Wi 17/G) at the arc position. The window transmission of 50–70% was taken into account, mainly resulting from the coating of the quartz plates at the nozzles.
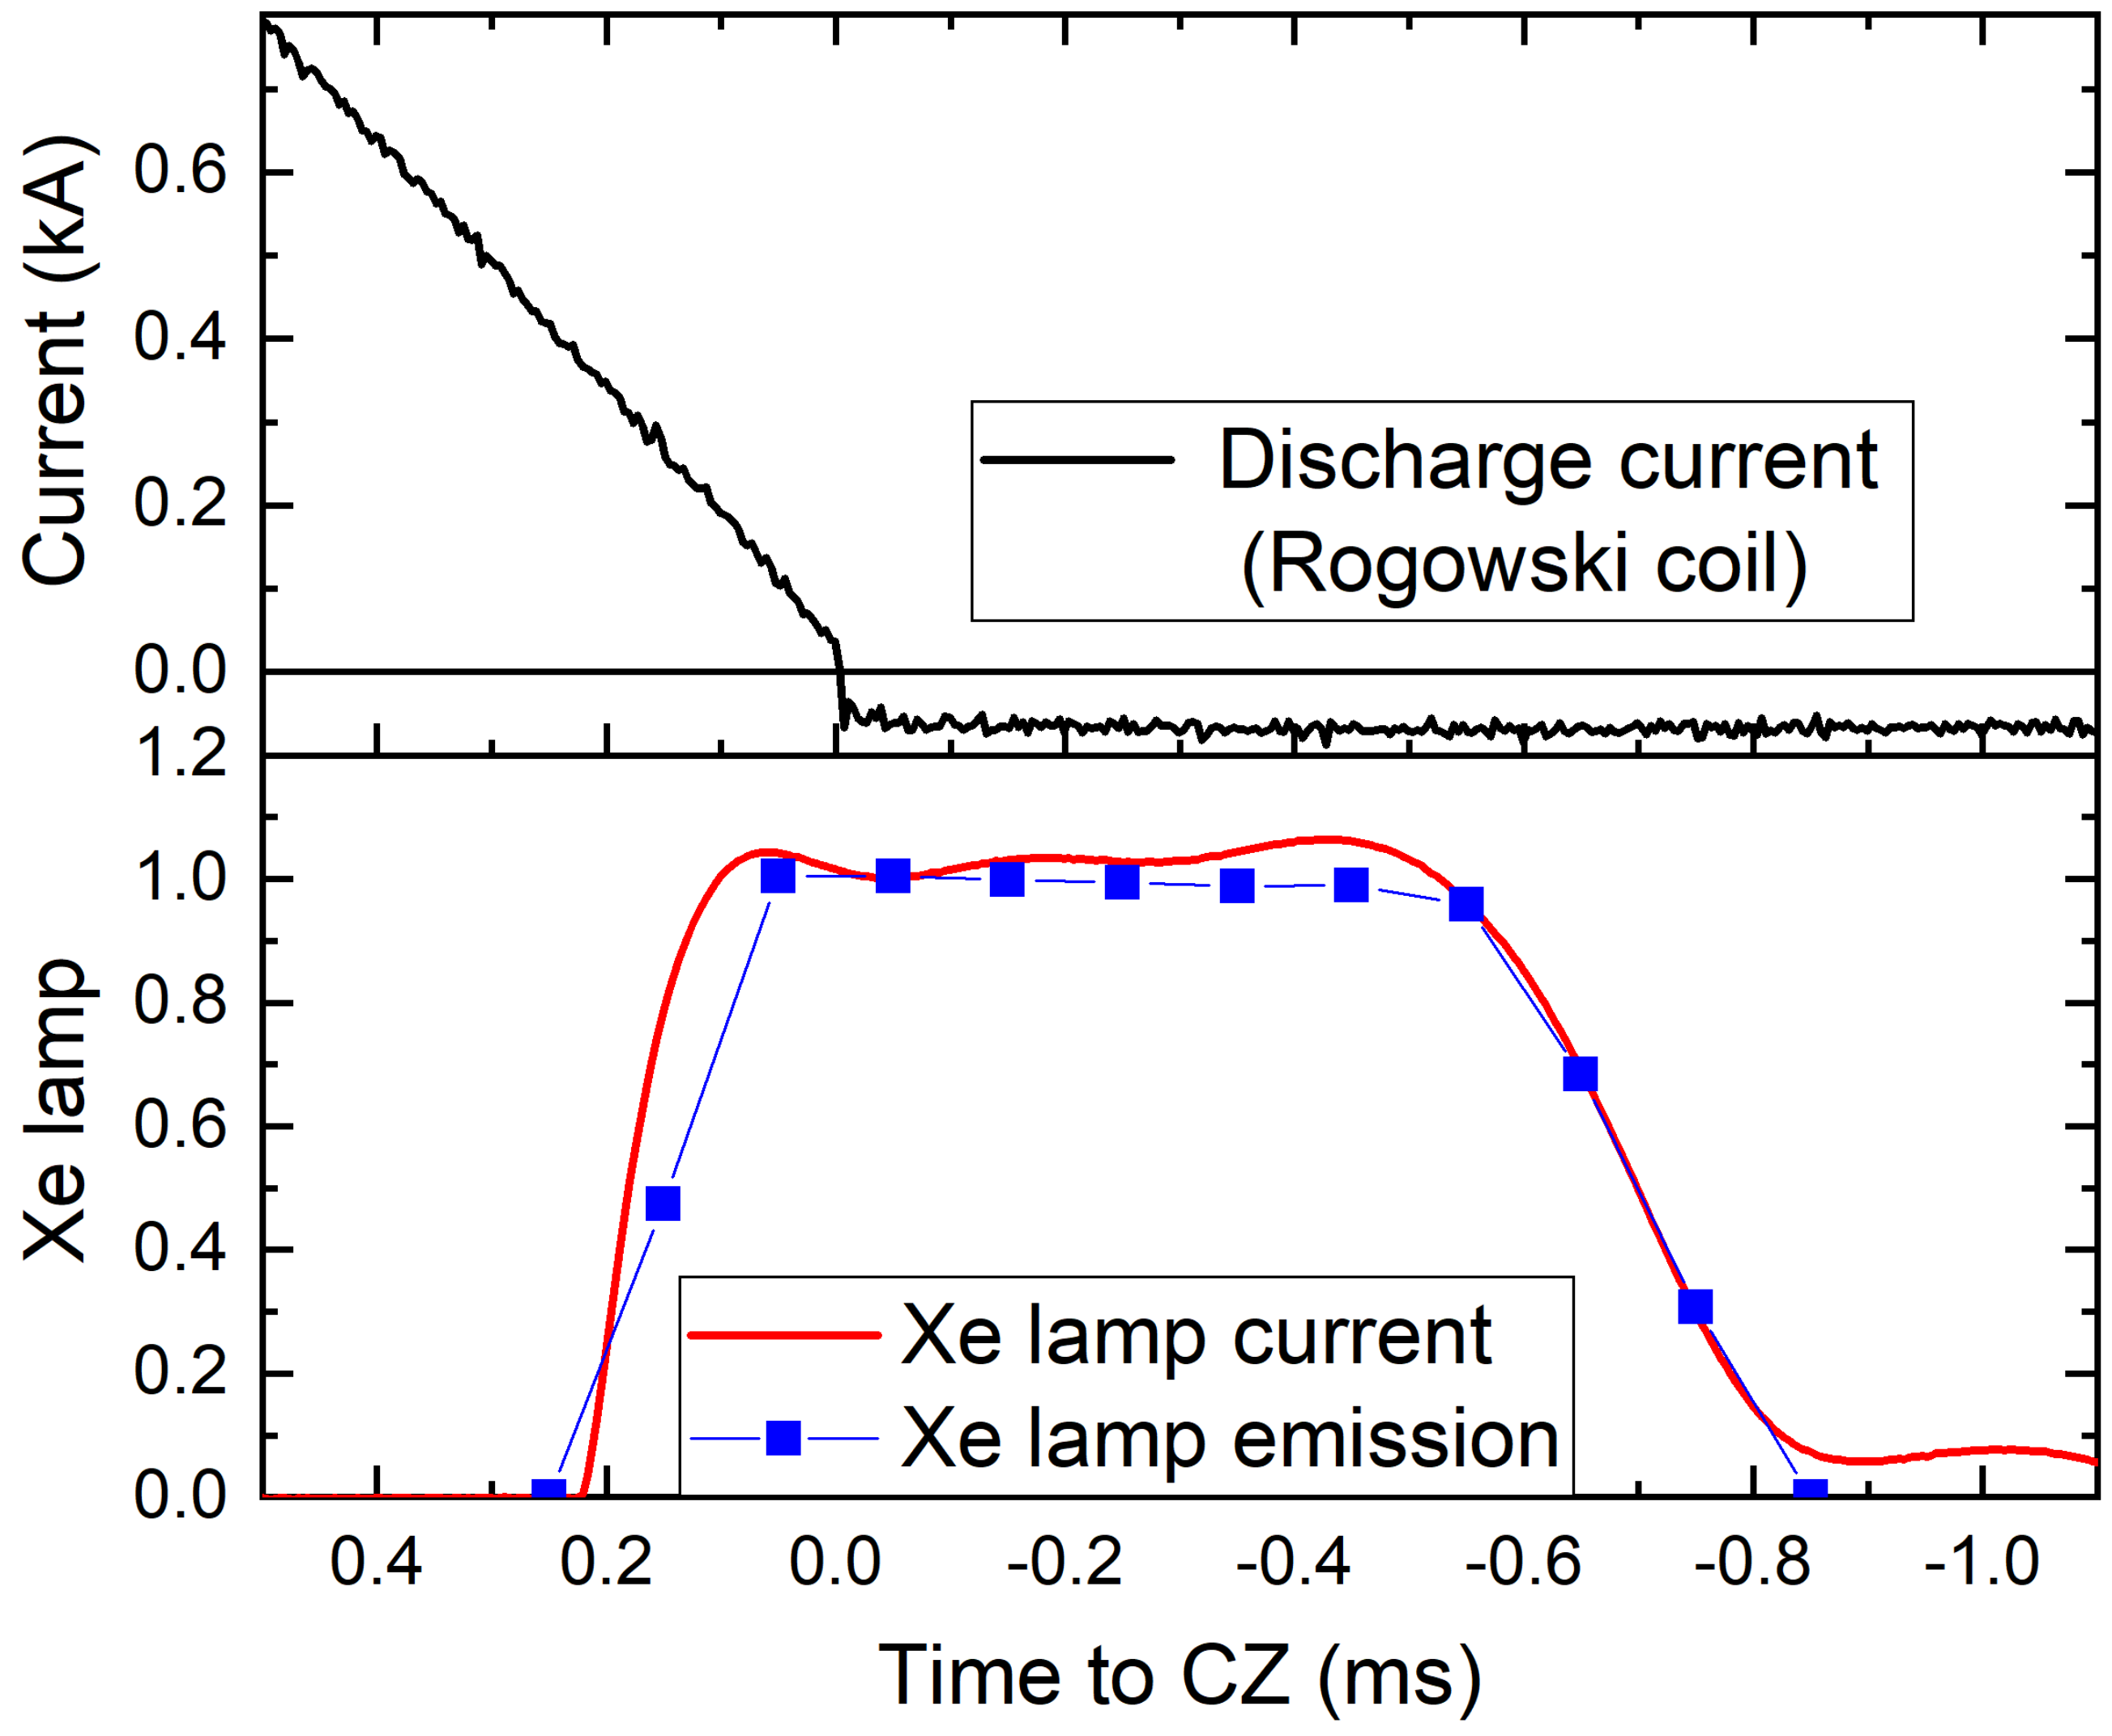
Thirdly, broadband absorption spectroscopy was carried out around CZ. Therefore, a background illumination was required with radiances higher or comparable to the emission of the arc. It was supplied by a pulsed high-intensity xenon lamp with a radiance similar to a Planckian radiator of 12,000 K [24]. The square-shaped pulse had about 1 ms-width at about 1 MW electric power, delivering a nearly constant emission intensity during the plateau phase.
Figure 2 shows exemplary current waveforms of the arc discharge around current zero (top, offset after CZ is caused by the Rogowski coil) and the quasi-rectangular pulsed current of the xenon lamp (bottom, red) as well as the spectrally integrated intensity measured by video spectroscopy (spectral range 400–800 nm). Since the electric pulse feeding the Xe-lamp was not perfectly rectangular, a heating phase of the xenon lamp could be observed. Thus, several Xe atomic lines were found in the first 100–200 s of the 1 ms-pulse before a transition towards the 12,000 K-continuum emission. Additionally, with decreasing current also the emission intensity decreased. Hence, for the OAS analysis only the lamp’s plateau phase was applied with a duration of about 700 s. This relatively long, stable phase allowed for temporal investigation of absorption, e.g., compared to Z-pinches with some 10 s of varying radiation intensity as used in [23].
3. Results
In order to avoid doubling, some more general results that were already described and discussed in the accompanying paper will not be repeated here. That relates to electrical waveforms, temporal evolution of pressure and plasma composition in the nozzle, and video observation by HSC with and without filtering. Additionally, only selected moments from the overview video spectroscopy were shown that are mandatory for the discussion of molecule emission and absorption. It should be noted that, for easier comparison, all points in time are given with respect to the current zero crossing.
First, experiments in the MCB (setup (b)) with the sine-like current up to 5.3 kA are considered. The arc voltage was around 200 V (after peak caused by the explosion of ignition wire) until the arc extinction peak some hundred s before CZ. The total pressure in the nozzle started from a filling pressure of 1.0 bar to a maximum of 3.5 bar close to peak current and decreased to about 2.0 bar at current zero. After ignition, an arc discharge in CO atmosphere was observed, also containing copper from ignition wire and electrodes. Within the next few hundreds of microseconds, the ablation of the PTFE (CF) wall material started to dominate the discharge, blowing the CO out of the nozzle. In the following, a long and stable period was observed that was dominated by ablation. Another reversal of flow was found about 2 ms before CZ: With decreasing arc current, the wall ablation and thus the pressure in the nozzle decreased to values below that in the heating volume. Hence, relatively cold gas from the heating volume with a high fraction of CO flowed back into the nozzle. In the last ms, only emission from O I was observed, indicating a plasma composition completely dominated by CO.
3.1. Analysis of C Swan Bands
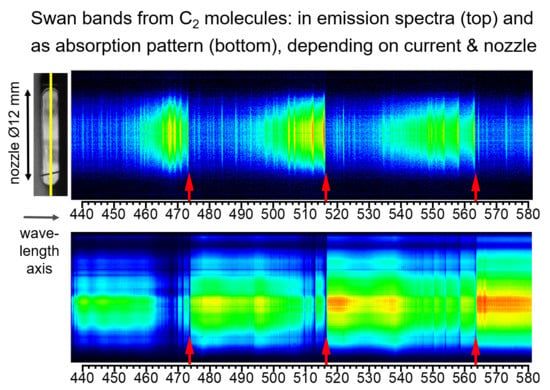
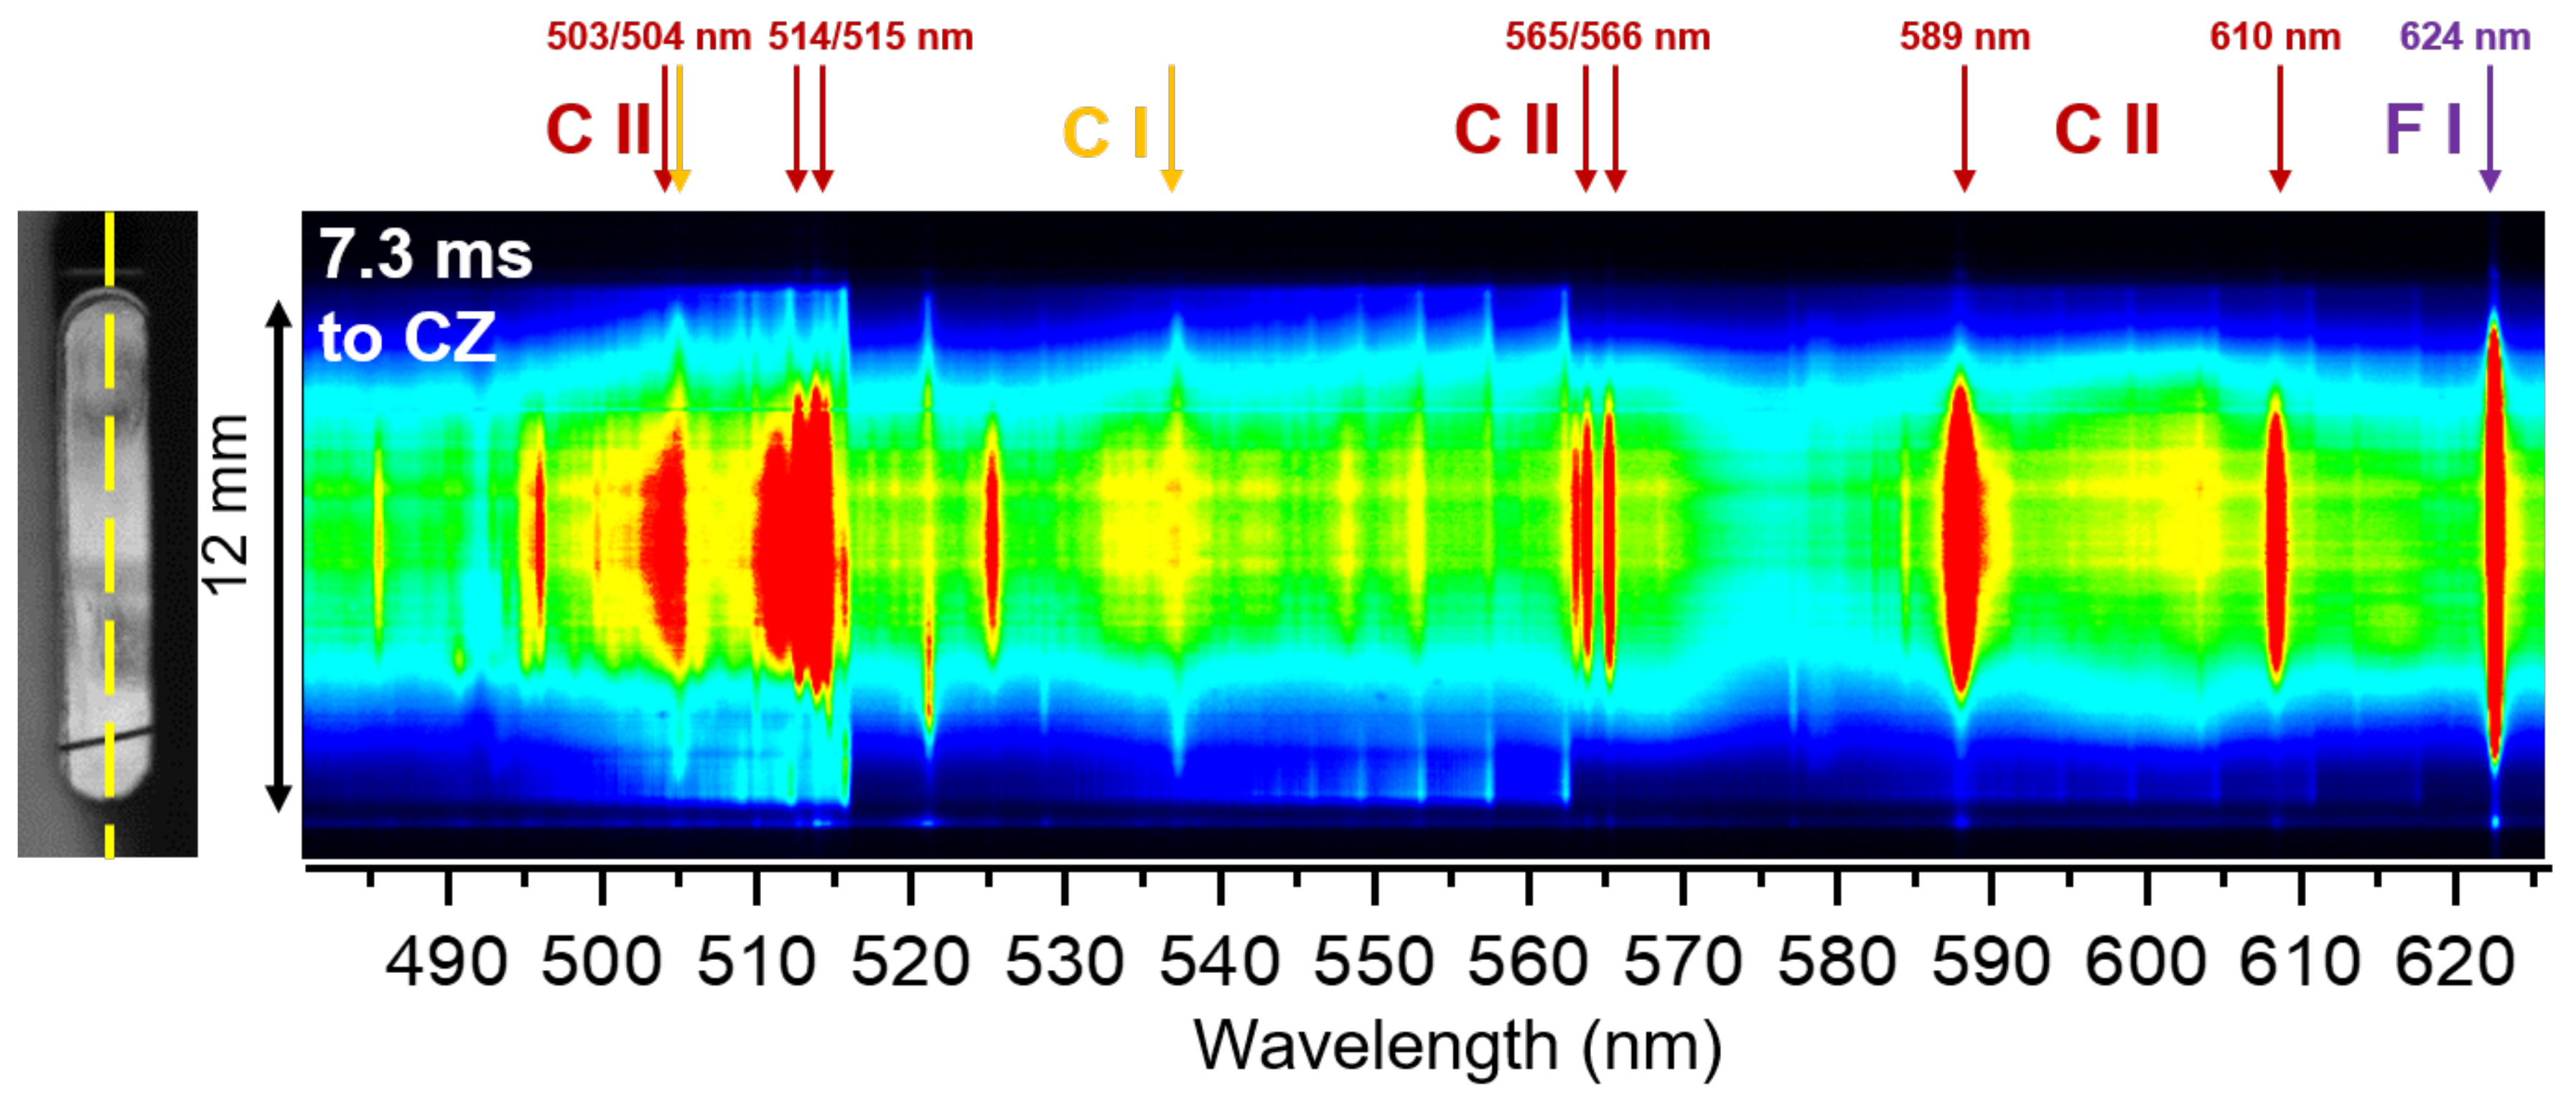
An example of a two-dimensional spectrum is shown in Figure 3. It was acquired with setup (b) shortly before peak current (7.3 ms to CZ). On the left side, an image of the HSC observation area (grey scale image) including the OES axis (yellow dashed line) is shown. The vertical axis represents the position along the observation slit in the nozzle, cf. dashed yellow line in the HSC image on the left side; the horizontal dimension is given by the wavelength in the spectral range ∼480–625 nm. The arc discharge was dominated by wall-ablation at that point in time; no emission from copper or oxygen but lines from atomic fluorine F I and atomic and ionic carbon lines C I, C II could be observed. This radiation was mainly emitted in a broad distribution over the arc cross-section with the highest intensities in central positions, as it is typical for the wall-stabilized arcs with broad and flat temperature profile [9]. However, an additional structure can be recognized with a different lateral distribution: A dense pattern of lines with increasing intensities and numbers towards higher wavelengths with abrupt breaks at positions near 516 and 564 nm, spread over the whole nozzle diameter and partly even with maxima close to the wall. This structure has been attributed to the Swan band system originating from transitions between the electronic states d and a. Four cases of appearance of Swan bands in the discharge will be presented in the following.
Firstly, the Swan bands occurred at the outer edges of the arc preferably close to the nozzle walls as shown in Figure 3. Generally, this can be regarded as typical behavior for cases of moderate PTFE influence, i.e., when current density is not too high and the temperature close to the wall is rather low, allowing the existence of carbon dimers.
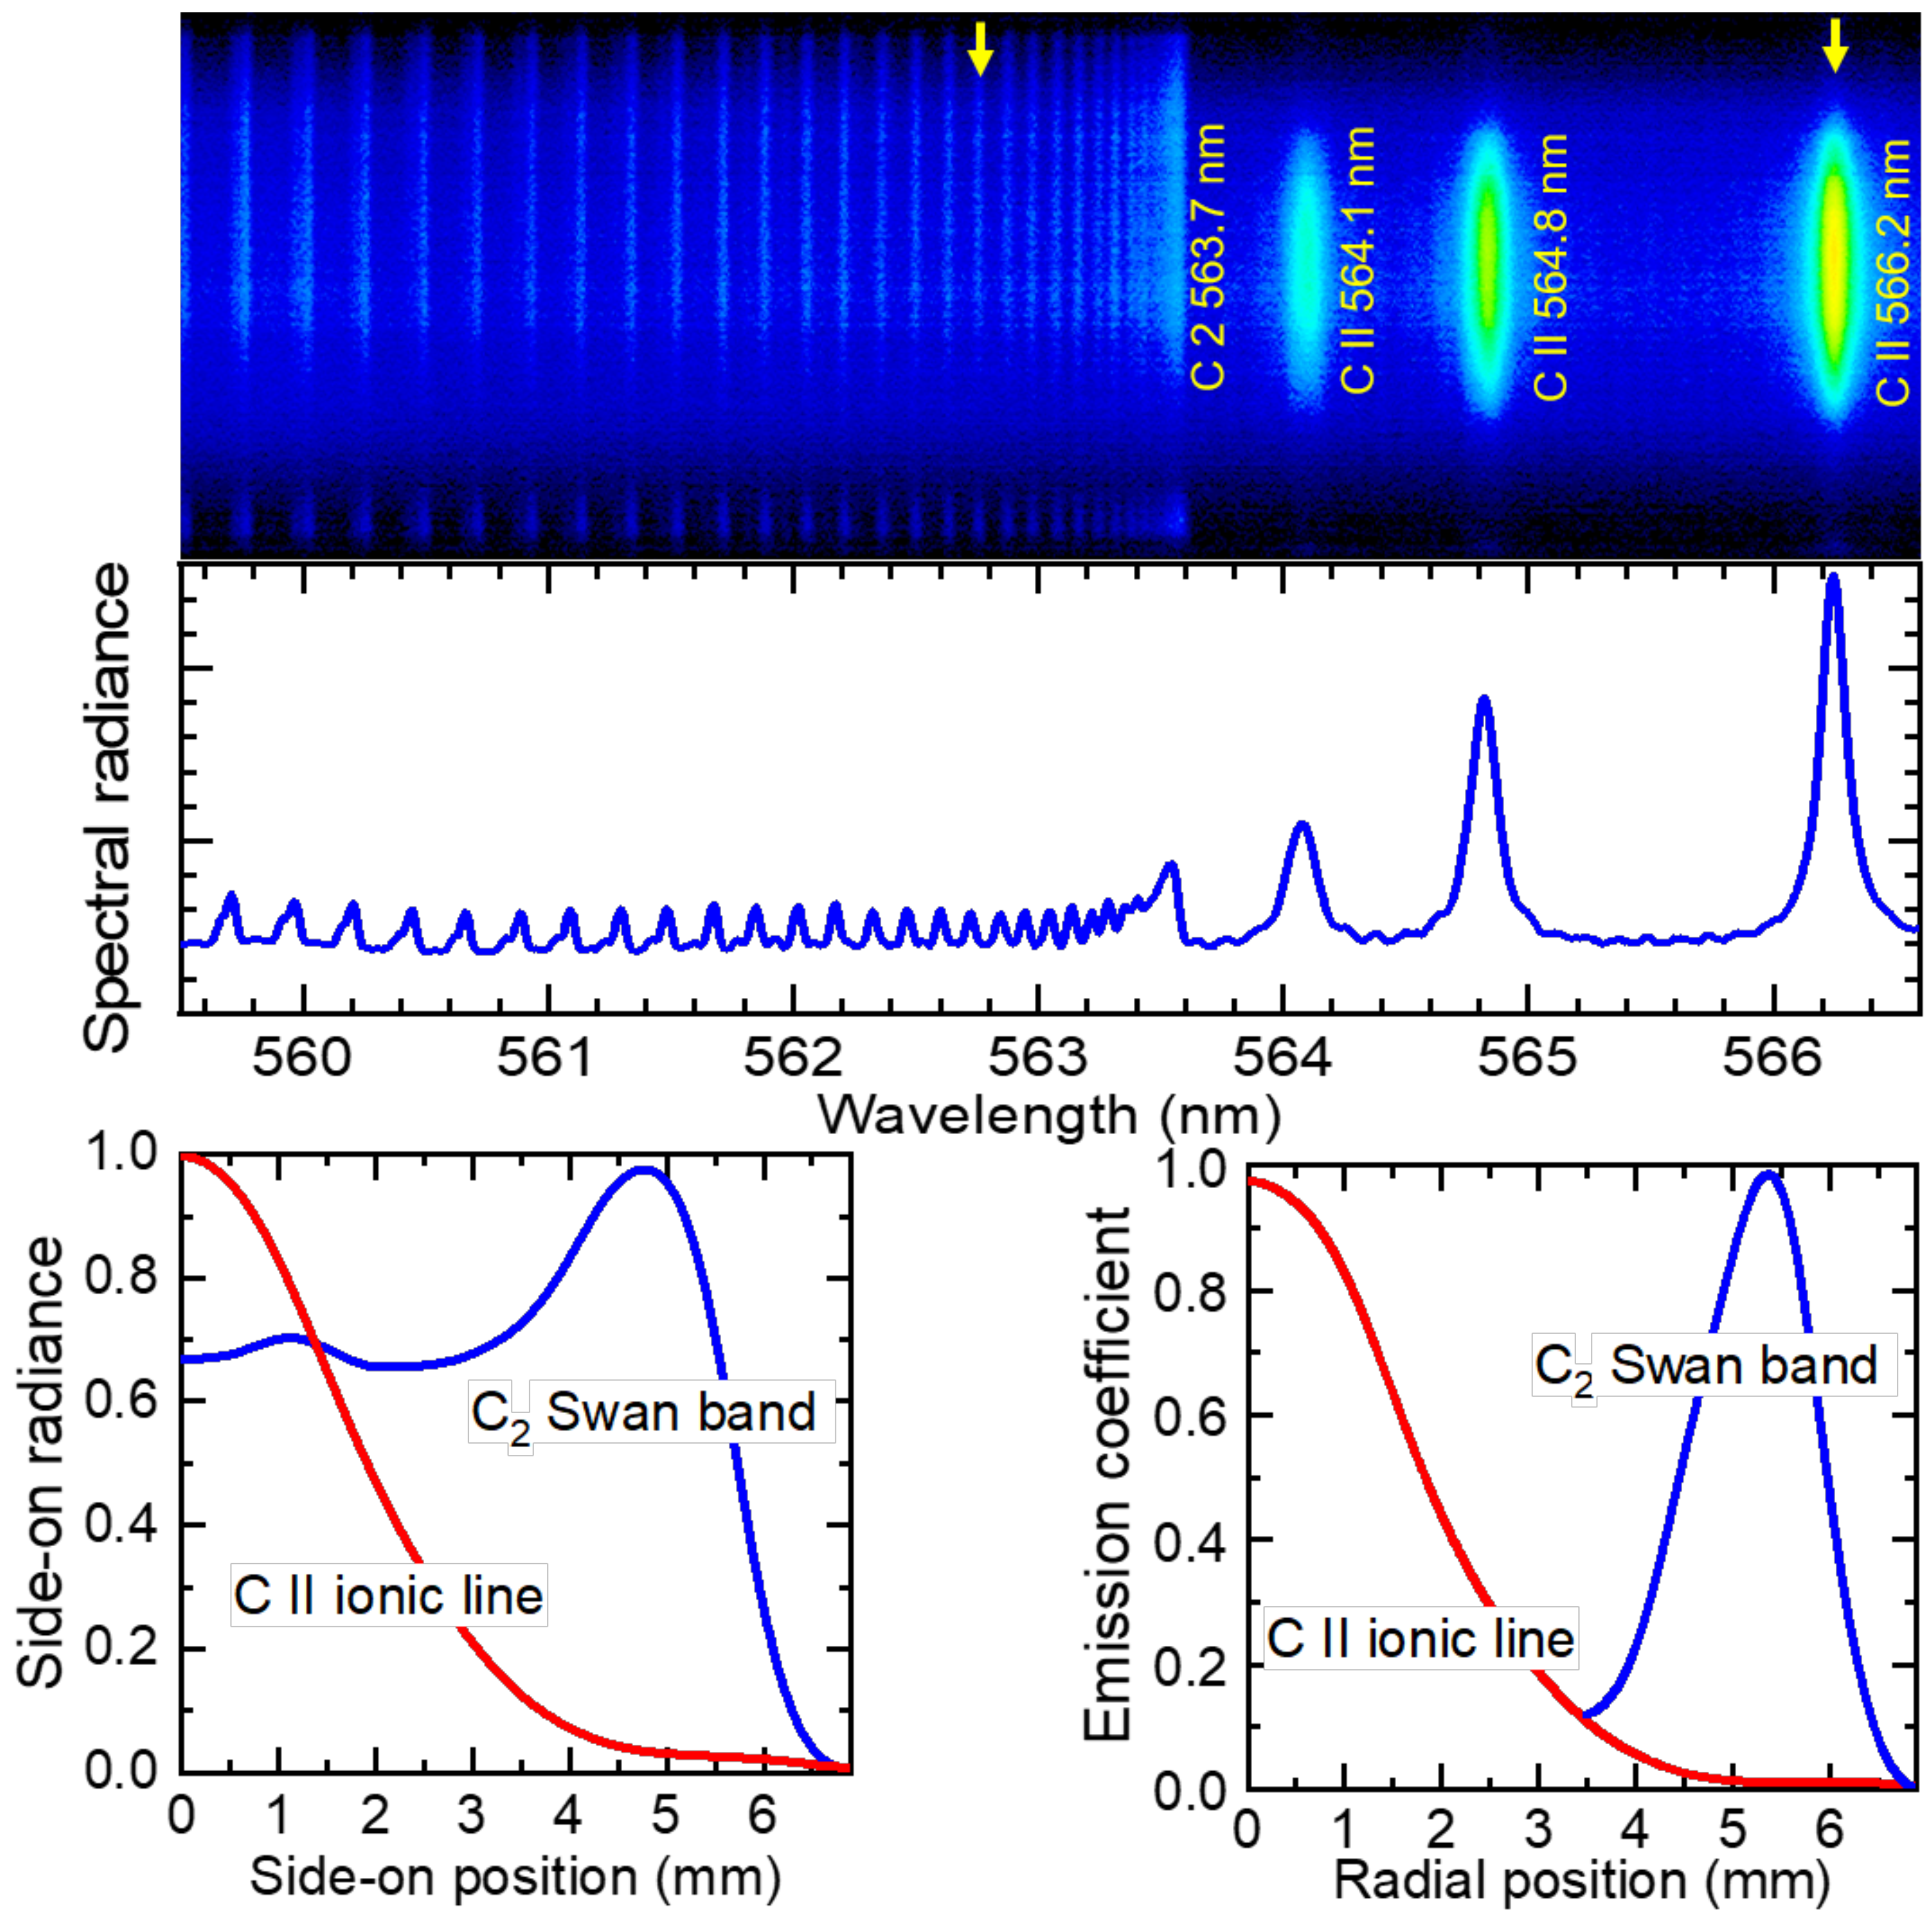
Secondly, other Swan band pattern ws observed over the full vertical axis of the side-on 2D spectra. The example shown in Figure 4 was acquired with setup (b) about 6 ms before CZ, i.e., shortly before the peak current. A grating of 1800 L/mm was applied to obtain higher spectral resolution. A good agreement was found of the 1D-spectrum taken in central position with spectra shown by Camacho in OES investigations on plumes produced by laser ablation of graphite targets [18]. The weaker continuum and stronger C II lines compared to [18] hint on rather high plasma temperatures at least in the arc center with higher current density than near to the wall.
Exemplarily, one of the lines of the C Swan band near 562.8 nm was analyzed; the carbon ionic line at 566.2 nm was used for comparison, cf. yellow arrows in the 2D spectrum. The side-on radiances are shown in the lower-left part of Figure 4: whereas the ionic line has its maximum in the center, the Swan band emission is spread more homogeneously over a wide side-on positions between center and 4 mm but has a distinct maximum near to 5 mm, i.e., near to the wall. Since both emissions showed good symmetry in relation to the center, this axis was used for symmetrization and as the central side-on position “0 mm”. Then, the radial profile of the emission in the arc can be analyzed by Abel inversion of the side-on radiances. Results are shown in the lower right part of Figure 4. The C II 566.2 nm ionic line is emitted as expected mainly in the center; the emission coefficient decreases to 20% within radial positions of 2 mm. The C Swan band, however, has a sharp peak of less than 2 mm FWHM with a maximum emission coefficient below 1 mm to the wall. It should be noted that although the nozzle diameter is 12 mm some intensity was detected at side-on position above 6 mm due to experimental limitations like quartz plate connection and refraction at the windows. The algorithm of inverse Abel transformation is limited in case of very low emission from the central position, therefore the C emission coefficient in the center is not plotted for values below 10% (radial positions < 3.5 mm). To summarize even in the case of Figure 4 the Swan bands are emitted only in a thin sheath at the wall.
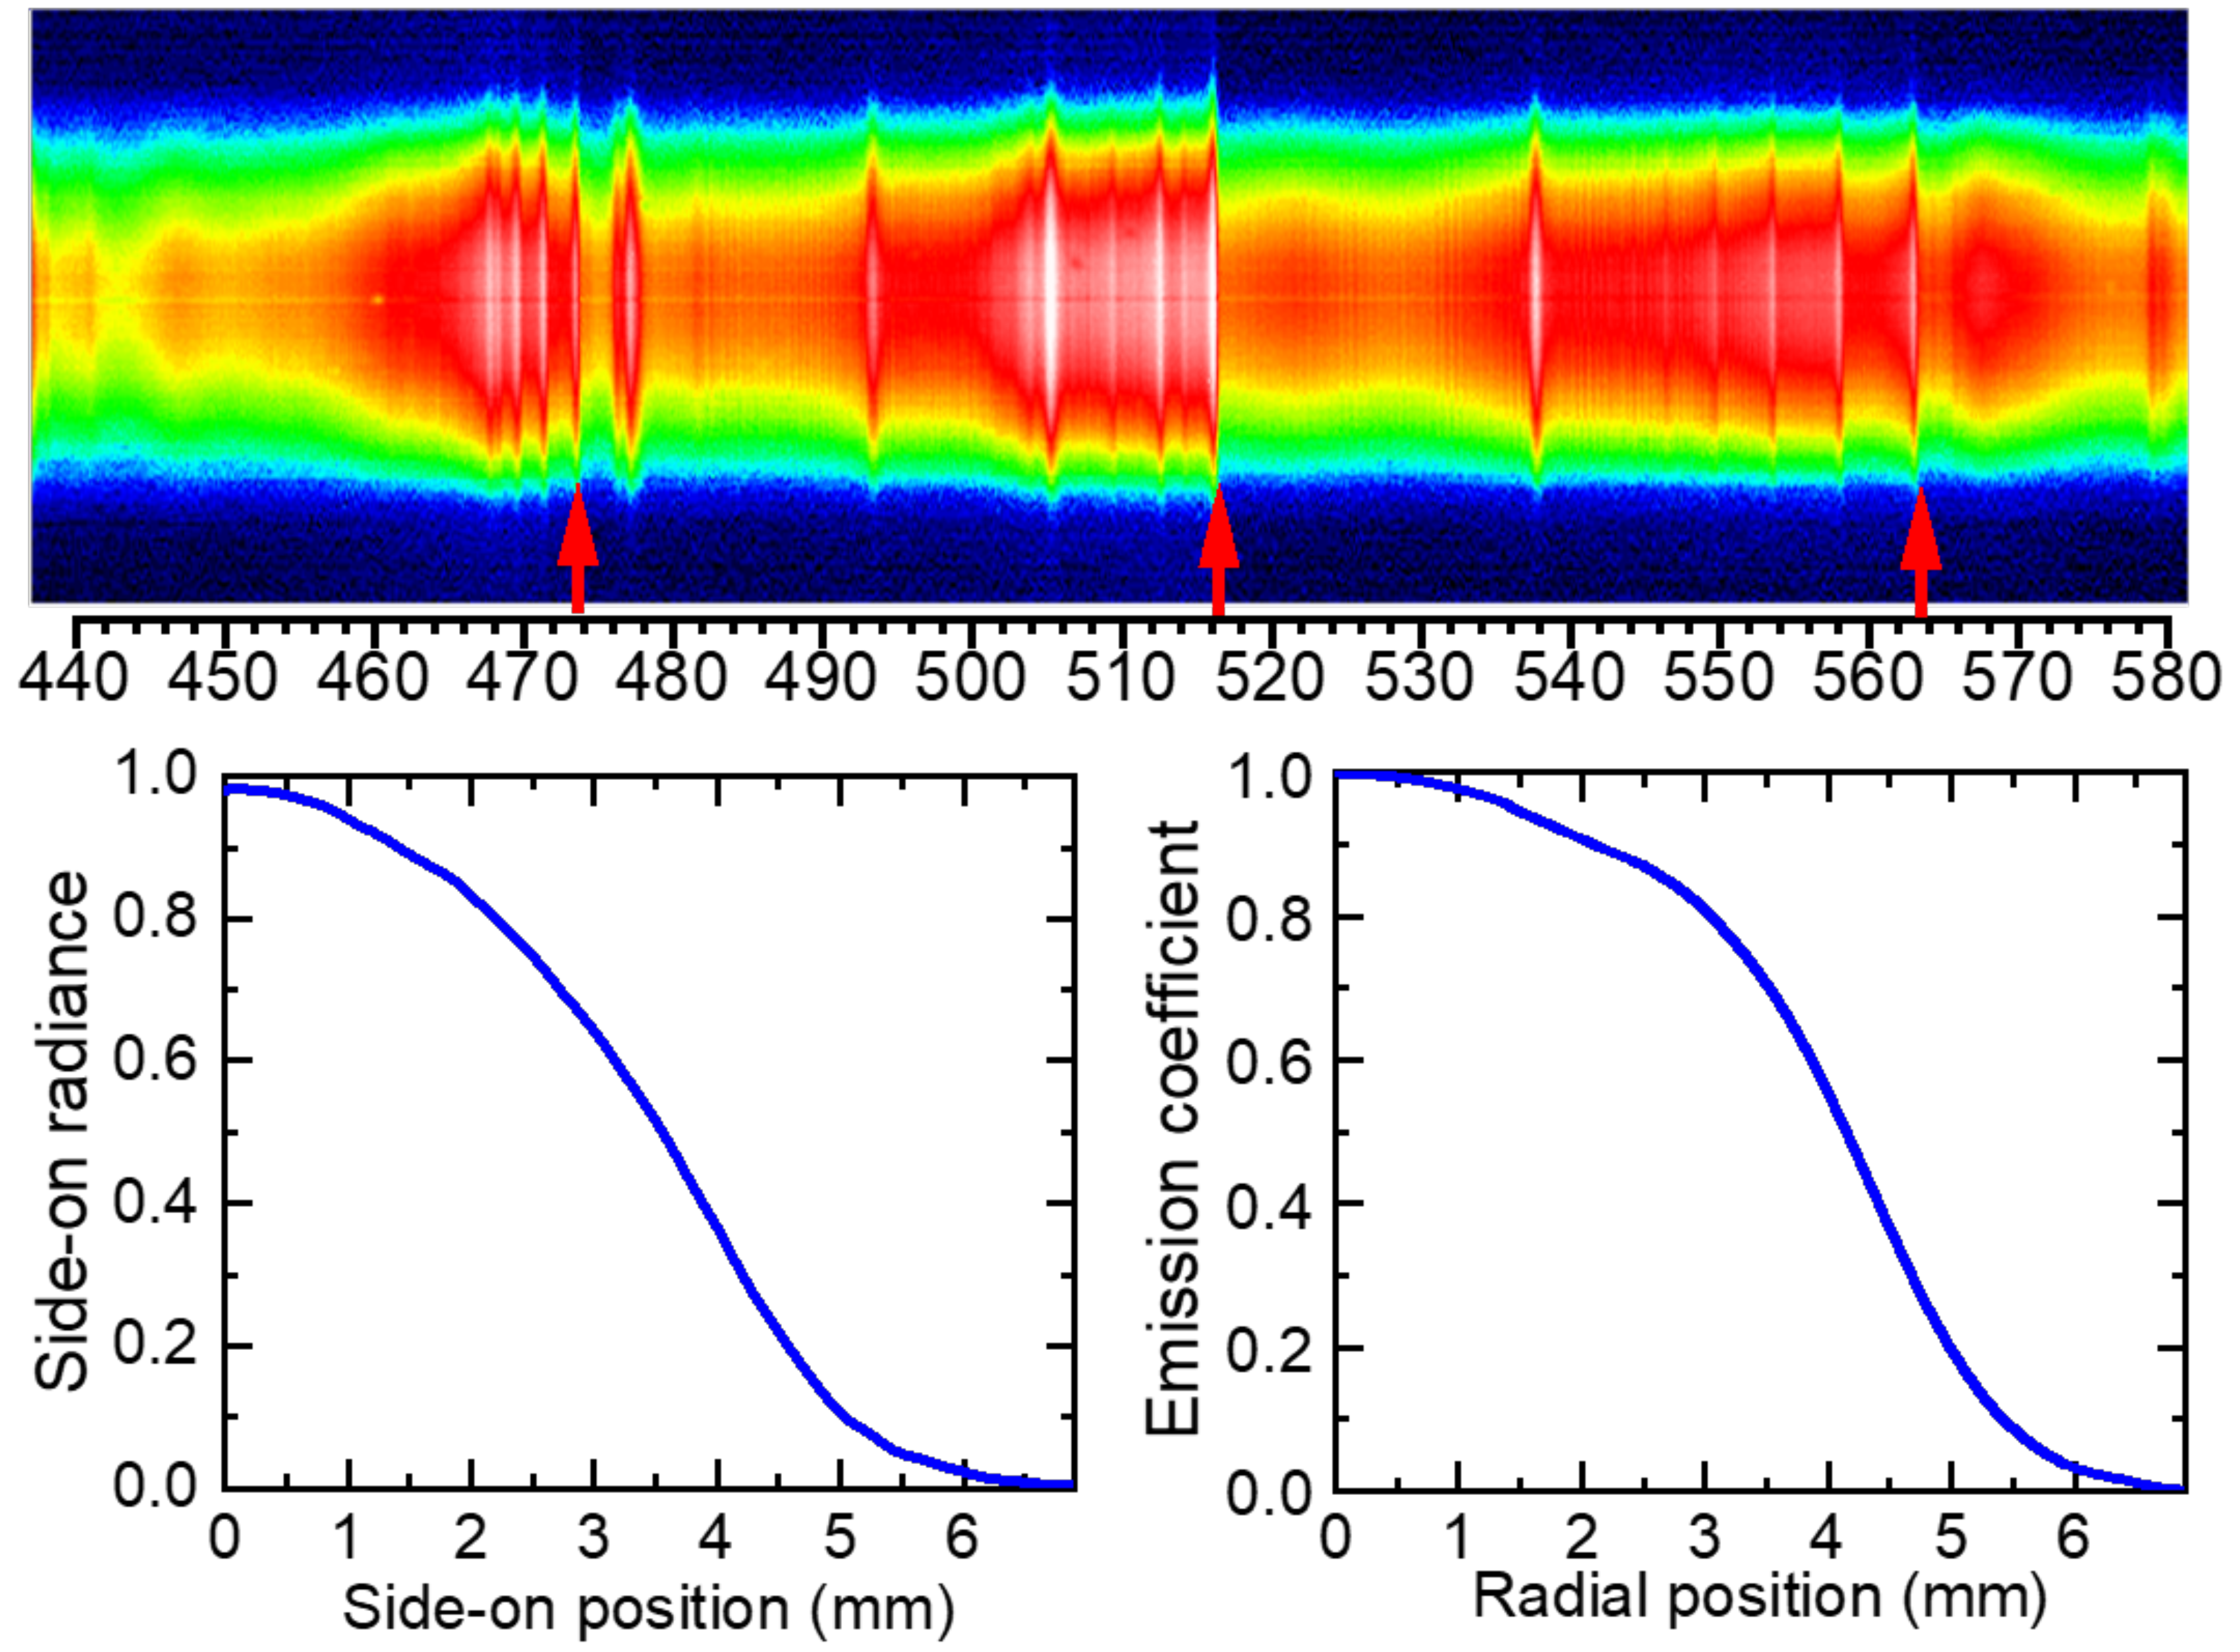
A third example of the occurrence of C Swan bands is shown in Figure 5. It was only observed with setup (a) providing higher pressure and strong wall ablation due to peak currents of 8 kA (100 Hz). With the single long PTFE nozzle the current was not switched off and multiple current zero transitions were observed. Except the ignition phase and few hundred s around CZ, all spectra are dominated by pronounced emission of the Swan bands. The band heads of the Swan bands are located at 473.7 nm, 516.5 nm, and 563.6 nm; they are indicated by red arrows in the two-dimensional spectrum in the upper part of Figure 5. The wavelength range chosen here does not include the band head at 438.2 nm but also contains the C II lines at 564.06 nm, 564.81 nm, and 566.26 nm as well as the C I atomic lines at 476.2 nm, 477.0 nm, 493.2 nm, 505.2 nm, and 538.0 nm. Weak or non-visible ionic and atomic carbon lines in comparison with the Swan bands give the first hint to rather low temperatures in the center of the arc. Furthermore, it was observed that the occurrence of carbon lines drastically changes approaching current zero. Within some 100 s, first the ionic and then the atomic lines disappear; after CZ they reappear in reversed order. In fact, disappearance of the atomic lines cannot be observed for first and second, but for the third CZ crossing.
The Swan band pattern has a much higher intensity in the central position, although the emission is extended to the side-on positions of the nozzle wall. The origin of emission is further analyzed using the band head around 563 nm as shown in the lower part of Figure 5. The side-on profile (left) and the emission coefficient obtained by inverse Abel transformation (right) reveal a different occurrence in comparison to the plasma in Figure 4. The Swan bands were emitted with the highest intensities in the center of the arc, continuously decreasing towards the nozzle walls. Thus, it can follow that the arc plasma is completely dominated by the PTFE material and it is characterized by rather low temperatures even in the arc center. It should be mentioned that this third case of Swan band appearance is the most extreme and could not be achieved with setup (b) with two nozzles separated by the heating channel even when the peak current was doubled to 10 kA.
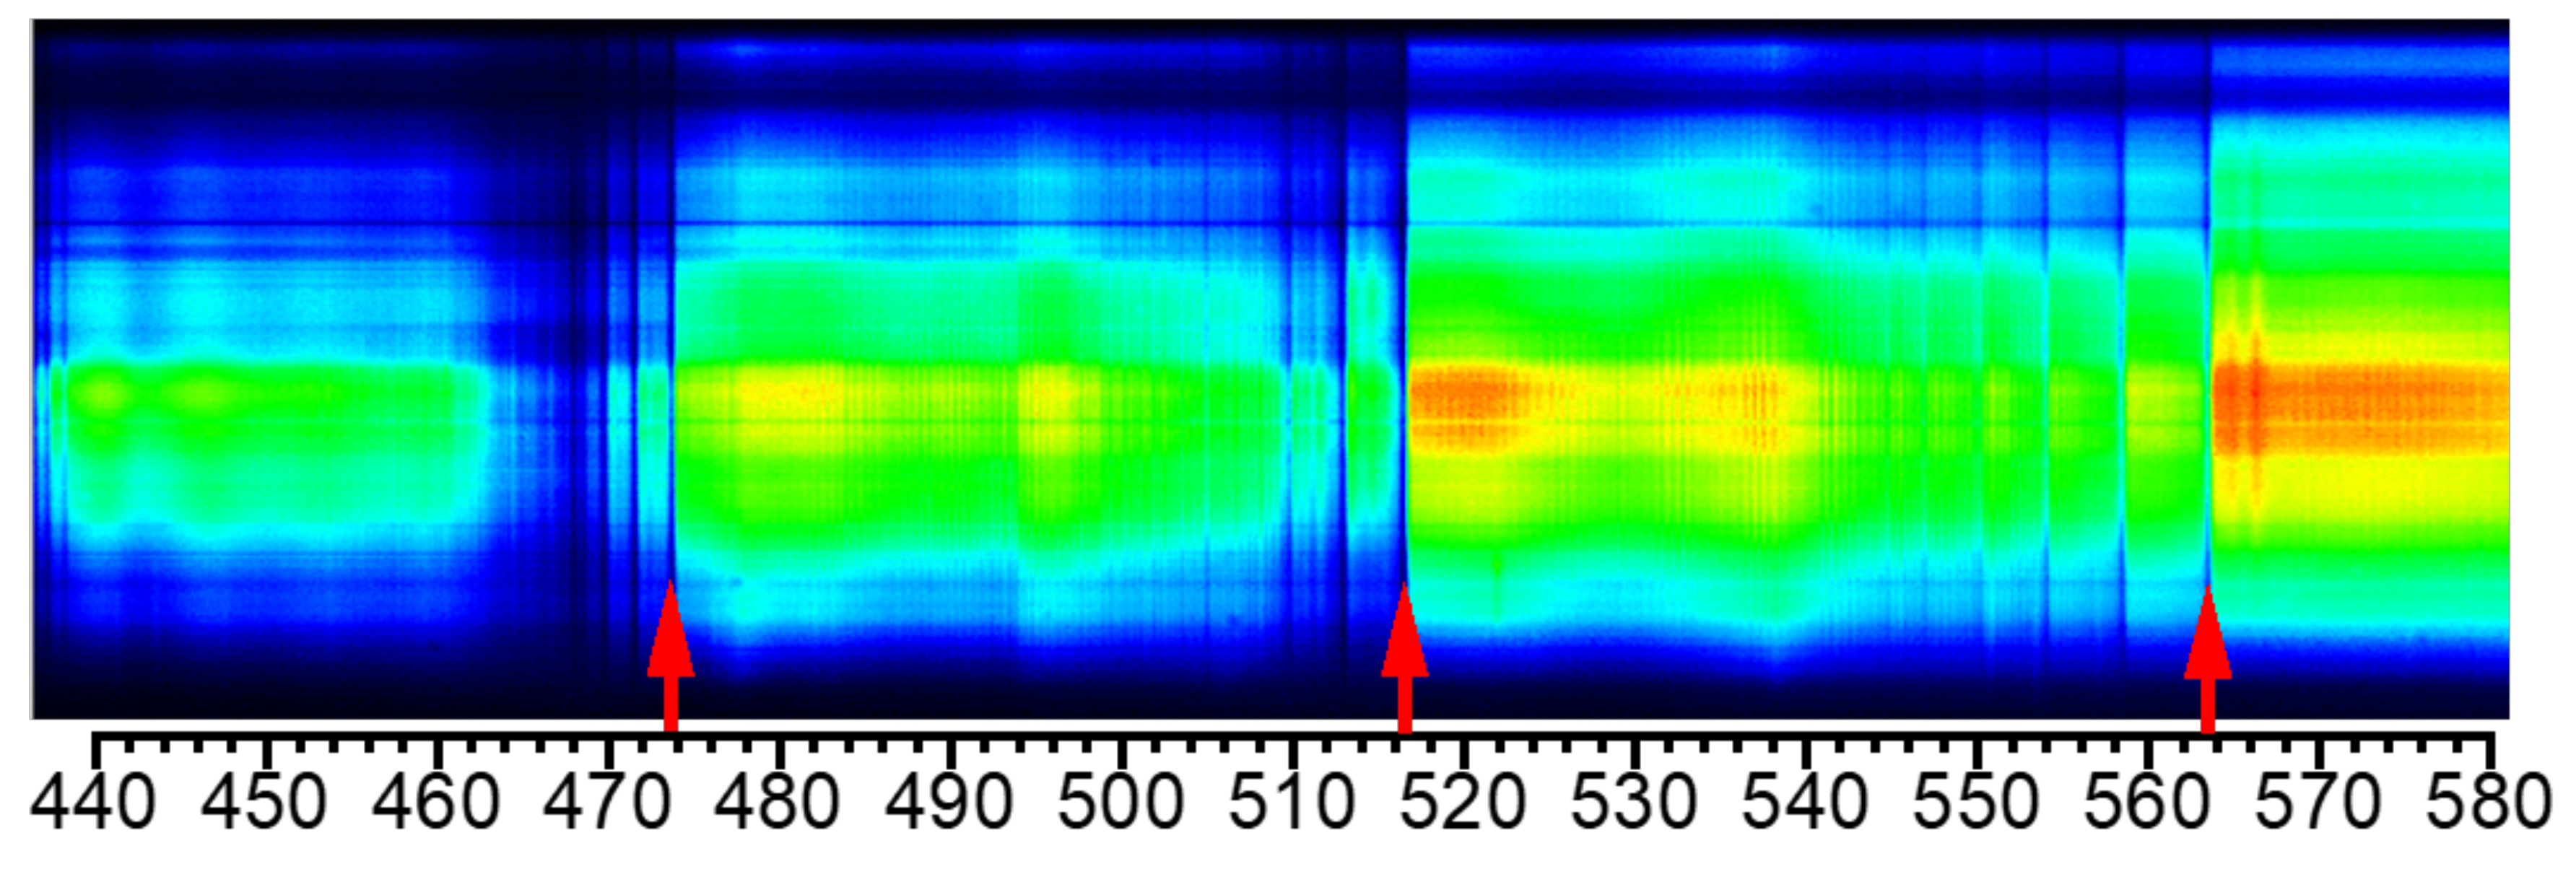
The fourth example was typical for setup (b): Here, the Swan bands can be recognized by their characteristic absorption pattern at currents >4 kA, cf. example in Figure 6. The spectrum was taken shortly after the current maximum (4.7 kA, 4.6 ms before CZ). Emission from the hot plasma in the arc center served as an internal background radiator that was absorbed by the much cooler carbon dimers near to the nozzle wall. As in Figure 5, the Swan band heads are indicated by red arrows. Additionally to the absorption pattern, some emission lines can be found. These are all ionic carbon lines, e.g., at C II 564.06 nm, 564.81 nm, and 566.26 nm. They are preferably emitted in the arc center, i.e., at higher temperatures. In the third and fourth cases with most intense ablation and material transport towards the electrodes, which is probably the reason why no copper lines were observed at the slit position. Fluorine lines were not available in that spectral range.
3.2. Optical Absorption Spectroscopy around Current Zero
The phase of current zero-crossing is of the highest importance for an understanding of the switch-off process and the dielectric recovery of the electrode gap region. Hence it is of special interest to extend experimental knowledge as close as possible to CZ and even beyond. However, even tapping the full potential of optical emission spectroscopy, e.g., by application of OES with intensified cameras as described above, the analysis based on optical emission spectroscopy is limited to times about 10 s before CZ due to reduced energy input by the arc [9]. Consequently, absorption techniques were required for further investigation of the current zero-crossing and the immediately following time period. Since the majority of atoms are in the ground state in case of the lower temperatures near CZ, it will be necessary to mainly analyze lines going to ground or very low levels by optical absorption spectroscopy (OAS). However, most of the relevant lines are in deep UV regions far below 300 nm. From the experimental point it is extremely demanding to investigate such radiation under switching-relevant conditions since all components of the setup including high-pressure vessel and model circuit chamber have to be transparent for these wavelengths. With the actual setup even resonant lines that might be more suitable could not be detected due to limited spectral sensitivity of the cameras such as C I at 296 nm or Cu I at 324 nm and 327 nm. The few resonant lines in the available wavelength range above 340 nm have very low transition probabilities, e.g., C I at 462 nm and O I at 630 nm. However, it might be possible that some lines might be occupied around CZ and could be detected by OAS that are characterized by relatively low energy levels and medium transition probabilities, e.g., Cu I at 510 nm, 570 nm, and 578 nm with E = 1.39 eV and 1.64 eV or O I at 557 nm with E = 1.26 eV. Additionally, molecules are possible candidates for absorption, e.g., the C molecule since its Swan bands were observed in emission until few 100 s before CZ and even in absorption during the high-current phase as shown above.
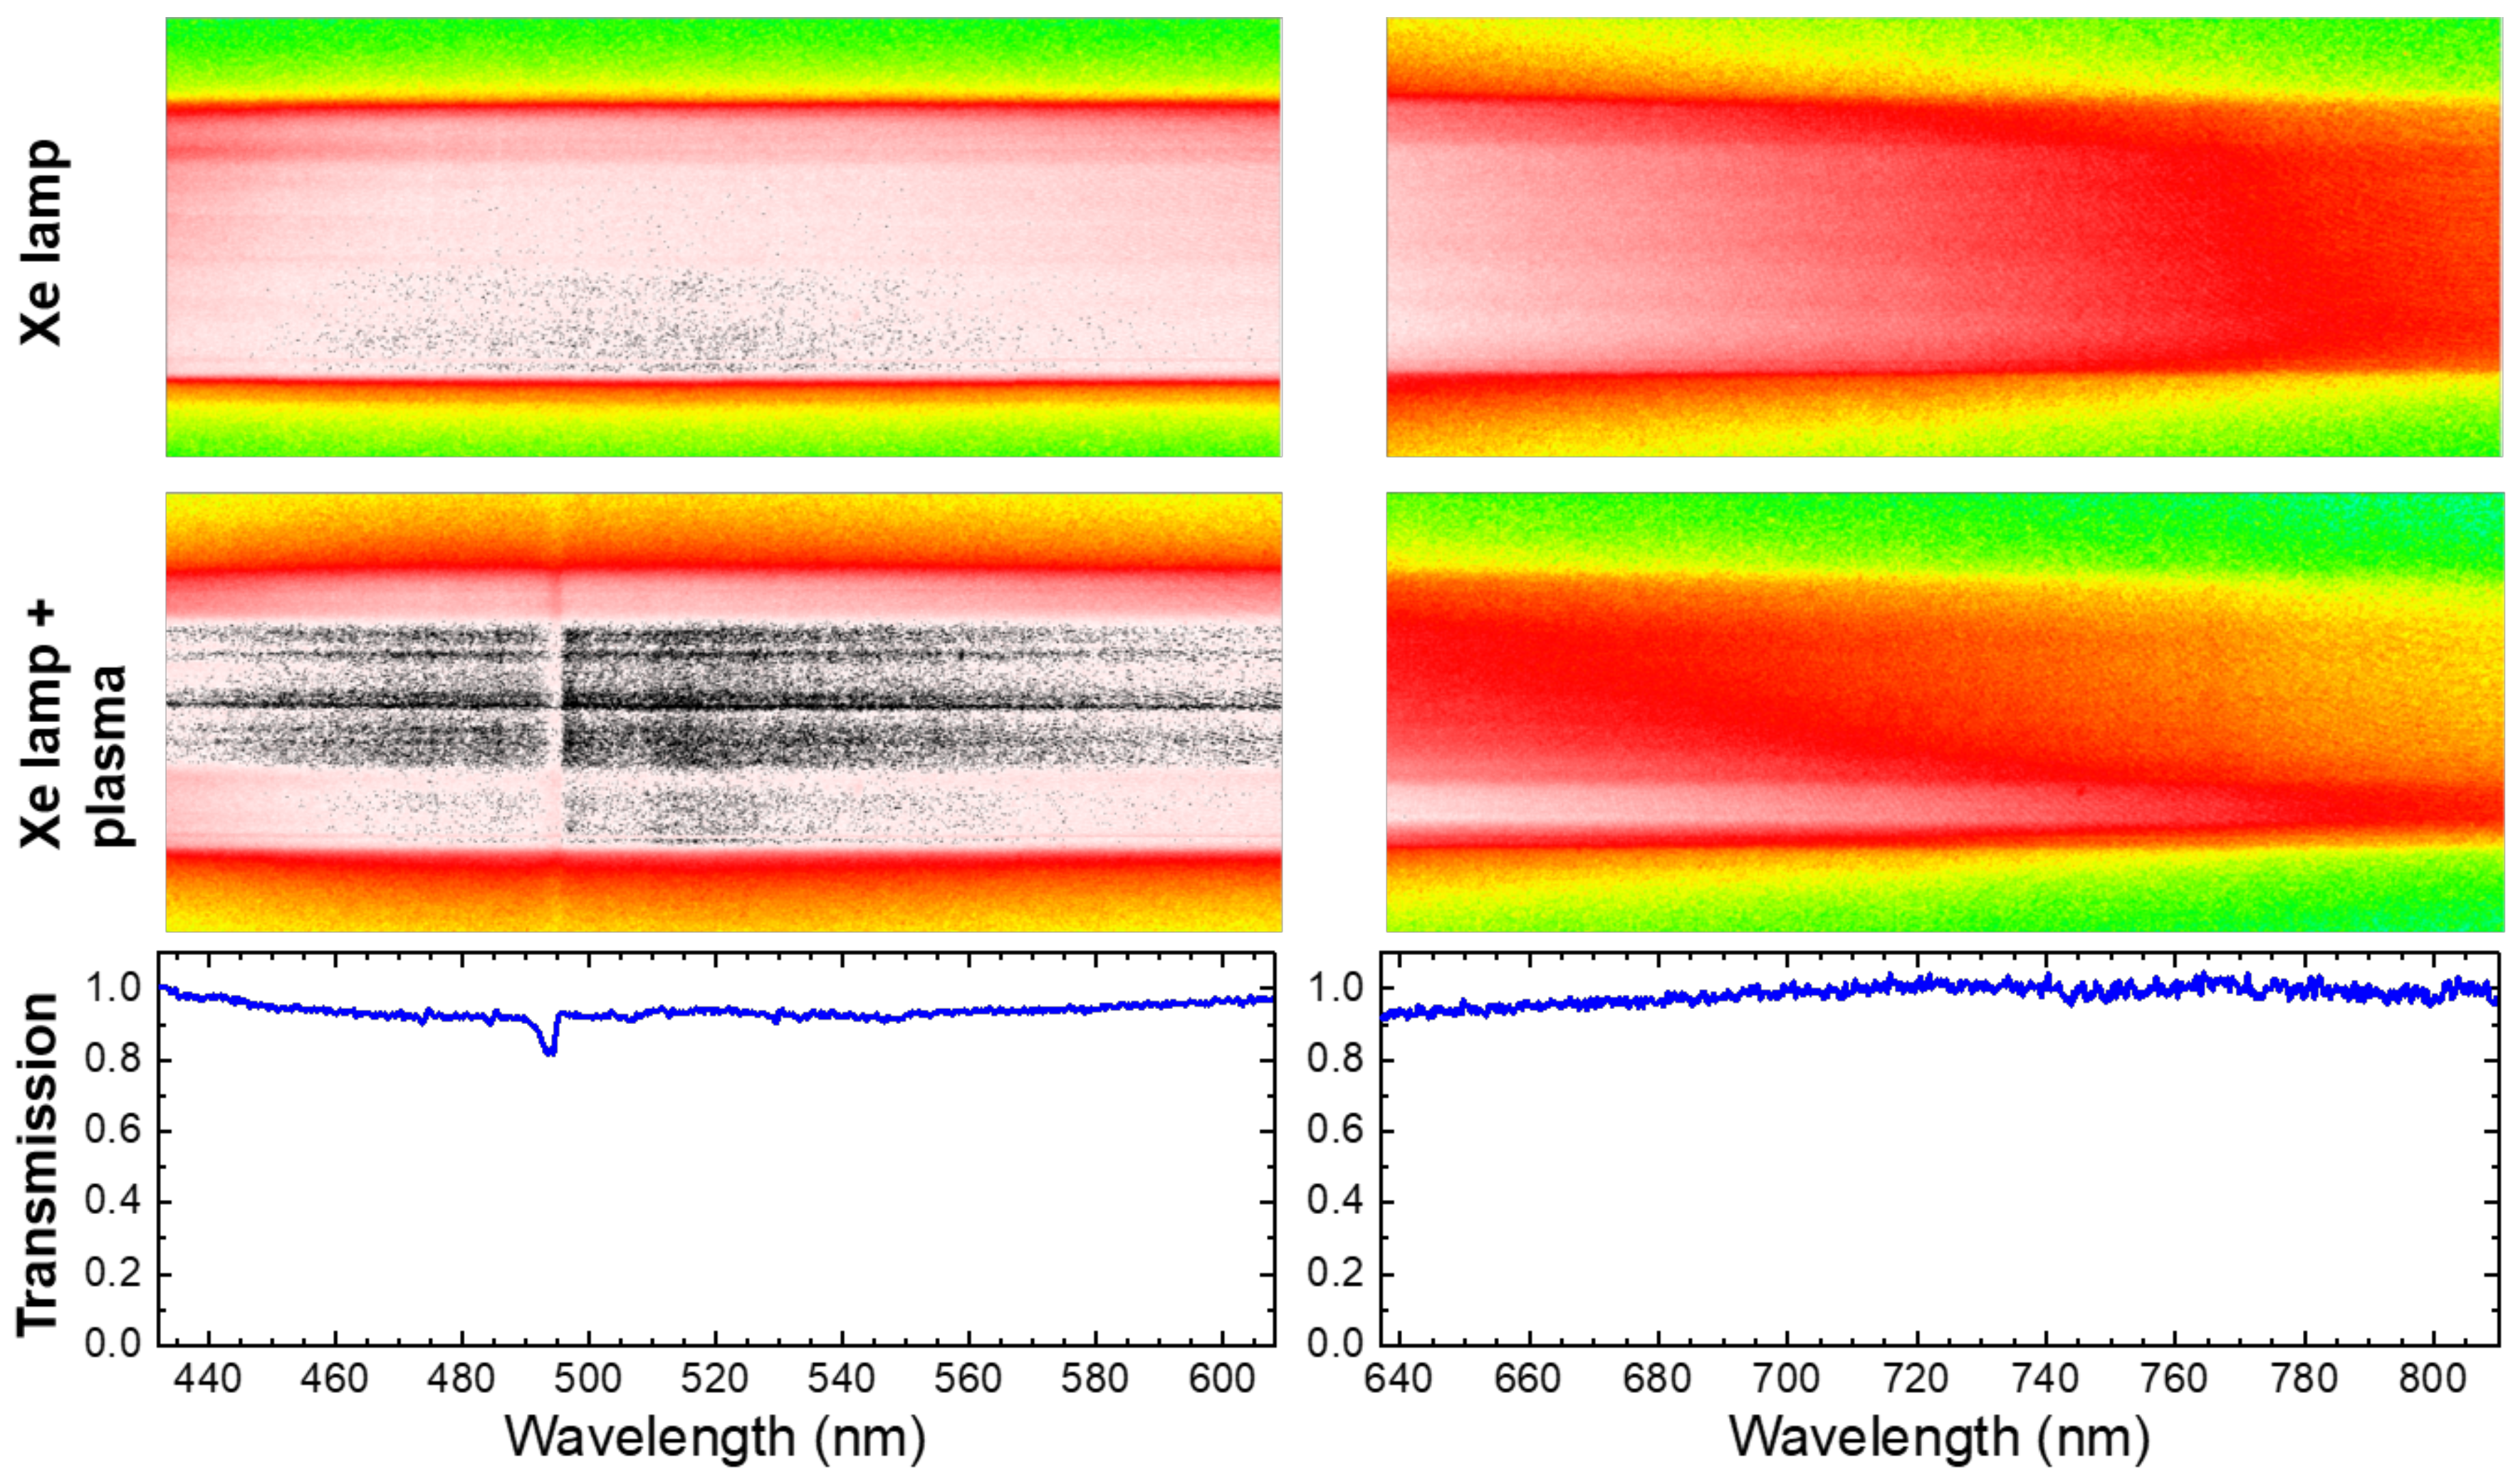
Broadband optical absorption spectroscopy (OAS) was carried out around CZ using the pulsed high-intensity xenon lamp as an external wide-band background illumination. Two examples are shown in Figure 7, comprising the wavelength ranges about 440–600 nm (left) and 640–800 nm (right column). In the upper panel only the emission from the Xe lamp is given, i.e., through model circuit breaker including all windows but without discharge. Broadband continuum can be seen in both spectral ranges. It should be noted that the spectra are not calibrated concerning absolute intensity. The edges of the nozzle can be recognized by sharp transitions from the bright stripe (white/red) from the Xe lamp illumination and the dark regions (green). The spatial distribution within the nozzle slit is quite homogeneous, showing smooth illumination by the background source. In the middle panel, the OES spectra were taken at CZ (exposure time 50 s) with the Xe lamp continuum passing the remainder of arc discharge in the nozzle. Patterns of horizontal stripes were sometimes observed. Similar experiments using HSC instead of ICCD camera revealed that these stripes did not change from one video frame to the next. Thus, it was reasonable to assume a deposition on the quartz glass sealing the slits, e.g., by particles. In the left spectrum a certain structure was found below 500 nm whereas the right spectrum did not show any peculiarities. From spectra in top and middle panel a transmission could be calculated, cf. lower panel of Figure 7. For an improvement of the signal-to-noise ratio and better visualization of the intensity ratio, spatial integration was carried out for the determination of the transmission. It revealed that there was only one significant absorption peak around 493 nm. This absorption was clearly accorded to the CuF molecule as will be discussed below. Beside this CuF peak, no hint on any absorbing lines or other features could be detected around current zero, even with the intensified camera with high sensitivity and dynamic range. Even the C Swan bands could not be observed before or after CZ in OAS with the Xe lamp as background radiator although they were detectable in OES up to a few hundred s before CZ. Moreover, a closer look onto the emission spectra (cf. Figure 3) showed that the CuF absorption at 493 nm could also be found during the high-current phase of the discharge, though this effect was rather weak compared to the intense line emission. This will be further investigated in Section 3.3.
Other species for absorption with maximum around 493 nm could be excluded in detailed spectral analysis, including all relevant elements as Cu and W from electrodes, C, O, and F from filling gas and nozzle, and even H as possible contamination. As an example, a prominent candidate might have been the carbon atomic line C I at 493.20 nm, although its lower energy level of 7.7 eV is rather high. However, this line was not detected in emission like other atomic carbon lines with similar upper level of about 10 eV and comparable transition probabilities in the range of several 10 s, e.g., C I 505.21 nm and 538.03 nm (cf. Figure 3). Moreover, these C I lines were still observed in emission 0.7 ms before CZ, while at 493 nm an absorption could be seen even during discharge.
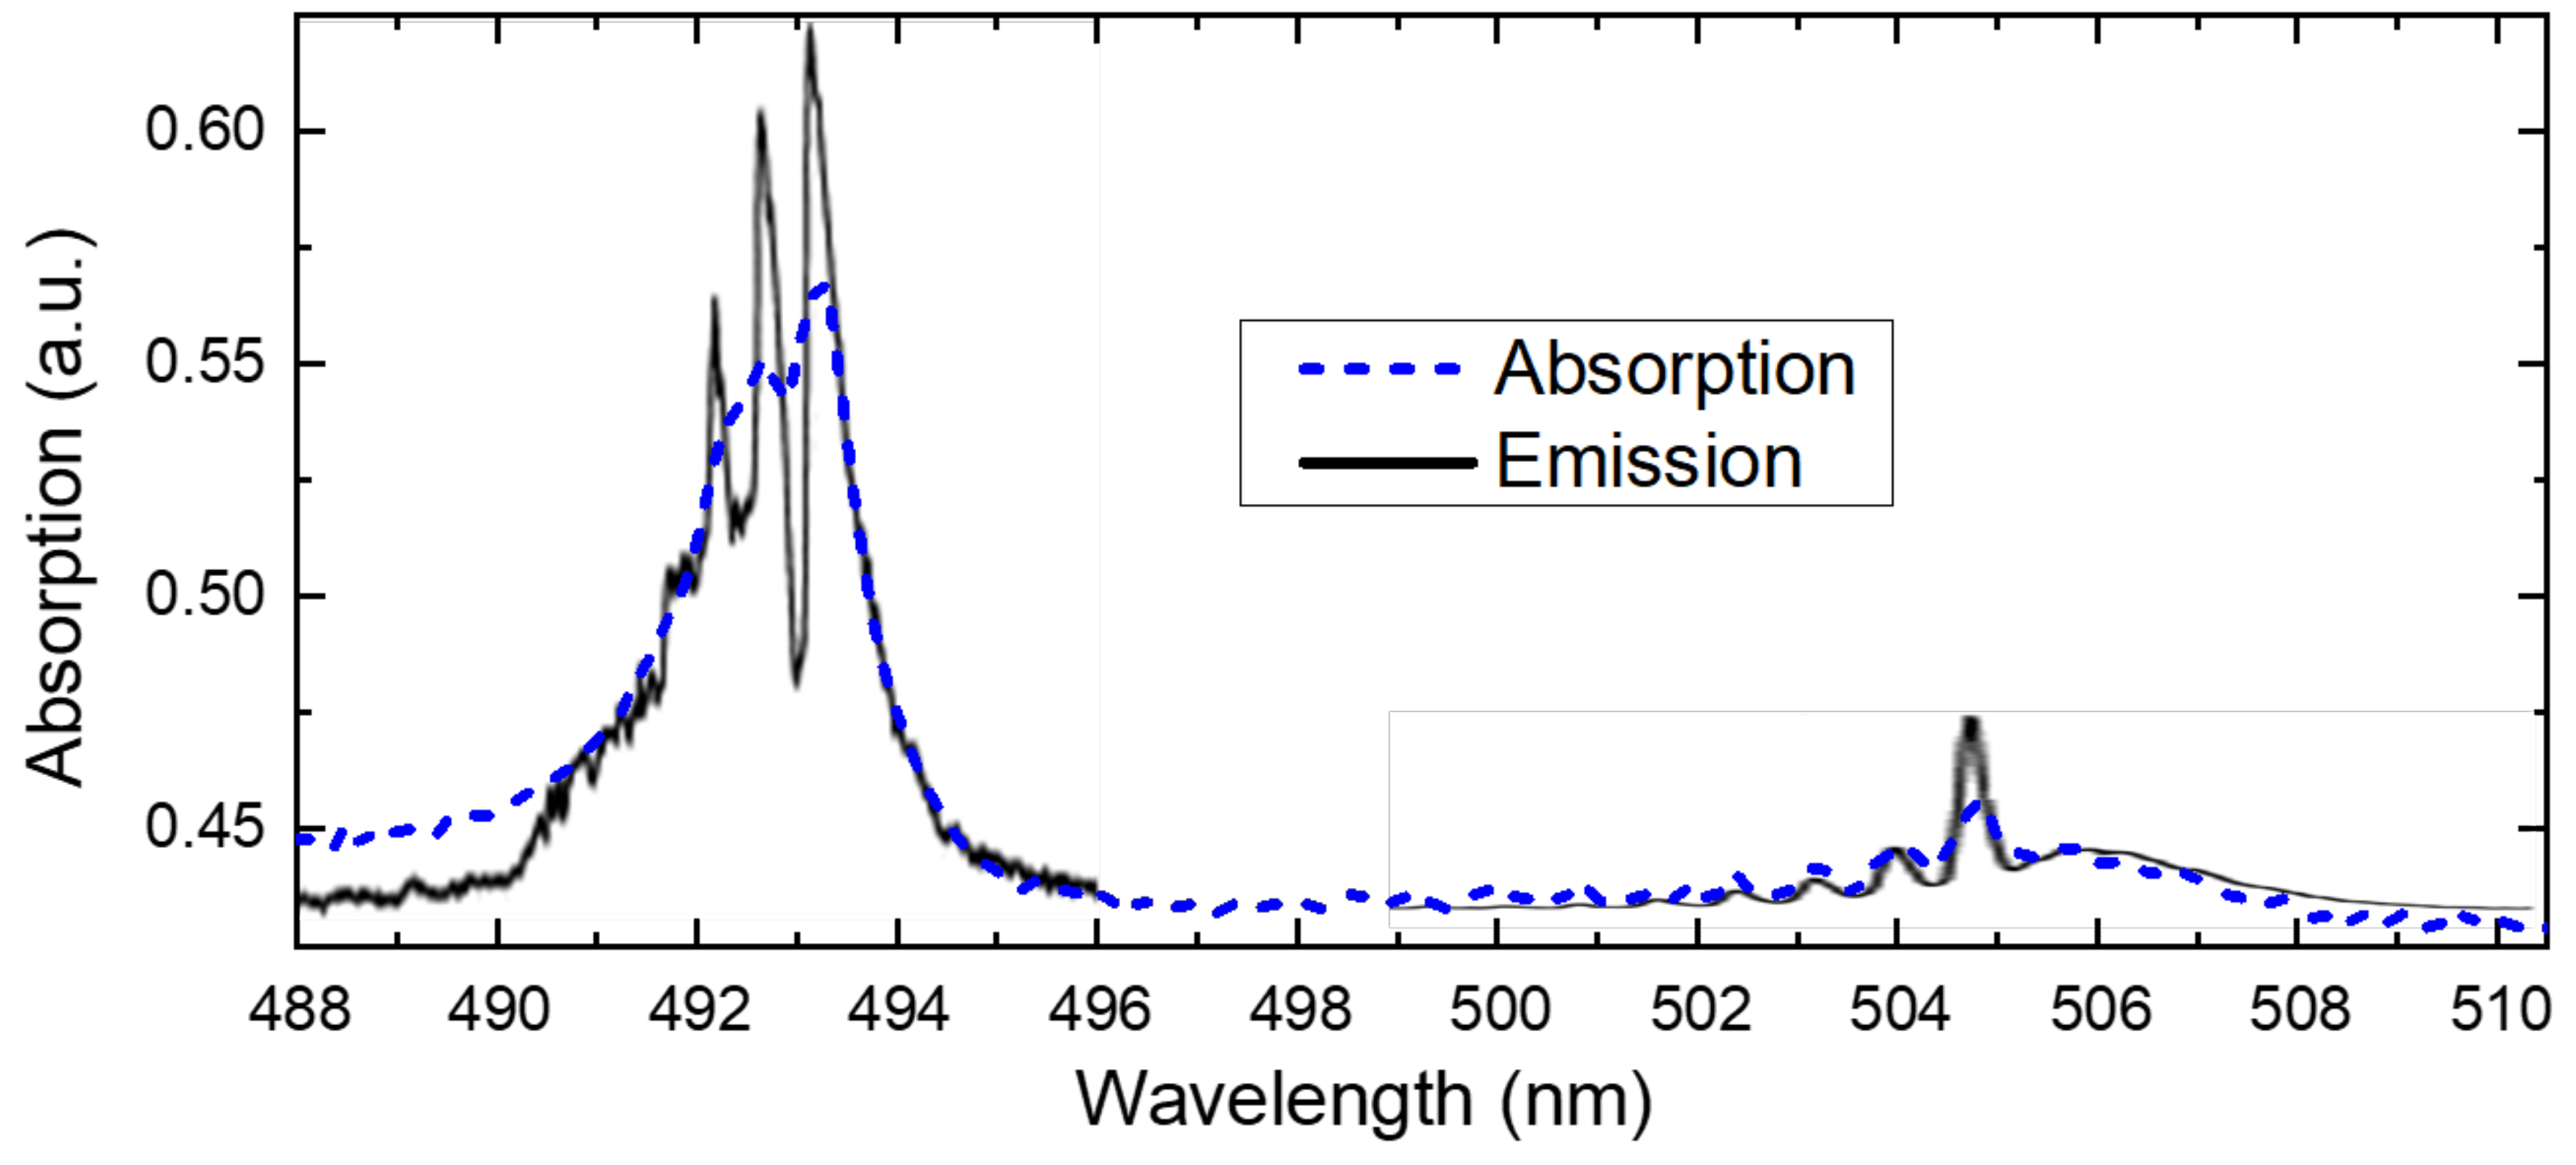
No absorption spectra were found in the literature for the CuF molecules. Thus, in Figure 8, an emission spectrum from Cheon et al. [25] (black curve) was added to the calculated absorption spectrum (dashed blue) for comparison. Considering different experimental conditions and methods, a compelling agreement was found (OES with higher spectral resolution will be shown below). Basic data of the CuF emission are listed in Table 1.
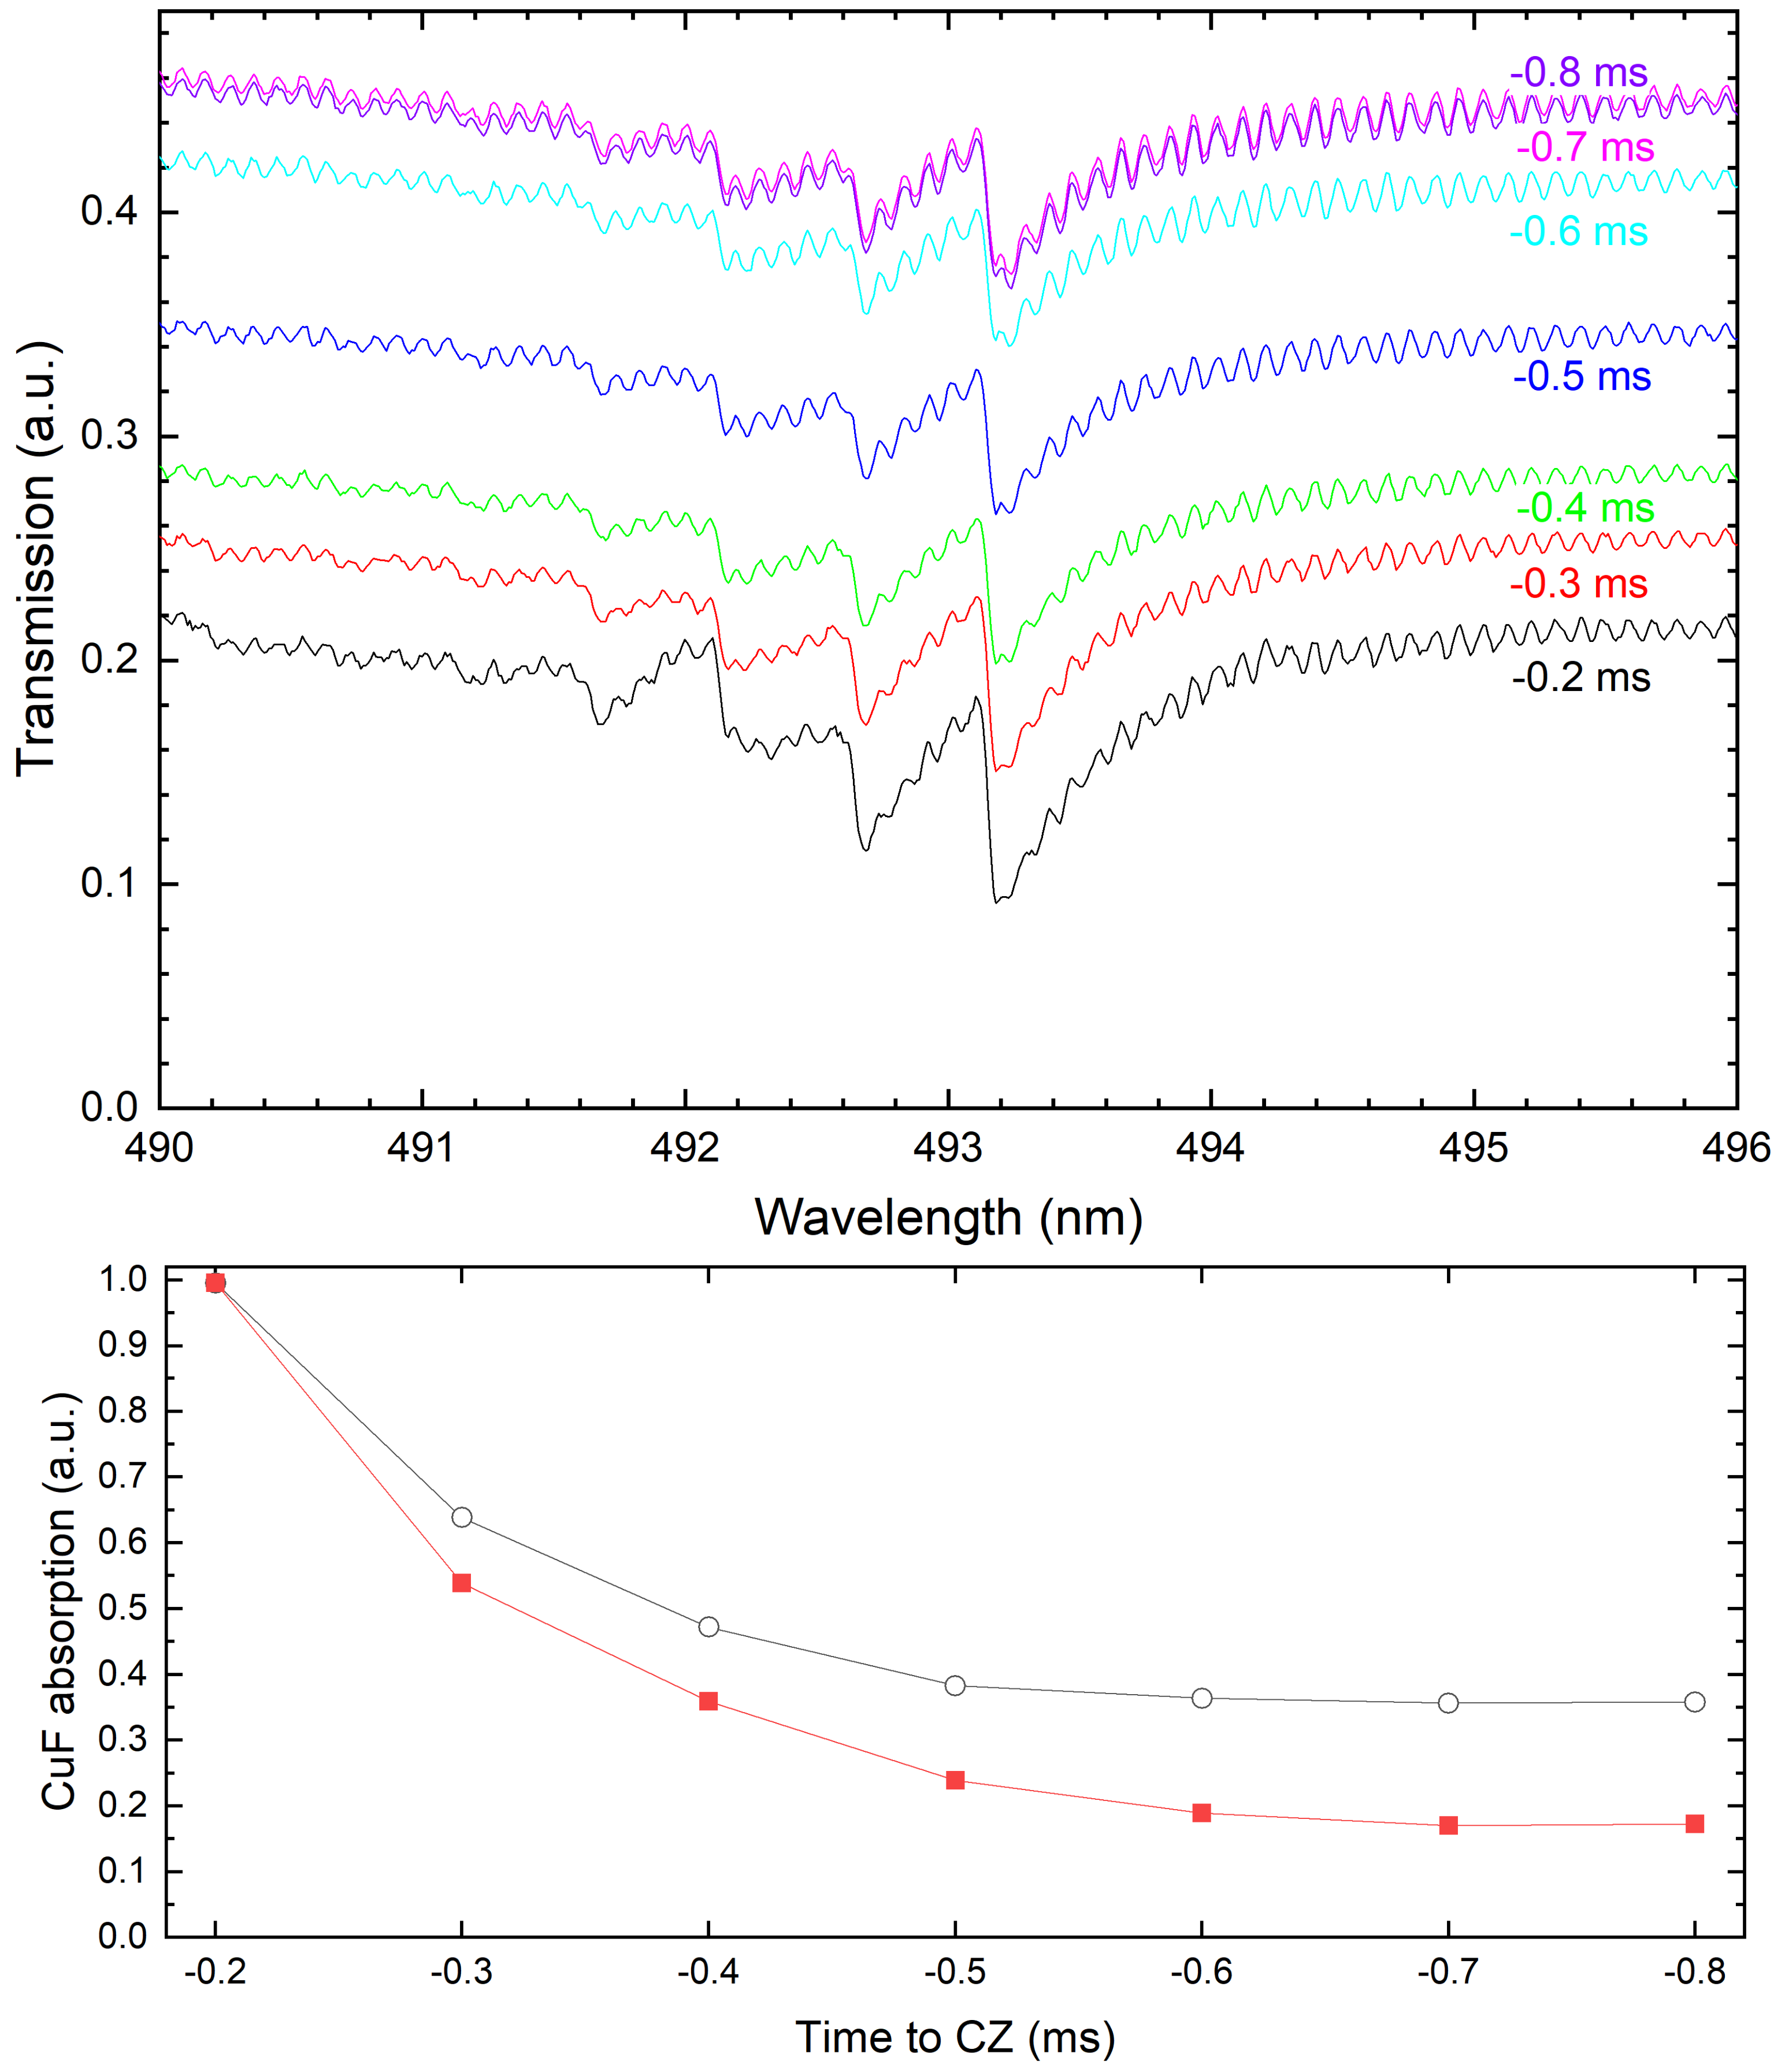
In the following, the CuF molecular absorption after current zero should be analyzed in more detail. A series of time-resolved spectra is shown in the upper part of Figure 9. The transmission was calculated based on the division of the measured spectra (plasma plus xenon lamp) by a xenon lamp spectrum without discharge. A higher spectral resolution was obtained by the grating with 1800 L/mm. Thus, the peak structure including maxima at 493.2 nm, 492.7 nm, and 493.2 nm can be clearly recognized in agreement with the emission spectrum of CuF molecules from [25] shown in Figure 8. The overlaying periodic structure is not caused by the plasma in the nozzle since the same structure was also observed for the xenon lamp itself. Probably it was caused by an interference effect of glass plates in the detector. The background intensity increases although the xenon lamp is in its plateau phase.
For a quantization of the temporal evolution of the absorption, the area under the curve (AUC) was determined from the difference between the “background” (average of levels extracted at wavelengths aside the CuF absorption, i.e., around 490 nm and 496 nm) and the transmission, integrated over the spectral range. The AUC is plotted as the curve with black open circles in the lower part of Figure 9. Additionally, a normalization of the AUC was carried out by division by the (temporally increasing) intensity of the background signal. The normalized AUC is represented by the curve with red filled squares. The spectrum 0.2 ms after CZ was chosen as the starting point and the according value was set to 1 for better comparison. Within half a millisecond, the AUC decreases by 60%. The decrease of the normalized AUC is even more significant, namely down to 20% (factor of 5). Few other shots that were carried out confirmed this result. However, due to the exponential nature of this decrease, the absolute values are sensitive to the starting point. Summarizing it can be stated that the CuF absorption and thus, also the CuF density decreases after current zero on a timescale of several hundreds of microseconds.
3.3. CuF during the High-Current Phase
As mentioned above, overview OES spectra in Figure 3 gave hint on a possible absorption of the CuF molecule even during the arc discharge though the effect might be considerably lower in absolute intensity than the atomic line emission. Thus, the spectral range around the 493 nm-peak was investigated with video OES of higher resolution (grating 1800 L/mm instead of 150 L/mm, exposure time 98 s). An example is shown in Figure 10 acquired with setup (b) and 5.3 kA peak current.
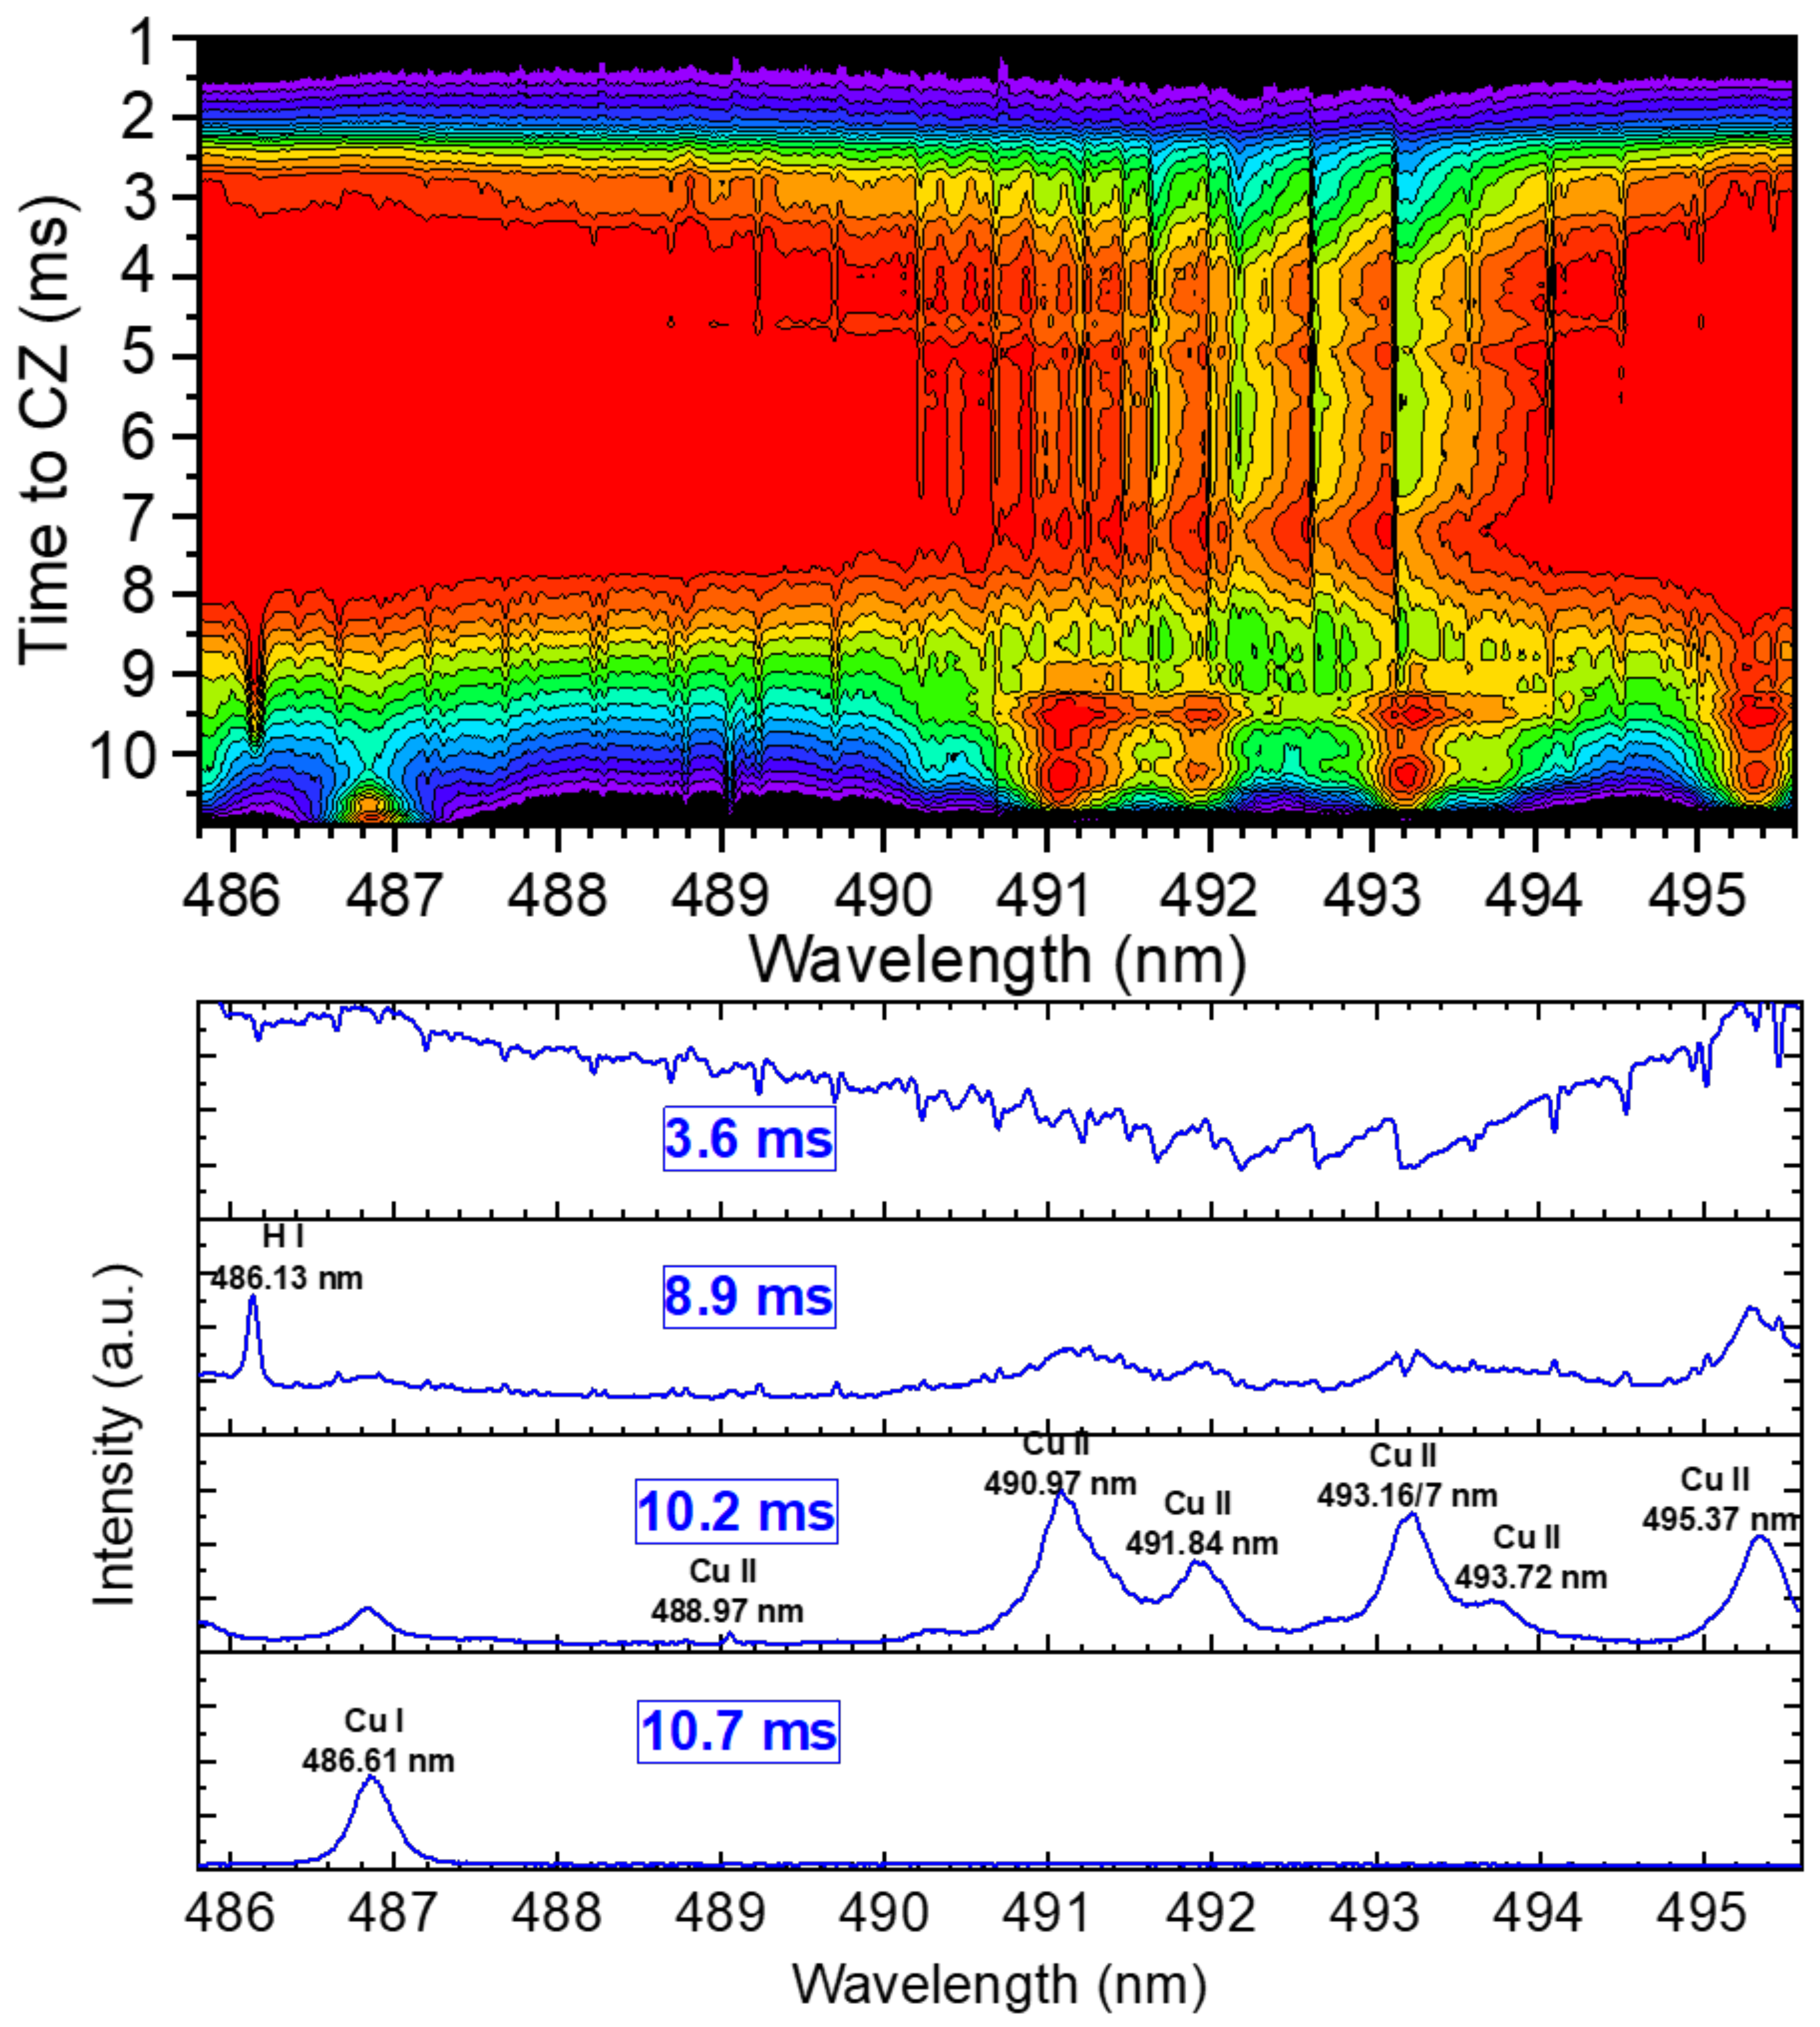
In the upper part, all about 110 optical emission spectra (spatially integrated) are plotted line by line vs. time to CZ, forming a two-dimensional contour plot. In the lower part of Figure 10 a selection of four instants of time with characteristic spectral features are shown. Additionally, several atomic and ionic lines were labeled that helped for fine adjustment and control of exact wavelength positions. The ignition phase the spectra were dominated by atomic and ionic copper line emission. At first, i.e., 10.7 ms before current zero, an atomic copper line Cu I 486.61 nm was observed which was followed by several ionic copper lines (cf. spectrum 10.2 ms before CZ). As known from overview OES spectra, the ablation of PTFE was usually initialized about 1 ms after ignition. In the spectral range of Figure 10 no atomic fluorine lines can be observed. However, the occurrence of the hydrogen line H at 486.13 nm (starting about 9 ms before CZ) can be regarded as an early sign of nozzle ablation, probably caused by a thin remaining water film on the nozzle surface. Thus, one may expect the occurrence of CH molecules. That should be detectable by the CH(A-X) band with maxima around 430 nm. However, we did not find such an absorption pattern even in a detailed analysis of the corresponding spectral range. Within several hundred microseconds the spectrum is changed from being dominated by copper lines (more probable originating from the W–Cu electrodes than from the ignition wire) to being ablation-dominated. CuF absorption pattern is observed during the full high-current phase, at least from about 8 to 2 ms before CZ. In the spectral range below 500 nm this is basically visible by a broad continuum, starting about 2–3 ms after ignition (or 8 ms before CZ) and lasting at least until about 2 ms before CZ. As can be clearly seen from the top spectrum in Figure 10 the characteristic absorption pattern of CuF can be observed for these 5–6 ms, i.e., during the whole high-current phase of the discharge. Comparable to the case of absorption of the C Swan bands, the CuF absorption is enabled by background continuum from the arc plasma. The observed temporal fluctuation of the intensity has been found to be caused mainly by changes of background intensity, e.g., fluctuation of transmission or reflection due to droplets. Hence, even during the high-current phase a considerable amount of absorbing CuF molecules must be existent in the plasma at nozzle position, i.e., 8 mm away from the electrode. This might be unexpected but leads to the conclusion that the gas flow into the heating channel is strong enough to pull electrode material into the region of optical investigation.
4. Discussion
Information was obtained from spatially and temporally resolved video spectroscopy using HSC. That comprised the different phases of discharge and the occurrence of Swan band emission from C molecules. These Swan bands could be observed under varying conditions. Different amount of ablated PTFE from the nozzle wall and plasma temperature were generated depending on nozzle geometry and current density. According to the equilibrium composition calculations by Yang et al. [11], a considerable radiation of the C molecule indicates plasma temperatures in the range from 4000–6000 K. Firstly, there was an occurrence very close to the nozzle walls as typical behavior for cases of moderate PTFE influence, i.e., when the current density was not too high and the temperature close to the wall was rather low, allowing the existence of carbon dimers. Although it might be often neglected when the temperature distribution in the arc is investigated, the Swan bands represent the existence of carbon molecules due to wall ablation and thus, an important effect of cooling and change of plasma composition. Secondly, with higher current densities, the Swan band patterns were also distributed over the full vertical axis of the side-on 2D-spectra. However, it was found by Abel inversion that the Swan bands are emitted in a thin sheath at the nozzle wall. Thirdly, a different distribution was found under extreme conditions, i.e., with single long PTFE nozzle and high peak currents. The arc plasma was completely dominated by PTFE material and temperatures were moderate in the arc center, proved by weak or non-visible ionic and atomic carbon line emission. The Swan band pattern was emitted with the highest intensity in the central position though emission was extended to radial positions of the nozzle wall. Finally, Swan bands also appeared as an absorption pattern at moderate currents with setup (b). Emission from hot plasma in the arc center (proved by C II line emission) served as an internal background radiator that was absorbed by the much cooler carbon dimers near to the nozzle wall.
A considerable amount of CuF molecules in the high-current arc as well as around CZ was found from absorption spectra. This was not expected before, for several reasons, especially regarding that no other molecules were observed close to current-zero. A possible explanation is as follows: Around CZ it is expected that convective fluxes are significantly reduced due to equalization of pressures. As a consequence, copper atoms from still hot electrodes may expand diffusively along the nozzle and reach the position of OES (nozzle slit). In parallel, fluorine-containing molecules are still released from the nozzle wall. CuF molecules could be formed by chemical reaction of atomic F and Cu either at the hot W–Cu electrode surface followed by CuF evaporation or in the gas phase with Cu evaporated from the electrode. Similarly, the observed absorption during the high-current phase might be explained by the gas flow out of the nozzle into the heating chamber. In this case, copper atoms eroded or evaporated from the W–Cu electrode might be flushed with the stream towards the heating channel, reacting on its way with fluorine from the wall, and being detected at the observation slit by absorption with the arc plasma as background radiator. However, during the time immediately after flow reversal, i.e., about 1 ms before CZ, the situation is very different: the gas flow is directed from the heating channel towards the electrodes. Thus, no copper from the electrodes should reach the observation area with the slit and react with fluorine. That means that probably no CuF should be produced at this period; any detected CuF should be a survivor from the heating chamber. As a pity, at the moment database is not sufficient to answer the question if there is a lower CuF concentration after flow reversal or not. In the video spectra there is simply not enough background emission to enable sufficient signal for an absorption.
Within the described experiments, limitations of reproducibility, fluctuation in transmission due to particles, film layers on windows, and dust did not allow temporally and spatially resolved determination of the absorption by CuF, e.g., using two-dimensional inverse Abel transformation of video spectra with higher spectral resolution. Nevertheless, this would be the next step if significant technical improvements were done. On the one hand, further optimization of the nozzle slit, its position and manufacturing technique might provide even fewer changes of the gas and droplet flow conditions, thus allowing measurements still closer to the undisturbed conditions at the nozzle. On the other hand, the observation technique itself might be improved, too. Nowadays, the advantages of intensified and high-speed video cameras can be combined in new generations of cameras or boosters. The background illumination could be improved, too. Beside improvements in the optical path in order to enhance the intensity and homogeneity, the pulsed xenon lamp might also be replaced by a laser-driven light source with extended pulse duration. As a consequence, quantification of the CuF absorption after CZ as well as during the arc discharge might be possible. Furthermore, OAS regarding Swan bands could be tackled. Last not least, tests with other electrodes should be carried out to finally prove the origin of absorption by CuF-molecules, e.g., made of pure tungsten.
Altogether, the possibilities of a recording of molecule radiation emission and absorption in the visible spectral range have been demonstrated for the case of high-current ablation dominated arcs. Using PTFE nozzles, tungsten–copper electrodes and operation in air or CO, the Swan bands of the carbon dimer C and absorption of the CuF molecule were the only detectable radiation patterns. However, these patterns open up ways for a study of interesting ranges in high-current breaking processes like the colder plasma ranges near the nozzle walls and the time around CZ.
5. Conclusions
Ablation-dominated switching arcs have been investigated in a model circuit breaker with CO atmosphere as well as in a long PTFE nozzle under ambient conditions. Optical emission spectroscopy and broadband optical absorption spectroscopy were carried out using either intensified or high-speed cameras. As a main result, we have shown that specific molecules are detectable in the wavelength range between 400 nm and 800 nm under strongly varying conditions. It was demonstrated that depending on nozzle geometry and discharge current the C Swan bands can be observed by their emission (i) near to the wall only, (ii) distributed over the full arc diameter with the highest intensity in the center, or (iii) by their absorption of continuum radiation from the arc plasma. Although an emission was found until a few hundreds of microseconds before CZ, no absorption of the Swan bands could be detected around and after CZ. Even the occurrence of C radiation can be used an indicator for intermediate temperatures of around 5000 K according to composition calculations. An accurate determination of quantities like rotational temperatures and densities can be performed by comparison with spectra calculation. This was out of the scope of the present paper and could be tackled in the future, demanding two-dimensional inverse Abel transformation of multiband spectra. Additionally, these findings could be applied e.g., for the study of fluxes and distribution of evaporated material and for the verification of erosion models of the PTFE wall. The molecule CuF could be expected when copper vapor from the electrode erosion is mixed with the dissociated PTFE vapor from the nozzle ablation. To our knowledge, it was the first observation of CuF molecules in high-current arcs burning in nozzles under ablation-dominated regime. The agreement of spectral features between the literature on CuF and our experiments seem very plausible. However, further investigations are necessary to confirm these findings. The CuF molecular absorption could be applied as an alternative to investigating electrode erosion and distribution of electrode material within the discharge area, especially around CZ when the emission of atomic copper lines fades out.
Author Contributions
Conceptualization, R.M. and D.U.; methodology, validation, and formal analysis, R.M.; investigation with setup (a), R.M.; investigation with setup (b), R.M. and N.G.; writing—original draft preparation, R.M. and D.U.; project administration, D.U. All authors have read and agreed to the published version of the manuscript.
Funding
This research was funded by Deutsche Forschungsgemeinschaft grant numbers UH 106/13-1 and SCHN 728/16-1.
Acknowledgments
The authors would like to thank Steffen Franke and Alireza Khakpour for experimental help and fruitful discussions. The calculation of plasma composition was realised by Sergey Gortschakow (all Leibniz Institute for Plasma Science and Technology).
Conflicts of Interest
The authors declare no conflict of interest. The funders had no role in the design of the study; in the collection, analyses, or interpretation of data; in the writing of the manuscript, or in the decision to publish the results.
Abbreviations
The following abbreviations are used in this manuscript:
| AUC | area under curve |
| CO | carbon dioxide |
| CuF | copper fluoride |
| CZ | current zero |
| ICCD | intensified charge coupled device |
| HSC | high–speed camera |
| MoS | molybdenum disulfide |
| OAS | optical absorption spectroscopy |
| OES | optical emission spectroscopy |
| PTFE | polytetrafluoroethylene |
| SF | sulfur hexa–fluoride |
| W–Cu | tungste–copper |
References
- Ruchti, C.B.; Niemeyer, L. Ablation controlled arcs. IEEE Trans. Plasma Sci. 1986, 14, 423–434. [Google Scholar] [CrossRef]
- Seeger, M.; Tepper, J.; Christen, T.; Abrahamson, J. Experimental study on PTFE ablation in high voltage circuit-breakers. J. Phys. D Appl. Phys. 2006, 39, 5016–5024. [Google Scholar] [CrossRef]
- Eichhoff, D.; Kurz, A.; Kozakov, R.; Gött, G.; Uhrlandt, D.; Schnettler, A. Study of an ablation–dominated arc in a model circuit chamber. J. Phys. D Appl. Phys. 2012, 45, 305204. [Google Scholar] [CrossRef]
- Franke, S.; Methling, R.; Uhrlandt, D.; Gorchakov, S.; Reichert, F.; Petchanka, A. Arc temperatures in a circuit breaker experiment from iterative analysis of emission spectra. J. Phys. D Appl. Phys. 2020, 53, 385204. [Google Scholar] [CrossRef]
- Bort, L.; Schultz, T.; Franck, C.F. Determining the time constant of arcs at arbitrary current levels. Plasma Phys. Technol. 2019, 5, 175–179. [Google Scholar] [CrossRef]
- Tanaka, Y.; Yokomizu, Y.; Matsumura, T.; Kito, Y. The opening process of thermal plasma contacts in a post-arc channel after current zero in a flat-type SF6 gas-blast quenching chamber. J. Phys. D Appl. Phys. 1997, 30, 407–416. [Google Scholar] [CrossRef]
- Hartinger, K.T.; Pierre, L.; Cahen, C. Combination of emission spectroscopy and fast imagery to characterize high-voltage SF6 circuit breakers. J. Phys. D Appl. Phys. 1998, 31, 2566–2576. [Google Scholar] [CrossRef]
- Kozakov, R.; Kettlitz, M.; Weltmann, K.D.; Steffens, A.; Franck, C.M. Temperature profiles of an ablation controlled arc in PTFE: I. Spectroscopic measurements. J. Phys. D Appl. Phys. 2007, 40, 2499–2506. [Google Scholar] [CrossRef]
- Methling, R.; Khakpour, A.; Götte, N.; Uhrlandt, D. Ablation-Dominated Arcs in CO2 atmosphere—Part I: Temperature Determination near Current Zero. Preprints 2020, 2020080279. [Google Scholar] [CrossRef]
- Paul, K.C.; Sakutay, T.; Takashimay, T.; Ishikawa, M. The dynamic behaviour of wall-stabilized SF6 arcs contaminated by Cu and PTFE vapours. J. Phys. D Appl. Phys. 1997, 30, 103–112. [Google Scholar] [CrossRef]
- Yang, A.; Liu, Y.; Sun, B.; Wang, X.; Cressault, Y.; Zhong, L.; Rong, M.; Wu, Y.; Niu, C. Thermodynamic properties and transport coefficients of high-temperature CO2 thermal plasmas mixed with C2F4. J. Phys. D Appl. Phys. 2015, 48, 495202. [Google Scholar] [CrossRef]
- Khalid, R.; Yaqub, K.; Yaseen, S.; Javeed, S.; Ashraf, A.; Janjua, S.A.; Ahmad, S. Sputtering of graphite in pulsed and continuous arc and spark discharges. Nucl. Instrum. Meth. Phys. Res. B 2007, 263, 497–502. [Google Scholar] [CrossRef]
- Bystrzejewski, M.; Łabȩdź, O.; Lange, H. Diagnostics of carbon arc plasma under formation of carbon-encapsulated iron nanoparticles by optical emission and absorption spectroscopy. J. Phys. D Appl. Phys. 2013, 46, 355501. [Google Scholar] [CrossRef]
- Vekselman, V.; Feurer, M.; Huang, T.; Stratton, B.; Raitses, Y. Complex structure of the carbon arc discharge for synthesis of nanotubes. Plasma Sources Sci. Technol. 2017, 26, 065019. [Google Scholar] [CrossRef] [Green Version]
- Becerra, M.; Friberg, A. Arc jets blown by outgassing polymers in air. In Proceedings of the 20th International Conference on Gas Discharges and Their Applications GD2014, Orleans, France, 6–11 July 2014; Volume 1, pp. 1–4. [Google Scholar]
- Harilal, S.S.; Issac, R.C.; Bindhu, C.V.; Nampoori, V.P.N.; Vallabhan, C.P.G. Optical emission studies of C2 species in laser–produced plasma from carbon. J. Phys. D Appl. Phys. 1997, 30, 1703–1709. [Google Scholar] [CrossRef]
- Park, H.S.; Nam, S.H.; Park, S.M. Optical emission studies of a plume produced by laser ablation of a graphite target in a nitrogen atmosphere. Bull. Korean Chem. Soc. 2004, 25, 620–626. [Google Scholar]
- Camacho, J.J.; Diaz, L.; Santos, M.; Reyman, D.; Poyato, J.M.L. Optical emission spectroscopic study of plasma plumes generated by IR CO2 pulsed laser on carbon targets. J. Phys. D Appl. Phys. 2008, 41, 105201. [Google Scholar] [CrossRef]
- Parigger, C.G.; Hornkohl, J.O.; Nemes, L. Time-resolved spectroscopy diagnostic of laser-induced optical breakdown. Int. J. Spectrosc. 2010, 2010, 593820. [Google Scholar] [CrossRef] [Green Version]
- Witte, M.J. Diatomic Carbon Measurements with Laser-Induced Breakdown Spectroscopy. Master’s Thesis, University of Tennessee, Knoxville, TN, USA, 2015. [Google Scholar]
- Reynaud, O.; Picard, J.P.; Parizet, M.J. Rotational Temperatures Determined from C2 Molecular Band Spectra in a Thermal Argon Plasma Interacting with Insulating Materials. Spectrosc. Lett. 1995, 28, 1007–1014. [Google Scholar] [CrossRef]
- Sakuyama, T.; Amitani, K.; Tanaka, Y.; Uesugi, Y.; Kaneko, S.; Okabe, S. Investigation on Spatial Temperature Decay of Thermal Plasma with Polymer Ablation. J. Plasma Fusion Res. Ser. 2008, 8, 732–735. [Google Scholar]
- Hong, D.; Sandolache, G.; Lan, K.; Bauchire, J.M.; Le Menn, E.; Fleurier, C. A radiation source developed for broad band optical absorption spectroscopy measurements. Plasma Sources Sci. Technol. 2003, 12, 1. [Google Scholar] [CrossRef]
- Günther, K.; Radtke, R. A proposed radiation standard for the visible and UV region. J. Phys. E Sci. Instrum. 1975, 8, 371–376. [Google Scholar] [CrossRef]
- Cheon, J.; Kang, H.K.; Zink, J.I. Spectroscopic identification of gas phase photofragments from coordination compound chemical vapor deposition precursors. Coord. Chem. Rev. 2000, 200–202, 1009–1032. [Google Scholar] [CrossRef]
- Pearse, R.W.B.; Gaydon, A.G. The Identification of Molecular Spectra, 3rd ed.; Chapman and Hall: London, UK, 1963. [Google Scholar]
- SpecLine-Spectral Line Idenfication for Atoms and Molecules. Available online: https://www.plasus.de (accessed on 10 September 2020).
Figure 1.
Setups (a) with a closed, long polytetrafluoroethylene (PTFE) nozzle for experiments with strong ablation and high pressure built-up and vertical observation slits in the middle and (b) with two separated PTFE nozzles forming a heating channel for plasma flow into a heating volume as used for the model circuit breaker.

Figure 2.
(top) Arc current at the end of discharge. (bottom) Xe lamp current (red) and development of its emission intensity (blue squares).
Figure 2.
(top) Arc current at the end of discharge. (bottom) Xe lamp current (red) and development of its emission intensity (blue squares).

Figure 3.
(left) Photo (grey) of observation window. (right) Two-dimensional optical emission spectroscopy frame at 7.3 ms before current zero (CZ).
Figure 3.
(left) Photo (grey) of observation window. (right) Two-dimensional optical emission spectroscopy frame at 7.3 ms before current zero (CZ).

Figure 4.
(Top): 2D spectrum over the full arc cross-section (upper part) together with the corresponding 1D spectrum from central arc position (lower part) in the spectral range around the C Swan band head at 563.7 nm-Swan band on the left side and C II lines on the right side. (Bottom left): Spectrally integrated line intensities of the carbon ion line C II 566.2 nm and of the C Swan band line at 562.8 nm, labeled by yellow arrows. (Bottom right): Inverse Abel transformation carried out for these intensities to reveal the origin of emission.

Figure 5.
(top) Spectrum acquired 300 s before CZ with setup (a) and 8 kA peak current. It is completely dominated by molecular radiation of C Swan bands (band heads labeled by arrows). (bottom) Spectrally integrated line intensities (left) and emission coefficient obtained from Abel inversion (right) of the C Swan band emission at 562 nm.

Figure 6.
Spectrum acquired with setup (b) during high-current phase. The typical structure of the C Swan bands was found as an absorption pattern with the plasma in the arc center serving as background radiator. The band heads are labeled by arrows.
Figure 6.
Spectrum acquired with setup (b) during high-current phase. The typical structure of the C Swan bands was found as an absorption pattern with the plasma in the arc center serving as background radiator. The band heads are labeled by arrows.

Figure 7.
Optical absorption spectroscopy. (Top): Overview emission spectra of Xe lamp only. (Middle): Xe lamp with discharge of 5 kA peak current and setup (b), acquired at CZ with 50 s exposure time. (Bottom): Spatially integrated transmission calculated from above spectra showing absorption around 500 nm.

Figure 8.
Spectral absorption measured around CZ (dashed blue) compared with CuF emission from [25] (black line).
Figure 8.
Spectral absorption measured around CZ (dashed blue) compared with CuF emission from [25] (black line).

Figure 9.
(top) Series of detail transmission spectra after current zero. (bottom) Temporal development of absorption peak at 493 nm calculated as area under curve (AUC, open circles) and AUC normalized by background intensity (filled squares).
Figure 9.
(top) Series of detail transmission spectra after current zero. (bottom) Temporal development of absorption peak at 493 nm calculated as area under curve (AUC, open circles) and AUC normalized by background intensity (filled squares).

Figure 10.
Temporal evolution of the spectral range around 493 nm with CuF absorption (Time to CZ is from (bottom) to (top), the color scale reaches from black for lowest emission to blue, green, and red for highest intensities).
Figure 10.
Temporal evolution of the spectral range around 493 nm with CuF absorption (Time to CZ is from (bottom) to (top), the color scale reaches from black for lowest emission to blue, green, and red for highest intensities).


| Wavelength | Relative | Lower Level | Upper Level | Transition | Quantum | Number | System | |
|---|---|---|---|---|---|---|---|---|
| nm | Intensity | eV | eV | Upper | Lower | |||
| 478.19 | 400 | 0 | 2.51 | X | C | 0 | 1 | C |
| 490.13 | 500 | 0 | 2.44 | X | B | 0 | 1 | B |
| 492.68 | 600 | 0 | 2.51 | X | C | 1 | 1 | C |
| 493.20 | 800 | 0 | 2.51 | X | C | 0 | 0 | C |
| 505.23 | 600 | 0 | 2.44 | X | B | 1 | 1 | B |
| 506.11 | 700 | 0 | 2.44 | X | B | 0 | 0 | B |
| 508.64 | 200 | 0 | 2.51 | X | C | 1 | 0 | C |
| 567.72 | 500 | 0 | 2.18 | X | A | 2 | 2 | A |
| 568.57 | 600 | 0 | 2.18 | X | A | 1 | 1 | A |
| 569.43 | 600 | 0 | 2.18 | X | A | 0 | 0 | A |
© 2020 by the authors. Licensee MDPI, Basel, Switzerland. This article is an open access article distributed under the terms and conditions of the Creative Commons Attribution (CC BY) license (http://creativecommons.org/licenses/by/4.0/).
Share and Cite
MDPI and ACS Style
Methling, R.; Götte, N.; Uhrlandt, D. Ablation-Dominated Arcs in CO2 Atmosphere—Part II: Molecule Emission and Absorption. Energies 2020, 13, 4720. https://doi.org/10.3390/en13184720
AMA Style
Methling R, Götte N, Uhrlandt D. Ablation-Dominated Arcs in CO2 Atmosphere—Part II: Molecule Emission and Absorption. Energies. 2020; 13(18):4720. https://doi.org/10.3390/en13184720
Chicago/Turabian StyleMethling, Ralf, Nicolas Götte, and Dirk Uhrlandt. 2020. "Ablation-Dominated Arcs in CO2 Atmosphere—Part II: Molecule Emission and Absorption" Energies 13, no. 18: 4720. https://doi.org/10.3390/en13184720
Note that from the first issue of 2016, this journal uses article numbers instead of page numbers. See further details here.