The Implications of Vertical Strategic Interaction on Green Technology Investment in a Supply Chain


1
School of Management and Economics, University of Electronic Science and Technology of China, Chengdu 611731, China
2
Department of Logistics, School of Business Administration, Jiangxi University of Finance and Economics, Nanchang 330013, China
*
Authors to whom correspondence should be addressed.
Sustainability 2020, 12(18), 7441; https://doi.org/10.3390/su12187441
Submission received: 17 July 2020
/
Revised: 26 August 2020
/
Accepted: 7 September 2020
/
Published: 10 September 2020
(This article belongs to the Special Issue Green and Sustainable Solutions for the Environment)
Abstract
:Numerous studies on supply chains have indicated that vertical strategic interactions usually involve the classical double marginalization problem, leading to a downward distortion in profitability. However, at present, the implications of vertical strategic interactions for green technology investment in a supply chain are not all that clear. In particular, such a vertical interaction not only can translate into profits between different parties, but usually also involves differentiated environmental performance. A question which arises is: who is the right undertaker for green technology investment in a supply chain, the supplier or retailer? To answer this question, we highlight the implications of vertical strategic interaction for green technology investment in a supply chain. To fill this gap, using a game-theoretic approach, we formulate two models: (a) Model M, in which an upstream manufacturer adopts technologies to meet consumer demand; and (b) Model R, where a retailer integrates environmental concerns into their supply chain decisions. We find that the retailer, who is closer to the customer, is the more effective undertaker for green technology investment, as this not only creates higher profitability for both parties, but also achieves a more sustainable scheme for our environment. When green technologies are invested in by the manufacturer, the double marginalization effect not only may downward-distort their economic performance but can also reduce the equilibrium of product greenness.
1. Introduction
In view of reducing the potential global disease burden, more and more countries and environmental groups have spared no effort in protecting the living environment, advocating for green lifestyles, and enhancing residential quality [1,2]. For instance, to advocate for a green lifestyle, the US Environmental Protection Agency has described the calculations used to convert greenhouse gas emission numbers into different types of equivalent units [3]. As a result of this tendency, in recent decades more and more consumers have paid attention to their environment pollution and have generally come to believe that they should join a new lifestyle in which green technologies are an integral part [4]. For example, to fight global warming, 66% of Americans believe that the U.S. should join an international treaty to reduce carbon emissions [1]. Accordingly, a survey of more than 1000 U.S. consumers found that most Americans say the current “top priority” should be protecting the environment from the effects of energy development and use [5]. Similarly, 75% of European citizens would be willing to purchase ecologically friendly products for their daily needs, even if they have to pay a little more for a “green” lifestyle [6].
To meet these changes in consumer market, research into supply chain management has been pursued, with innovative management practices being developed to encompass all parties and achieve the green goals in the supply chain [7]. For example, the concept of a green supply chain has designed with the integration of environmental considerations, such as innovating and/or adopting green technologies into the supply chain [8,9]. In practice, many firms intend to implement green technologies, ensuring that upstream agents and downstream agents work together to incorporate environmental responsibility as an integral part of the supply chain. For instance, approximately 80% of the total annual supply chain spending of Advanced Micro Devices (AMD, Inc., Santa Clara, CA, USA) is used to track the environmental risks of wafers, outsourced assembly and testing (OSAT), direct materials (e.g., substrates, lids, capacitors, memory), and boards inclusive of components.
Green technology innovation generation in supply chain relationships can occur as a consequence of two different modes. On one hand, many brand name manufacturers, including Eastman Kodak and Fuji Photo Film, have adopted green technologies for production processes with their single-use cameras, re-manufacturing them up to 10 times for file processing [10]. Similarly, Mattel and Kimberly-Clark have also revolutionized their supply chain by decreasing the amount of packaging material used, cutting back on their use of toxic chemicals, conserving water, decreasing their greenhouse gas emissions, and so forth [11]. On the other hand, acting as a vigorous new breed of regulators, many powerful retailers have also integrated environmental concerns into their supply chain decisions. For example, Walmart has integrated green goals into its supply chain and adopted many new technologies to minimize air pollution through requiring manufacturers to provide green efforts, in terms of their packaging material used, and asked them to report on their environmental performance.
Innovation generation in supply chain relationships, both incremental and radical, is a consequence of interactions between upstream and downstream agents [12]. This strategic vertical interaction usually results in the classical double marginalization problem, which refers to when two independent firms, upstream and downstream, both set their prices with marginal costs which, therefore, are incurred twice. As a result, both the upstream agent and the downstream agent simultaneously exercise their market power to maximize their own profit, resulting in higher retail prices and lower sale quantities and profits [13]. This problem may be traced back to [14], though [13,15] also discussed it in detail. Although numerous studies have paid attention to vertical strategic interactions and highlighted the effect of the classical double marginalization problem on economic performance, the implications of vertical strategic interactions for green technology investment in a supply chain remain unclear. However, such vertical interactions not only translate into profits between different parties, but usually also involve differentiated environmental performance; for example, if the manufacturer invests into green technologies, the manufacturer usually increases their wholesale price to translate into profits for its green efforts, which results in a reduction in the retailer’s output. However, when the retailer invests into the green technologies, the manufacturer is less likely to reduce the quantity transferred in order to increase its wholesale price.
To fill this gap, based on observations from current practice, we consider two models: (a) Model M, in which an upstream manufacturer invests in green technologies and encompasses all parties to achieve the green goals in the supply chain; and (b) Model R, where a retailer integrates environmental concerns into their supply chain decisions and asks the related manufacturers to provide green efforts in their environmental performance. Using these two models, we intend to address a question that is raised: how do the differentiated vertical strategic interactions impact on green technology investment in a supply chain? More specifically, we focus on the following questions:
- How do the differentiated vertical interactions between the manufacturer and the retailer affect the optimal decisions?
- do the differentiated vertical interactions between the manufacturer and the retailer affect the optimal green level?
- How do the differentiated vertical interactions between the manufacturer and the retailer affect the optimal profitability in a supply chain?
The contributions of this paper are threefold. First, numerous researchers have paid attention to the impact that strategic vertical interactions have on economic performance in a supply chain. However, little attention has been paid to the economic and/or environmental implications of the green technologies of different parties in a supply chain. Thus, we complement the current literature to highlight the fact that many brand name manufacturers, such as Eastman Kodak, Fuji Photo Film, Mattel, and Kimberly-Clark, have actively revolutionized their supply chain in order to integrate green technologies through decreasing the amount of packaging material, cutting back on the use of toxic chemicals, conserving water, decreasing greenhouse gas emissions, and so on. Second, although the current literature has highlighted green technologies in supply chains, the implications of green decisions between different parties with strategic vertical interactions are not all that clear. Therefore, we contribute to this line of literature by addressing the implications of vertical strategic interaction on green technology investment in a supply chain. Finally, our paper sheds new light on the environmental implications of green technology models; in particular, our analysis reveals that, compared to green technologies driven by manufacturers, the investment of retailers into green technologies not only creates more profitability for both parties, but also achieves a greener scheme for our environment; that is, when the green technologies are invested in by the manufacturer, the double marginalization effect not only can downward distort the economic performance, but may also reduce the equilibrium of product greenness.
This paper is organized as follows. Section 2 provides the supporting literature and explains our contributions in more detail. Section 3 outlines the assumptions and development of our model. Section 4 analyzes our results, in terms of optimal decisions and profitability. Section 5 presents our discussion and provides future research directions.
2. Literature Review
The first related area in the literature is on vertical interactions associated with R&D investment between the manufacturer and retailer in a supply chain. In particular, [16] investigated the optimal strategies for firms to invest in their manufacturers, where the benefits of such investments can spill over to other firms who also source from the same manufacturers. In [17], the joint investment by a buyer and a manufacturer in improving the manufacturer’s capacity using a Stackelberg game model was studied. The results showed that, although the order inflation strategy increases the buyer’s optimal order quantity, it does not co-ordinate the supply chain. In [18], a network equilibrium model which considers competing supply chain firms who can strategically invest in the new capacity of manufacturers under cost and demand uncertainties was developed. Meanwhile, [19] examined the interaction between technology upgrade and a buyer entering into a supply chain, where an incumbent buyer who upgrades a manufacturer’s production technology through direct investments may face a rival buyer entering the market by purchasing from the common manufacturer. In [20], the role of power relationships and co-ordination in sustainable supply chain management was examined. Likewise, [21] studied several co-operation contracts within a two-echelon green supply chain and investigated their environmental performance. In [22], quantitative models of two-echelon environmentally responsible closed-loop supply chains were developed to investigate joint environmental responsibility investment, pricing, and collection rate decisions. In spite of the fact that there have been numerous studies highlighting the effects of vertical interaction on R&D investment between the manufacturer and the retailer in the supply chain, we require more understanding of R&D investment at the micro level [23]. In particular, little attention has been paid to the issue of how green technology decisions are impacted by the vertical rivalry between the manufacturer and the retailer. Thus, we complement the above literature to highlight the fact that many brand name manufacturers, such as Eastman Kodak, Fuji Photo Film, Mattel, and Kimberly-Clark, have also actively revolutionized their supply chain to integrate green technologies through decreasing the amount of packaging material, cutting back their use of toxic chemicals, conserving water, decreasing greenhouse gas emissions, and so on.
In recent decades, green technologies, as an emerging technical innovation, have had significant importance in operational management [24]. In particular, [25] explored the green R&D co-operation behavior of firms in a two-echelon supply chain, in which a manufacturer and a retailer first co-operate to invest in green R&D. Subsequently, [26] investigated the green investment of two competing manufacturers in a supply chain, based on price and quality competition, and analyzed the effect of green investment on the quality level of the product. Meanwhile, [27] studied a dual-channel closed-loop supply chain consisting of one manufacturer and one retailer, and [28] introduced the concept of equity as the incentive mechanism to co-ordinate the green supply chain, which is a function of carbon emissions permits and the revenue generated by the firms. In [29], clean technology investment in a competitive environment was investigated for a supply chain consisting of one manufacturer and two retailers. Although the above literature has highlighted green technologies in supply chains with horizontal competition between manufacturers or retailers, the implications of the vertical interactions between the manufacturer and the retailer in a supply chain remain unclear. Therefore, we contribute to this line of literature by further addressing how the vertical rivalry between an upstream agent and a downstream agent impacts the green technology investment in a supply chain.
A few studies have recently begun to analyze the implications of the green mandates of retailers in a supply chain. In particular, [30] traced the strategic initiatives that Walmart has undertaken over the last decade in order to implement its ambitious vision of selling more sustainable products. In [11], confronting Walmart’s sustainability mandate in a supply chain, the authors addressed issues of whether manufacturer fears are justified by studying the impact of Walmart’s sustainability mandate on the (short-term) shareholder values of its manufacturers. It should be noted that the aim of this paper is quite different. First, rather than addressing the impact of a dominant retailer’s sustainability mandate on the economic performance of its manufacturers, we highlight the implications of how the green decisions between different parties affects the economic and/or environmental performance in a supply chain. Second, although the largest retailers are getting bigger and requiring their manufacturers to provide green efforts towards their environmental performance, many brand name manufacturers, such as Eastman Kodak, Fuji Photo Film, Mattel, and Kimberly-Clark, have initiatively revolutionized their supply chain, integrating green technologies through decreasing their use of packaging material, cutting back on their use of toxic chemicals, conserving water, decreasing greenhouse gas emissions, and so on.
3. Model Description and Assumptions
Consider a stylized two-echelon supply chain with one manufacturer and one retailer. The information of demand and cost between the two players is assumed to be symmetric. Both players are self-interested and view it as a common knowledge. The retailer buys a product from the manufacturer at the wholesale price of and sells it in the market at a price . All the products are produced by the manufacturer with a marginal cost of . We assume that consumers value environmentally friendly products with the green level of . That is, their demand can be illustrated as , where represents the potential market scale, is the self-price sensitivity, and is the marginal effect of green innovation on demand [25]. Consistent with [31], we assume that the green level is associated with the investment effort of the green technology, which is captured by a quadratic function , where denotes the coefficient of investment effort/cost.
Based on different ways of imposing green technology innovation requirements on the supply chain, we divide them into two situations: one in which the manufacturer drives the green technology innovation scheme (Model M), and another in which the retailer drives the green technology innovation scheme (Model R). In the situation of manufacturer investment into green technology (Model M), it is the manufacturer who intends to maximize their profit by determining the optimal greenness level and the wholesale price of their products. However, the retailer does not participate in the green technology investment and only makes the decision of selling price. In the situation of retailer investment into green technology (Model R), the manufacturer does not participate in the green technology investment and maximizes its profits only by setting the wholesale price, but the retailer profits by determining the optimal greenness level and the selling price of the products. By comparing the outcomes of these two models, we intend to address a question that this raises: how do these differentiated vertical strategic interactions affect green technology investment in a supply chain? More specifically, we focus on the following questions: (1) How do the differentiated vertical interactions between the manufacturer and the retailer affect the optimal decisions? (2) How do the differentiated vertical interactions between the manufacturer and the retailer affect the optimal green level? (3) How do the differentiated vertical interactions between the manufacturer and the retailer affect the optimal profitability in a supply chain?
Table 1 summarizes the notation used in this paper.
3.1. Manufacturer Investment in Green Technology (Model M)
In the manufacturer innovation scheme, the retailer’s objective is to maximize their profit by choosing the optimal price. The retailer’s problem, therefore, is:
As the manufacturer is responsible for the investment into green technology, the only selling cost for the retailer is the wholesale price set by the manufacturer. Maximizing the above retailer’s problem, it is easy to obtain .
It should be noted that, in Model M, apart from setting an appropriate wholesale price , the manufacturer also needs to choose the optimal green level . Thus, the manufacturer’s profit can be written as:
where the first term is the manufacturer’s profit from wholesaling green products, and the second term is the cost of investment in green technology.
Observing the retailer’s best response of by maximizing Equation (2), we can obtain the manufacturer’s optimal whole price as , where the optimal green level is . Then, the retailer’s equilibrium decision is calculated by substituting the best responses. The following proposition is obtained, regarding the manufacturer’s and the retailer’s optimal choices (for the proof, see Appendix A).
Proposition 1.
Under Model M, the optimal prices and green level are , , and .
Based on Proposition 1, by substituting both optimal decisions of and , the manufacturer’s profit can be written as . However, the retailer’s profit, , depends on the manufacturer’s decisions of and and their own choice of , such that . Aggregating the profits from the supply chain, we can calculate the industry total profit as .
3.2. Retailer Investment in Green Technology (Model R)
Under the retailer innovation scheme, the retailer is responsible for green technology investment. Therefore, under Model R, the retailer’s problem can be written as follows:
It should be noted that, unlike in Model M, the retailer is responsible for the investment into green technology in Model R and, thus, the selling cost for the retailer includes the wholesale price set by the manufacturer and the cost of investment into green technology. The first-order conditions imply that and .
The manufacturer, who takes into account the retailer’s choices, acts accordingly and, thus, the manufacturer’s problem is:
The equilibrium condition under Model R is described by the following proposition (for proof, see Appendix B).
Proposition 2.
Under Model M, the optimal prices and green level are , , and .
Anticipating the retailer’s investment into green technologies, the manufacturer adjusts their wholesale price. Their profit under Model R becomes . The retailer’s profit can be written as . Therefore, the total industry profit is .
Based on the outcomes in Proposition 2, we further find that the manufacturer’s wholesale price in Model R does not depend on parameters related to environmental investment, such as or . This is quite intuitive; in the situation of retailer investment into green technology (Model R), the manufacturer does not participate in the green technology investment and maximizes its profits through setting the wholesale price. However, the retailer profits by determining the optimal greenness level and selling price of the products.
4. Results and Discussion
Table 2 provides a summary of the key variables across different innovation schemes. In the following sub-sections, to ensure all the optimal decisions are positive (such as in [32]), we assume that and discuss the differences in more detail in the next several propositions.
4.1. Analysis of Difference in Optimal Decisions
We first compare the wholesale prices between both models. Based on the outcomes in Table 2, we find that if the innovation is costly and increased consumer willingness to pay for the (green) product does not cover the innovation investment, then the manufacturer innovation scheme leads to a higher wholesale price. More specifically, we have the following proposition (proof—see Appendix C):
Proposition 3.
The optimal wholesale price in Model R is lower than that in Model M; that is, .
Proposition 3 shows that, compared with the case when green technology is invested in by the retailer, the manufacturer sets a higher wholesale price if it is responsible for the investment into green technology. This result is quite intuitive; in Model M, it is the manufacturer who intends to maximize their profit by determining the optimal greenness level and the wholesale price of the products. However, the retailer is responsible for the decision of selling prices. As a result, the manufacturer sets a higher wholesale price in Model M in order to cover the cost of investing in the green technology. Conversely, in the situation of the retailer investing into green technology (Model R), the retailer profits by determining the optimal greenness level and retail price of the products. It should be noted that consumers value environmentally friendly products with the green level of ; that is, the higher the green level of , the higher the retail price, which induces the wholesale price to also increase. As a result, in order to encourage the retailer to engage in investing into the green technology, the manufacturer should set a lower wholesale price in Model R.
When it comes to the price that the retailer charges to the consumers, the comparison is a little more interesting with additional cases. In particular, based on the outcomes in Table 2, we can conclude the following proposition (for proof, see Appendix D):
Proposition 4.
Compared with the manufacturer innovation scheme, if , the optimal retail price is lower in the retailer investment scheme (i.e., ); otherwise, the relation is reversed.
Proposition 4 indicates that the prices of different innovation schemes can be industry-specific. In particular, Proposition 4 reveals that there is the threshold for the coefficient of investment effort (i.e., ), above which the retail price in Model M is higher than that in Model R (); however, the opposite is true when . This can be interpreted as follows: when the coefficient of investment effort is high (i.e., ), the (upstream agent’s) manufacturer’s marginal costs are high. To cover the cost of investing into green technology, the manufacturer has no choice but to charge a higher wholesale price. This results in even higher marginal costs (i.e., wholesale price) for the retailer; as a result, the retailer has no choice but to set a higher retail price in Model M than that in Model R, due to the double marginalization problem raised between both parties. On the other hand, when the coefficient of investment satisfies , it is a profitable behavior to invest in green technology. To avoid unduly reducing the output of the retailer and to cover the costs of investing into green technology, the retailer would be less likely to decrease the retail price in Model R.
4.2. Analysis Difference in Environmental Performance
We now focus on how the green decisions between vertical interaction affect the optimal green level in a supply chain. Based on the outcomes of Propositions 1 and 2, the comparison shows that the retailer innovation scheme always yields a higher investment in green technology (for the proof, see Appendix E).
Proposition 5.
The optimal green level under the retailer-driven scheme is greater than that in the manufacturer-driven innovation scheme ().
Proposition 5 indicates that, compared the manufacturer-driven scheme, when the retailer drives the green technology innovation, they contribute a higher level of environmental sustainability. One might expect that, acting as an upstream agent and producing products, a manufacturer would heavily invest into green technologies in order to bolster its products’ wholesaling. In fact, this logic misses a key point: all products are wholesaled to the retailer, who can set the preferred retail price. Furthermore, the higher the environmental sustainability, the higher the wholesale price for the retailer; that is, if the manufacturer heavily invests into green technologies, in order to cover the investment costs, they must set a higher wholesale price for the retailer. It should be noted that, as the double marginalization problem is raised between both parties, the higher wholesale price leads to even higher retail prices and less units sold to end consumers. However, under the retailer-driven scheme, if the retailer invests more into green technologies, they can set a preferred retail price to consumers and not worry about the double marginalization problem.
In both innovation schemes, we further found that the equilibrium green level increases with respect to marginal utility of consumers from the green technology, , and decreases with respect to the marginal cost of the innovation investment . Moreover, the gap between the retailer- and manufacturer-driven innovation schemes increases with and decreases with . Thus, we may conclude that, with a stronger marginal utility of consumers with respect to the green technology, the gap, in terms of the green levels of the models, increases.
4.3. Analysis of Difference in Economic Performance
We now focus on how the vertical interactions between the manufacturer and the retailer affect the optimal profitability for different parties; that is, in this sub-section, we intend to address the difference in economic performance between both models. In Table 2, we calculate the corresponding profit differences , , and for the manufacturer, retailer, and industry, respectively. The following proposition summarizes their relationship (for the proof, see Appendix F).
Proposition 6.
Both the manufacturer and retailer profits under the retailer innovation scheme are higher than those in the manufacturer innovation scheme ( and ).
Proposition 6 reveals that the retailer innovation scheme yields higher profits for both parties. Before interpretation, it should be noted that the retailer innovation scheme is greater than that in the manufacturer innovation scheme (i.e., ; see Proposition 5). Furthermore, we assume that the consumer demand is , meaning that the willingness to pay for the product increases as the green level increases. Proposition 6 can, thus, be interpreted as follows: the consumer willingness to pay for the product in Model R is always greater than that in Model M, as the green level of the retailer innovation scheme is greater than that of the manufacturer innovation scheme (i.e., ). As a result, the retailer benefits more under Model R than in Model M, due to the higher consumer willingness to pay for green technology in Model R.
On the other hand, the manufacturer’s wholesale price in Model R does not depend on parameters related to environmental investment, such as
or
(see the outcomes in Table 2). Anticipating that the manufacturer would not squeeze its margins from the investment into green technology, in exchange, the retailer would distribute more units from the manufacturer by setting a relatively low retail price. This is particularly true, as even when the coefficient of investment effort/cost is pronounced (i.e., ), the optimal retail price in the retailer-driven green technology investment scheme is lower than that under the manufacturer-driven scheme (i.e., ). As such, we find that the manufacturer also benefits more from Model R than Model M, as the retailer would compensate the manufacturer’s profit and intends to create a “win–win” result for both parties.
Based on Propositions 5 and 6, we can conclude that the retailer, who is closer to the customer, is the more effective undertaker for mandating green technologies in a supply chain, as this scheme not only creates higher profitability for both parties, but also achieves a more sustainable scheme for our environment. This argument is partly consistent with the result in [33], “ceteris paribus, the agent, who is closer to the customer (i.e., the retailer), is the most effective undertaker of the closed-loop supply chain”. However, this result, it should be noted, differs from the above in the following two main aspects: First, we highlight the implications of the green decisions between different parties in a supply chain, rather than on the choosing the appropriate reverse channel structure for the collection of used products from customers. Second, on a broader level, we intend to pay attention to how the green decisions between different parties effect their economic and/or environmental performance; however, they contributed to understanding about the interactions between reverse and forward channel decisions, as well as the incentives of the agents to invest in used-product collection under different reverse channel structures.
4.4. Numerical Analysis
In this sub-section, we illustrate the main theoretical results with numerical examples. Then, we provide a discussion regarding the impact of the coefficient of investment effort.
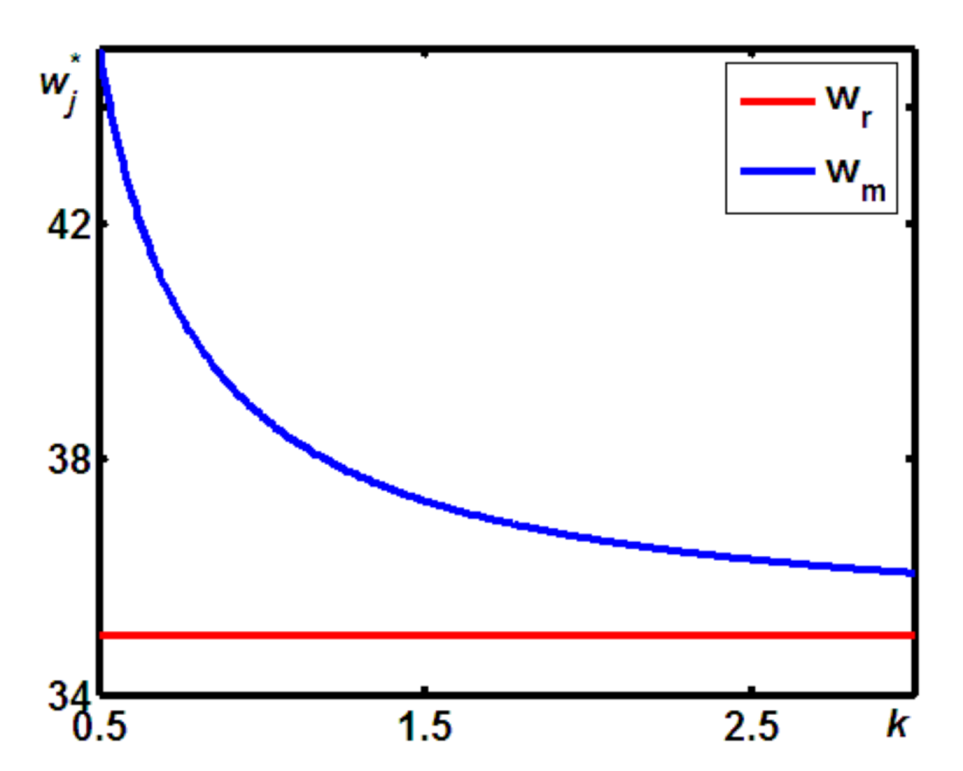
We first compared the optimal outcomes in Proposition 3. According to [32,34], we set the corresponding parameters as , , , , and . As illustrated in Figure 1, we obtained that, as shown in Proposition 3, the manufacturer always set a relatively lower wholesale price for the retailer in Model R than in Model M. In addition, Figure 1 further shows that, when the manufacturer invests in green technologies, the wholesale price decreases with the coefficient of investment; that is, when the investment in green technologies is more efficient (i.e., with a higher ), the manufacturer is more likely to set a lower wholesale price for the retailer. However, when the retailer invests in green technologies, the wholesale price does not depend on the coefficient of investment.
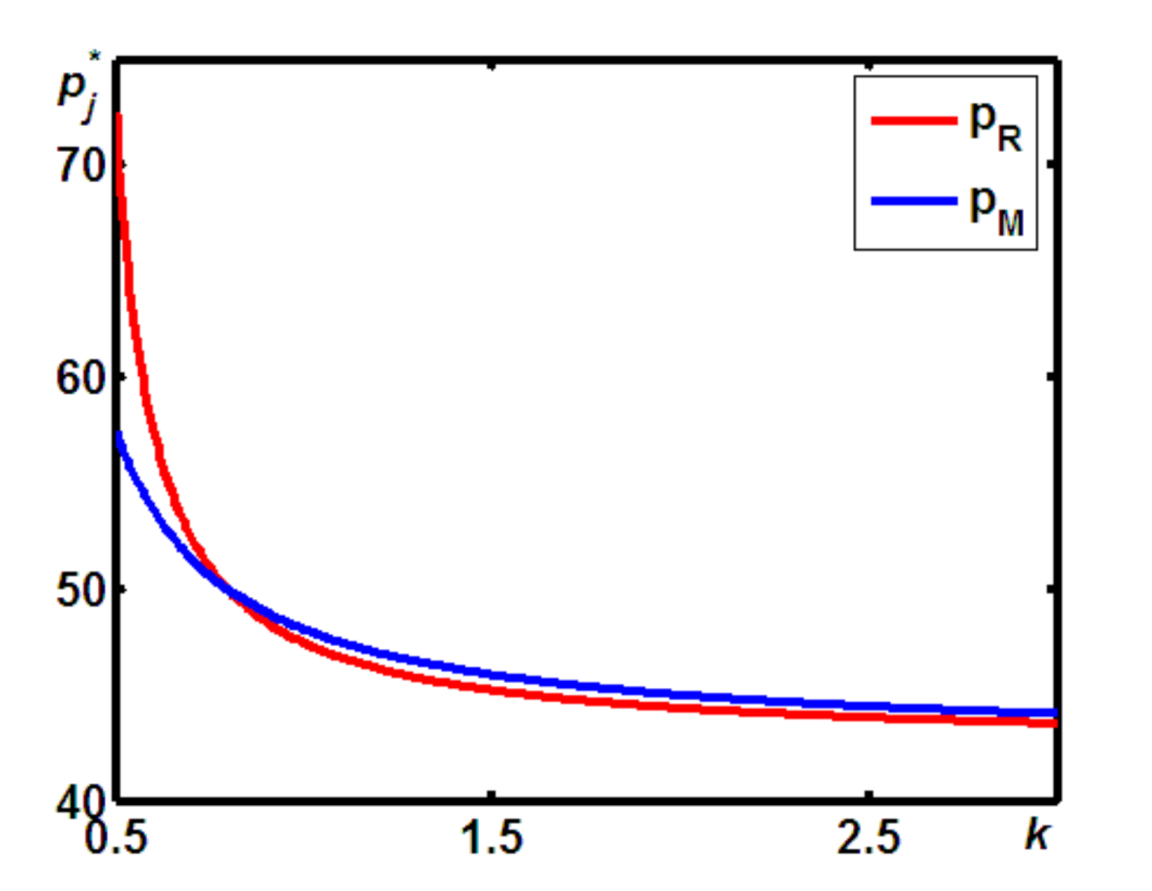
Interestingly, for the optimal prices in both models, we found that, as shown in Figure 2, when the coefficient of investment of was pronounced (i.e., ), the optimal retail price in Model R was lower than that in Model M; however, if , the optimal retail price in Model R was higher than that in Model M. Thus, the analytical and numerical comparison of prices between both models revealed that the prices of different innovation schemes can be industry-specific.
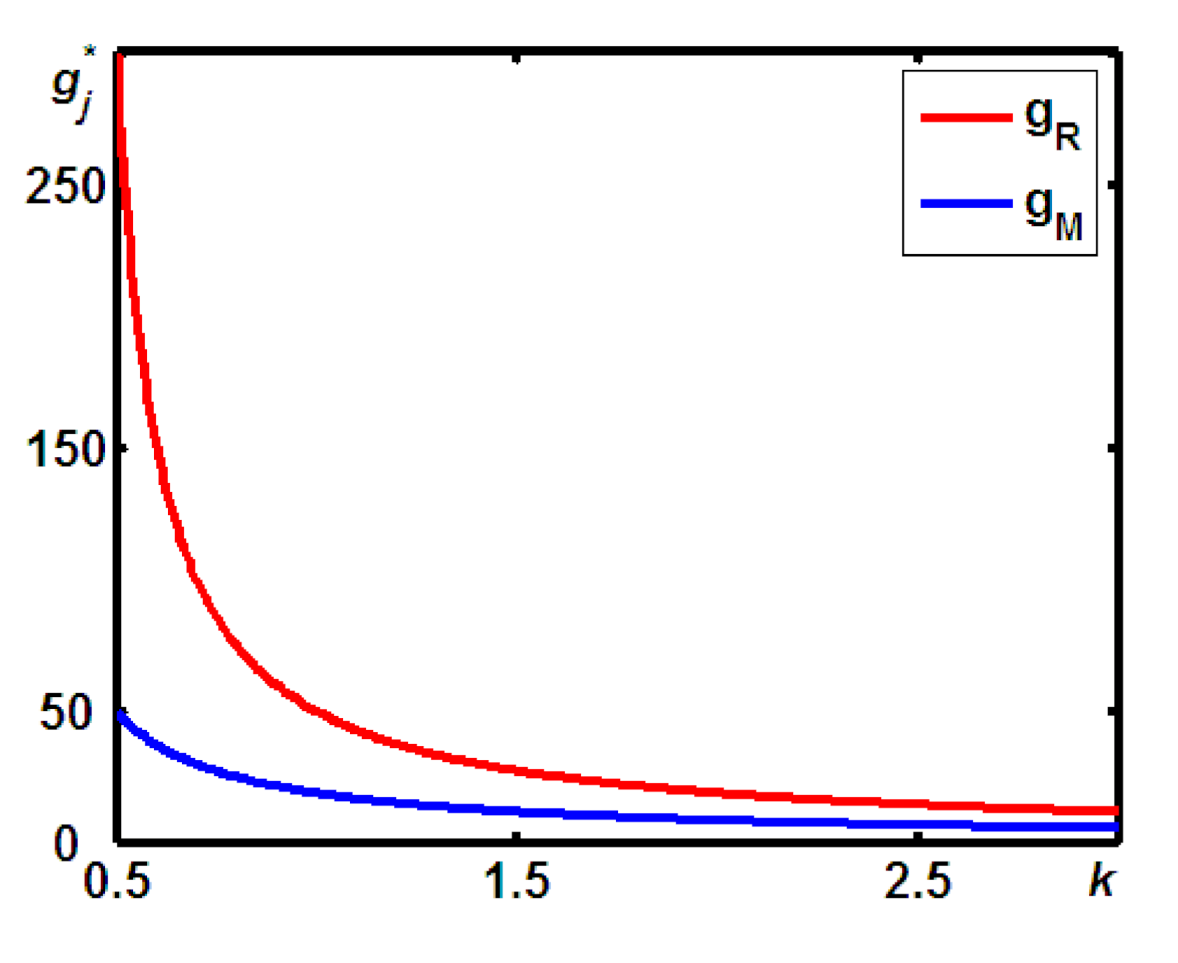
Figure 3 indicates that, for any coefficient of investment of , the optimal green level in the retailer innovation scheme was always higher than that in the manufacturer innovation scheme. The corresponding theoretical result is given in Proposition 5. Furthermore, based on Figure 3, we may conclude that, as the coefficient of investment of increases, the optimal green level under both schemes non-linearly decreases.
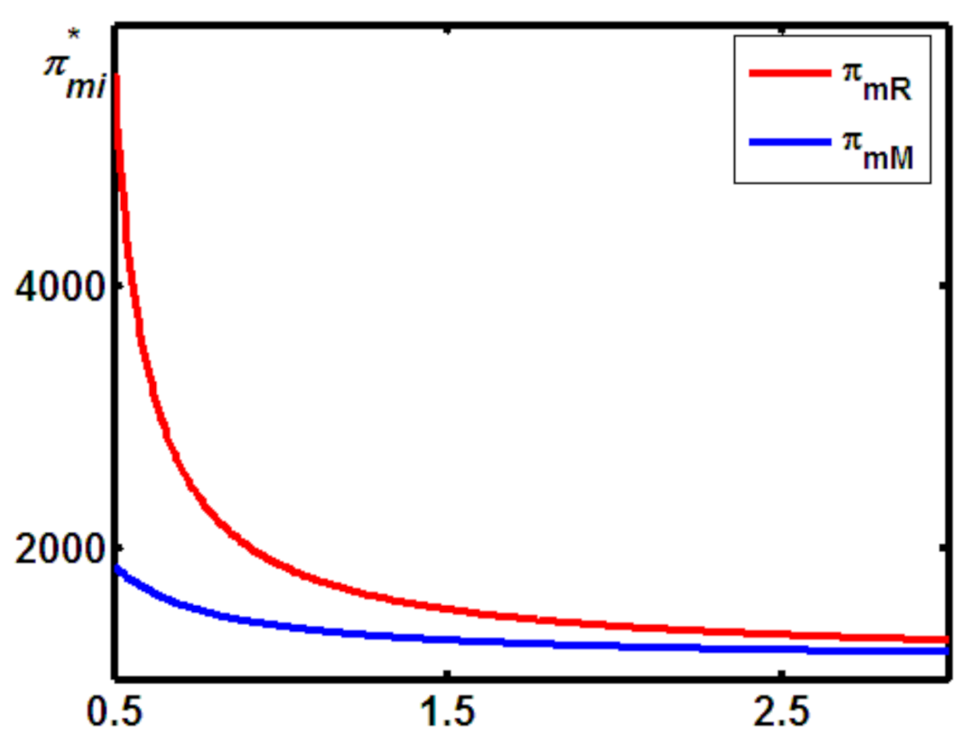
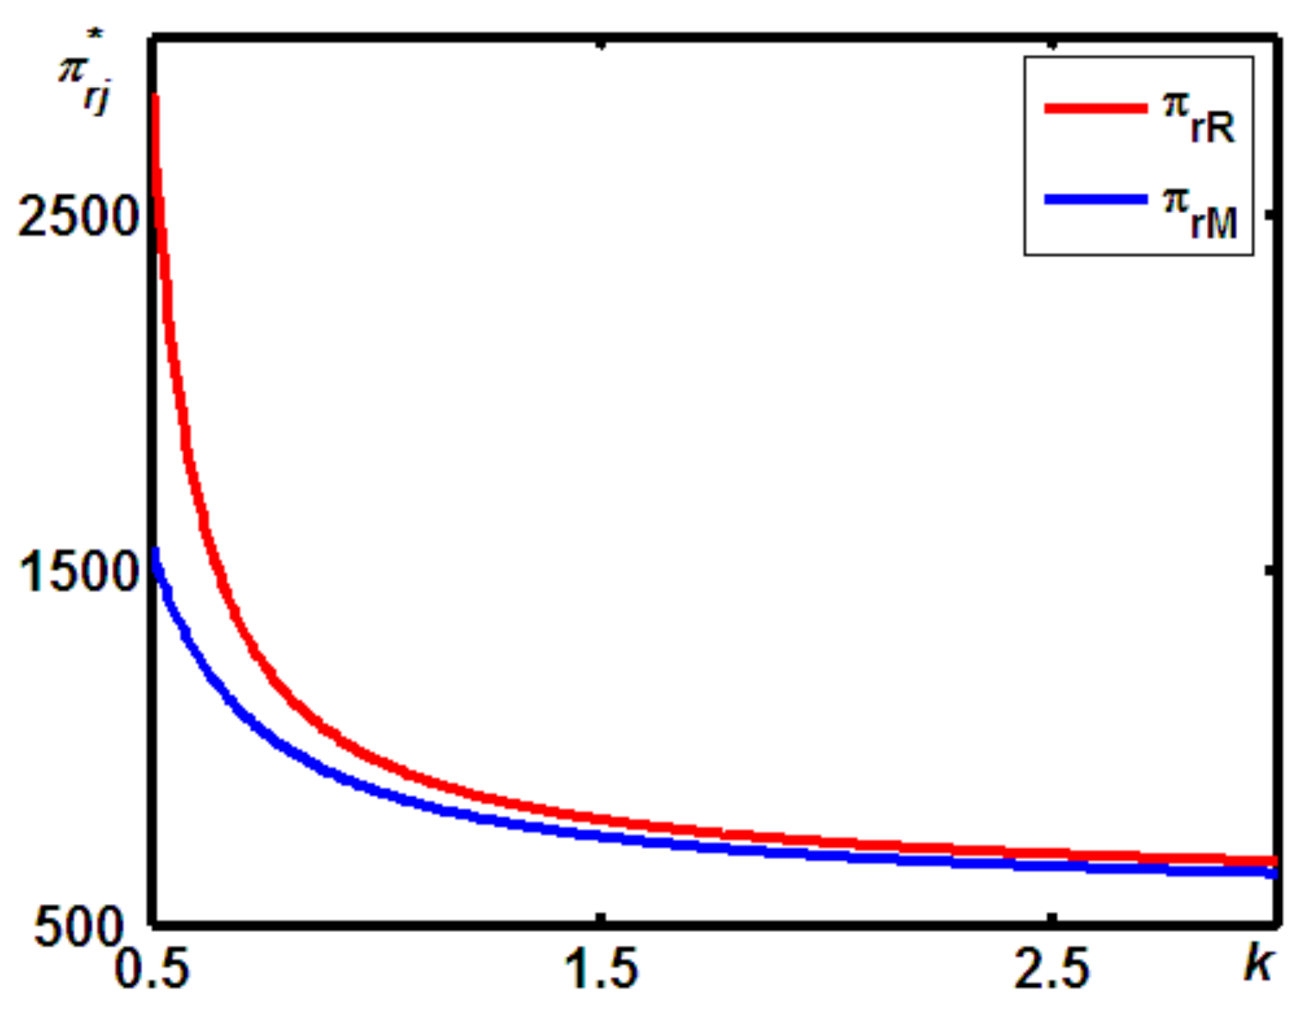
Figure 4 and Figure 5 provide the numerical analysis relating to Proposition 6, revealing several main generalizations. First, as Proposition 6 states, for any coefficient of investment , the profits of both parties under the retailer innovation scheme are always higher than those under the manufacturer innovation scheme. Second, the profits under both schemes non-linearly decreased as the coefficient of investment increased. Third, with higher values of the investment coefficient, the gap between the profit under both schemes narrowed. Thus, as shown in Proposition 6, Figure 4 and Figure 5 indicate that the economic performance of both parties under the retailer innovation scheme is always higher than that under the manufacturer innovation scheme.
Considering the above numerical comparisons between the retailer innovation scheme and the manufacturer innovation scheme, we can conclude that, if the coefficient of investment is above a certain threshold, the retailer innovation scheme yields the desired demand expansion by setting a relatively lower retailer price. More importantly, consistent with the results of the theoretical analysis, our numerical studies revealed that the retailer innovation scheme has the advantageous effect of creating higher green levels for our environmental and economic performance for both parties.
5. Conclusions
Environmental consciousness has become increasingly important in everyday life [35]. This tendency has resulted in more and more consumers becoming willing to purchase ecologically friendly products for their daily needs. To meet these changes in the market, manufacturers and/or retailers have pursued innovative management practices in order to incorporate environmental responsibility as an integral part of their supply chain. In particular, many brand name manufacturers, including Eastman Kodak, Fuji Photo Film, Mattel, and Kimberly-Clark, have adopted green technologies for use in their production processes. On the other hand, many powerful retailers, such as Walmart, have integrated environmental concerns and required their manufacturers to provide green efforts, in terms of their packaging materials, and have asked them to report on their environmental performance. A related question which arises is: who is the more suitable agent for investing in green technologies in a supply chain, the manufacturer or the retailer?
To answer this question, based on observations from current practice, we developed two models: (a) Model M, in which an upstream manufacturer invests in green technologies and encompasses all parties to achieve the green goals in the supply chain; and (b) Model R, where a retailer integrates environmental concerns into their supply chain decisions and asks its manufacturers to provide green efforts to improve their environmental performance.
The main theoretical results related to the effect of vertical strategic interaction on green technology investment in a supply chain can be summarized thus: the retailer innovation scheme has the advantageous effect of creating higher green levels for our environmental and economic performance for both parties. The intuition behind this result is that, if the manufacturer invests into green technologies, the double marginalization effect in the vertical strategic interaction not only may distort the economic performance of both parties, but can also reduce the equilibrium of product greenness.
This study adds to the growing literature on green supply chain management, and indicates that the classical double marginalization effect not only may distort the economic performance, but can also reduce the equilibrium of product greenness. Our results have important implications for practitioners. It is important that regulatory work provides leadership for green technology investment in supply chains. As our analysis showed, the retailer, who is closer to the customer, is the more effective undertaker for mandating green technologies in a supply chain.
Our models have some limitations which future studies may further explore. First, we only paid attention to the effect of vertical interactions on green technology investment in a supply chain; however, the green technology innovation is usually confronted with an R&D race under horizontal competition. Second, we conducted both theoretical analysis and modeling, but it would be interesting to conduct further empirical analysis on this subject. Third, we assumed that, in both models, the manufacturer acts as the Stackelberg game leader; however, in reality, the supply chain has been increasingly dominated by large, centrally managed “power retailers” who have wholesale bargaining power [36]. Finally, we assumed the both parties can symmetrically access information which, in reality, is difficult to achieve. It is worth addressing how the problem of information asymmetry could affect the research results; this direction may potentially add interesting avenues for investigating the effects of vertical interactions on green technology investment in a supply chain (we thank an anonymous reviewer for pointing this out).
Author Contributions
S.W. wrote the paper and designed the study. Y.C. and X.Z. developed the models and conducted the cases analysis. C.Z. designed the study. All the authors have read and agreed to the published version of the manuscript.
Funding
This research was funded by National Natural Science Foundation of China (71872027, 71961008).
Conflicts of Interest
The authors declare no conflict of interest.
Appendix A. Proof for Proposition 1
In both models, the manufacturer acts as a leader, while the retailer responds to the manufacturer’s and with the decisions of .
The model is solved by backward induction; that is, we first solve . Then, we can obtain that . Substituting this into the manufacturer’s profits and solving , we can obtain , . Substituting them into , , , and , we get the equilibrium in Proposition 1.
Appendix B. Proof for Proposition 2
Using backward induction again, we first solve , yielding and . Substituting these into gives . Substituting this into , , , and , we get the equilibrium in Proposition 2.
Appendix C. Proof for Proposition 3
As and , we have . Because , we also have . Thus, we get .
Appendix D. Proof for Proposition 4
We get this proposition from , which is obviously positive when ; that is, if , then is always true.
Appendix E. Proof for Proposition 5
We can obtain that the optimal product greenness in Model M is , while the optimal product greenness in Model R is . Solving , we find that, for any , is always true.
Appendix F. Proof for Proposition 6
The manufacturer’s optimal profit in the two models are and , respectively. Solving the optimal profit solutions of the manufacturer, we get and, thus, can find that, for any , is always true.
The retailer’s optimal profit in the two models are and , respectively. Solving the optimal profit solutions of the retailer, we get and, thus, can find that, for any , is always true.
References
- Anthony, S.; Jennifer, D.P.; Sarah, D.; Fred, B. Reducing Global Warming. 2015. Available online: https://www.cbsnews.com/news/global-warming-and-the-paris-climate-change-conference/ (accessed on 18 March 2020).
- Zhang, F.; Chen, H.; Xiong, Y.; Yan, W.; Liu, M. Managing collecting or remarketing channels: Different choice for cannibalisation in remanufacturing outsourcing. Int. J. Prod. Res. 2020, 1–16. [Google Scholar] [CrossRef]
- United States Environmental Protection Agency. Greenhouse Gases Equivalencies Calculator—Calculations and References. 2017. Available online: https://www.epa.gov/energy/greenhouse-gases-equivalencies-calculator-calculations-and-references (accessed on 18 December 2019).
- Xia, X.; Zhang, C. The impact of authorized remanufacturing on sustainable remanufacturing. Processes 2019, 7, 663. [Google Scholar] [CrossRef] [Green Version]
- ScienceDaily. Public Divides Over Environmental Regulation and Energy Policy. 2017. Available online: https://www.sciencedaily.com/releases/2017/05/170516143419.htm (accessed on 18 March 2020).
- Eurobarometer. Attitudes of European Citizens towards the Environment. 2008. Available online: https://www.europafacile.net/Formulari/POLITICHE/Ambiente/report_ebenv_2005_04_22_en.pdf (accessed on 18 December 2019).
- de Oliveira, U.R.; Espindola, L.S.; da Silva, I.R.; da Silva, I.N.; Rocha, H.M. A systematic literature review on green supply chain management: Research implications and future perspectives. J. Clean. Prod. 2018, 187, 537–561. [Google Scholar] [CrossRef]
- Walton, S.V.; Handfield, R.B.; Melnyk, S.A. The green supply chain: Integrating suppliers into environmental management processes. Int. J. Purch. Mater. Manag. 1998, 34, 2–11. [Google Scholar] [CrossRef]
- Seuring, S.; Müller, M. From a literature review to a conceptual framework for sustainable supply chain management. J. Clean. Prod. 2008, 16, 1699–1710. [Google Scholar] [CrossRef]
- Giuntini, R.; Gaudette, K. Remanufacturing: The next great opportunity for boosting US productivity. Bus. Horiz. 2003, 46, 41–48. [Google Scholar] [CrossRef]
- Gielens, K.; Geyskens, I.; Deleersnyder, B.; Nohe, M. The new regulator in town: The effect of Walmart’s sustainability mandate on supplier shareholder value. J. Mark. 2018, 82, 124–141. [Google Scholar] [CrossRef]
- Jean, R.-J.B.; Kim, D.; Sinkovics, R.R. Drivers and performance outcomes of supplier innovation generation in customer–supplier relationships: The role of power-dependence. Decis. Sci. 2012, 43, 1003–1038. [Google Scholar] [CrossRef]
- Lantz, B. The double marginalization problem of transfer pricing: Theory and experiment. Eur. J. Oper. Res. 2009, 196, 434–439. [Google Scholar] [CrossRef]
- Fisher, I. Researches into the Mathematical Principles of the Theory of Wealth; Macmillan: New York, NY, USA, 1897. [Google Scholar]
- Spengler, J.J. Vertical integration and antitrust policy. J. Political Econ. 1950, 58, 347–352. [Google Scholar] [CrossRef]
- Agrawal, A.; Kim, Y.; Kwon, H.D.; Muthulingam, S. Investment in shared suppliers: Effect of learning, spillover, and competition. Prod. Oper. Manag. 2016, 25, 736–750. [Google Scholar] [CrossRef]
- Golmohammadi, A.; Hassini, E. Investment strategies in supplier development under capacity and demand uncertainty. Decis. Sci. 2020. [Google Scholar] [CrossRef]
- Liu, Z.; Wang, J. Supply chain network equilibrium with strategic supplier investment: A real options perspective. Int. J. Prod. Econ. 2019, 208, 184–198. [Google Scholar] [CrossRef]
- Liu, G.; Shao, X.; Lang, X. On the interaction of technology upgrade and buyer entry in a supply chain. Int. J. Prod. Econ. 2020, 221, 107478. [Google Scholar] [CrossRef]
- Chen, X.; Wang, X.; Chan, H.K. Manufacturer and retailer coordination for environmental and economic competitiveness: A power perspective. Transp. Res. Part E Logist. Transp. Rev. 2017, 97, 268–281. [Google Scholar] [CrossRef] [Green Version]
- Hong, Z.; Guo, X. Green product supply chain contracts considering environmental responsibilities. Omega 2019, 83, 155–166. [Google Scholar] [CrossRef]
- Wu, W.; Zhang, Q.; Liang, Z. Environmentally responsible closed-loop supply chain models for joint environmental responsibility investment, recycling and pricing decisions. J. Clean. Prod. 2020, 259, 120776. [Google Scholar] [CrossRef]
- David, P.A.; Hall, B.H.; Toole, A.A. Is public R&D a complement or substitute for private R&D? A review of the econometric evidence. Res. Policy 2000, 29, 497–529. [Google Scholar]
- Yan, W.; Zhigang, J.; Conghu, L.; Wei, C. Green Technologies for Production Processes. 2020. Available online: https://www.mdpi.com/journal/processes/special_issues/green_production_process (accessed on 18 March 2020).
- Chen, X.; Wang, X.; Zhou, M. Firms’ green R&D cooperation behaviour in a supply chain: Technological spillover, power and coordination. Int. J. Prod. Econ. 2019, 218, 118–134. [Google Scholar] [CrossRef]
- Yang, S.; Ding, P.; Wang, G.; Wu, X. Green investment in a supply chain based on price and quality competition. Soft Comput. 2020, 24, 2589–2608. [Google Scholar] [CrossRef]
- Wang, J.; Jiang, H.; Yu, M. Pricing decisions in a dual-channel green supply chain with product customization. J. Clean. Prod. 2020, 247, 119101. [Google Scholar] [CrossRef]
- Chen, D.; Ignatius, J.; Sun, D.; Goh, M.; Zhan, S. Pricing and equity in cross-regional green supply chains. Eur. J. Oper. Res. 2020, 280, 970–987. [Google Scholar] [CrossRef]
- Shi, X.; Dong, C.; Zhang, C.; Zhang, X. Who should invest in clean technologies in a supply chain with competition? J. Clean. Prod. 2019, 215, 689–700. [Google Scholar] [CrossRef]
- Spicer, A.; Hyatt, D. Walmart’s emergent low-cost sustainable product strategy. Calif. Manag. Rev. 2017, 59, 116–141. [Google Scholar] [CrossRef]
- Ghosh, D.; Shah, J. A comparative analysis of greening policies across supply chain structures. Int. J. Prod. Econ. 2012, 135, 568–583. [Google Scholar] [CrossRef]
- Wei, Y.; Li, H.; Chai, J.; Qian, Z.; Hong, C. Owning or outsourcing? Strategic choice on take-back operations for third-party remanufacturing. Sustainability 2018, 10, 151. [Google Scholar]
- Savaskan, R.C.; Bhattacharya, S.; Wassenhove, L.N.V. Closed-loop supply chain models with product remanufacturing. Manag. Sci. 2004, 50, 239–252. [Google Scholar] [CrossRef] [Green Version]
- Xu, J.; Chen, Y.; Bai, Q. A two-echelon sustainable supply chain coordination under cap-and-trade regulation. J. Clean. Prod. 2016, 135, 42–56. [Google Scholar] [CrossRef]
- Swami, S.; Shah, J. Channel coordination in green supply chain management. J. Oper. Res. Soc. 2013, 64, 336–351. [Google Scholar] [CrossRef]
- Raju, J.; Zhang, Z.J. Channel coordination in the presence of a dominant retailer. Mark. Sci. 2005, 24, 254–262. [Google Scholar] [CrossRef] [Green Version]
Figure 1.
Comparing and .

Figure 2.
Comparing and .

Figure 3.
Comparing and .

Figure 4.
Comparing and .

Figure 5.
Comparing and .


Table 1.
Notation and definitions.
| Notation | Explanation |
|---|---|
| Market scale. | |
| Self-price sensitivity. | |
| The marginal effect of green innovation on consumer demand. | |
| k | The coefficient of green investment. |
| c | Marginal production cost. |
| Retailer price for Model j, where . | |
| Wholesale prices for Model j. | |
| The green level for Model j. | |
| Industry profits for Model j. | |
| Manufacturer profits for Model j. | |
| Retailer profits for Model j. |
Table 2.
Comparison of the analytical results.
| Optimal Decisions | Model M | Model R | Difference |
|---|---|---|---|
© 2020 by the authors. Licensee MDPI, Basel, Switzerland. This article is an open access article distributed under the terms and conditions of the Creative Commons Attribution (CC BY) license (http://creativecommons.org/licenses/by/4.0/).
Share and Cite
MDPI and ACS Style
Wang, S.; Cheng, Y.; Zhang, X.; Zhu, C. The Implications of Vertical Strategic Interaction on Green Technology Investment in a Supply Chain. Sustainability 2020, 12, 7441. https://doi.org/10.3390/su12187441
AMA Style
Wang S, Cheng Y, Zhang X, Zhu C. The Implications of Vertical Strategic Interaction on Green Technology Investment in a Supply Chain. Sustainability. 2020; 12(18):7441. https://doi.org/10.3390/su12187441
Chicago/Turabian StyleWang, Simeng, Yongsheng Cheng, Xiaoxian Zhang, and Chenchen Zhu. 2020. "The Implications of Vertical Strategic Interaction on Green Technology Investment in a Supply Chain" Sustainability 12, no. 18: 7441. https://doi.org/10.3390/su12187441
Note that from the first issue of 2016, this journal uses article numbers instead of page numbers. See further details here.