Layer Formation from Polymer Carbon-Black Dispersions
by
 , , and
Fabian Scheepers
1,* ,
,
Andrea Stähler
1,
Markus Stähler
1,
Marcelo Carmo
1,
Werner Lehnert
1,2 and
Detlef Stolten
1,3 
1
Forschungszentrum Jülich Gmbh Institute of Energy and Climate Research, Electrochemical Process Engineering (IEK-3), 52425 Jülich, Germany
2
Faculty of Mechanical Engineering, RWTH Aachen, 52062 Aachen, Germany
3
Chair for Fuel Cells, RWTH Aachen, 52062 Aachen, Germany
*
Author to whom correspondence should be addressed.
Coatings 2018, 8(12), 450; https://doi.org/10.3390/coatings8120450
Submission received: 19 October 2018
/
Revised: 29 November 2018
/
Accepted: 6 December 2018
/
Published: 7 December 2018
Abstract
:It has been well-established that effects such as cracking are observable when wet layers are dried. In particular, the layer thickness, as well as the surface tension of the liquid, is responsible for this behavior. The layer formation of polymer electrolyte fuel cells and electrolyzer electrodes, however, has not yet been analyzed in relation to these issues, even though the effect of cracks on cell performance and durability has been frequently discussed. In this paper, water propanol polymer-containing carbon-black dispersions are analyzed in situ with regard to their composition during drying. We demonstrate that crack behavior can be steered by slight variations in the initial dispersion when the solvent mixture is near the dynamic azeotropic point. This minor adjustment may strongly affect the drying behavior, leading to either propanol or water-enriched liquid phases at the end of the drying process. If the evaporation of the solvent results in propanol enrichment, the critical layer thickness at which cracks occur will be increased by about 30% due to a decrease in the capillary pressure. Microscopic images indicate that the crack area ratio and width depend on the wet layer thickness and initial liquid phase composition. These results are of much value for future electrode fabrication, as cracks affect electrode properties.
1. Introduction
Layer formation has already been studied for about a hundred years, both theoretically and experimentally [1]. Brown et al. [2] describe the mechanism as follows: During the evaporation of solvents the particle-particle distances shrink ultimately, leading to an agglomeration of solids. At this point, the layer formation process begins, additionally, preventing solid particles from freely moving through the layer. Residual solvent remains between the particles exerting capillary pressure by forming a liquid-gas phase boundary during the initial layer formation process. This pressure acts as a binder between the particles until further evaporation results in local depletion of the solvent content. If particles are unable to deform further shrinkage of the layer will unavoidably result in the cracking of the layer. The occurrence of cracking results from exceeding the critical stress that a layer can withstand. According to the Griffith criterion [3], this critical stress depends on the particle radius, volume fraction, shear modulus, and coordination number, as well as on the layer’s thickness and solvent interface tension.
Crack formation occurs during many processes, including the manufacturing of electrodes for polymer electrolyte membrane (PEM) fuel cells (FC) and electrolyzers (EL). In these applications, electrodes are mostly manufactured from catalyst dispersions containing perfluorosulfonic acid (PFSA) as proton- and carbon-supported catalysts and as electron-conducting materials [4]. The water-alcohol-based dispersion [5] can be applied by different methods ranging from printing [6] to blade or slot die coating [7] to generate a wet layer. However, the rupture of the catalyst layer is a frequent challenge to all coating techniques [8,9].
While layer-cracking is undesired in most applications, there is a discussion as to whether cracking might have positive effects on water and gas transport in fuel cells and electrolyzers [8]. In contrast to those mass transport effects, a loss of electronic contact is feared that could decrease the cell performance and its durability [8]. Studies regarding the impact of various solvents [10] and the carbon-to-PFSA ratio [11] on electrode properties have been conducted, but cracks are still understood to be an intrinsic property of solvents and evaporation rates and are difficult to control during the drying process. For investigating the impact of cracks on the electrode properties, a method for controlling crack formation during layer formation is desirable.
This work demonstrates how crack formation in a solid layer during the manufacturing process can be greatly influenced by only slightly varying the solvent mixture composition of the dispersion and the solid layer thickness. For the experiments, a dispersion consisting of 1-propanol, water, carbon, and Nafion was used. With this precious metal-free dispersion, chemical reactions between alcohol and the catalyst were avoided, guaranteeing only physical interactions between the dispersion components during manufacturing. This simplifies the system to the driving mechanism, as apart from that; the dispersion composition corresponds to a typical catalyst dispersion used for electrode production [12,13]. It allows minimizing cross correlations in this study which helps investigating the correlation between dispersion composition, film thickness and cracks. From the analytical side, the drying is under precise control and observed by gas-phase Fourier transform infrared (FTIR) spectroscopy [14], as well as crack areas being evaluated in a simple manner to disclose the driving forces.
2. Methods
2.1. Dispersions
Inspired by the usually used dispersions, carbon black dummy dispersions with 3 wt.% Nafion® (D1021, Chemours, Wilmington, DE, USA), 7 wt.% carbon black (Vulcan XC72, Cabot, Boston, MA, USA), and different propanol fraction ranging from 43 wt.% to 63 wt.% in water were generated. These dispersions are listed in Table 1.
2.2. Coating
A single-layer slot die (TSE Troller AG, Murgenthal, Switzerland) at the laboratory scale was used to apply the dispersion, described in detail by Burdzik et al. [15] to a vacuum-fixed glass fiber reinforced polytetrafluorethylene (PTFE) substrate (120 µm). The coating speed was set to 0.9 m·min−1. The dispersions were metered by means of a syringe pump (KDS Legato 210, KD Scientific, Ringoes, NJ, USA) to generate wet layer thicknesses of about 100 (4.5 mL·min−1), 133 (6.0 mL·min−1), 167 (7.5 mL·min−1) and 200 µm (9.0 mL·min−1) at a coating width of 50 mm. The adjustable coating length was set to 70 mm for these experiments. In total, 20 different combinations of wet layer thickness and dispersion composition were used for our experiments and their evaluation.
2.3. Drying Test Station
Wet layers generated were automatically transferred to the drying test station and dried under controlled conditions at 40 °C in a drying chamber (length: 160 mm, width: 75 mm, height: 25 mm). The chamber was flowed through by a defined laminar volume flow of 4.4 mm·s−1 nitrogen 5.0 (Air Liquid). The gas was preheated to the target temperature while the contact heating of the layer began after closing the system. With the drying process the gas was loaded with solvent and its composition was subjected to a time-resolved analysis by a gas-phase FTIR spectrometer (CX4000, Gasmet, Helsinki, Finland). The substance-specific volume fractions obtained were used to calculate the mass flow rate which is equivalent to the drying rate of the wet layer. As boundary condition it is known that after drying no solvent remains in the layer. The time-resolved remaining mass of solvent in the layer is, therefore, given by the integral of the mass flow rate over the reversed drying time. These masses were used to calculate the time-resolved mean composition of the entire layer, meaning that local effects were averaged out. The set up and calculations were described in detail in a previous report [14]. The entire production process is illustrated in Figure 1.
2.4. Evaluation of Layer Formation
Using a microscope (Stemi 2000-C with AxioCam ICc3, Zeiss, Oberkochen, Germany) all layers were recorded at the same local position at a magnification of 2.5×. The image section was 42.5 mm × 57 mm with one pixel being equivalent to 4.1 µm. The images were processed with GNU Image Manipulation Program 2.10.2 (GIMP, freeware software). Recorded cracks were colored white while crack-free areas were black. As a threshold for the coloring, the gray-scale image was used individually. The coloring led to cases in which cracks were interrupted by areas that were allegedly crack-free. From a physical point of view these interruptions are often not plausible; thus, sections were conservatively connected by the authors, as is shown in Figure 1. After coloring the histogram-function was used to obtain the area percentage with a luminosity higher than 50% which was interpreted as the cracked area ratio of the layer. The pixel-width of a crack at a specific position was evaluated using the shortest connection between its borders. The average crack pixel-width of a crack was evaluated by the total pixel number forming the crack, divided by the number of pixels marking the path along the crack. The resulting pixel-widths were converted into µm-values. In principle, this approach is similar to the method published by Froning et al. [16]. In the present work a simplification was however applied as the precise form of cracks was not the focus.
3. Results and Discussions
3.1. Layer Formation
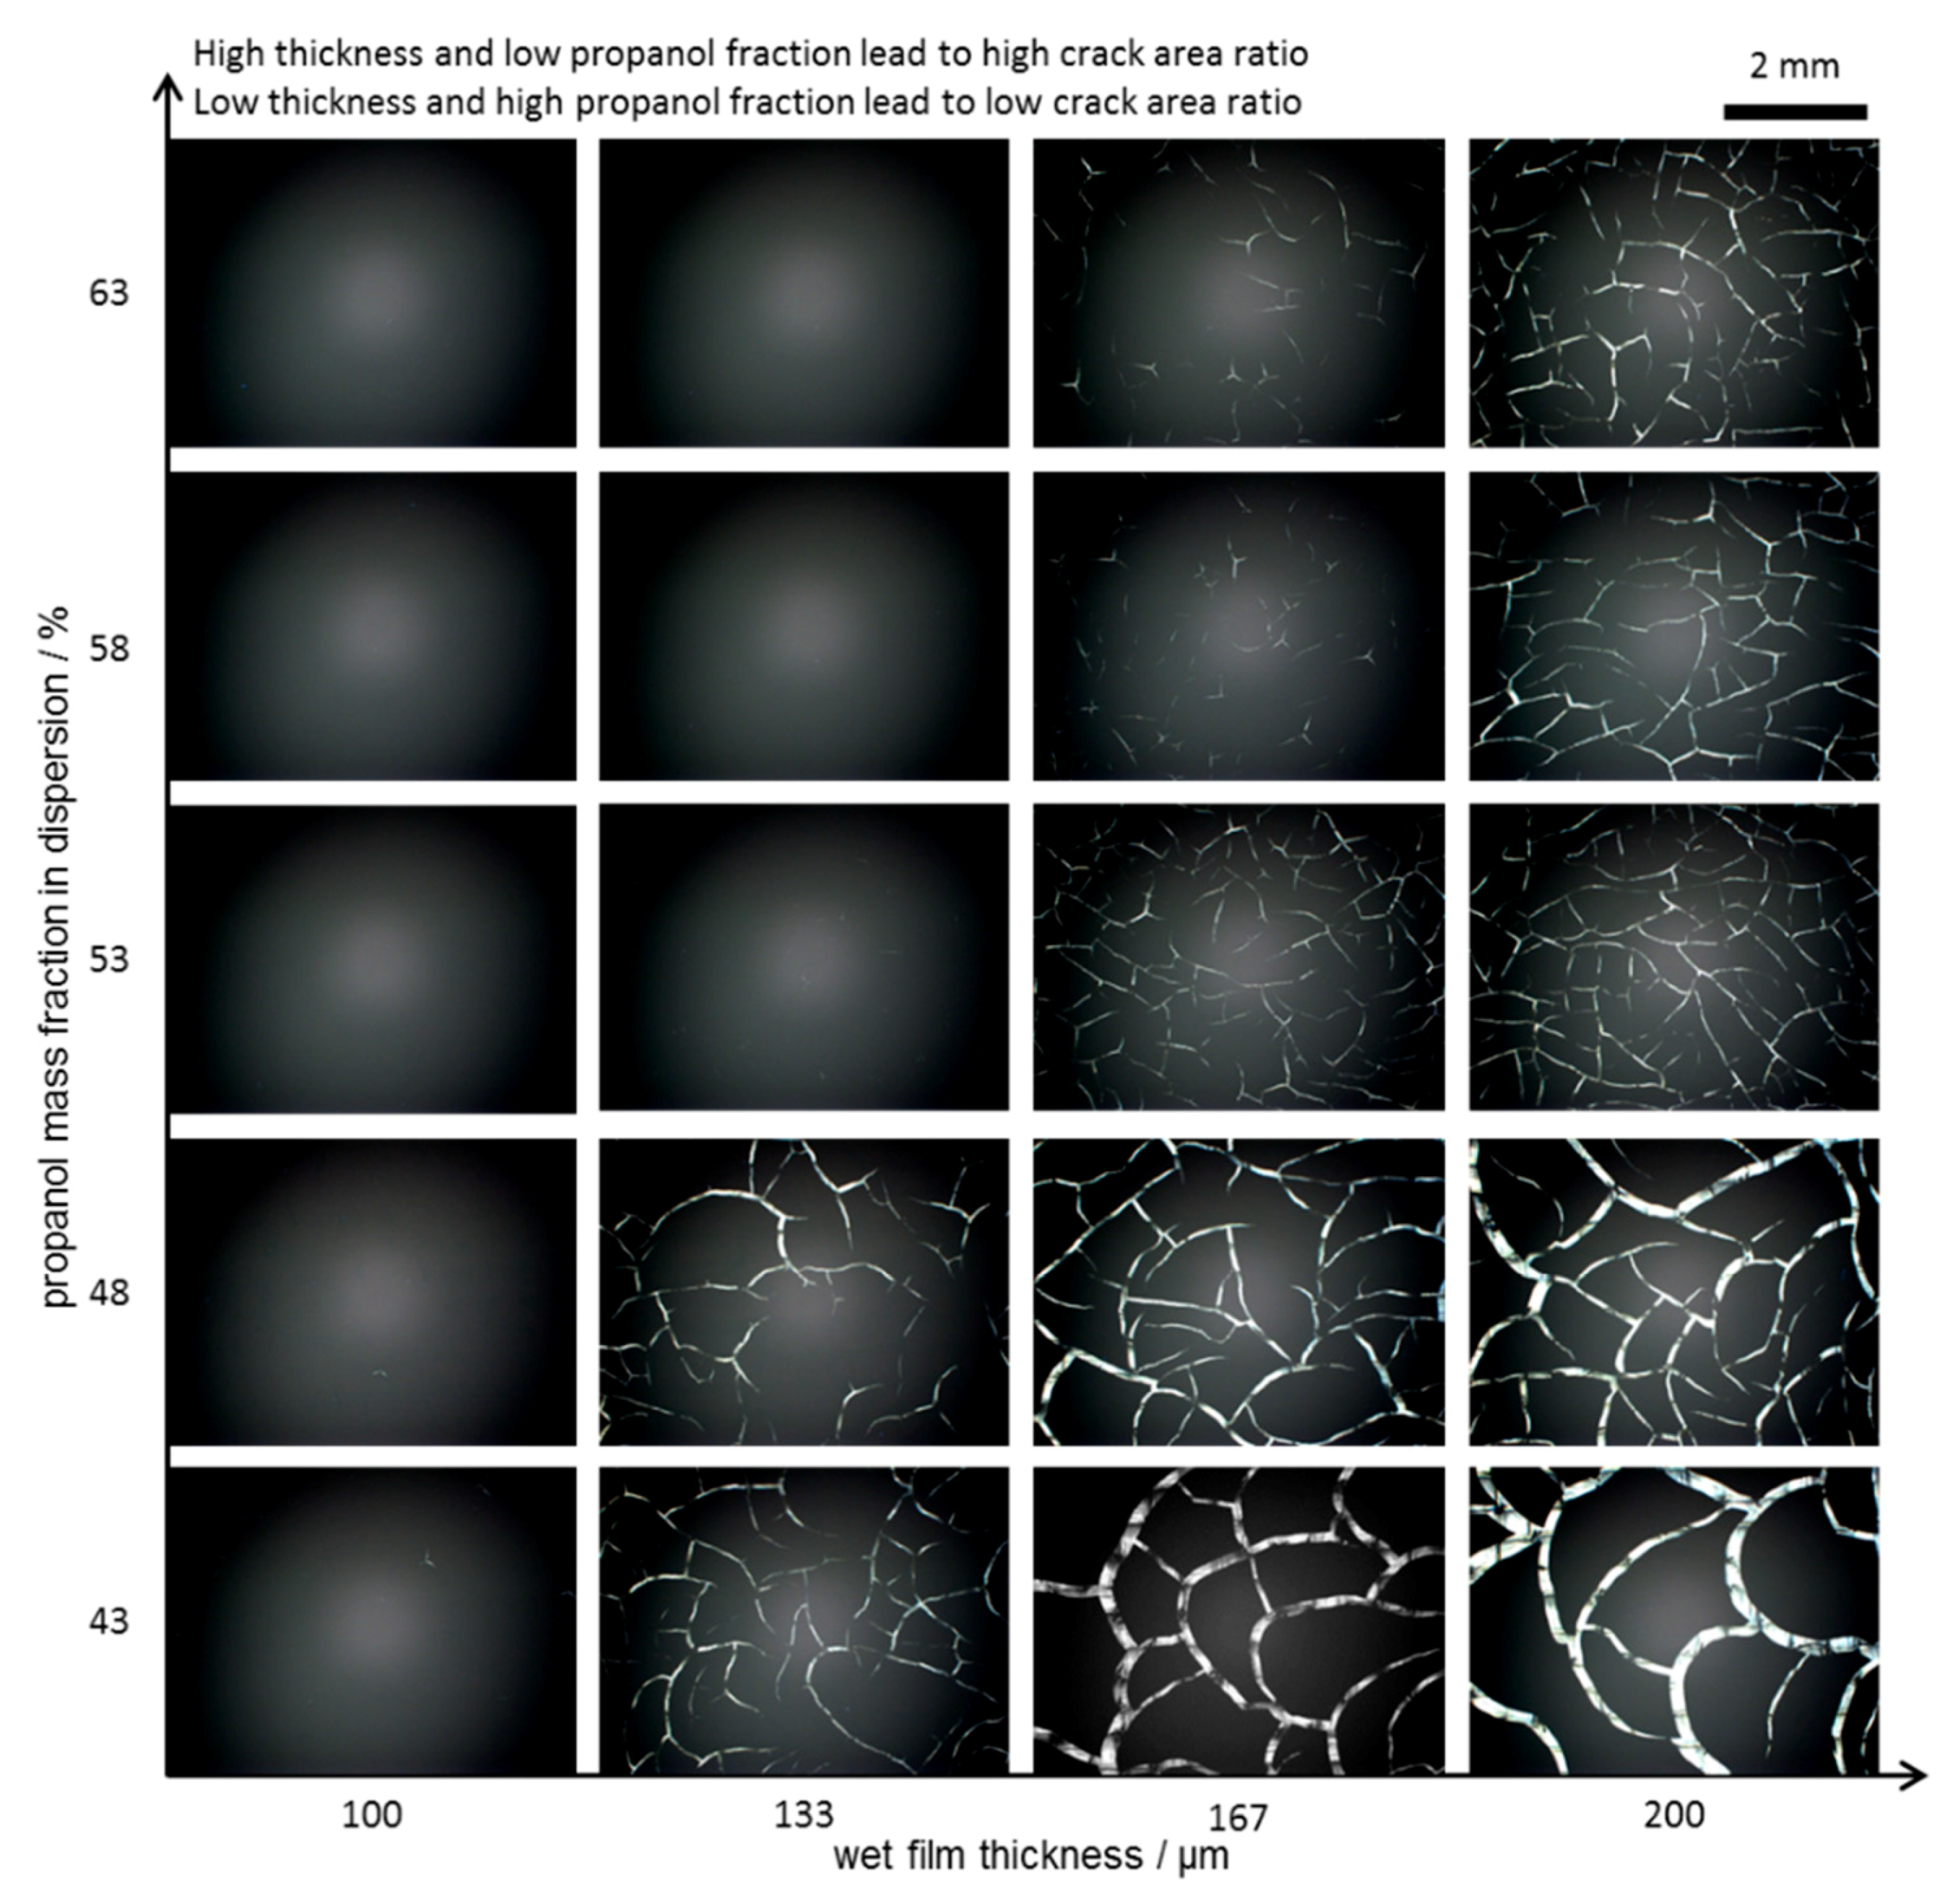
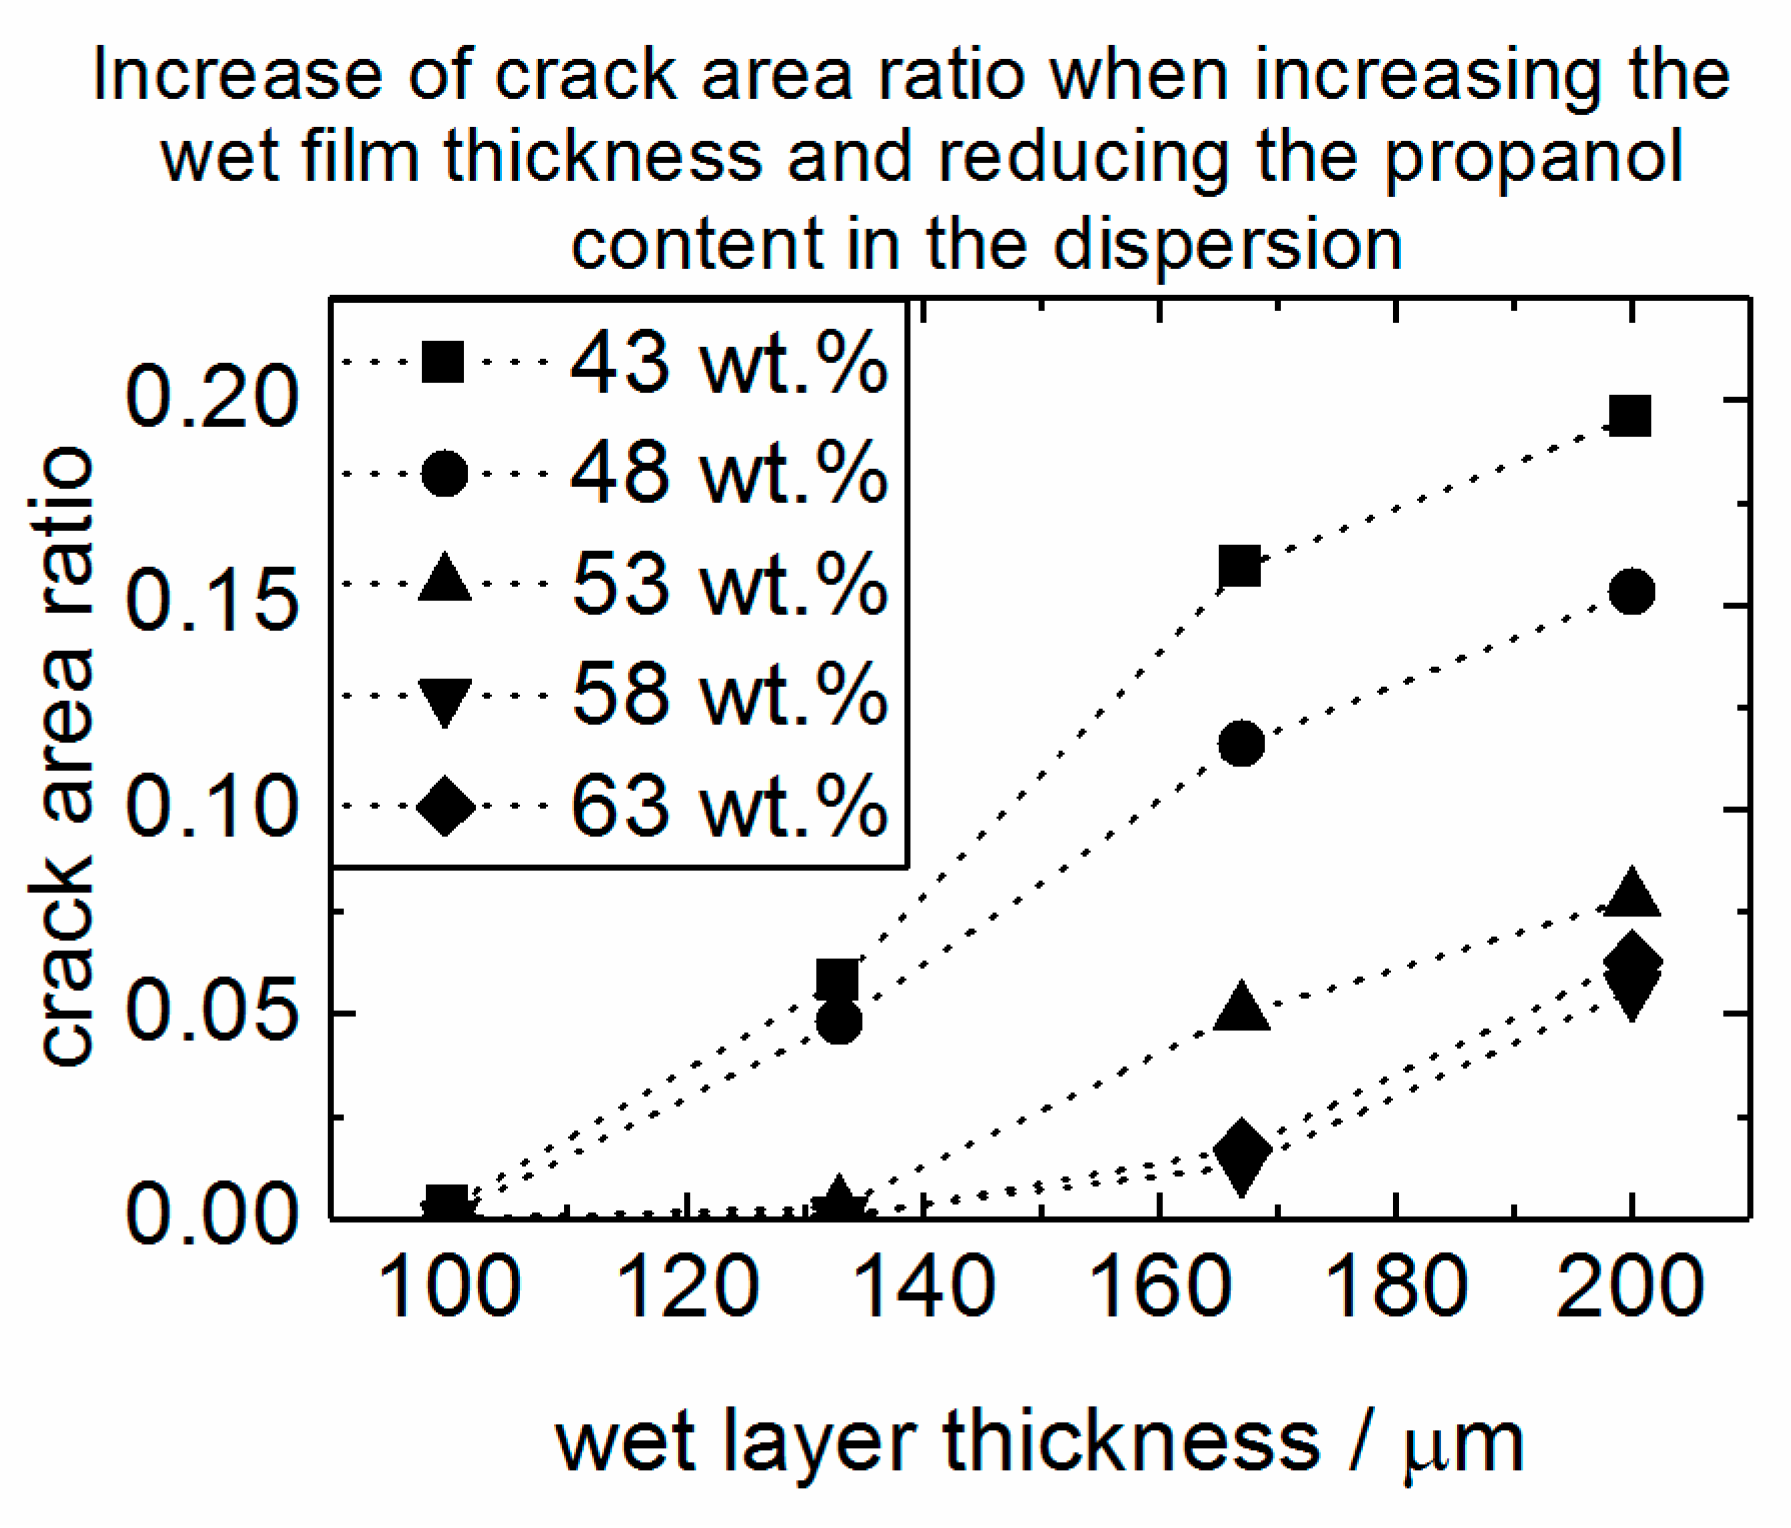
The microscope records are shown in Figure 2 and visually illustrate the dependence of the crack behavior from both the wet layer thickness and propanol mass fraction in the dispersions. High wet layer thickness and low propanol content promote the cracking of the layer. Figure 3 shows the crack area ratio of the layers quantitatively confirming the visual assumption. At a wet layer thickness of 100 µm, no sample showed a significant number of cracks meaning the critical tension was not exceeded. At 133 µm cracking occurred for the dispersions used with a propanol content of 43 wt.% as well as for a content of 48 wt.%. In the case of the other dispersions (53 wt.%, 58 wt.%, and 63 wt.% propanol content), the first cracks were found at a wet film thickness of 167 µm. Regarding the two dispersions with the highest alcohol content the crack behavior was too similar to be distinguished. Clearly, the effect of inhibiting crack formation by adding propanol is limited. The layer generated from 48 wt.% propanol-containing dispersion at 133 µm and that generated from dispersion containing 53 wt.% at a wet layer thickness of 167 µm have the same crack area ratio; however, different single crack sizes were obtained as can be seen in Figure 2 as well. The dispersion with 48 wt.% alcohol content showed crack sizes of up to 80 µm and an average crack width of 31 µm compared with maximum crack sizes of 33 µm and an average crack width of 16 µm for that with 53 wt.% propanol content. The same relationship resulted when comparing the 167 µm thick layer produced from the dispersion containing 43 wt.% propanol with the 48 wt.% propanol-containing dispersion at 200 µm.
At first glance, these results are not surprising since propanol acts as a surfactant; therefore, added propanol decreases the surface tension of the dispersion. According to the table of surface tension for water propanol mixtures, the surface tension does not strongly decrease between 40 wt.% (σ = 24.09 mN·m−1) and 60 wt.% (σ = 23.33 mN·m−1) at 40 °C [17]. This relative difference of less than 4% in the surface tension is too small to explain the difference resulting from the images (see Figure 2) and their crack area ratio analysis (see Figure 3). It is assumed that the critical thickness is approximately 30% higher when reducing the propanol content in dispersion from 53 wt.% to 48 wt.%.
3.2. Drying Process
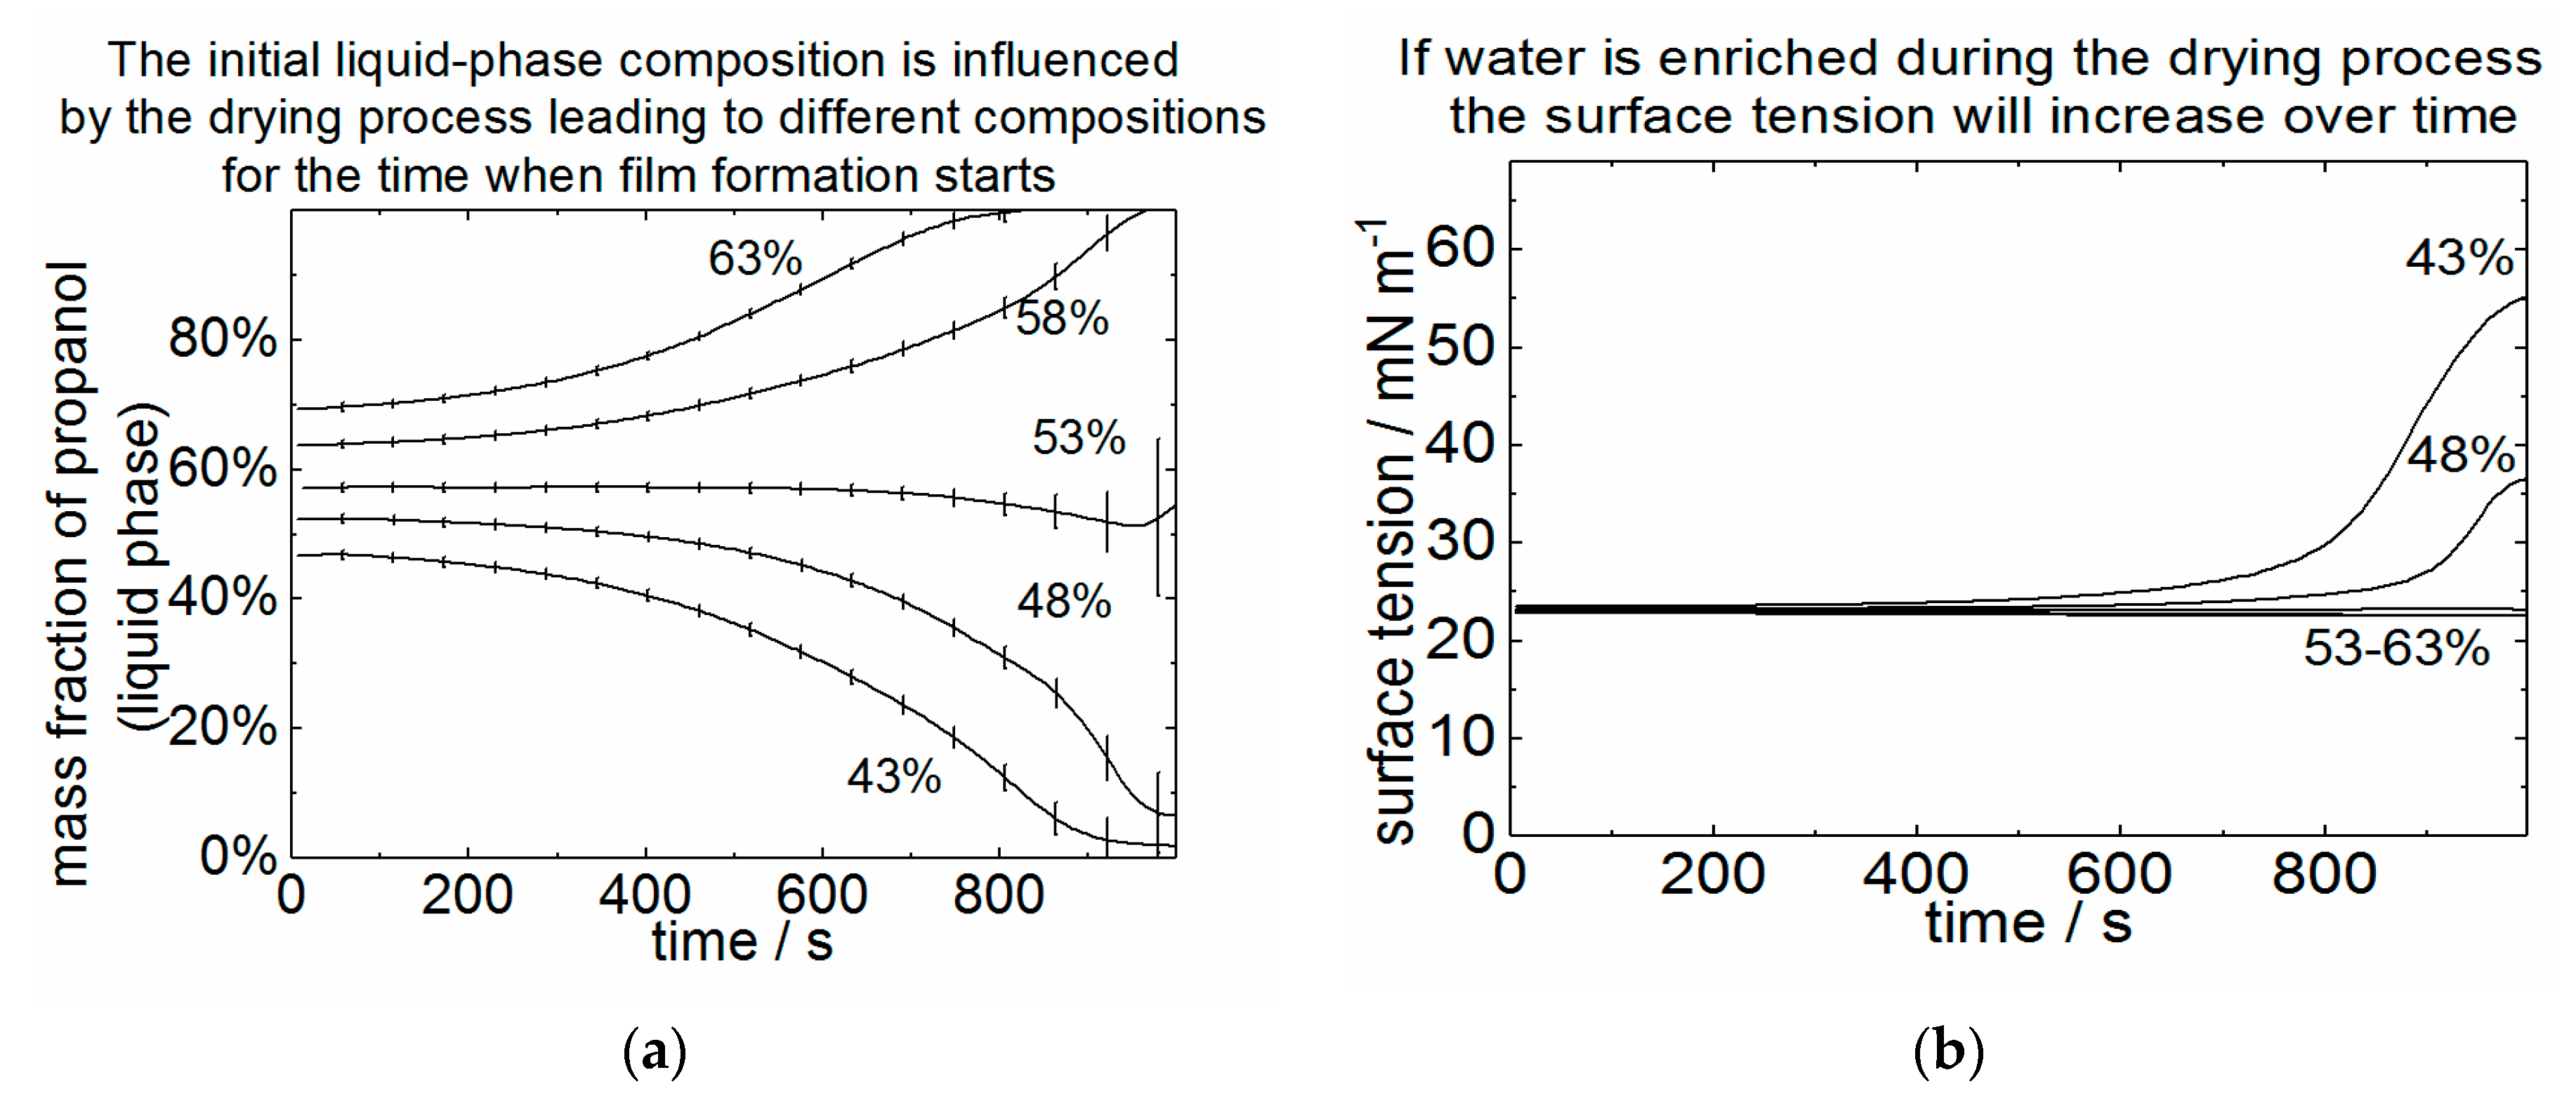
For reasons of wettability, initial dispersions have a solvent content of about 90 wt.% which is why the particles can freely move during the first period of drying until layer formation starts. During this time selective drying processes influence the initial solvent composition [18]. Assuming this mechanism, the initial dispersion surface tension is not decisive for crack formation but the surface tension of the residual solvent when layer formation starts is though. For this reason, the drying was quantitatively observed.
Figure 4 shows the development of the mean liquid phase composition over the entire layer as a function of drying time for all five dispersions used. The curves show different progression of the mass fraction of propanol as a function of time depending on the initial propanol content. When containing 43 wt.% and 48 wt.% of initial propanol the alcohol was depleted over the drying time. Consequently, the surface tension was increased when the layer structure formed. The difference in the structure images results from the different propanol fraction since in water-rich phases the surface tension is strongly affected by marginally adding propanol. In contrast to the depletion of propanol, an enrichment of propanol was observable when drying the 58 wt.% and the 63 wt.% propanol-containing dispersions. In a propanol-rich liquid-phase the surface tension will not drop significantly even if high amounts of propanol will be added. For this reason, no significant differences were observable in either their crack area ratio or crack size (compare Figure 2 and Figure 3). In the case of the 53 wt.% propanol-containing dispersion, the liquid phase is constant over the entire drying period. The surface tension remains at the initial value of the solvent mixture, which is known as the dynamic azeotropic point of the evaporation. For this reason, the layer formation is similar to layers produced using a dispersion with higher propanol content.
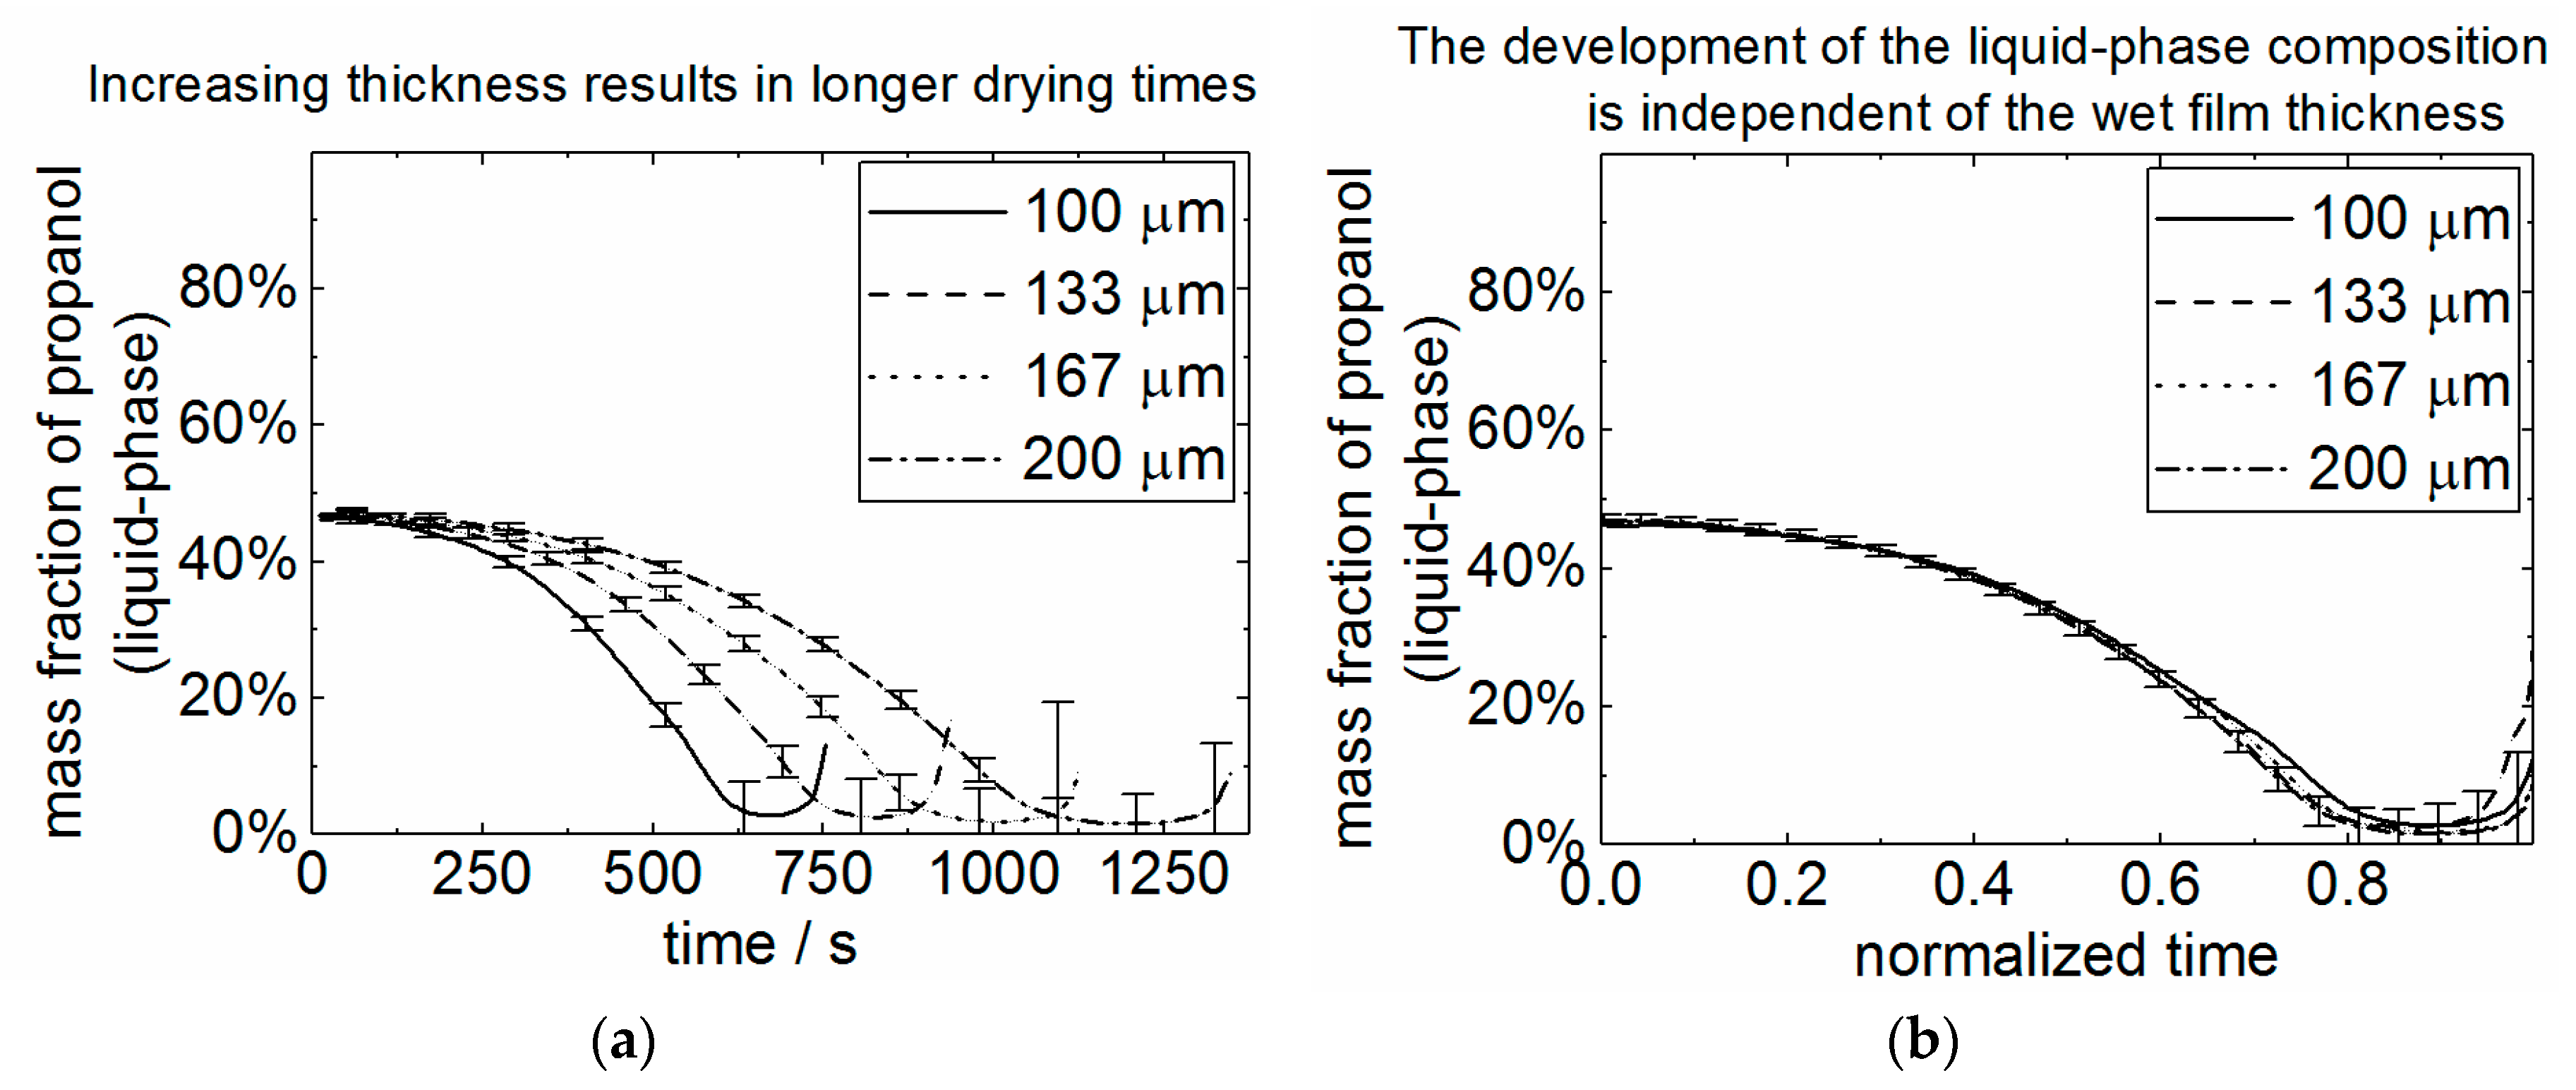
In Figure 5 the drying of wet layers produced by using the same dispersion (43 wt.% propanol) is illustrated at different wet thicknesses as both a function of time and a function of normalized time related to the total drying time. It indicates that the composition development was not significantly affected by the wet layer thickness. For this reason, the drying curves in Figure 4 can be correlated with the microscope images to roughly determine the time when the layer formation and cracking of the layer occurred: The critical height was increased by at least 30% when increasing the initial dispersion propanol content from 48 wt.% to 53 wt.%. Assuming the Griffith-criterion to be valid, the surface tension will decrease by the factor’s root if the shear modulus of the particles and porosity remain the same. This means a decrease of the average surface tension from 26 to 23 mN·m−1. Comparing this value with the curves in Figure 4, the cracking occurred at the very end of the drying process after 850 s. This result matches with the theory; however, a calculation of the maximum crack-free thickness is not practicable as the particle radius of Nafion® is distributed too widely.
4. Conclusions
In this work, drying behavior of Nafion containing carbon black dispersions was analyzed with respect to cracking during layer formation. The results match the expectations that layer thickness and surface tension are important parameters for controlling crack formation. For the considered cases, the following applies: The thicker the layer and the higher the surface tension at the end of the drying, the more cracks occur.
The results indicate that the dynamic azeotropic point of the dispersion is of significant interest. Orientating at this point, the solvent composition’s progression during drying can be influenced by slightly changing the initial solvent content resulting in a strong impact on the rupture formation. This enables fabricating several µm thick electrodes with very different crack structures from very similar initial dispersion compositions. By this method, effects of cracks on electrode properties can be investigated.
Author Contributions
Conceptualization, F.S., A.S. and M.S.; Methodology, F.S.; Software, F.S. and M.S.; Validation, F.S. and M.S.; Formal Analysis, F.S., A.S. and M.S.; Investigation, F.S., A.S. and M.S.; Resources, A.S., M.S. and D.S.; Data Curation, F.S., A.S. and M.S.; Writing-Original Draft Preparation, F.S.; Writing-Review & Editing, A.S, M.S, M.C., W.L. and D.S.; Visualization, F.S.; Supervision, M.S., M.C. and W.L.; Project Administration, M.S.; Funding Acquisition, M.S. and D.S.
Funding
This research was funded by Bavarian Ministry of Economic Affairs and Media, Energy and Technology 42-6521a/15/5 for joint projects in the framework of the Helmholtz Institute Erlangen-Nürnberg for Renewable Energy (IEK-11) of the Forschungszentrum Jülich.
Conflicts of Interest
The authors declare no conflict of interest.
References
- Griffith, A.A. The phenomena of rupture and flow in solids. R. Soc. 1921, 221, 582–593. [Google Scholar] [CrossRef]
- Brown, G.L. Formation of films from polymer dispersions. J. Polym. Sci. 1956, 22, 423–434. [Google Scholar] [CrossRef]
- Singh, K.B.; Tirumkudulu, M.S. Cracking in drying colloidal layers. Phys. Rev. Lett. 2007, 98, 218302. [Google Scholar] [CrossRef] [PubMed]
- Carmo, M.; Fritz, D.L.; Mergel, J.; Stolten, D. A comprehensive review on PEM water electrolysis. Int. J. Hydrogen Energy 2013, 38, 4901–4934. [Google Scholar] [CrossRef]
- Zamel, N. The catalyst layer and its dimensionality–A look into its ingredients and how to characterize their effects. J. Power Sources 2016, 309, 141–159. [Google Scholar] [CrossRef]
- Wang, Z.; Nagio, Y. Effects of Nafion impregnation using inkjet printing for membrane electrode assemblies in polymer electrolyte membrane fuel cells. Electrochim. Acta 2014, 129, 343–347. [Google Scholar] [CrossRef]
- Stampino, P.G.; Cristiani, C.; Dotelli, G.; Zampori, L.; Pelosato, R.; Guilizzoni, M. Effect of different substrates, inks composition and rheology on coating deposition of microporous layer (MPL) for PEM-FCs. Catal. Today 2009, 147, S30–S35. [Google Scholar] [CrossRef]
- Tsushima, S.; Hirai, S. An overview of cracks and interfacial voids in membrane electrode assemblies in polymer electrolyte fuel cells. J. Therm. Sci. Technol. 2015, 10, JTST0002. [Google Scholar] [CrossRef]
- Du, Z.; Rollag, K.M.; Li, J.; An, S.J.; Wood, M.; Sheng, Y.; Mukherjee, P.P.; Daniel, C.; Wood, D.L. Enabling aqueous processing for crack-free thick electrodes. J. Power Sources 2017, 354, 200–206. [Google Scholar] [CrossRef] [Green Version]
- Dexit, B.D.; Harkey, B.A.; Shen, F.; Hatzell, K.B. Catalyst layer ink interactions that affect coatability. J. Electrochem. Soc. 2018, 165, F264–F271. [Google Scholar] [CrossRef]
- Jung, C.Y.; Kim, W.J.; Yi, S.C. Optimization of catalyst ink composition for the preparation of a membrane electrode assembly in a proton exchange membrane fuel cell using the decal transfer. Int. J. Hydrogen Energy 2012, 37, 18446–18454. [Google Scholar] [CrossRef]
- Xie, J.; Xu, F.; Wood, D.L.; More, K.; Zawodzinski, T.A.; Smith, W.H. Influence of ionomer content on the structure and performance of PEFC membrane electrode assemblies. Electrochim. Acta 2010, 55, 7404–7412. [Google Scholar] [CrossRef]
- Berlinger, S.A.; McCloskey, B.D.; Weber, A.Z. Inherent acidity of perfluorosulfonic acid ionomer dispersions and implications for ink aggregation. J. Phys. Chem. B 2018, 122, 7790–7796. [Google Scholar] [CrossRef] [PubMed]
- Scheepers, F.; Burdzik, A.; Staehler, M.; Carmo, M.; Lehnert, W.; Stolten, D. A new setup for the quantitative analysis of drying by the use of gas phase FTIR-spectroscopy. Rev. Sci. Instrum. 2018, 89, 083102. [Google Scholar] [CrossRef] [PubMed]
- Burdzik, A.; Stähler, M.; Friedrich, I.; Carmo, M.; Stolten, D. Homogeneity analysis of square meter-sized electrodes for PEM electrolysis and PEM fuel cells. J. Coat. Technol. Res. 2018, 15, 1423–1432. [Google Scholar] [CrossRef]
- Froning, D.; Maier, W.; Groß, J.; Arlt, T.; Manke, I.; Lehnert, W. Evaluation of structural changes of HT-PEFC electrodes from in-situ synchrotron X-ray radiographs. Int. J. Hydrogen Energy 2014, 39, 9447–9456. [Google Scholar] [CrossRef] [Green Version]
- Vázguez, G.; Alvarez, E.; Navaza, J.M. Surface tension of alcohol + water from 20 to 50 °C. J. Chem. Eng. Data 1995, 40, 611–614. [Google Scholar] [CrossRef]
- Schlünder, E.U. Selektives trocknen gemischhaltiger produkte. Chemie Ingenieur Technik 1987, 59, 823–833. [Google Scholar] [CrossRef]
Figure 1.
The production process is schematically illustrated in the upper section of the figure. A PTFE substrate is coated with dispersion by the use of a slot die. The solvent is evaporated under controlled conditions. The drying is analyzed by FTIR-spectroscopy and the data used for a time-resolved calculation of the layer composition. The dried layer is recorded with a microscope and the pictures obtained are processed (lower part) for evaluation of the crack area ratio.

Figure 2.
An overview of 20 layers generated from five different dispersions varying the wet layer thickness between 100 and 200 µm. The images were recorded by the microscope.
Figure 2.
An overview of 20 layers generated from five different dispersions varying the wet layer thickness between 100 and 200 µm. The images were recorded by the microscope.

Figure 3.
Crack area ratio of all 20 layers produced as a function of wet layer thickness.

Figure 4.
Development of the mass fraction of propanol in the liquid phase of five dispersions used (a) as well as the average surface tension development of the dispersions (b) as a function of drying time.
Figure 4.
Development of the mass fraction of propanol in the liquid phase of five dispersions used (a) as well as the average surface tension development of the dispersions (b) as a function of drying time.

Figure 5.
The mass fraction of propanol in the liquid phase of the 43 wt.% propanol-containing dispersion as a function of the drying time (a) and the normalized drying time (b) at difference wet layer thicknesses.
Figure 5.
The mass fraction of propanol in the liquid phase of the 43 wt.% propanol-containing dispersion as a function of the drying time (a) and the normalized drying time (b) at difference wet layer thicknesses.


Table 1.
Mass fractions of polymeric carbon-black dispersions that were used for the experiments.
| Dispersion | I | II | III | IV | V |
|---|---|---|---|---|---|
| N-propanol | 43% | 48% | 53% | 58% | 63% |
| Water | 47% | 42% | 37% | 32% | 27% |
| Carbon black | 7% | ||||
| Nafion® | 3% | ||||
© 2018 by the authors. Licensee MDPI, Basel, Switzerland. This article is an open access article distributed under the terms and conditions of the Creative Commons Attribution (CC BY) license (http://creativecommons.org/licenses/by/4.0/).
Share and Cite
MDPI and ACS Style
Scheepers, F.; Stähler, A.; Stähler, M.; Carmo, M.; Lehnert, W.; Stolten, D. Layer Formation from Polymer Carbon-Black Dispersions. Coatings 2018, 8, 450. https://doi.org/10.3390/coatings8120450
AMA Style
Scheepers F, Stähler A, Stähler M, Carmo M, Lehnert W, Stolten D. Layer Formation from Polymer Carbon-Black Dispersions. Coatings. 2018; 8(12):450. https://doi.org/10.3390/coatings8120450
Chicago/Turabian StyleScheepers, Fabian, Andrea Stähler, Markus Stähler, Marcelo Carmo, Werner Lehnert, and Detlef Stolten. 2018. "Layer Formation from Polymer Carbon-Black Dispersions" Coatings 8, no. 12: 450. https://doi.org/10.3390/coatings8120450
Note that from the first issue of 2016, this journal uses article numbers instead of page numbers. See further details here.