IMPAβ: Incremental Modal Pushover Analysis for Bridges
by
 , , , and
Alessandro Vittorio Bergami
1,* ,
,
Camillo Nuti
1,2 ,
,
Davide Lavorato
1 ,
,
Gabriele Fiorentino
1 and
and
Bruno Briseghella
2
1
Department of Architecture, Roma Tre University, 00152 Rome, Italy
2
College of Civil Engineering, Fuzhou University, Fuzhou 350108, China
*
Author to whom correspondence should be addressed.
Appl. Sci. 2020, 10(12), 4287; https://doi.org/10.3390/app10124287
Submission received: 13 February 2020
/
Revised: 18 June 2020
/
Accepted: 19 June 2020
/
Published: 22 June 2020
(This article belongs to the Special Issue Assessing and Extending the Service Life of Bridges)
Abstract
:In the present study, the incremental modal pushover analysis (IMPA), a pushover-based approach already proposed and applied to buildings by the same authors, was revised and proposed for bridges (IMPAβ). Pushover analysis considers the effects of higher modes on the structural response. Bridges are structurally very different from multi-story buildings, where multimodal pushover (MPA) has been developed and is currently used. In bridges, consideration for higher modes is often necessary: The responses of some structural elements of the bridge (e.g., piers) influence the overall bridge response. Therefore, the failure of these elements can determine the failure of the whole structure, even if they give a small contribution total base shear. Incremental dynamic analysis (IDA) requires input accelerograms for high intensities, which are rare in the databases, while scaling of generated accelerograms with a simple increment of the scaling acceleration is not appropriate. This fact renders IDA, which is by its nature time-consuming, not straightforward. On the contrary, the change of input spectrum required by IMPA is simple. IMPAβ also utilizes a simple complementary method coupled to MPA, to obtain bounds at very high seismic intensities. Finally, the two incremental methods based on static nonlinear and dynamic nonlinear analyses are compared.
1. Introduction
Bridges are often sensitive to higher modes, so the seismic response (e.g., the response of the critical piers) depends on local behavior. Therefore, nonlinear static analysis (NSA) can be considered a valid alternative to nonlinear response history analyses (NRHA), only if the effects of higher modes are considered. Recently, similar to what happened for building structures [1,2,3,4,5], many scientific works have been oriented to propose innovative NSA procedures for bridges.
In 2006, Isakovic et al. [6] discussed, through the application to a case study of a continuous-deck viaduct, the relevance of higher modes, performing a simplified inelastic seismic analysis and indicated that there are major differences between the structural system and the seismic response of buildings and bridges, particularly when the response of a bridge is analyzed in transverse direction. Therefore, the application of NSA should be specialized for bridges, as confirmed by many papers published on this topic. In 2007 and 2009, Pinho et al. [7,8] discussed the nonlinear analysis of continuous multi-span bridges and conducted a parametric study of 14 continuous-span bridges; they concluded that the accuracy of pushover methods is strongly related to the irregularity of the bridge, and, therefore, further investigation is needed to find a method suitable for irregular bridges. In the same year, Muljati and Warnitchai [9] applied the modal pushover analysis [10] to a girder bridge with a continuous deck, highlighting that the nonlinear and linear range have a similar trend and therefore the modal pushover could be considered efficient under the following conditions: (a) the deck is elastic, and (b) the bridge is not characterized by relevant irregularities. In 2008–2010, Kappos et al. [11,12] applied, to some case studies of existing bridges (girder bridges with continuous deck), a multimodal pushover procedure generally similar to the MPA proposed by Chopra et al. [13,14,15], and, in 2012, several interesting studies were collected in the volume edited by the Kappos et al. [16]; the volume specifically discusses NSA and its application to case studies of bridges, providing some theoretical background on this topic.
Similarly, in existing codes or guidelines, the use of NSA for bridges is not deepened as it is for buildings, and it is generally based on two classic pushover procedures: the capacity spectrum method (CSM) [17] and the inelastic demand spectrum method, also known as the N2 method [18]. In the Eurocode 8, a pushover procedure based on the N2 is proposed to assess the seismic behavior of regular buildings, and only few specifications for bridges are reported in parts one and two. In FEMA 356 [19], ATC 40 [20] and Caltrans [21], adopting the CSM, NSA is proposed, but the contribution of higher modes is not considered, and the procedure for bridges is not detailed (e.g., there is no discussion on the monitoring point selection for bridges).
All the cited scientific works propose a nonlinear static procedure for bridges that is validated with a direct comparison with the incremental dynamic analysis (IDA) [22,23] (currently considered the reference method). Those procedures are proposed to be alternative to IDA; since this latter is pushover-based, it does not require the execution of NRHA, which involves several difficulties in the development of the structural numerical model and requires a high computational cost. The computational effort of NHRA (and therefore of IDA) is extremely relevant if an iterative procedure (e.g., for modeling errors, designing a new structure or retrofitting an existing one) is performed or because the set of ground motions (GMs) commonly selected for the nonlinear dynamic analysis have seven or more time histories. It is also worth remembering that, for seismic assessment of structures by means of NRHA, a set of GMs compatible with the seismic hazard spectrum of the site must be generated or selected; this, as described by Bommer and Acevedo [24], is a complex task, since there are no clear procedures to generate artificial spectrum-compatible records or select appropriate suites of real GMs. It is also important to notice that, if IDA is used, it may result in being very difficult to find representative records for high intensities in the catalogues (given the few natural records available in databases for high intensities). Conversely, in pushover analysis, based on one or more modes, the seismic input can be easily defined by selecting appropriate spectral shapes for any specific seismic intensity.
In fact, in pushover-based procedures, modeling the nonlinear behavior essentially follows NRHA without any requirement for hysteretic properties; the pushover analysis requires a simple bridge model that includes beam-column elements with plastic hinges [25]. Moreover, NSAs can provide all the relevant information required for investigating structural response: With a pushover, the identification of critical regions and prediction of the sequence of yielding and/or failure of structural members is very simple. Furthermore, many fundamental data for structural analysis are explicit and summarized in the capacity curve.
According to this scientific background and developing previous studies of the same authors dealing with a nonlinear static analysis of buildings [26,27,28,29], this work aims at proposing an innovative pushover-based procedure, named IMPAβ, for the assessment of bridges under seismic loads.
With IMPAβ, detailed in Section 2.2, the IDA’s NRHAs are replaced by a set of pushover analyses (IMPAβ is incremental; therefore, a wide range of intensities is considered). The method, keeping the conceptual simplicity and computational attractiveness of standard nonlinear static analyses, is also suitable for irregular bridges and for high seismic intensity (advanced plastic structural stage), since different loading patterns, including the effects of higher modes, are adopted and integrated.
In the development of IMPAβ, three pushover loading patterns were considered: (a) proportional to the first mode (SPA); (b) uniform (UPA); and (c) modal pushover (MPA). Patterns (a) and (b) are commonly adopted in pushover, according to FEMA-356 [19] or Eurocode 8 [30,31]. The IMPAβ, finally proposed and discussed in Section 5, is an incremental procedure defined by a double pushover approach (both MPA and UPA are integrated in the procedure).
In the paper, IMPAβ is validated through the application to two case studies and a comparison with IDA (Section 4). The analyzed case studies are girder bridges with continuous deck, one regular (RB) and the other irregular (IB), according to the regularity definition made by Eurocode. These cases were already investigated by many authors in previous comparison works since the 1990s [32].
The bridge responses to the mean spectrum at different intensities obtained with pushover versus mean responses with NRHA are compared. The incremental curves are obtained by scaling the same seismic input in the two methods (pushover and NRHA) and using the mean spectrum for the pushover and the mean response for the NRHA.
2. Nonlinear Static Analysis for Bridges
2.1. General Considerations for Bridges
Pushover can be used for the analysis of bridges, but some specifications are needed; some are provided by the Eurocode 8/2 [31] or are discussed in References [6,33]. According to the scope of this work, dealing with the use of the pushover analysis, a relevant issue is the selection of the monitoring point (MP) for a bridge; the MP is the control joint used to plot the conventional capacity curve, and a wrong selection can compromise the analysis.
For buildings, according to many years of experience, guidelines and codes, the monitoring point, generally suitable to any load pattern considered, is the center mass at the top floor; for a bridge, such a general prescription is not straightforward. Possible options could be (a) the position of the point where the maximum displacement of the superstructure is recorded [34]; (b) the deck center of mass; (c) the top of the pier nearest to the center of mass [3,4,5]; (d) the top of the pier corresponding to the maximum deck displacement [16]; or (e) a point of the deck determined according to the properties of the bridge [35,36,37,38,39]. According to the authors’ experience, the monitoring point can be selected according to any of the procedures previously listed. In any case, the following remarks should be taken into account. The selection of a monitoring point corresponding, for a specific modal shape, to a null or quasi-null displacement value (e.g., in case of a twisting modal shape), or characterized by an opposite direction of displacement if compared with the global direction of the bridge deformation (the loading component of the loading pattern is inverted if compared to the resulting pushover direction), can lead to numerical problems or even null displacements (impossibility to plot the capacity curve and finalize the analysis), thus compromising the analysis process.
Another relevant issue while performing pushover is the definition of the loading pattern. Indeed, many works dealing with NSA for bridges [33,34] compared different methods, concluding that, for most of the cases, MPA was the most efficient procedure. The authors of this work agree upon this remark and decided to develop, starting from the use of the MPA already considered in a procedure previously proposed for buildings (the incremental modal pushover analysis (IMPA), [19]), the procedure for bridges detailed in the next section: the incremental modal pushover analysis for bridges (IMPAβ).
2.2. The Incremental Modal Pushover Analysis for Bridges (IMPAβ)
The incremental modal pushover analysis for bridges (IMPAβ) includes the execution of IMPA that, in this paper, is briefly reported, since it has already been described in a convenient step-by-step procedure in Bergami et al. [26,27,28,29]. IMPA requires the execution of several MPAs; the seismic demand due to individual terms in the modal expansion of the effective earthquake forces is determined by a nonlinear static analysis using the inertia force distribution Sn for each mode:
where Γn is the nth modal participation factor; M is a diagonal mass matrix of order 2n, including the diagonal submatrices m, and 1: m is a diagonal matrix with mjj = mj, the lumped mass barycenter of the jth pier; φn is the nth natural vibration mode of the structure consisting of three sub-vectors: rn, yn and θn; and the n × 1 vector 1 is equal to unit.
The IMPA procedure can be summarized in the following steps:
- Compute the natural frequencies, wn and modes, n for the linear elastic vibration of the bridge. The modal properties of the bridge model are obtained from the linear dynamic modal analysis, and the relevant modes of the bridge are selected;
- Define the seismic demand in terms of response spectra (RS) for a defined range of intensity levels;
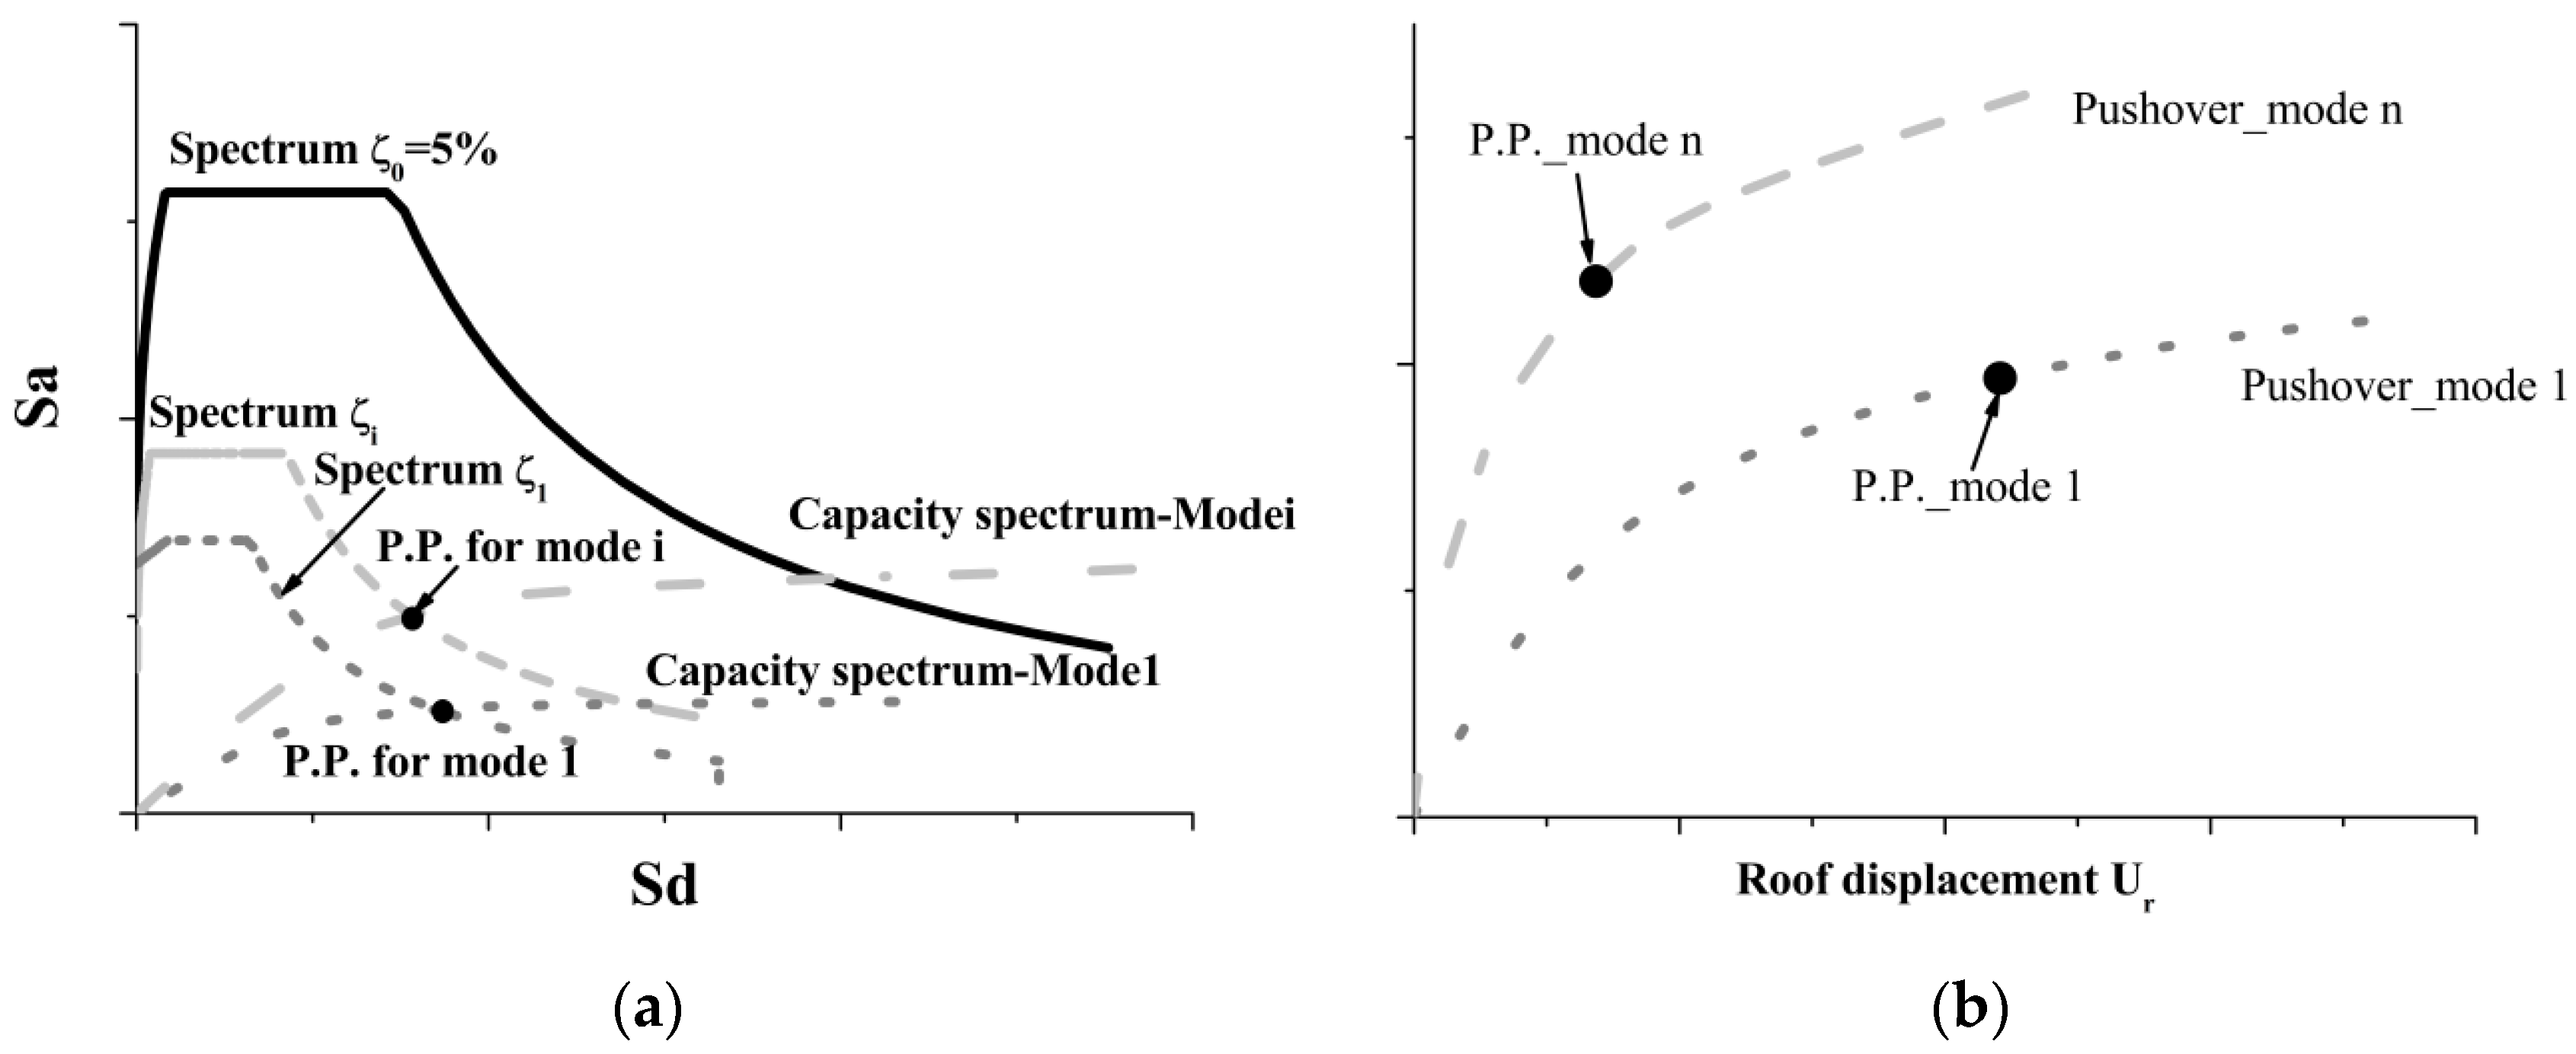
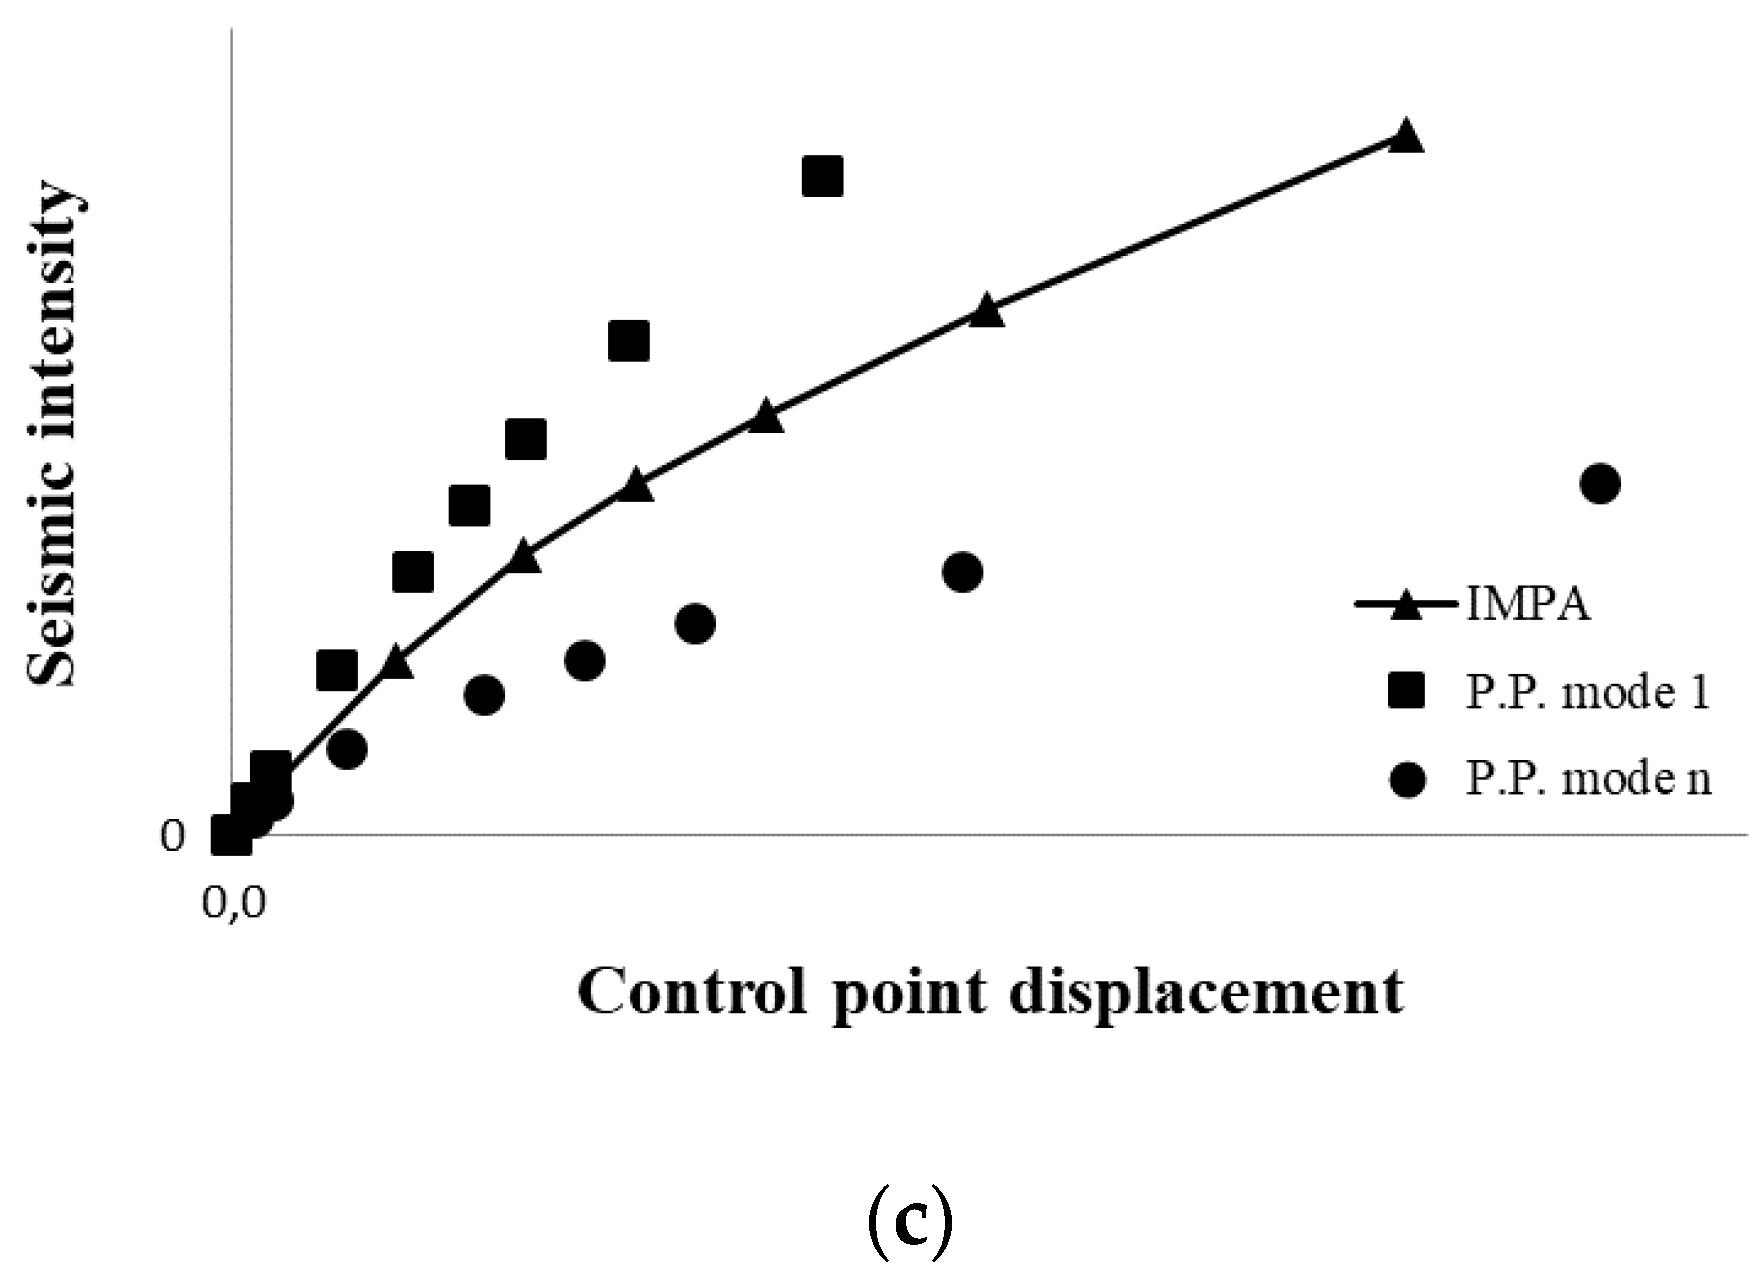
- For the intensity level, i, represented by peak ground motion acceleration (PGA), the performance point (P.P.) for the selected (predominant) modes can be determined (Figure 1a);
- Using a combination rule to combine the P.P. corresponding to each mode for each intensity, i, the “multimodal performance point” (P.P.m,i) can be determined (Figure 1b). The P.P.m,i is expressed in terms of monitoring point displacement, urmmi, and corresponding global base shear, Vb,i, for each intensity level considered: being urni the modal displacements of the monitoring point, in this paper, the transverse direction is considered.
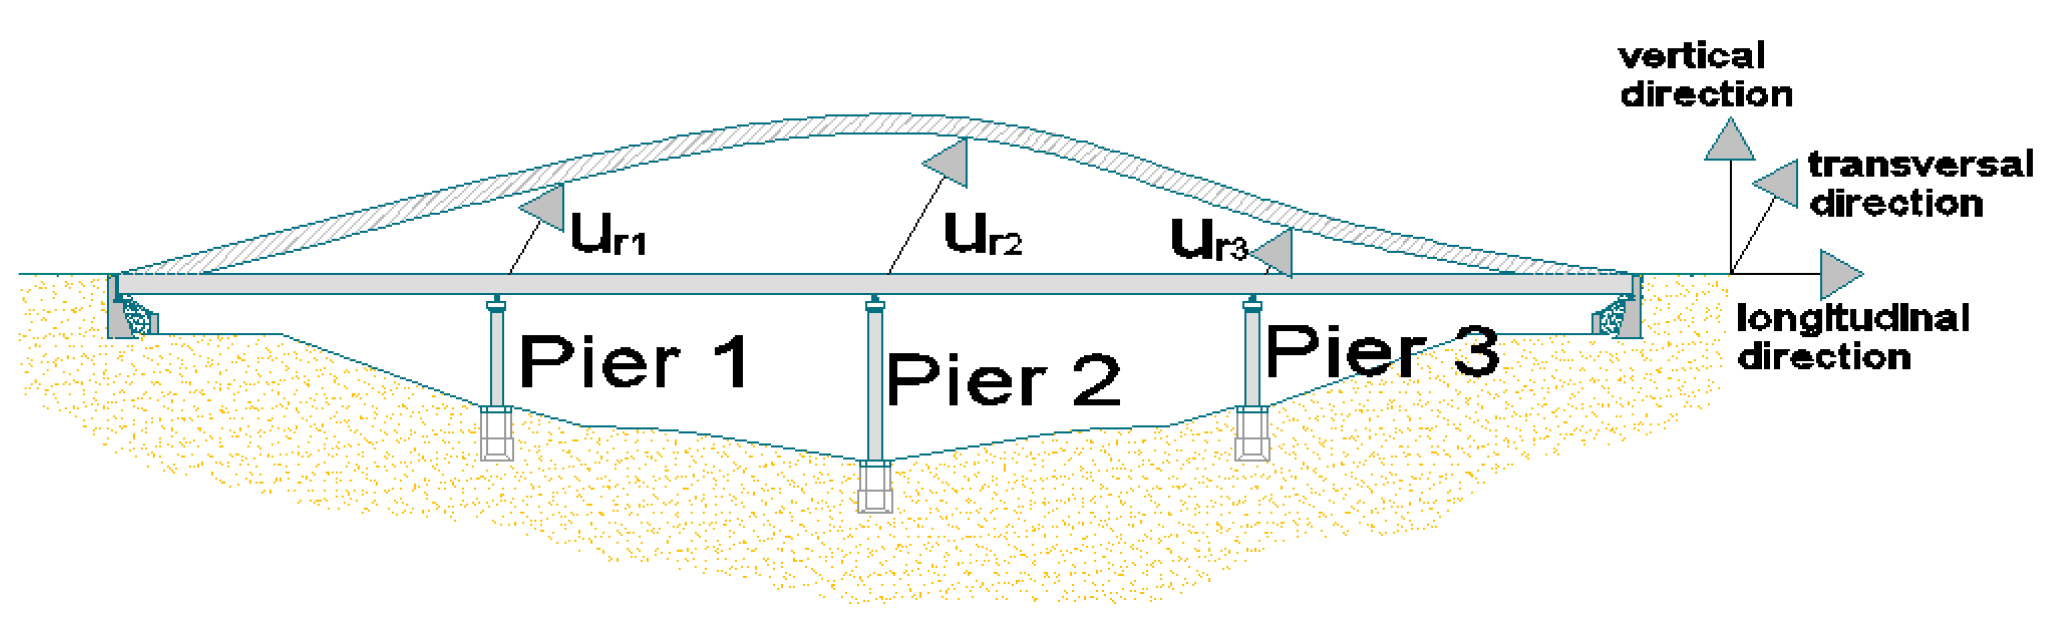
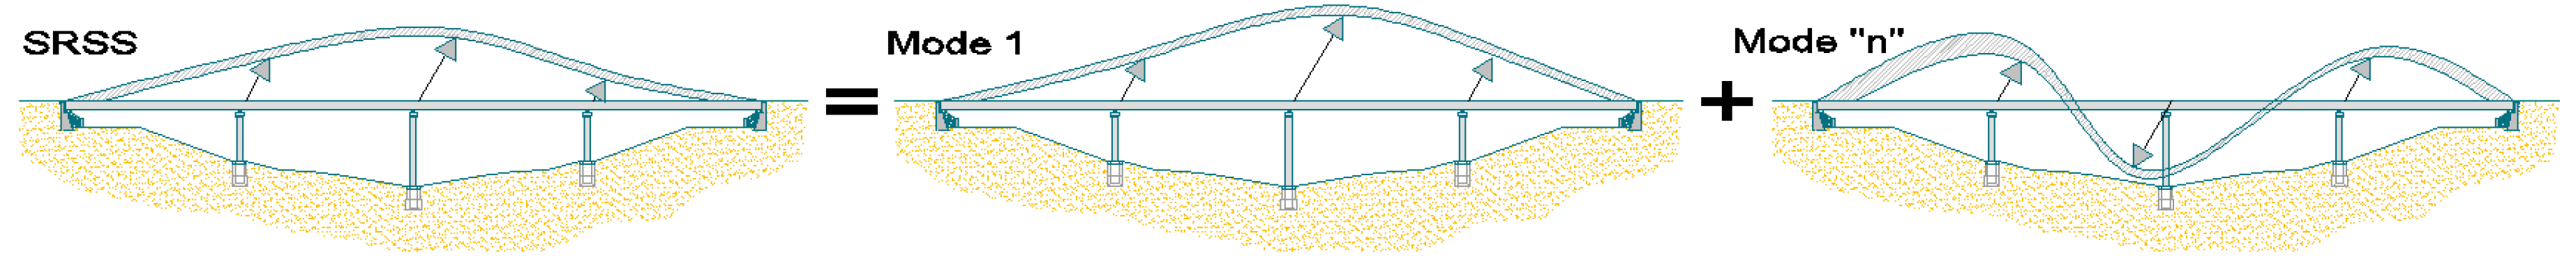
Data resulting from MPA application within an identified range of seismic intensities provide all necessary information to estimate the seismic response; IMPA allows us to develop a multimodal capacity curve (Figure 1c) relating a control parameter to seismic demand intensity (the IMPA capacity curve is part of IMPAβ in which another incremental procedure is required). In the procedure, for each seismic intensity level, the corresponding Performance Point (P.P.) for the multi-degree-of-freedom (MDOF) is determined, and the corresponding deformed configuration of the structure (the bridge, in this specific case) is derived: The deformed configuration of the bridge describes the position of each monitored station (usually the top of the piers: ur1i, …, urni) at the performance point (P.P., see Figure 2). In this paper, the P.Ps are determined with the Capacity Spectrum Method (ATC 40) [34], and the P.P.s obtained for each modal shape are combined by using the Square Root of the Sum of Squares rule (3), to obtain a multimodal performance point (P.P.m,i) for each specific seismic intensity level, as displayed in Figure 3.
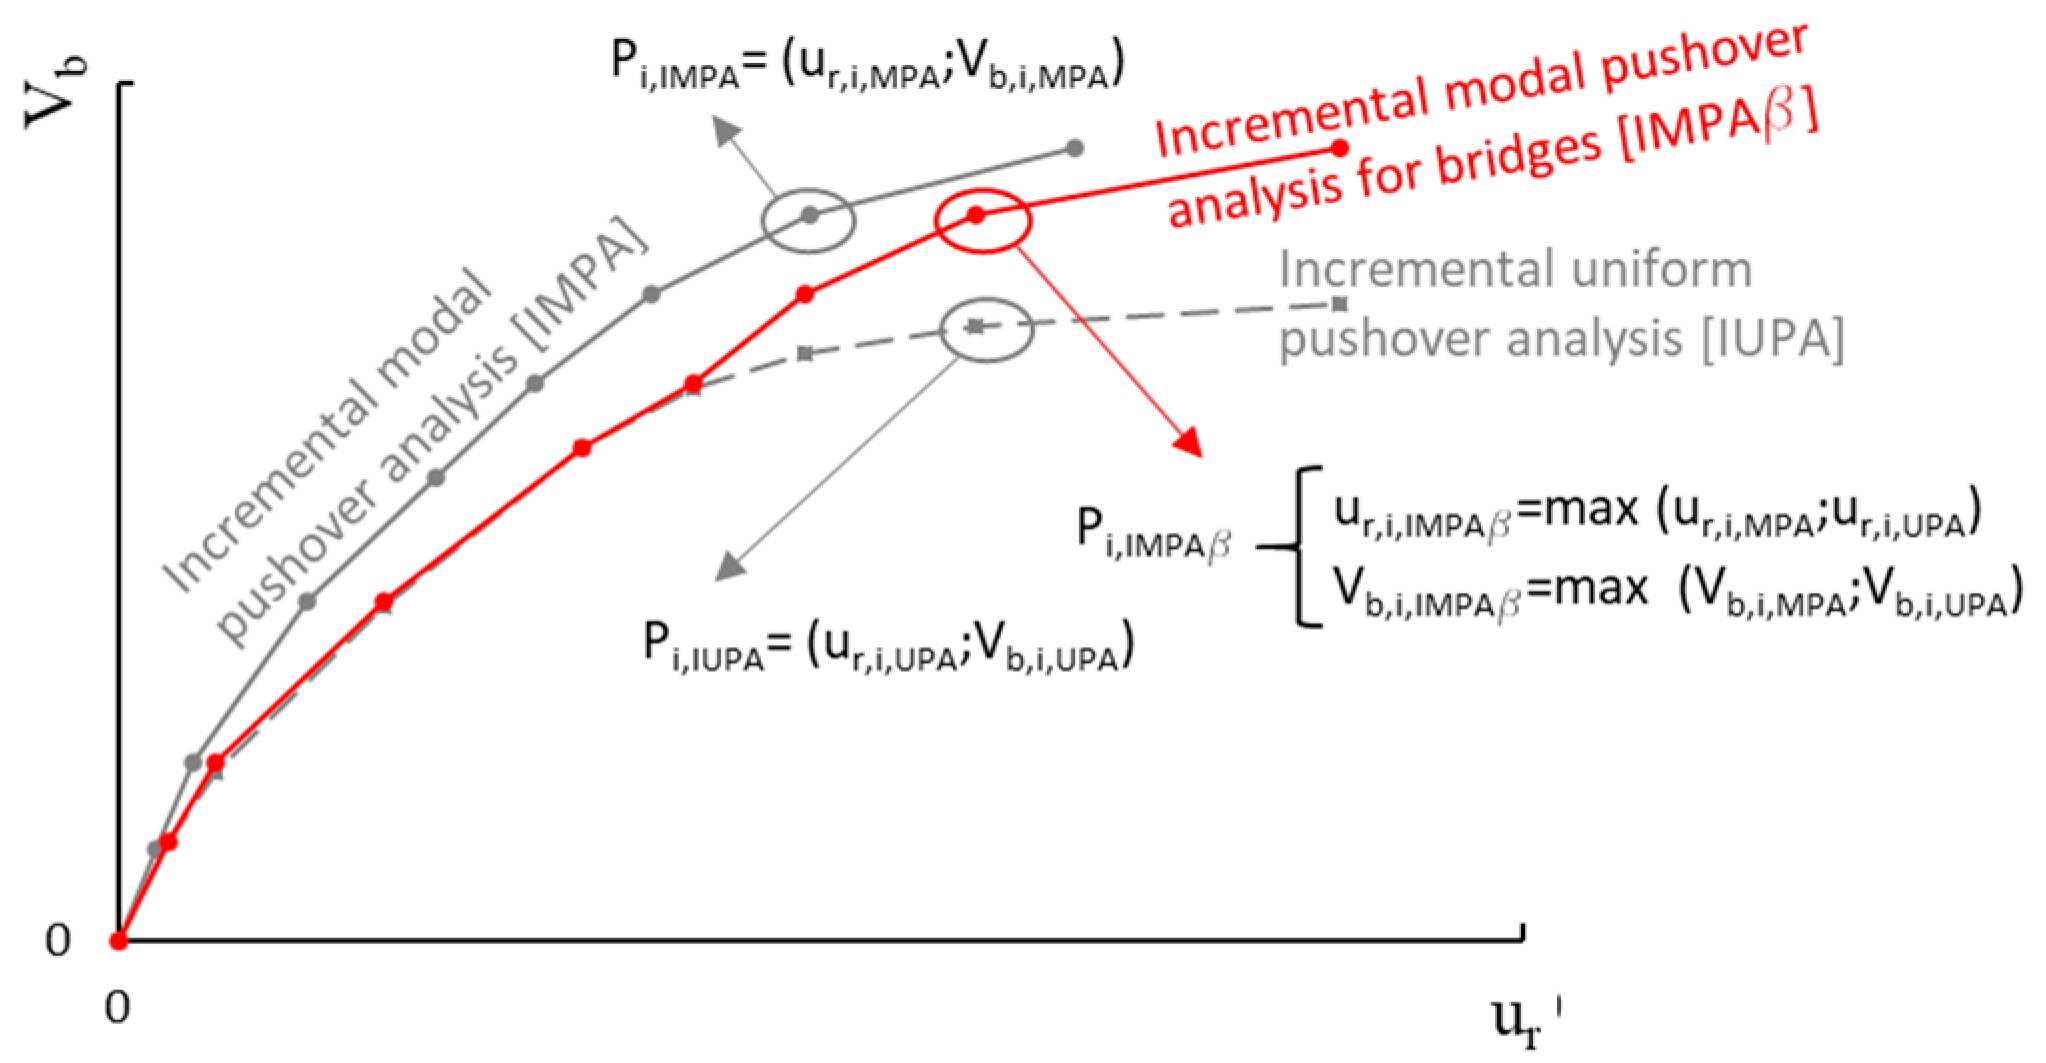
From the applications performed on the two cases of study (regular and irregular bridges, presented in Section 3.1), it is demonstrated that, specifically for the case of an irregular bridge, better results can be achieved if both the modal pushover and a uniform pushover analysis (UPA) are performed. Therefore, IMPAβ requires us to perform IMPA (the incremental MPA) and IUPA (the incremental UPA), and afterward to derive an univocal capacity curve from an envelope; the IMPAβ capacity curve is defined connecting, for each intensity step i, the performance point Pi,IMPAβ defined in (4) and described in Figure 4.
where (ur,i,MPA; Vb,i,MPA) and (ur,i,UPA; Vb,i,UPA) are the coordinates of the performance point for the intensity, i, obtained by performing MPA or UPA. The flowchart of this new procedure is displayed in Figure 5.
Pi,IMPAβ = (max (ur,i,MPA;ur,i,UPA); max (Vb,i,MPA;Vb,i,UPA))
The seismic demand is expressed in terms of the Response Spectrum (RS): An RS can be selected for the site of the bridge, and then it can be linearly scaled to cover the desired intensity range. Otherwise, the scaling procedure can be performed by acting on the return period (Tr), obtaining different spectra for different intensities. A third possibility is to derive the RS from a set of ground motions (GMs), generated or selected by investigating the local seismicity for each intensity level.
3. Case Studies
3.1. Bridges
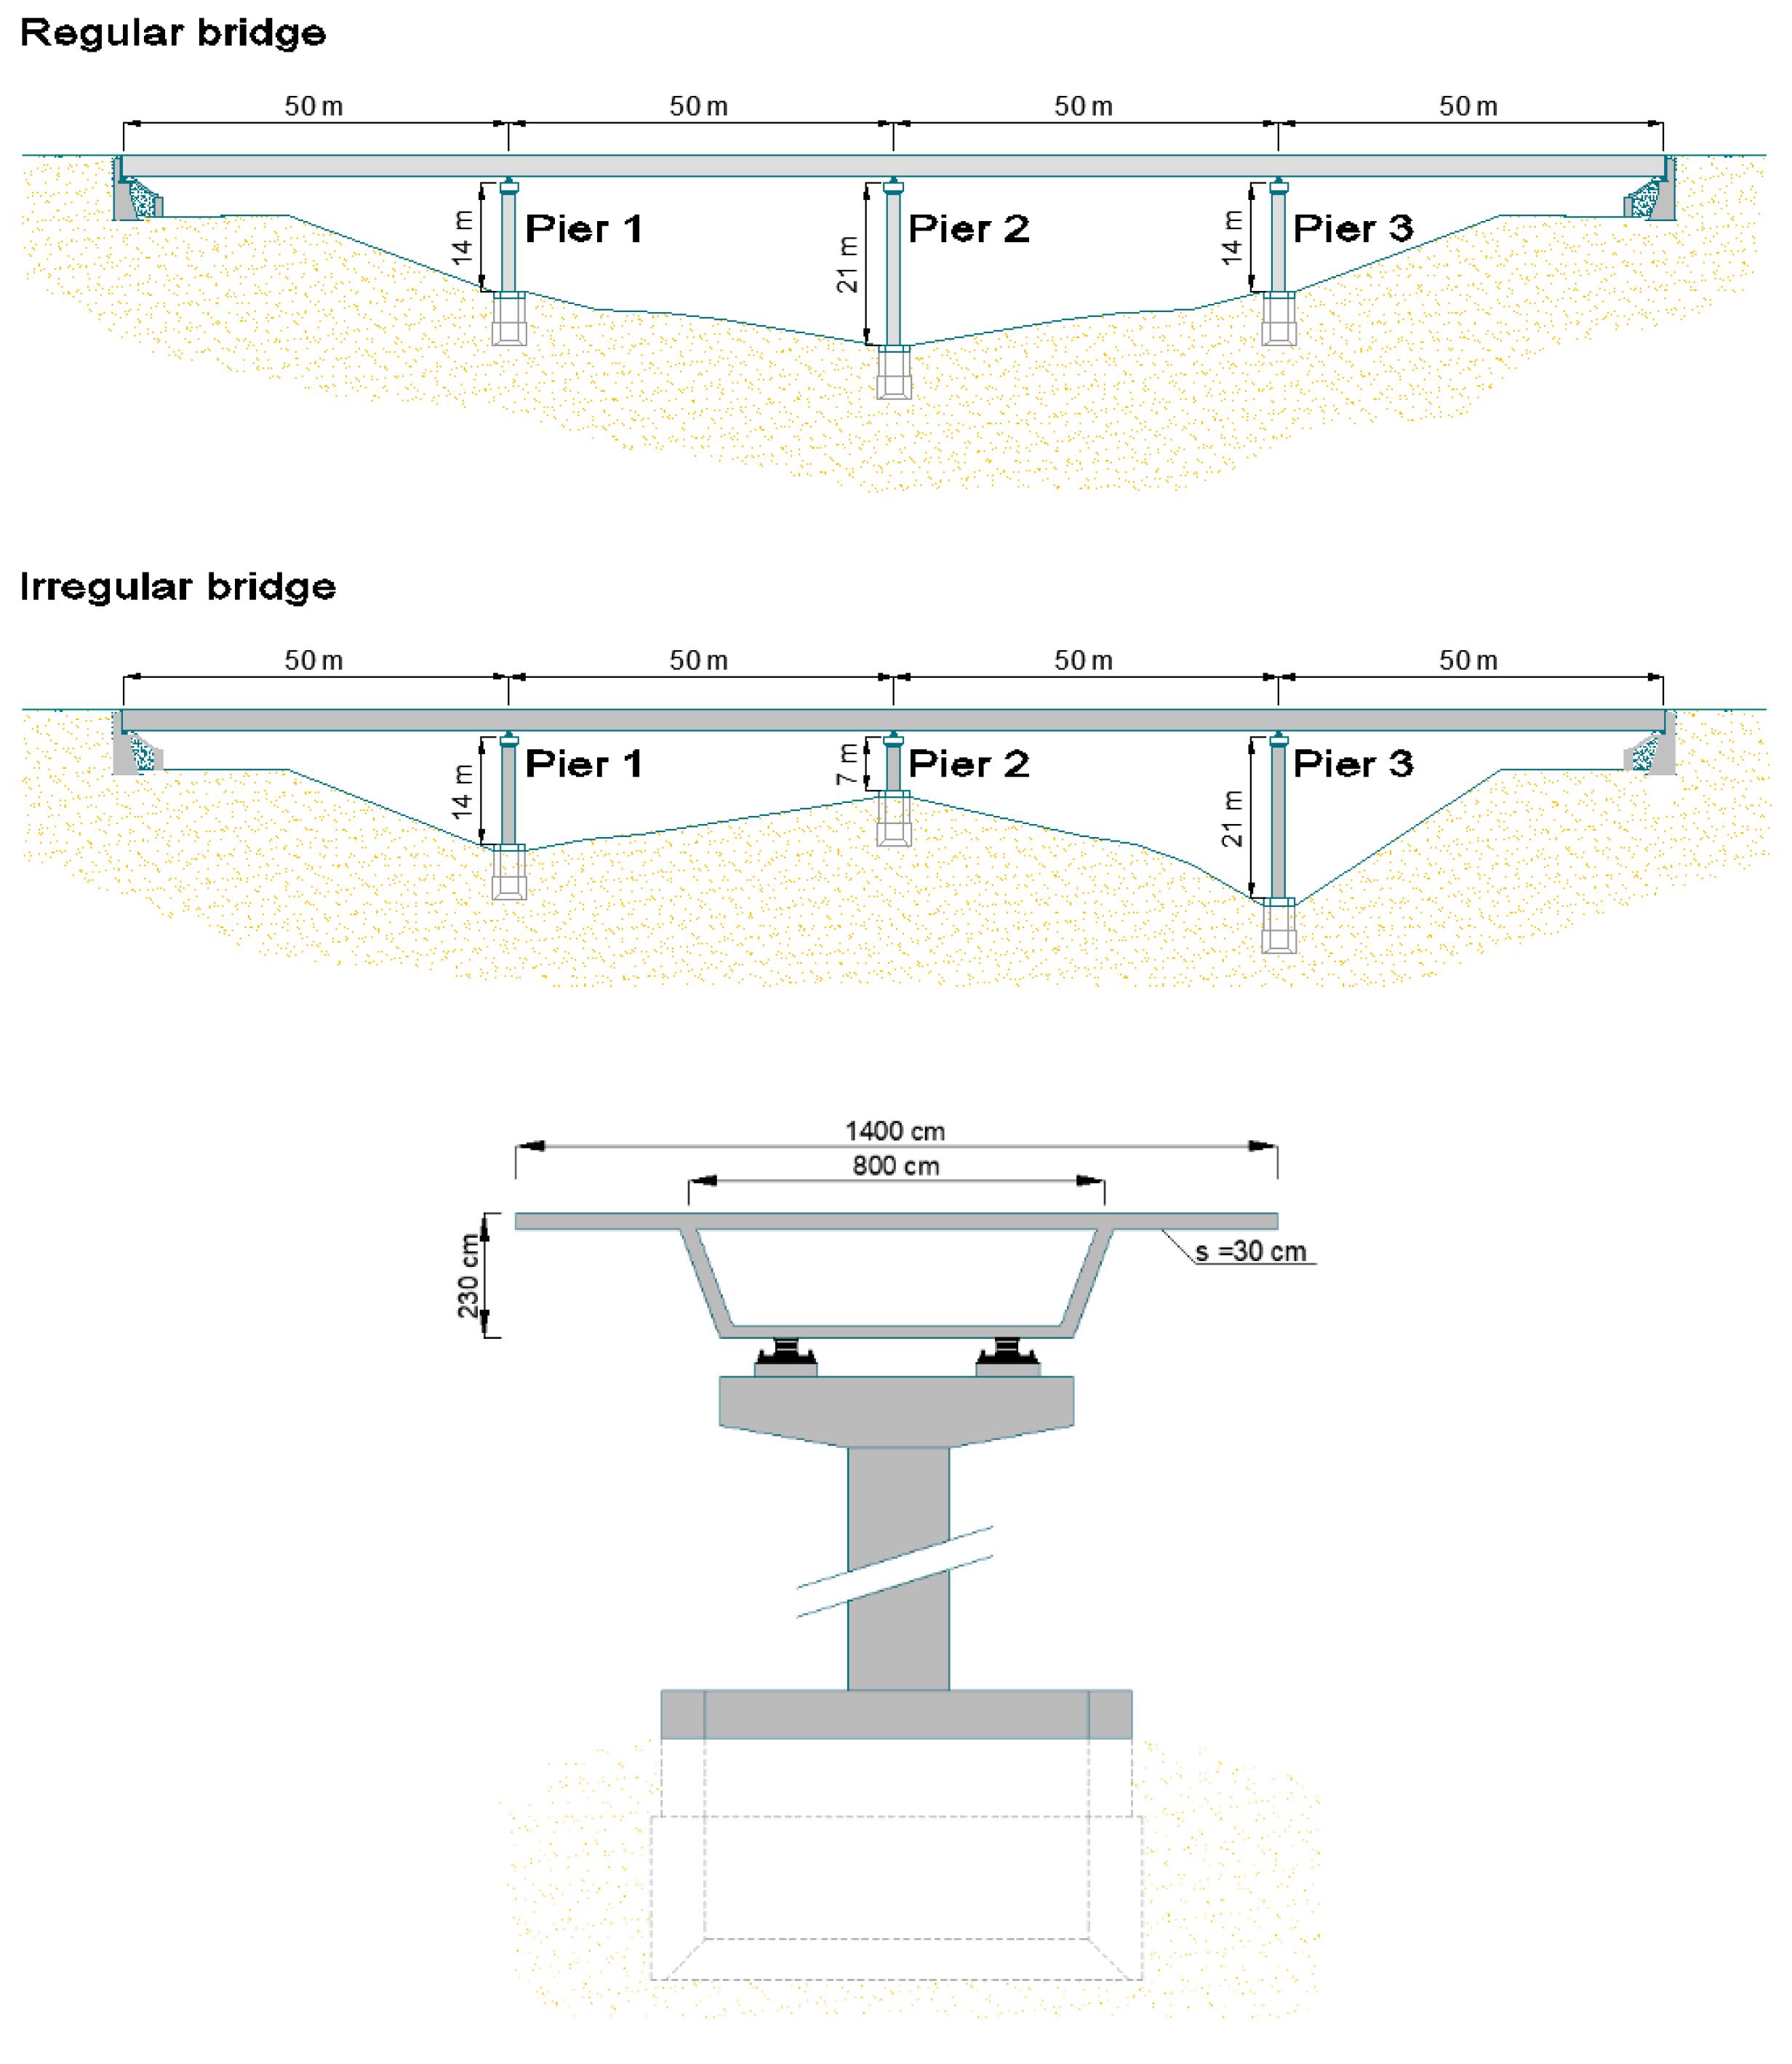
The two case studies selected were both derived from a straight bridge with four equal spans (span length of 50 m) and total length equal to 200 m (Figure 6), already used by many authors in previous comparison works since the 1990s [32]. In both cases, the deck consisted of 14 m wide pre-cast concrete box girders supported by piers consisting of a circular cross-section with a 2.5 m diameter; the pier heights were variable and differentiate the two case studies (Figure 7). The deck was supported by two abutments through elastomeric bearings (movement in the longitudinal direction was allowed at the abutments, but transverse displacements were restrained) and on the concrete pier-heads through bearings locked in the transverse direction. The concrete class used was C20/25 (characteristic compressive cylindric strength fck = 20 MPa), while B450C steel (characteristic yield strength fyk = 450 MPa) reinforcement was used throughout the structure. Both bridges were designed according to Eurocode 8, using a design peak ground acceleration of 0.35 g and a behavior factor (coefficient q) of 3.5 for the regular one and 3.0 for the irregular one. The design loads are summarized in Table 1.
3.2. Seismic Input
The response of the bridge model was estimated through the employment of nonlinear static and dynamic analyses. The dynamic analyses were performed by adopting a set of seven ground motions (GMs) selected from the response spectra (RS) used to design the bridge; from the set of ground motions, a median response spectra (RSm) was defined. To select the set of GMs, the spectrum match for a relevant period range was adopted; this approach was considered sufficient to describe the seismic behavior of an individual structure [40,41].
The RS was defined according to the Italian technical code (NTC 2018): (a) The location was Reggio Calabria (a region characterized by high seismic hazard in Southern Italy), (b) the soil class was type B (very dense sand or gravel or very stiff clay, 360 ≤ Vs30 ≤ 800), and (c) the return period considered was Tr = 949 years (life safety limit state: PVR = 10%; ag = 0.35 g; TB = 0.172 s, TC = 0.516 s, TD = 3.035 s; F0 = 2.464; ST = 1.0). Using Rexel [42], we selected a set of seven unscaled records, compatible on average with the target spectrum, and with the minimum dispersion of individual spectra: The average response spectrum matched the target spectrum at a specified period range that included all the periods considered relevant (participating mass >1% along the transverse direction of the bridge).
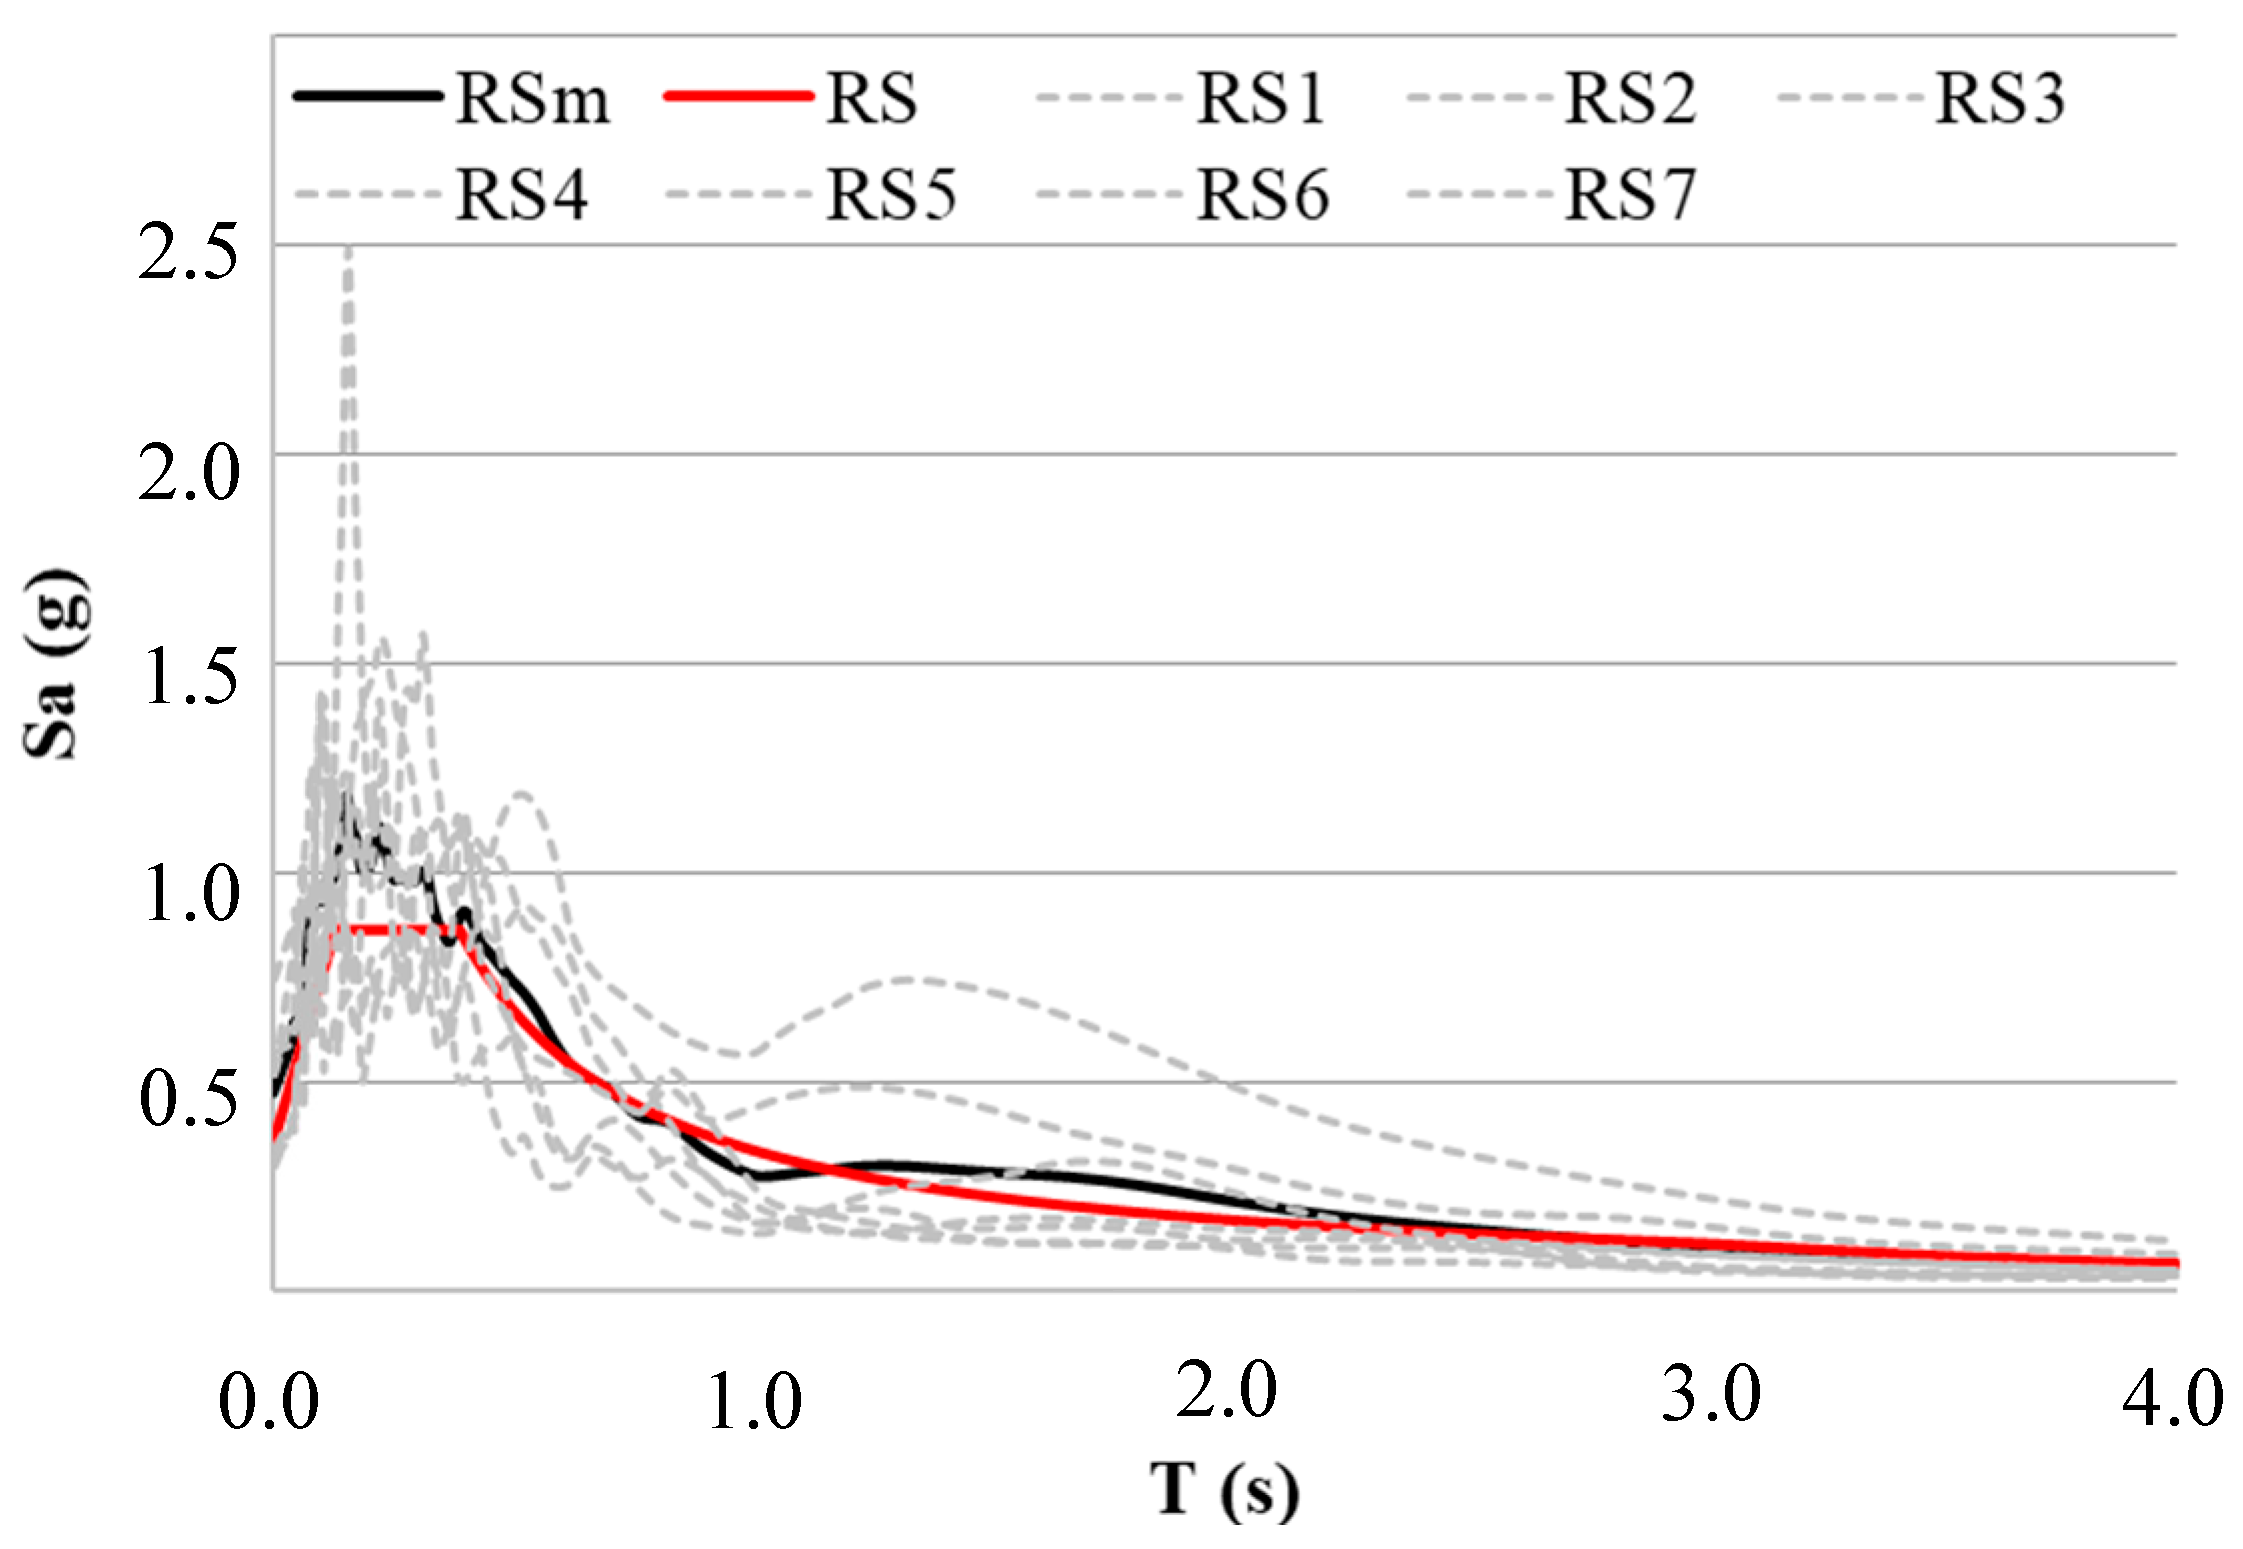
The seven ground motions selected are listed in Table 2, and in Figure 8 are shown the 5% damped response spectra of the transverse component of the ground motions. The seven GMs were used to perform the NRHAs, and their mean spectrum (RSm) was used for the purpose of evaluating the pushover-based procedure (the performance point is evaluated, for each intensity level, adopting RSm for the seismic demand); in Figure 8, the RS used to design the bridges (RB and IB), together with RS1, …, RS7 (the response spectra of the seven GM) and their mean spectrum RSm (the one used for the nonlinear static analyses), is plotted.
In this paper (Section 4), analysis results are presented in terms of bridge capacity curve, i.e., monitoring point displacement versus seismic intensity, configuration of the deck drift profile, plastic hinges rotations and bending moments. Following Eurocode 8 recommendations, the independent damage parameter selected was the displacement of each pier top node (P1, P2 and P3).
3.3. Numerical Models
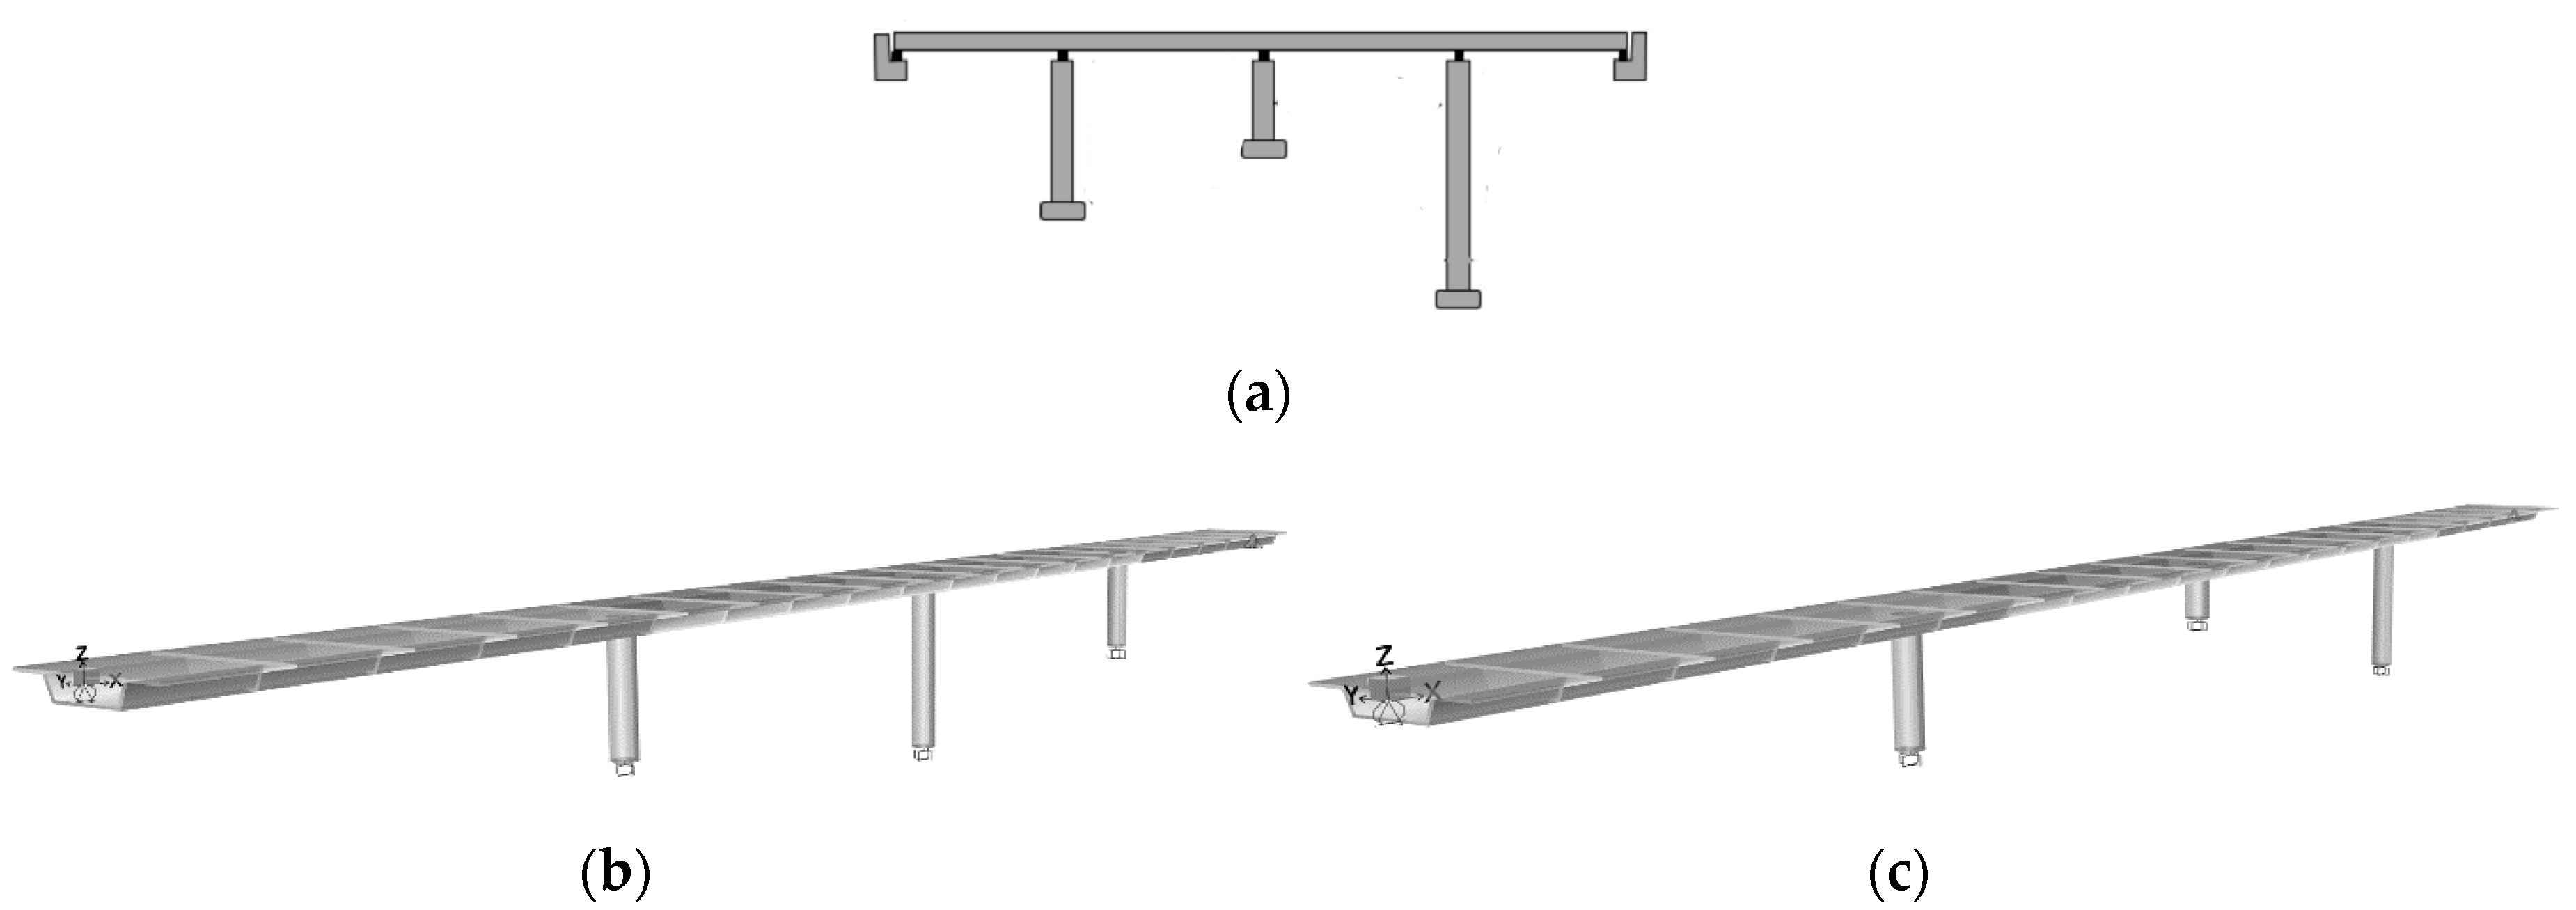
The Bridges were modeled by using the finite element (FE) software SAP2000 NL, v. 21 [43]; the 3D numerical models are shown in Figure 9a,b,c and were modeled according to the structural scheme already used in previous studies [44].
The models were developed according to PEER guidelines [45], and they ideally represent the mass distribution, strength, stiffness and deformability of the real bridge. Following the procedure proposed in Reference [45], piers and girders supporting the deck were modeled by tridimensional frame elements; the box-girder cross-section was defined by using the SAP 2000 Section Designer that allowed us to correctly model the real geometry described in Figure 7.
The connection between the superstructure and the abutment is modeled as a rigid connection in the transversal direction. All the pier elements were modeled with nonlinear properties at the possible yield locations, i.e., plastic regions, according to Eurocode 8. The plastic hinges were modeled with fiber (P-M2-M3) hinges of SAP2000, as suggested in Reference [45].
Unconfined concrete was assigned for the concrete cover and confined for the rest of the section; the Mander concrete model was used to model confined and unconfined concrete stress–strain relationships, whereas the constitutive model of the reinforcing steel was intended consistently with the design parameters of the B450C (Fy = 450 Mpa, Es = 210000 Mpa, Fu = 540 Mpa). The fiber hinges were defined by moment-rotation curves that were calculated by using a fiber-based model of the cross-section according to the reinforcement details at the hinge locations.
3.4. Modal Properties
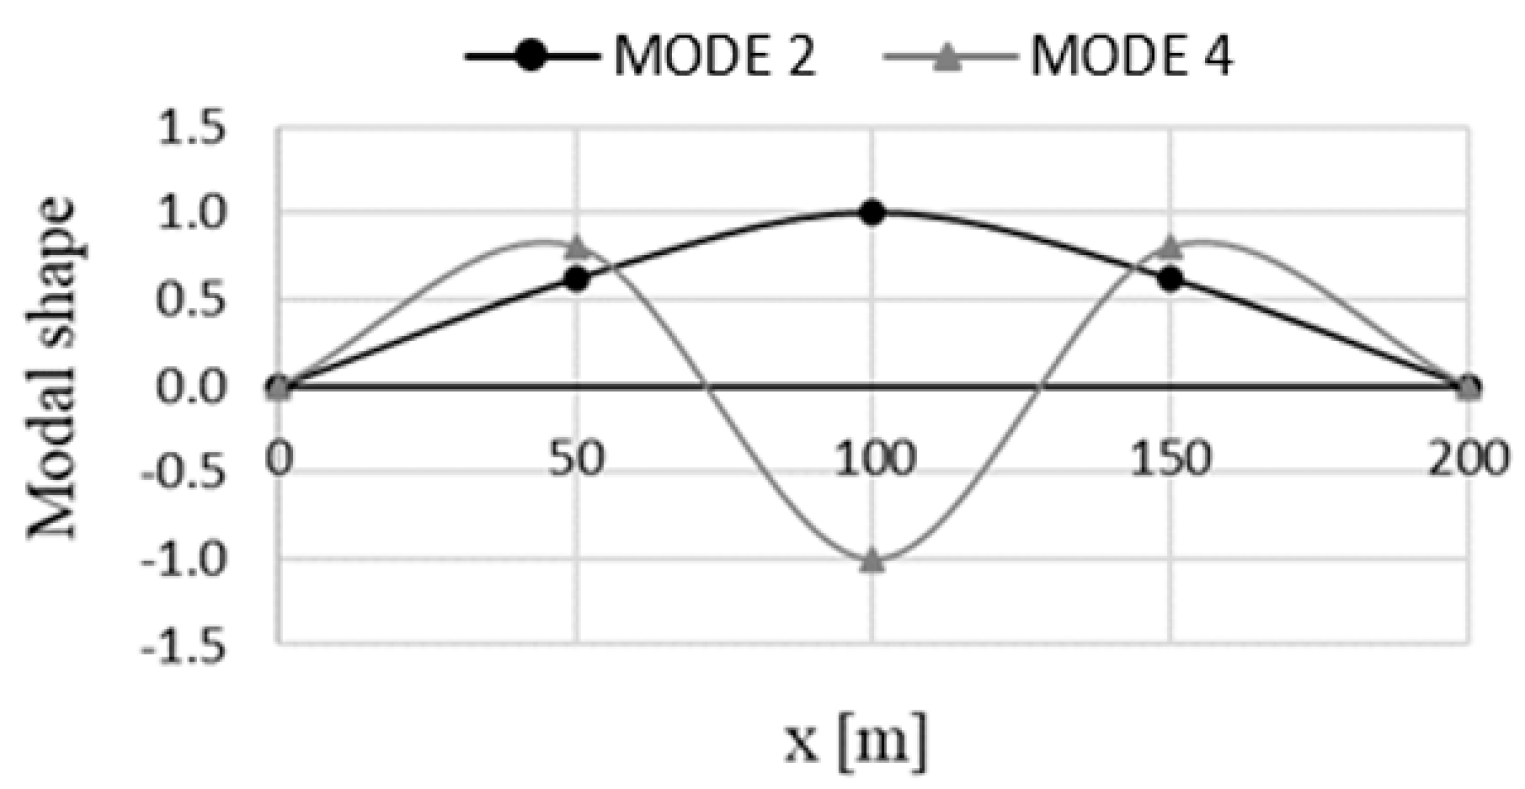
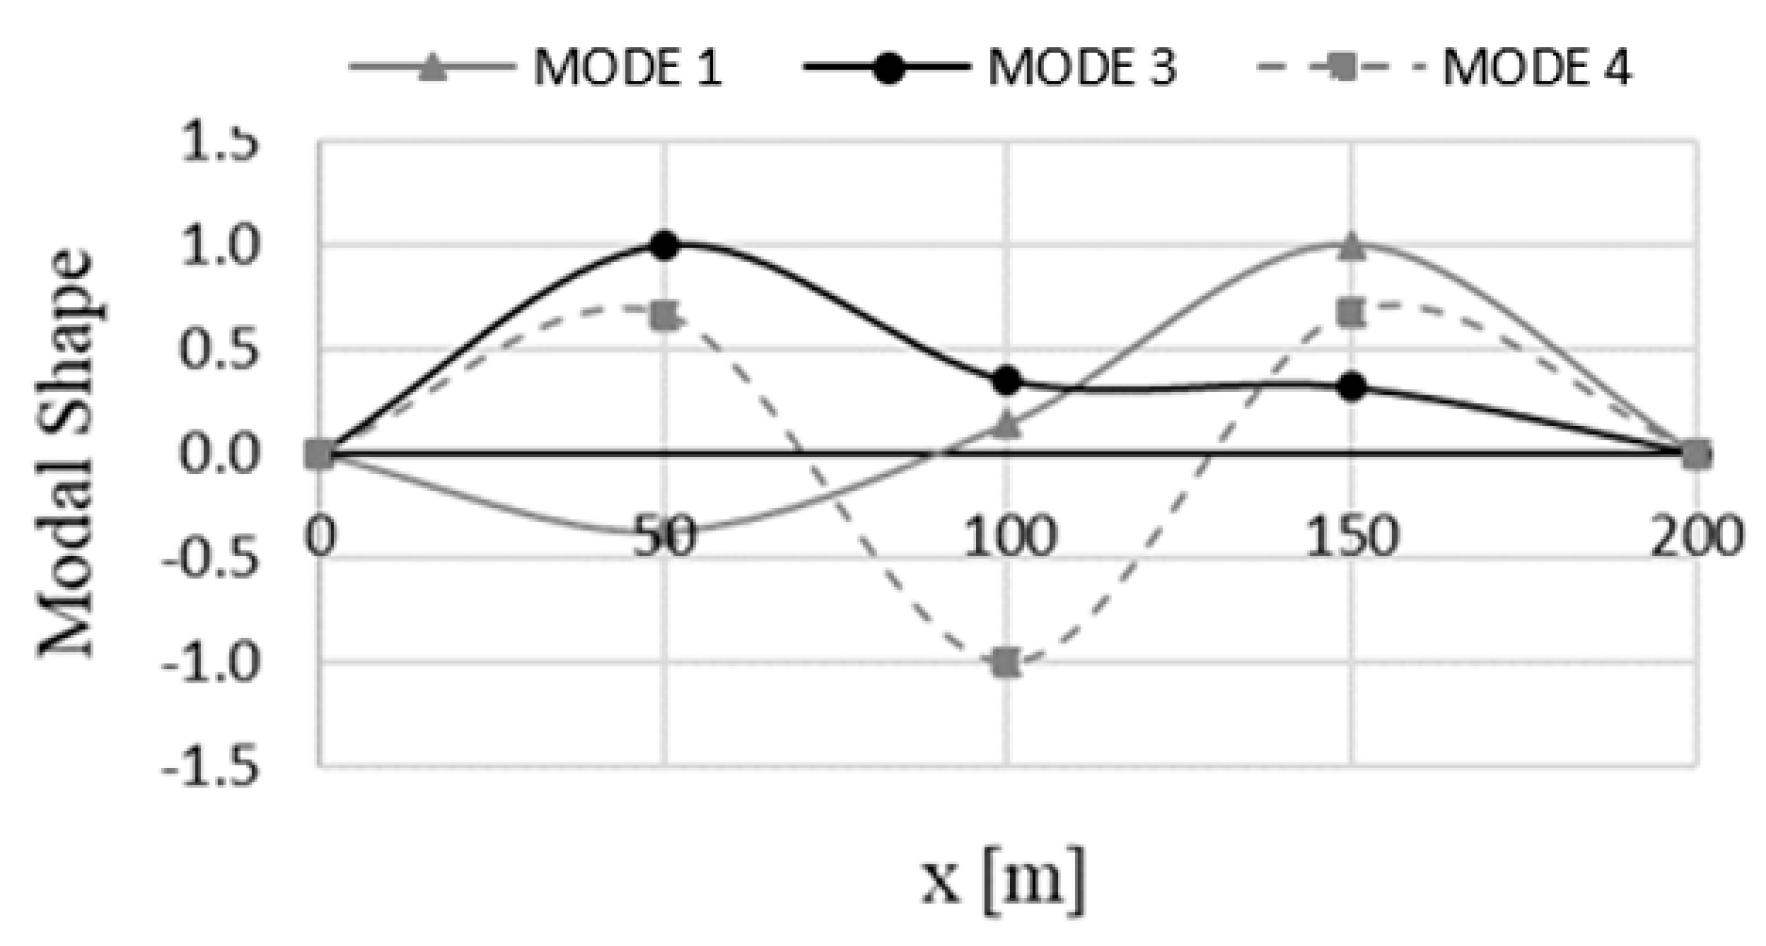
Modal properties of the bridge model were obtained from the linear dynamic modal analysis. Table 3 and Table 4 show the details of the “important” modes (in this work, according to what is discussed in Reference [34], modes with a mass ratio ≥3%; the others can be neglected), in transverse direction, for both bridges considered: the RB and the IB, respectively. For the RB, the participating mass ratio of the first two relevant modes (mass ratio ≥3%) was, respectively, 78% and 12%; the cumulative mass participating ratio for first three modes was 90% (the participating mass ratio of any other single mode was less than 1%). Table 3 shows that, for the IB, the participating mass ratio of the first three relevant modes was, respectively, 16.9%, 71.3% and 4.5% (Mode 4 was therefore almost insignificant in the elastic phase, but this condition, as discussed later, changed in the nonlinear phase); the cumulative mass participating ratio for the first three modes was 92.7% (the participating mass ratio of the other modes was less than 1%). The first two or three mode shapes in the transverse direction, for RB and IB, respectively, were adopted performing the MPA; the dominant modes of the two cases were Mode 2 (T2 = 1.02 s) for the RB and Mode 3 (T3 = 0.53 s) for the IB. Mode shapes for RB and IB are depicted in Figure 10 and Figure 11, respectively.
4. Nonlinear Analyses
Standard pushover (SPA, according to the first modal shape), uniform pushover analysis (UPA) and modal pushover analysis (MPA) were performed to assess the inelastic response of the bridges. The results of these analyses are presented and evaluated, comparing results with NRHA.
According to the capacity spectrum method (ATC 40 [20]), the base shear forces and the corresponding displacements (being Vbn − urn the pushover curve of the multi-degree of freedom) were converted to ADRS format, using the following relationships (being Sa and Sd the spectral accelerations and spectral displacements of an equivalent single degree of freedom (SDOF) system):
where frn is the value of fn at the monitoring point; M*n = LnGn is the effective modal mass; Ln = fTn m l, Gn = Ln/Mn and Mn = fTn mfn were the generalized mass for the natural mode, n.
As discussed by Kappos et al., in 2010 [11], if the structure remains elastic for the given earthquake intensity, the spectral displacement, Sd, and the product Gn·fn will be independent of the selection of the monitoring point; this means that deck displacements are independent from the location of the monitoring point.
Conversely, in some applications of the same authors, it was found that deck displacements derived with respect to different monitoring points, for inelastic behavior of the structure, were not identical, but rather the estimated deformed shape of the bridge depended on the monitoring point selected for drawing the pushover curve for each mode.
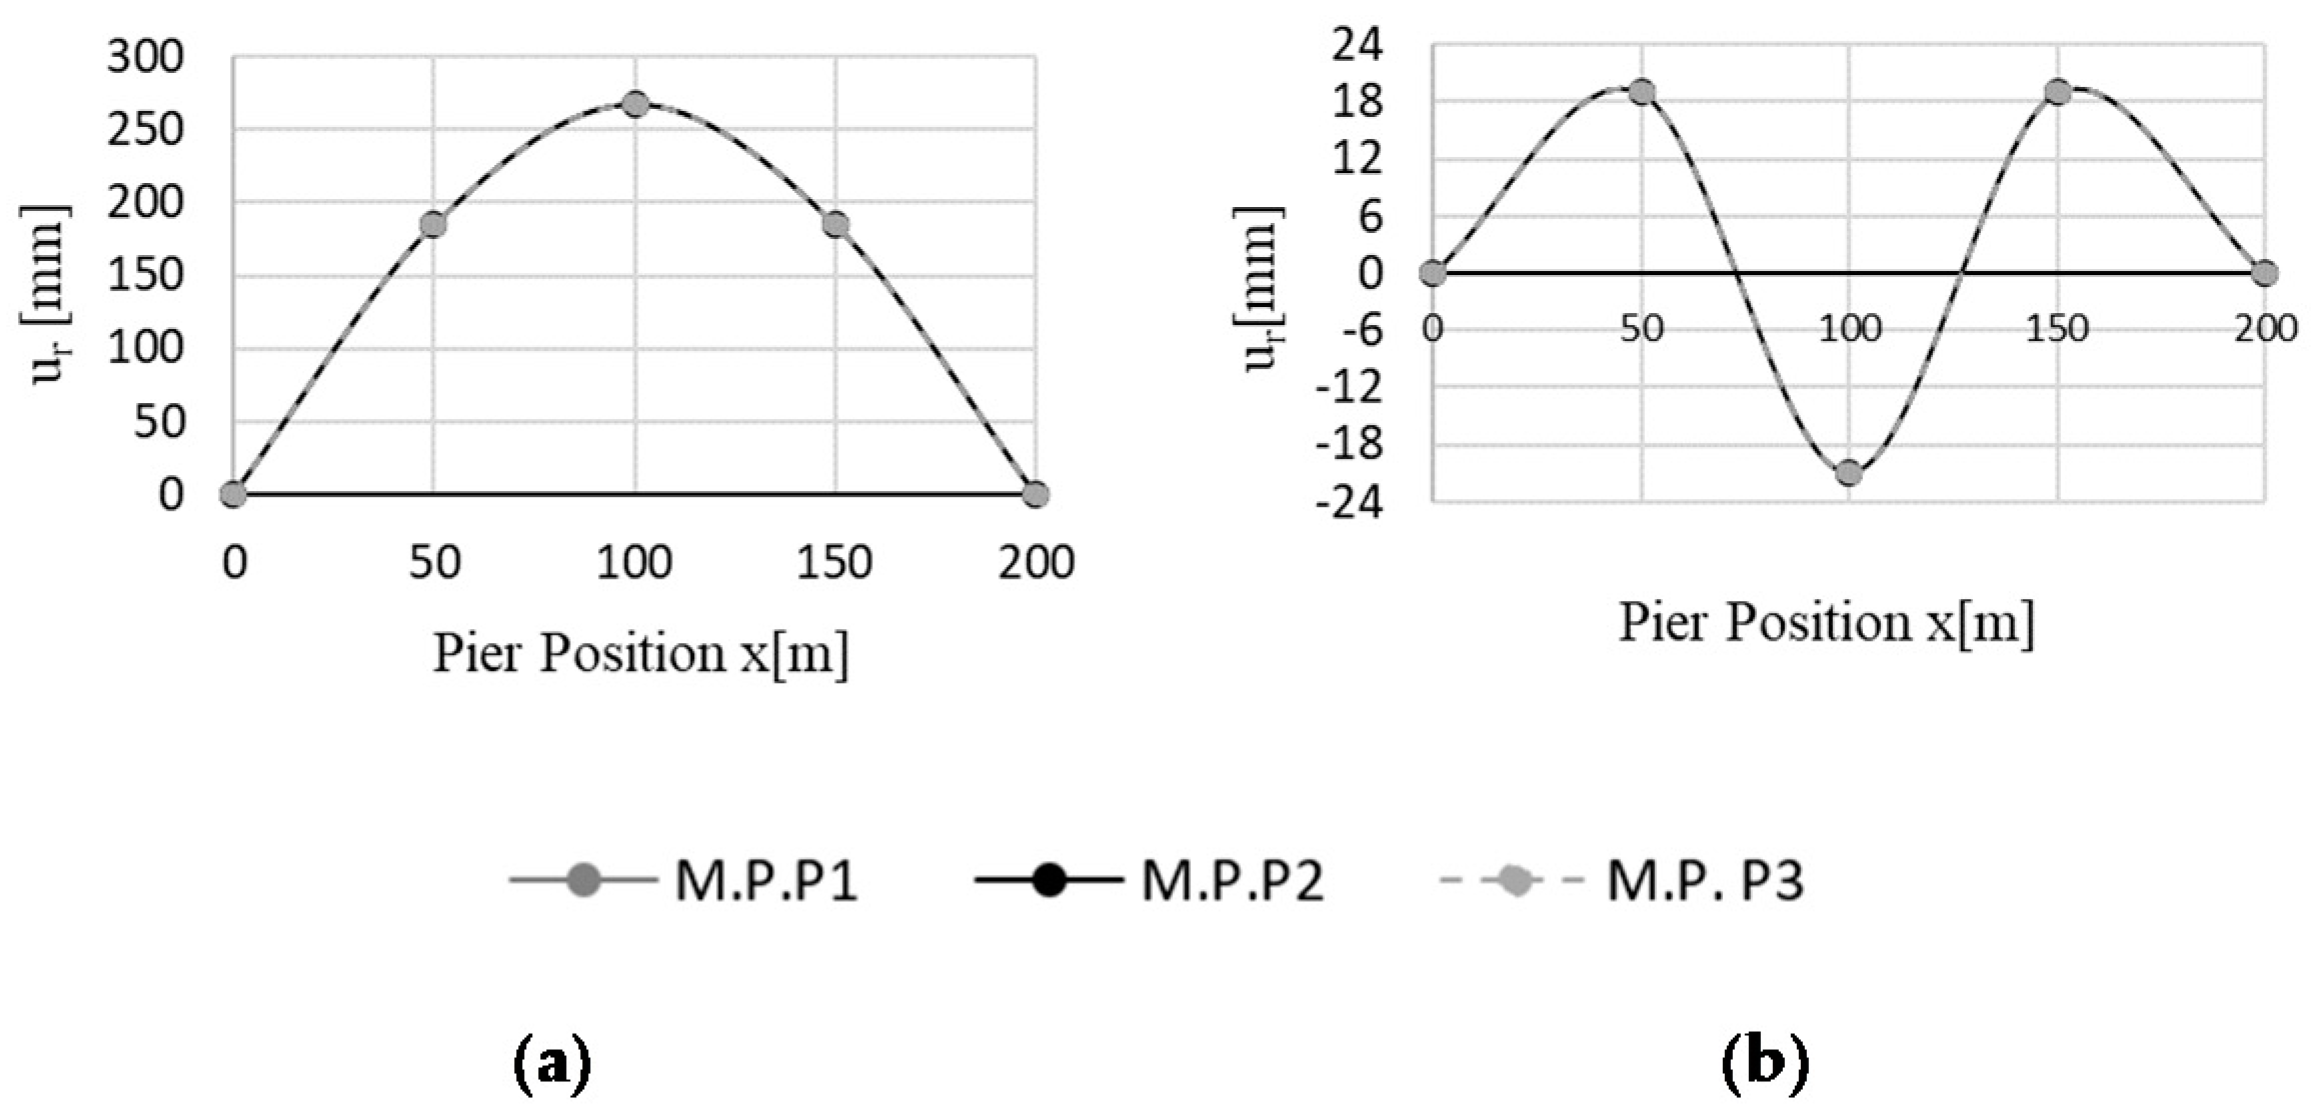
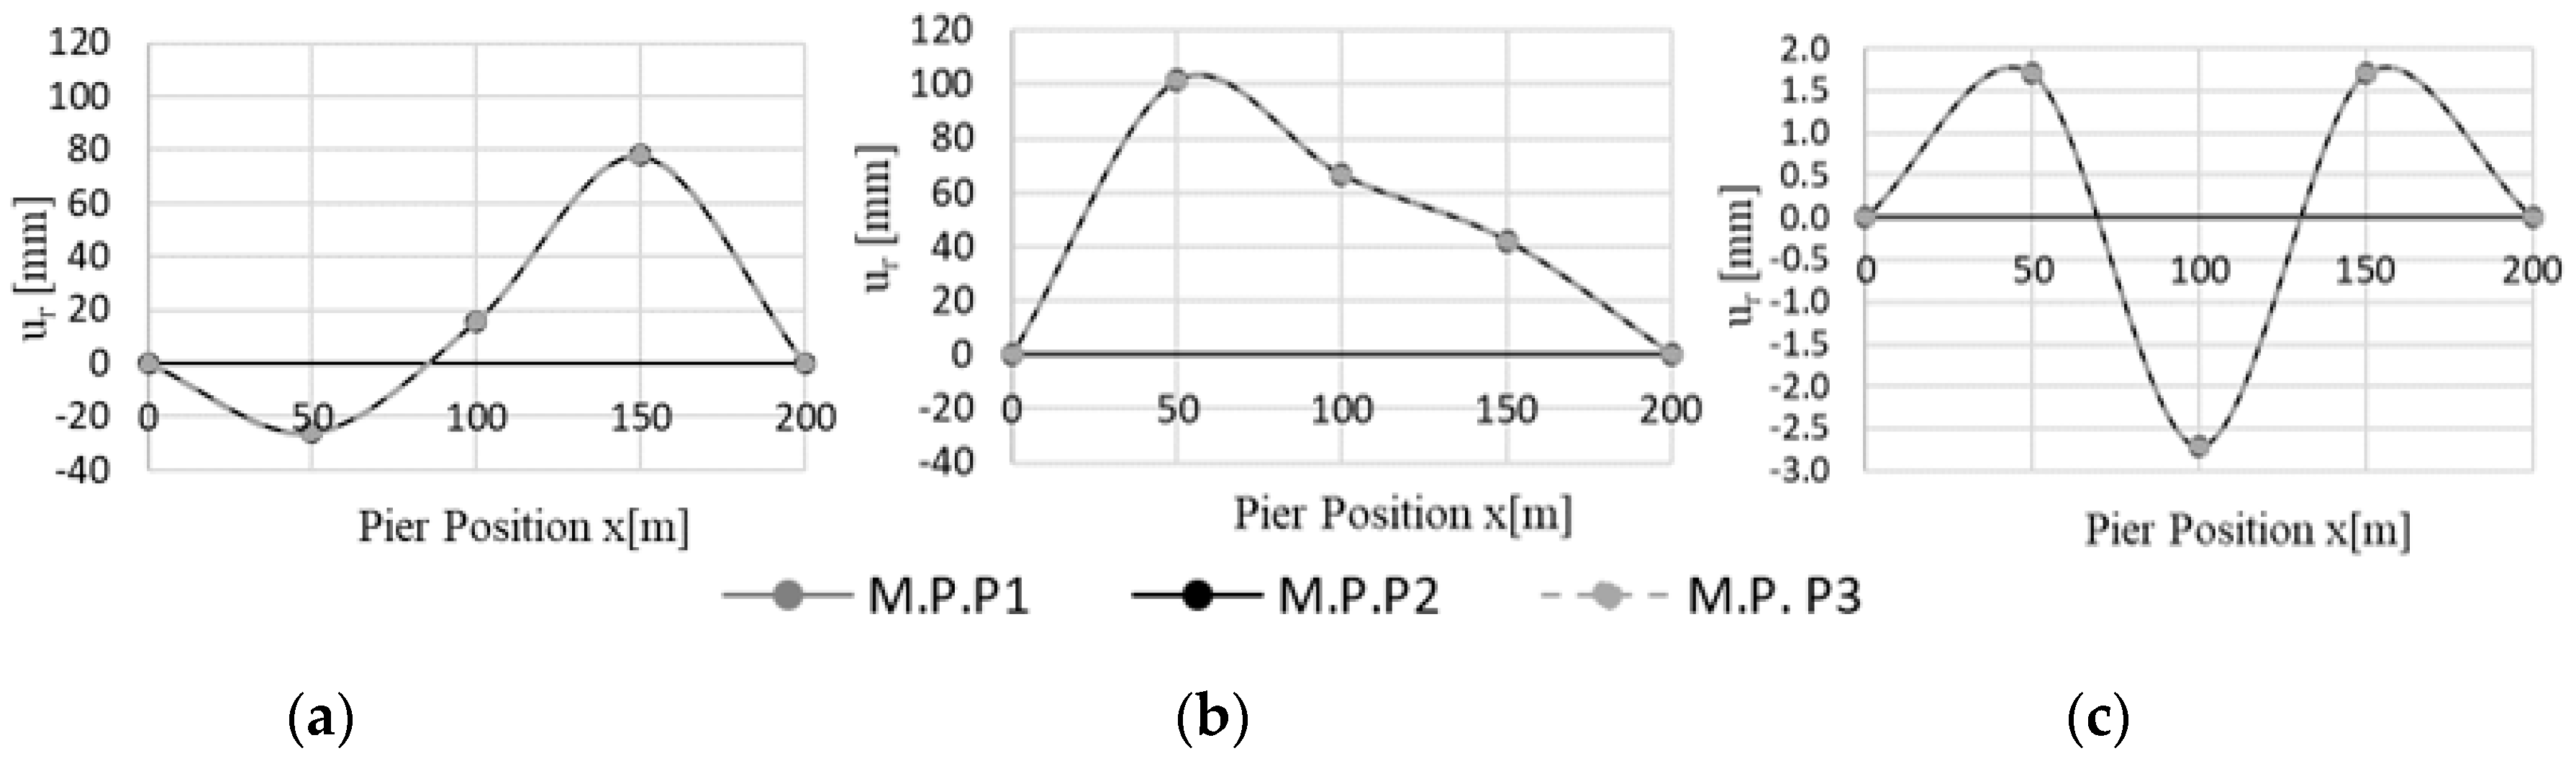
In the case of inelastic behavior, the conversion of the displacement demand of the n-mode SDOF system to the peak displacement of the monitoring point, urni, of the bridge gives a different value, not only because of the deviation of the elastic mode shape, fn, from the actual deformed shape of the structure, but also due to the fact that the spectral displacement, Sd, is dependent on the selection of monitoring point if the structure exhibits inelastic behavior (due to the bilinearization of the capacity curve). For the applications conducted in this work (RB and IB), it was noted that the approximations involved in the capacity-demand spectra procedure, deriving deck displacements with respect to different monitoring points, were neglectable, and results were deemed acceptable, analogously to what was concluded by other authors [36,37], for all practical purposes. Figure 12 and Figure 13 illustrate the deck displacements of the RB and the IB, derived by using pushover analysis for each mode independently, as well as the MPA, considering the monitoring point at the different positions: top of Pier 1 (P1), Pier 2 (P2) and Pier 3 (P3).
According to what we discussed in Section 2, the same results can be finally obtained by selecting one or the other MP (it should be considered that a wrong selection can return a complex analysis calibration). According to some modal shapes, a null or quasi-null modal coefficient (or with an opposite sign if compared with the main bridge incremental deformation) can compromise the analysis (e.g., Pier 2 @ Mode 1 of the RB—Figure 11 and IB—Figure 12 and Pier 2 @ Mode 4 for both the IB). Therefore, the selection of the top of Pier 1 as the most suitable monitoring point was adopted for both cases.
4.1. Analysis of the Regular Bridge (RB)
The RB was analyzed at several seismic intensity levels: from PGA = 0.175 g to PGA = 0.7 g, with PGA = 0.35 g being the design value.
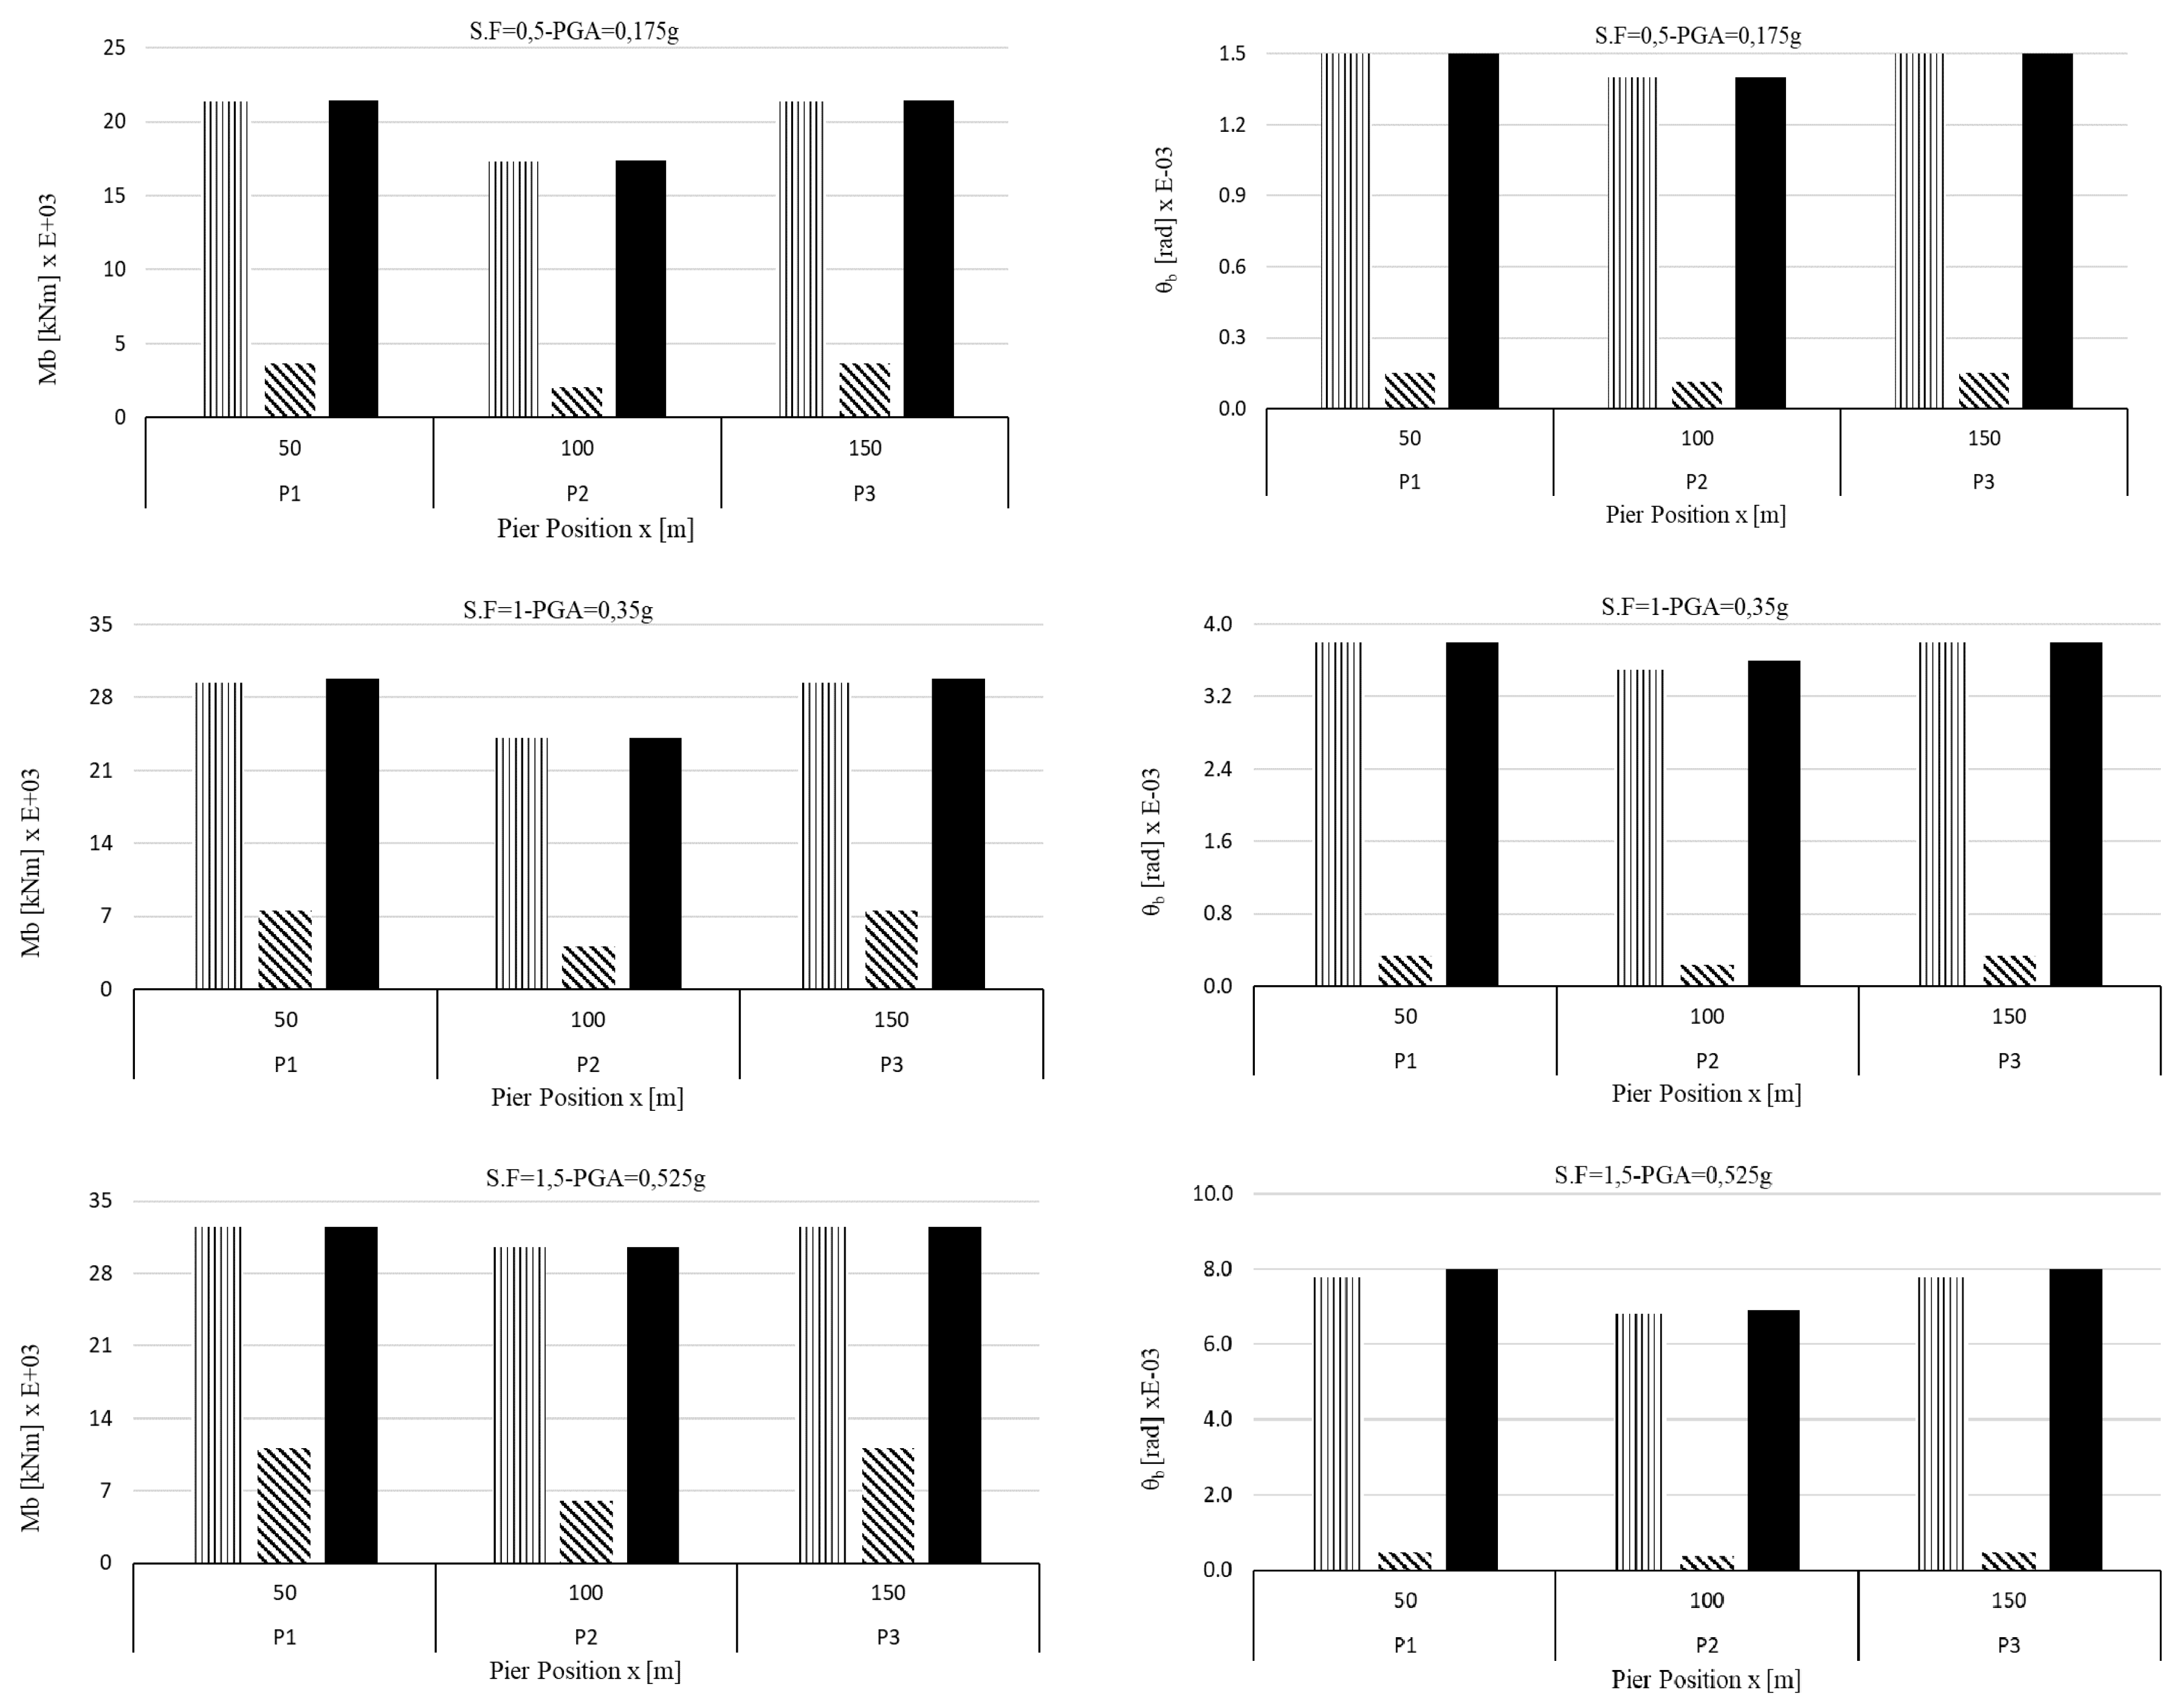
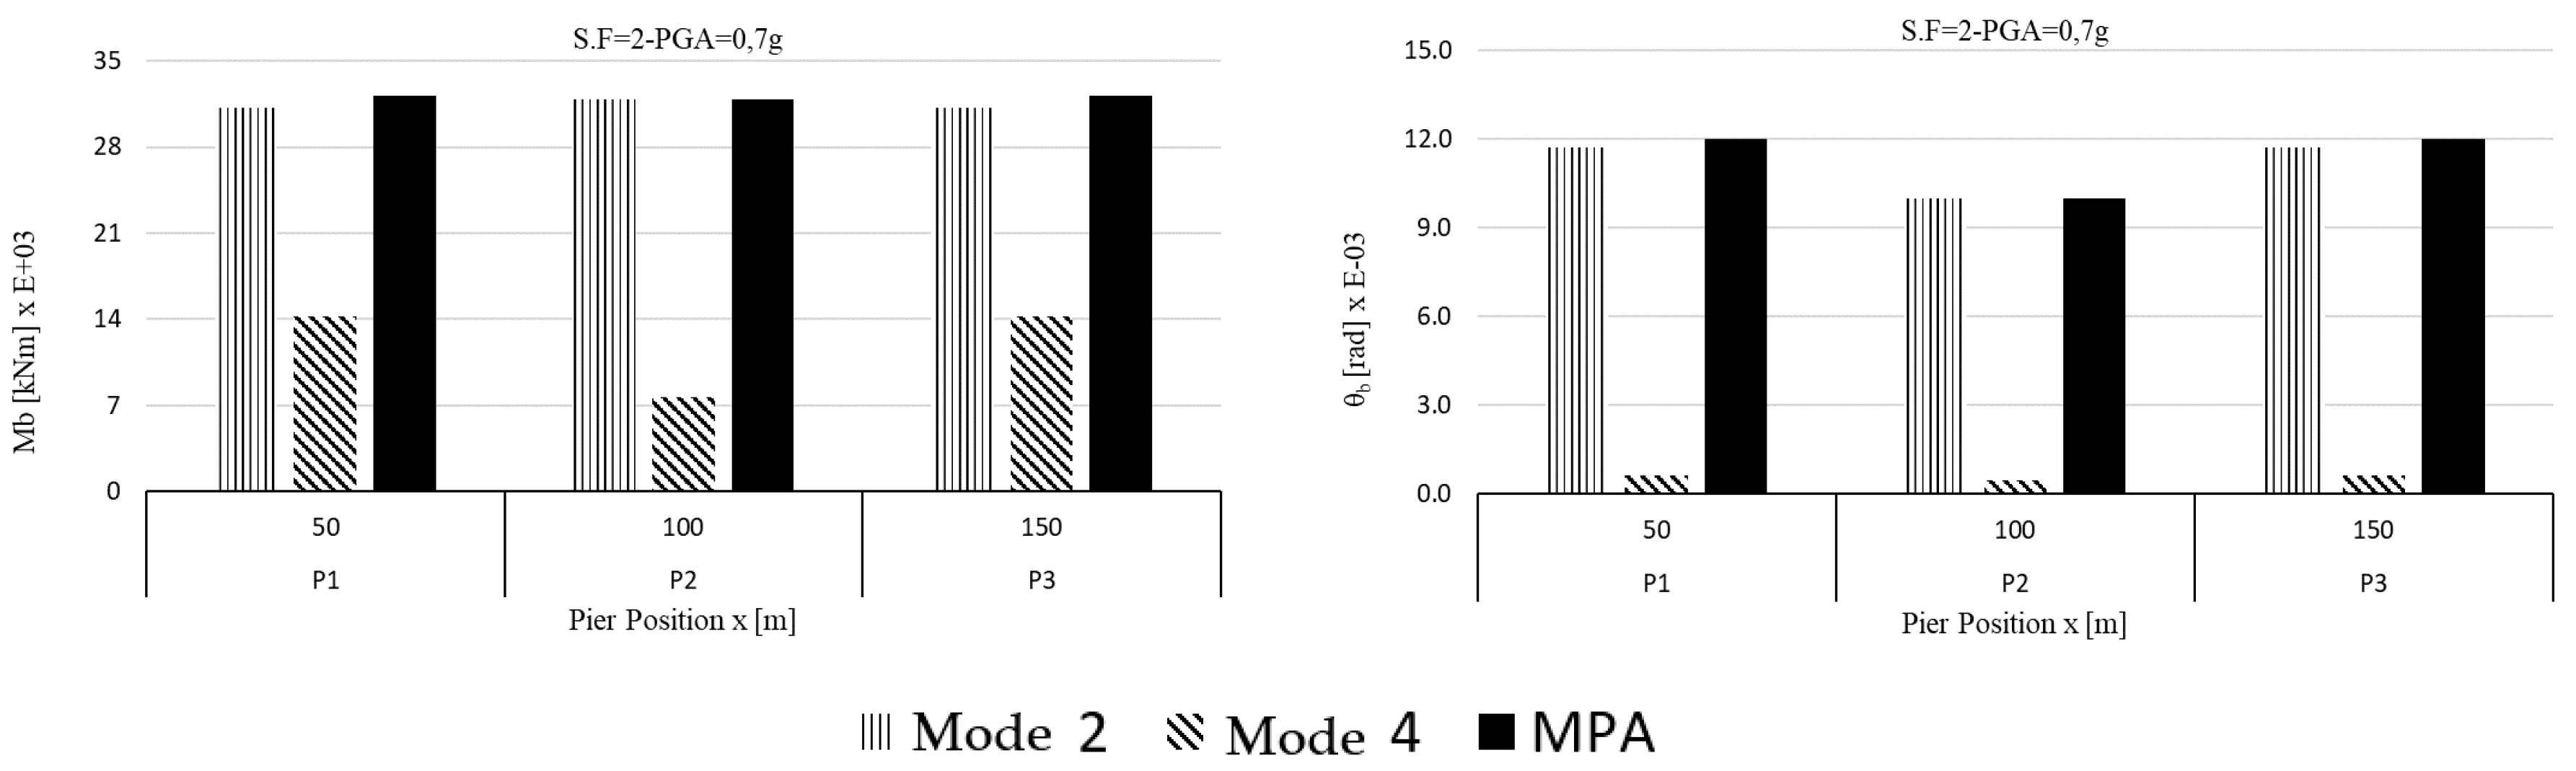
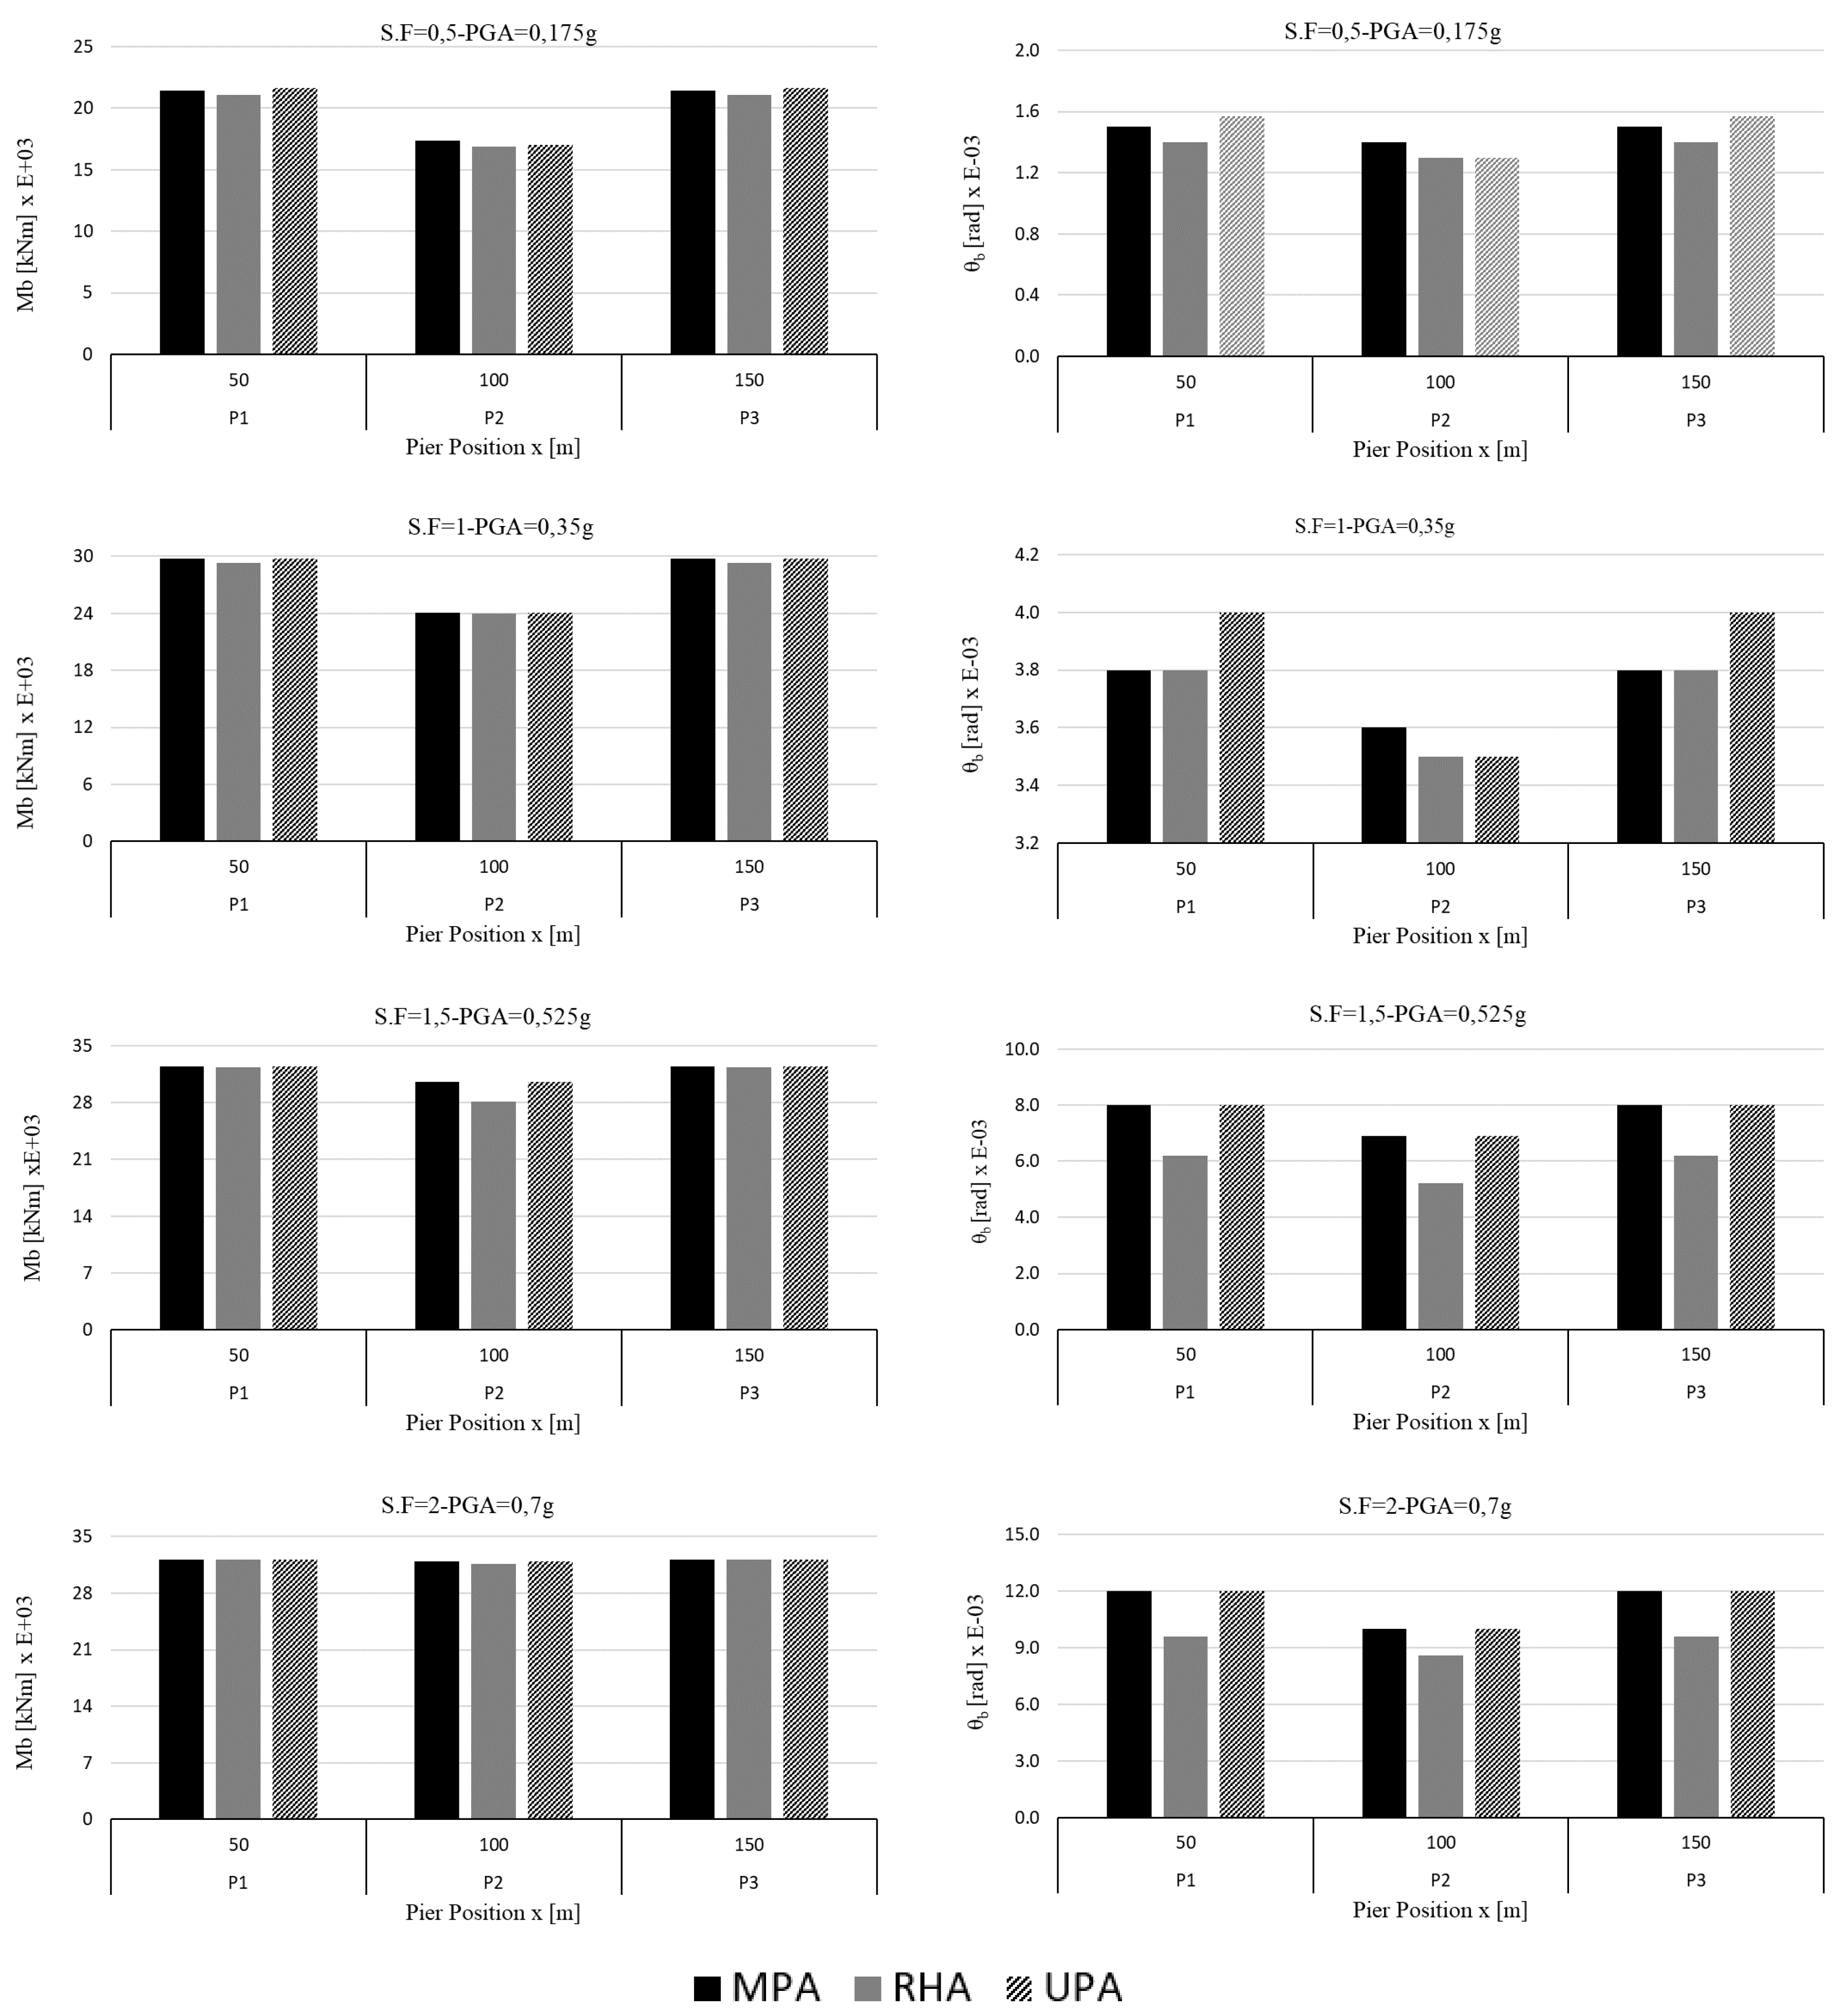
Since the response of this bridge was governed by one dominant mode (Mode 2), with Mode 2 and Mode 4 being the modes considered in the multimodal approach, and since the mode shape was not changing significantly (it was not considerably influenced by the occurrence of new hinges), the estimated response was practically the same, regardless of the method used (MPA, SPA or UPA) in the analysis (Figure 14, Figure 15, Figure 16 and Figure 17). The estimated response has a good agreement with the results of NRHA for PGA = 0.175 g (SF = 0.5) and PGA = 0.35 g (SF = 1.0).
Analyzing in Figure 18 the capacity curves obtained by applying the IMPAβ and comparing them with IDA results, it was confirmed that the use of the incremental modal pushover analysis allowed to describe the structural response with excellent accuracy, and without relevant estimation errors, inside the intensity range for which the bridge was designed. Indeed, the use of the second pushover approach (UPA) brought us to conservative results in terms of deck displacements related to the seismic intensity considered, but it underestimated the base shear if the capacity curve was considered. The ur-Sa curve showed how, for an intensity level (Sa) beyond the design value (0.35 g), the displacement estimate with IMPAβ differs from IDA, but it is conservative, whereas the ur-Vb,x curve (Vb,x is the base shear evaluated for all the piers) better matched the curve derived from IDA since, beyond the design intensity (Vb,x ~ 9200 kN), the higher displacements derived with IMPAβ are related to a base shear value that are very similar, since the bridge (hinges of the piers) is in a plastic stage.
4.2. Analysis of the Irregular Bridge (IB)
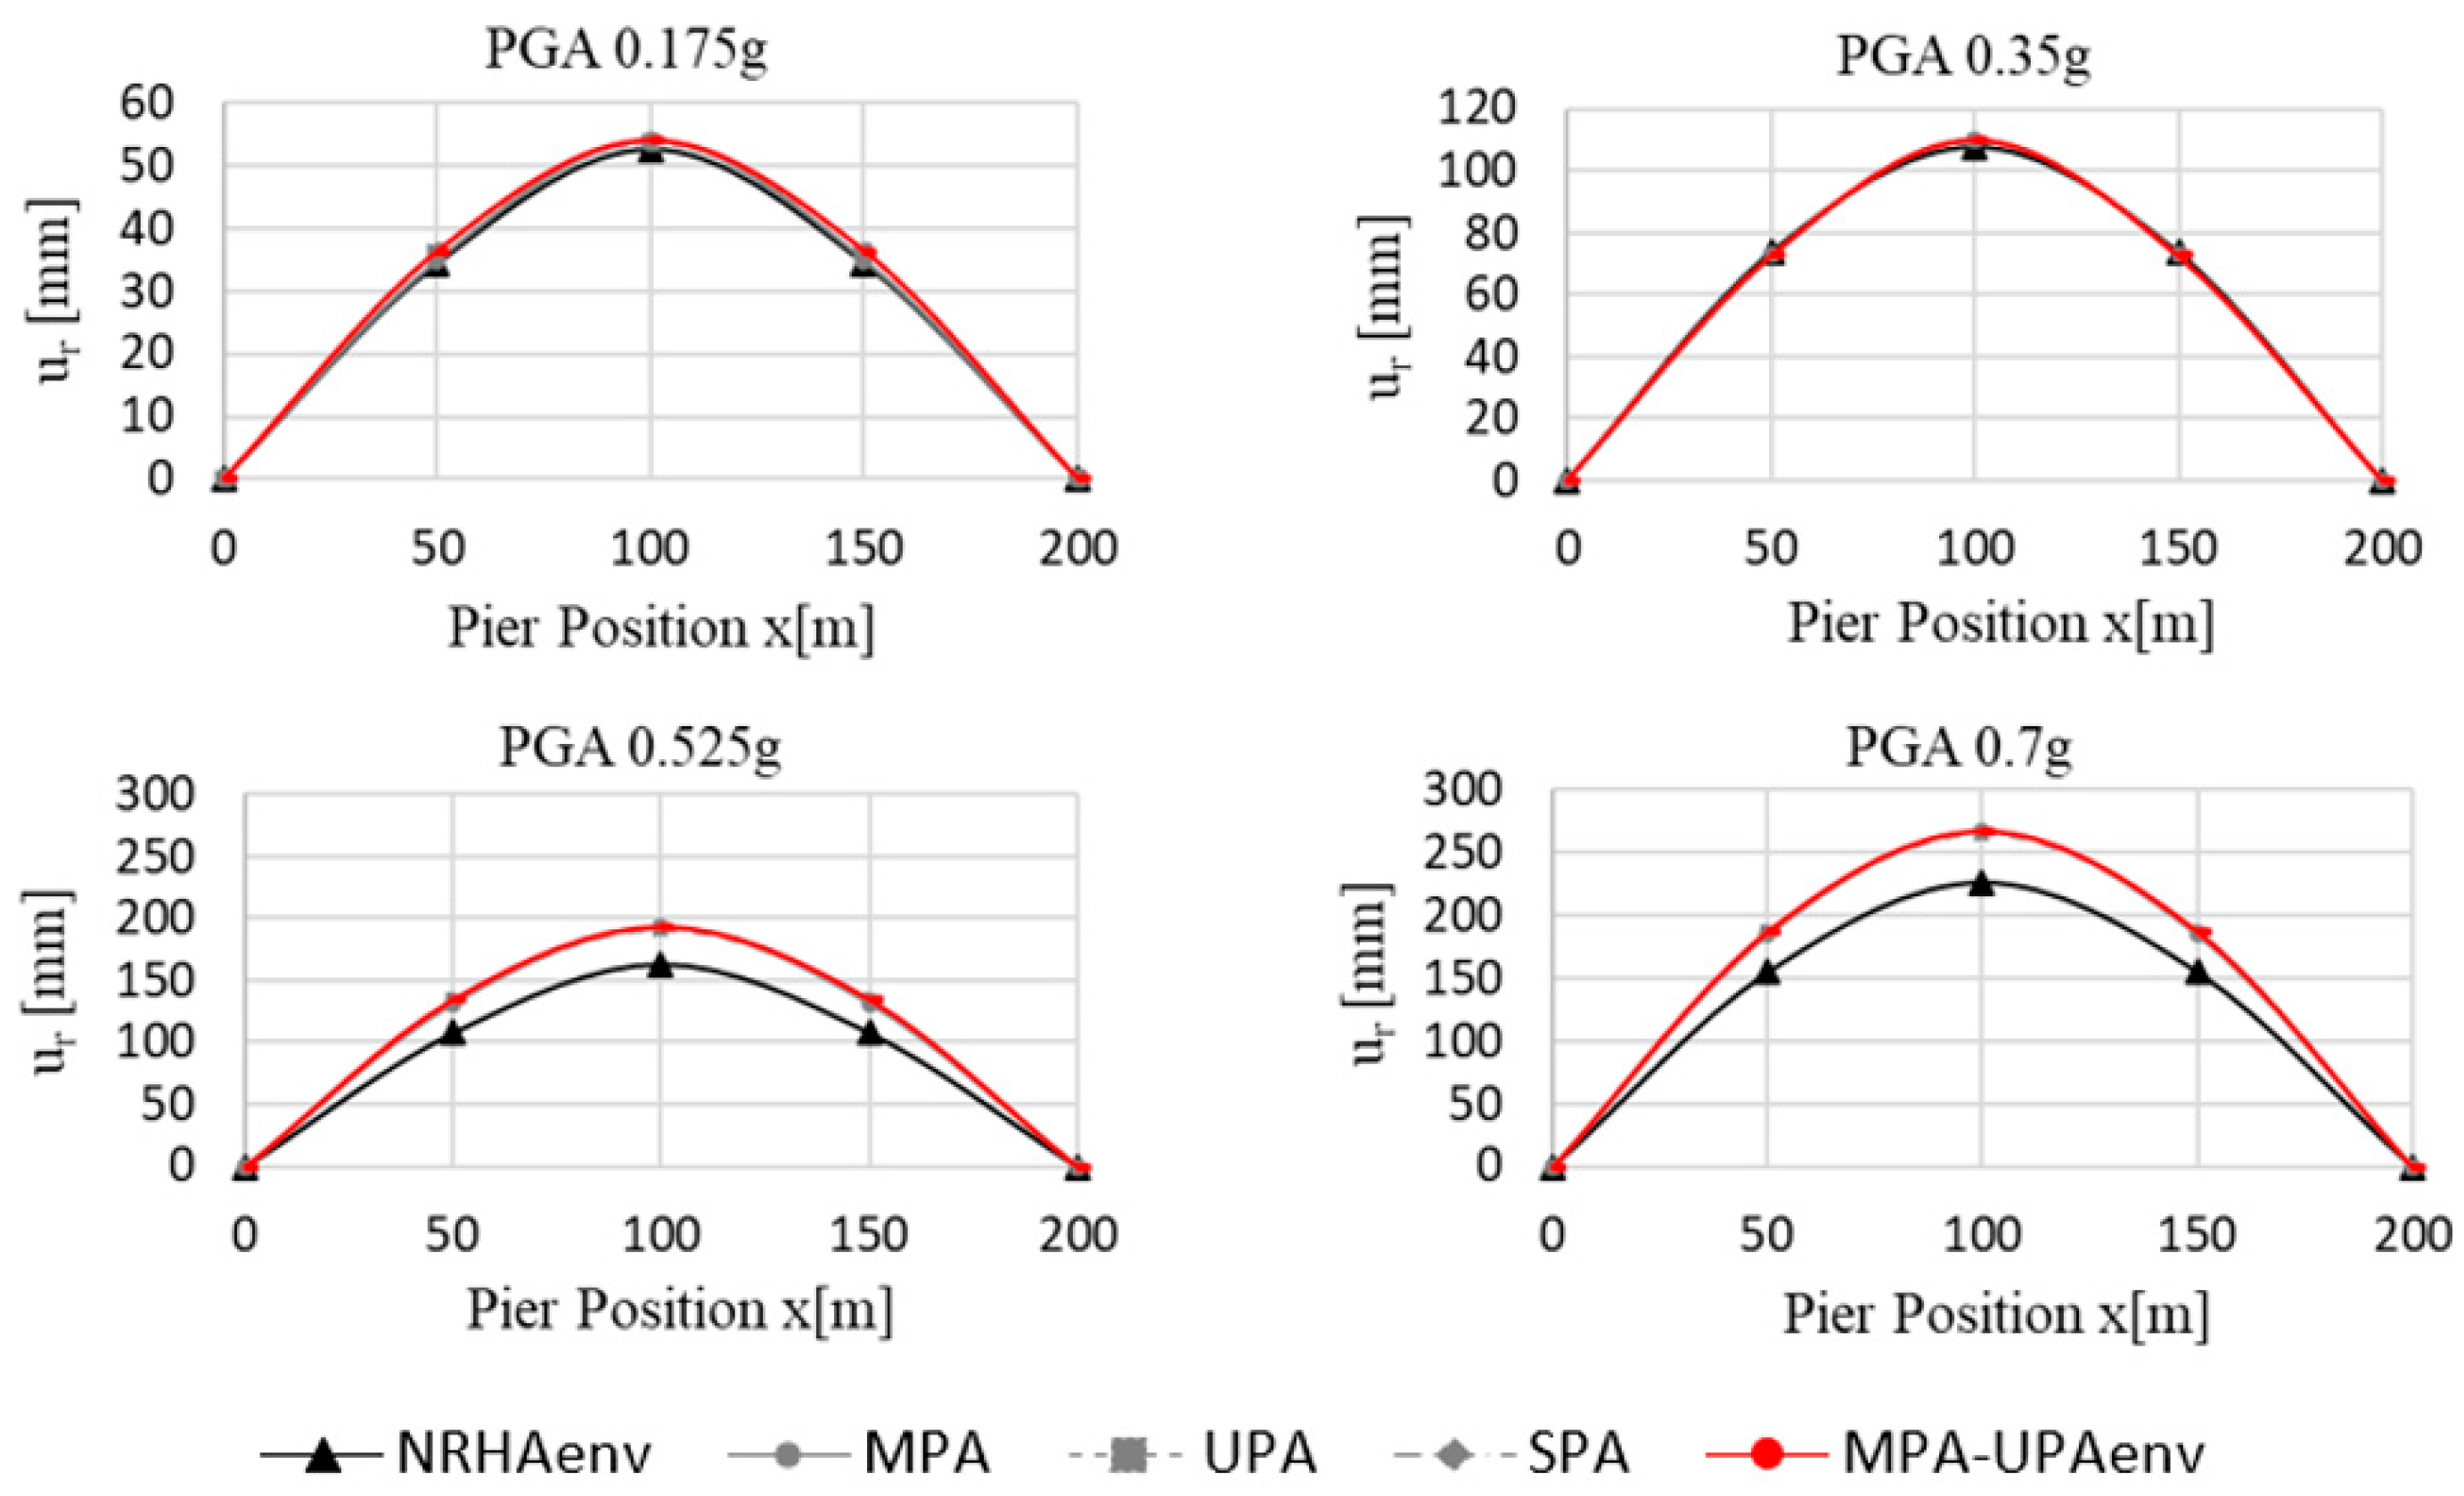
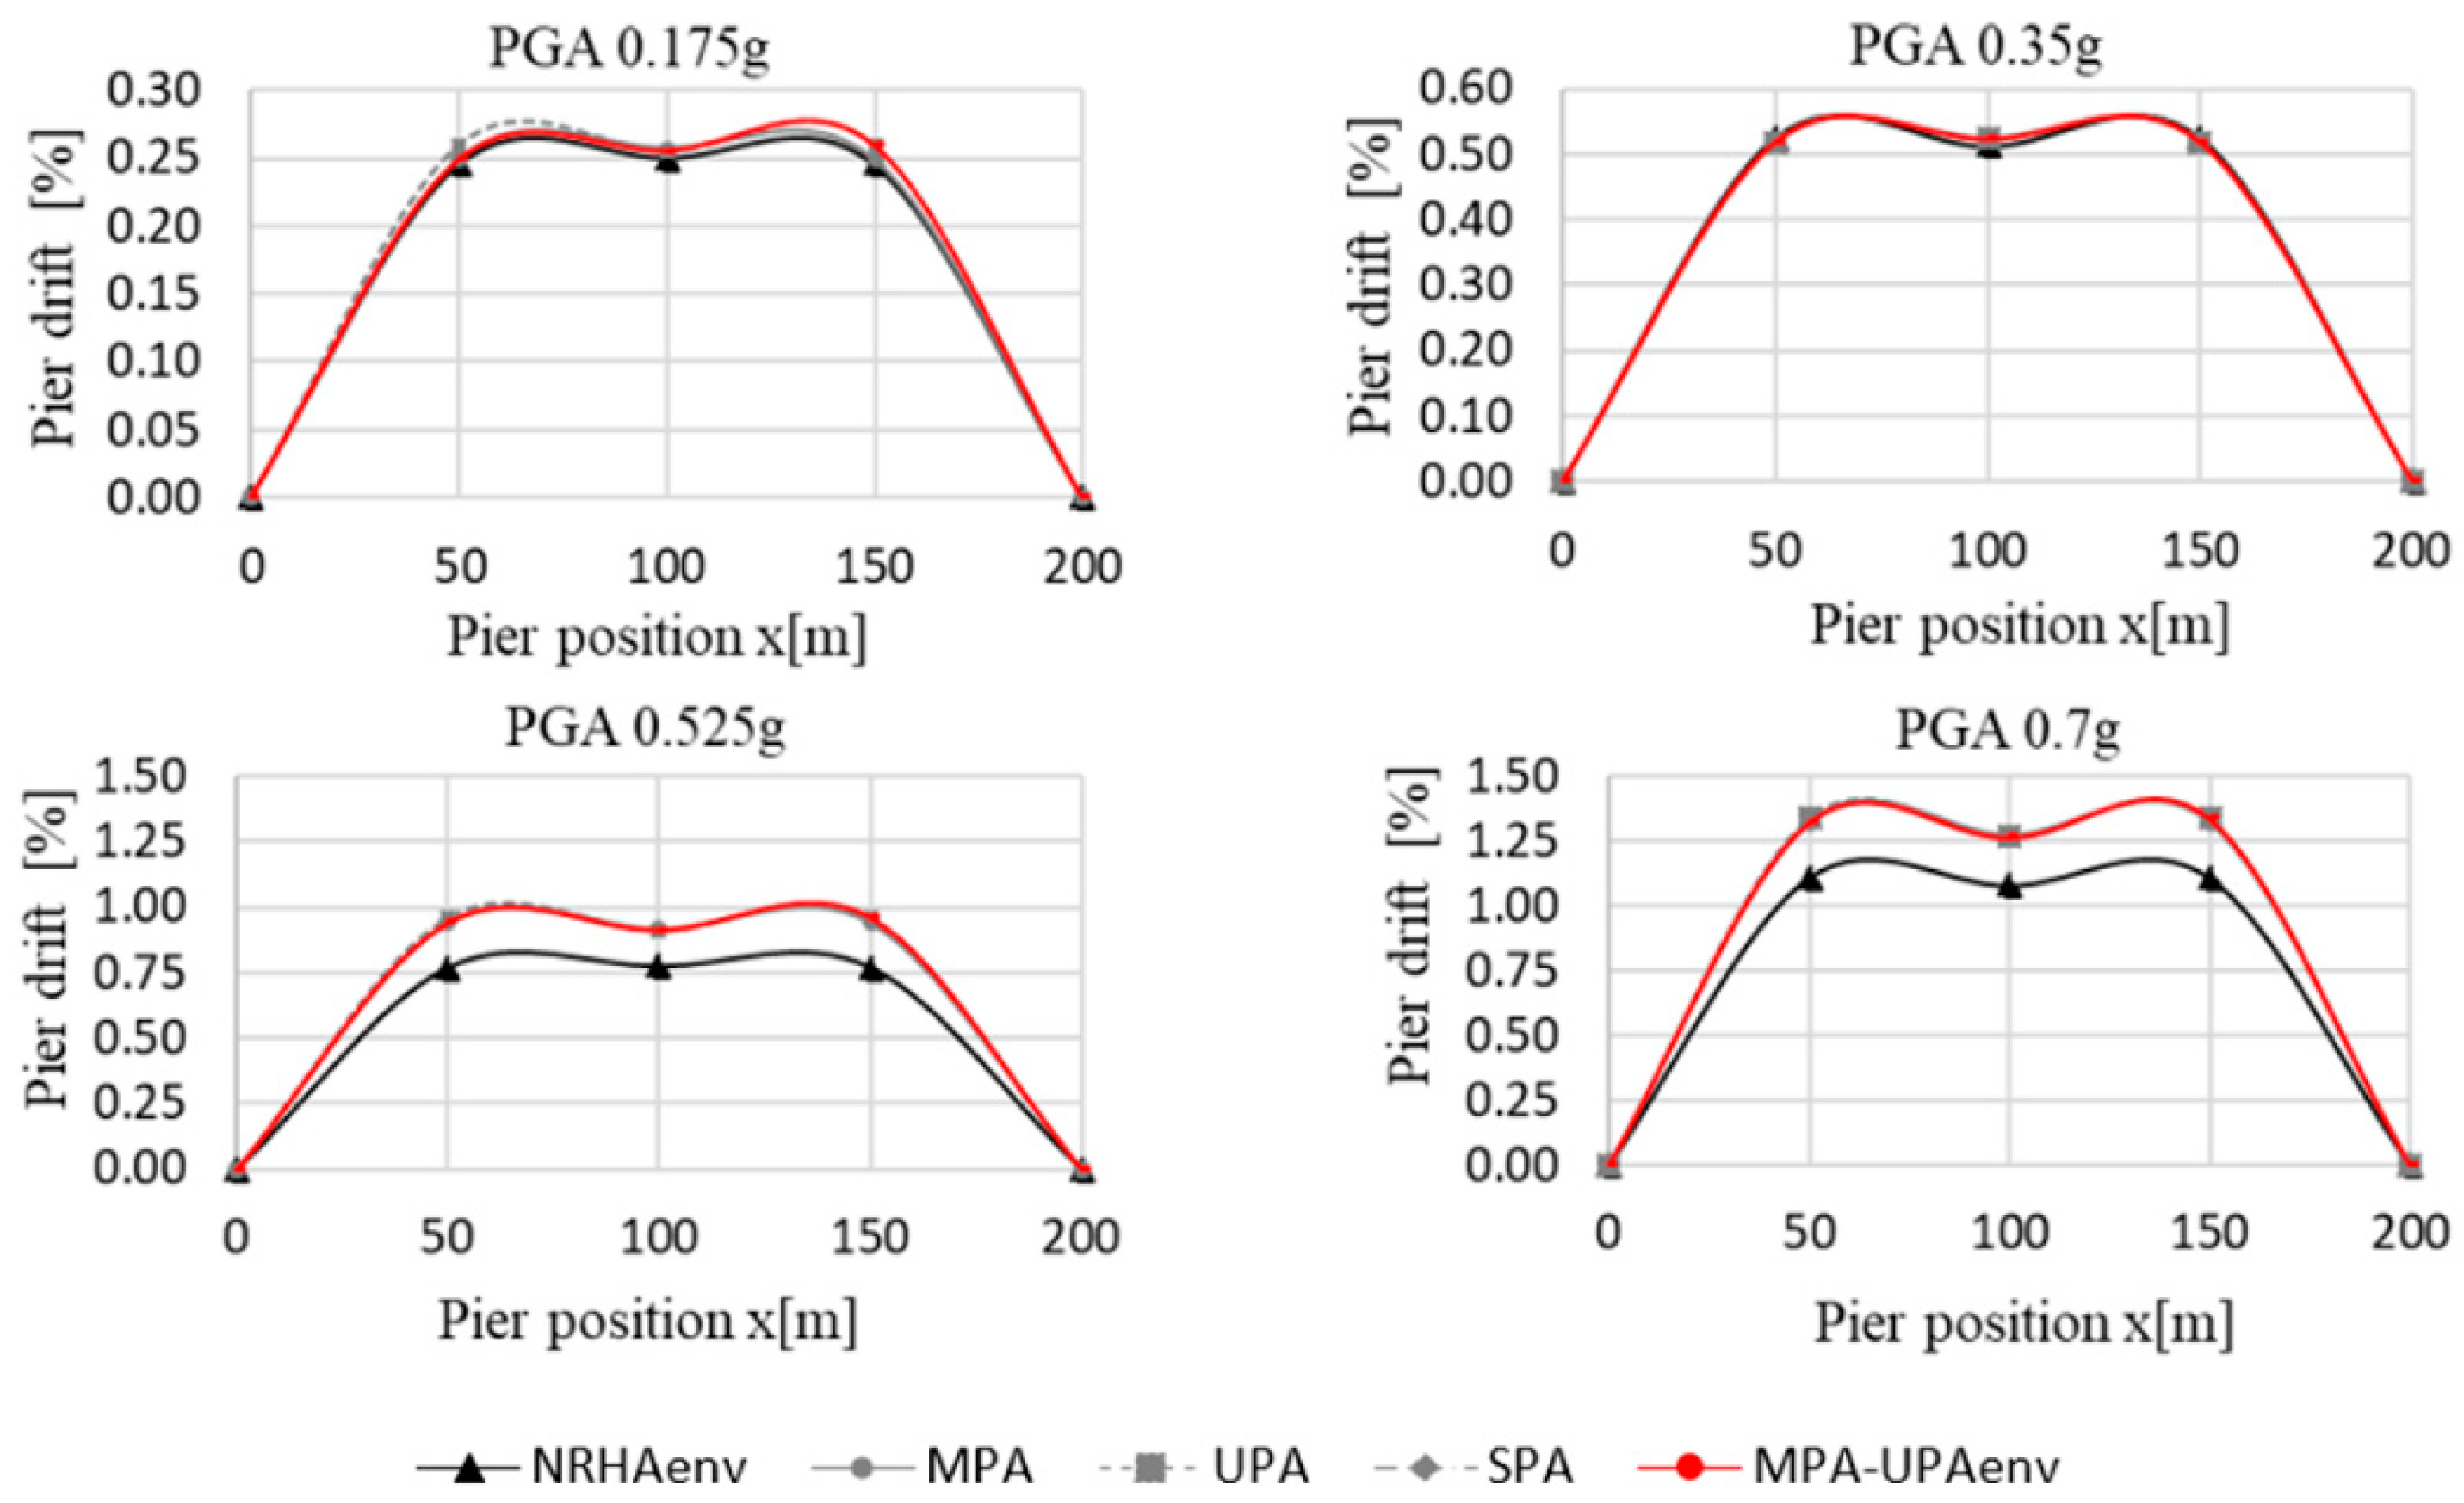
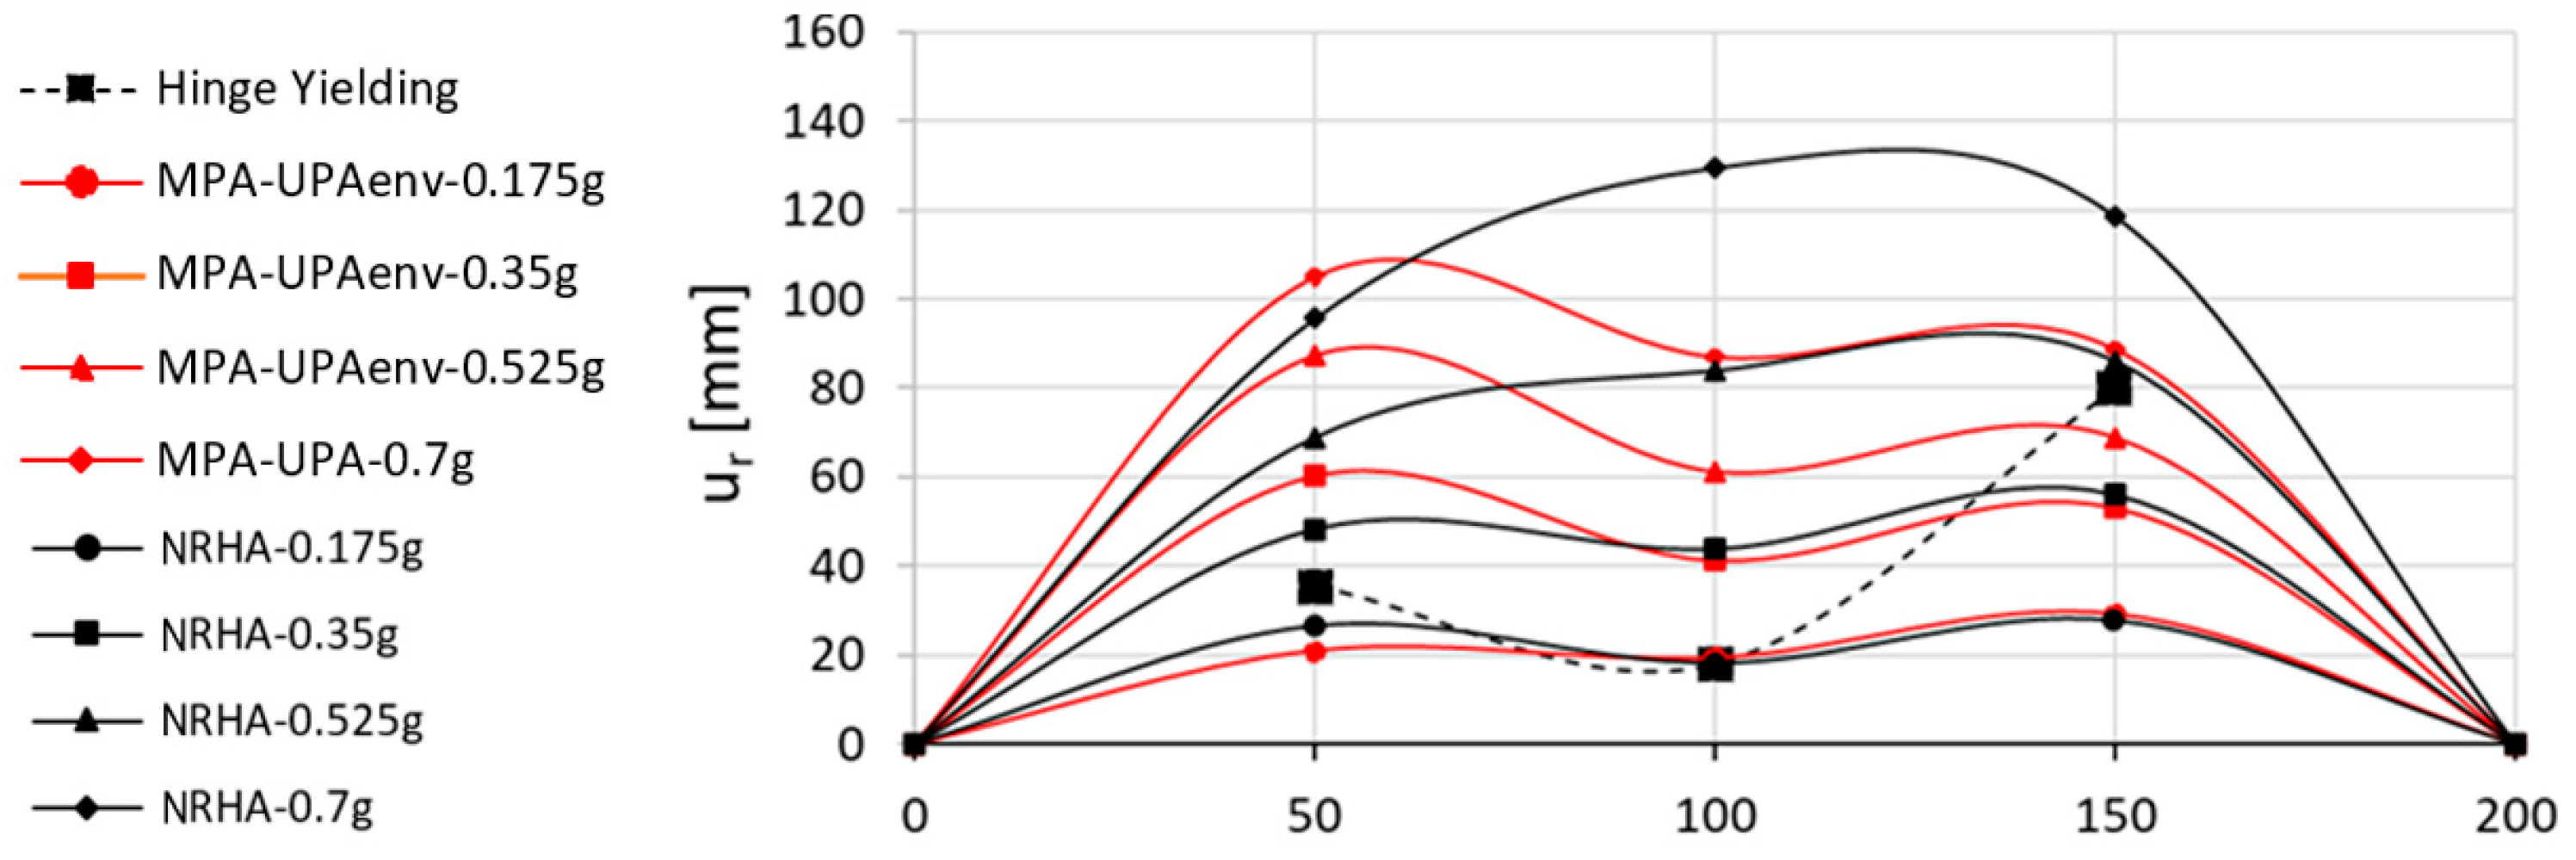
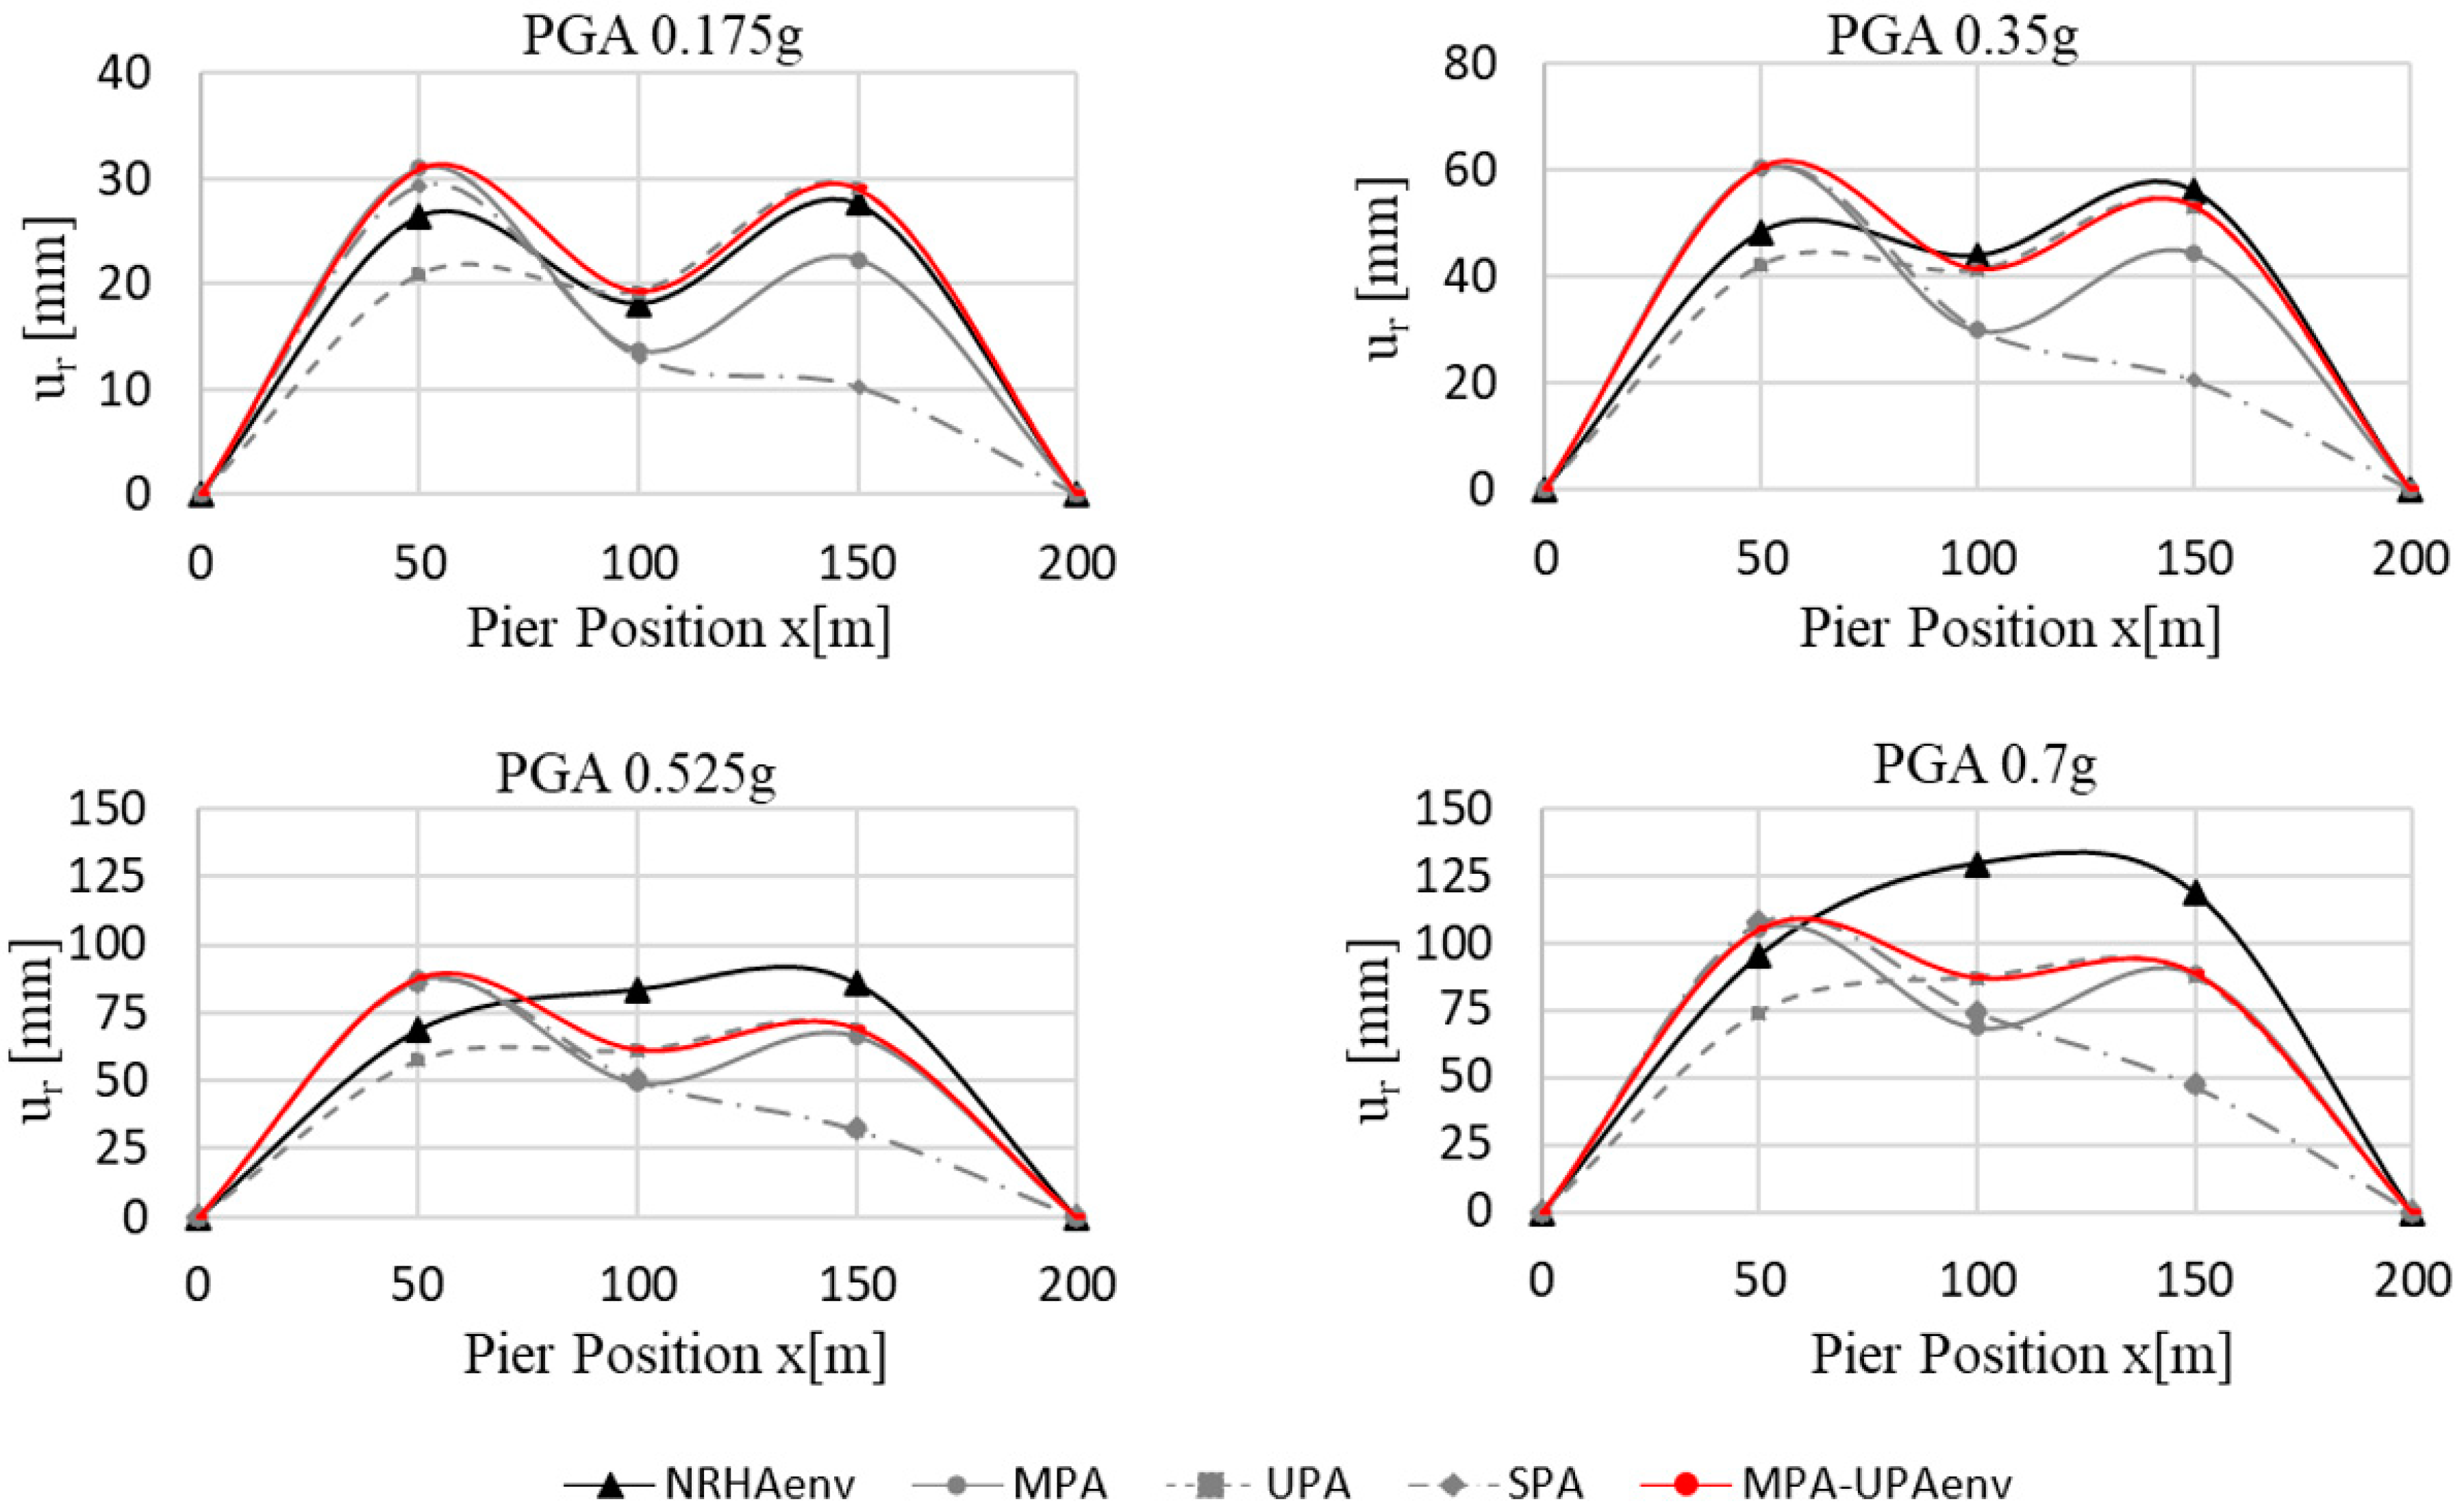
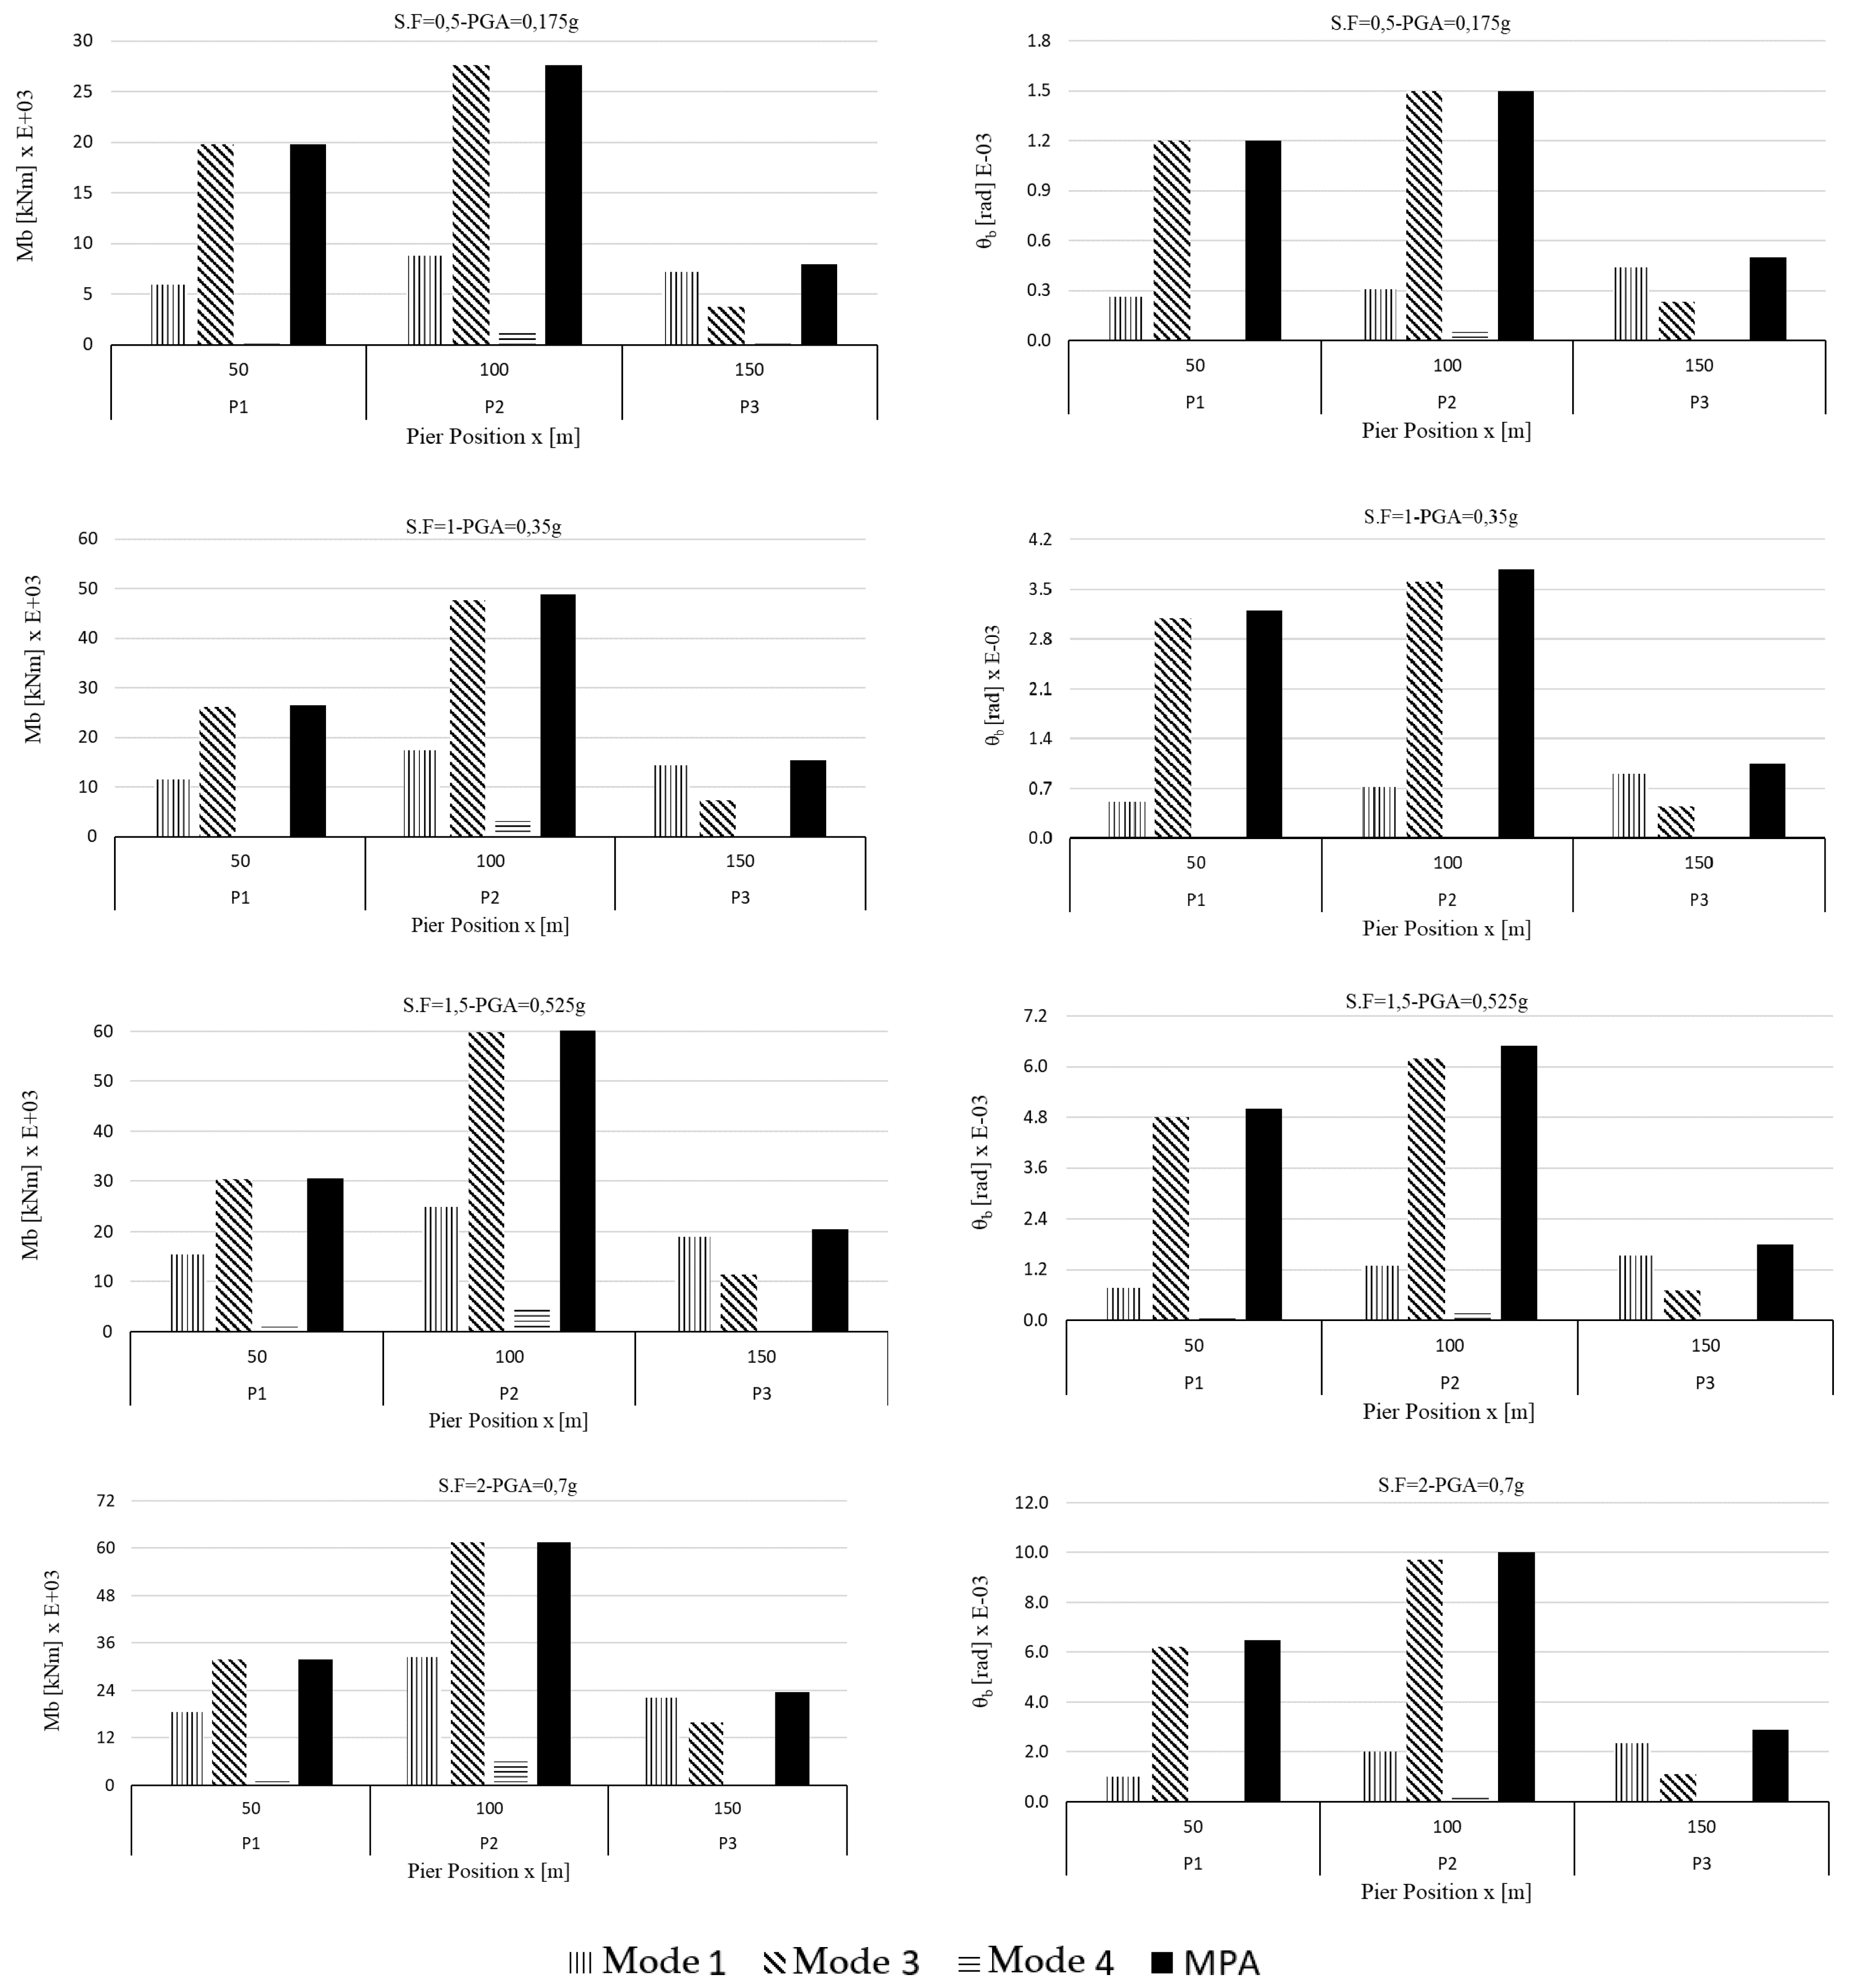
The same analysis performed on the RB were repeated for the IB. All relevant modes (Modes 1, 3 and 4) were taken into account when performing the proposed procedure (Figure 11). From Figure 19, Figure 20, Figure 21 and Figure 22, it can be observed that the results of the “standard” pushover methods (SPA and UPA) differed, even qualitatively, from the results of the NRHA, and the envelope of MPA and UPA emerged as the best approach that, for an intensity level corresponding to the design intensity (0.35 g), gave results similar to NRHA. In general, every pushover procedure considered overestimated the response at the stiffer side (Pier 1), whereas at the center (Pier 2) and at the flexible side (Pier 3), the response was underestimated. According to the results presented herein, also confirmed from the scientific literature (i.e., other applications to this type of bridge—Kappos et al. [29,30]), for bridges with asymmetric modes (Modes 1 and 4) and other relevant modes translational (Mode 3, the most relevant one), the occurrence of the first plastic hinges is crucial; in the IB, when the hinge occurred in the central column, the mode shape drastically changed, and it should be recognized that even the multimodal method cannot reflect these sudden and substantial changes of the dynamic properties of the structure.
On the other hand, the MPA worked relatively well even in the case of the design earthquake, when the hinge in the central column occurs. This, however, was not surprising, since the response was predominantly influenced by one mode dictated by the superstructure. Results are reported in the following figures considering the incremental range. All relevant modes (Modes 1, 3 and 4) were taken into account when performing each MPA. As it can be observed also from Figure 19, Figure 20, Figure 21, Figure 22 and Figure 23 (in Figure 19, for each intensity step, the curves MPA–UPAenv are compared with the NRHA results), and MPA coincided quite well with the results of NRHA up to the design intensity (from PGA 0.175 g to PGA 0.35 g), but, to achieve a better estimation, the envelope of MPA and UPA should be considered (MPA–UPAenv).
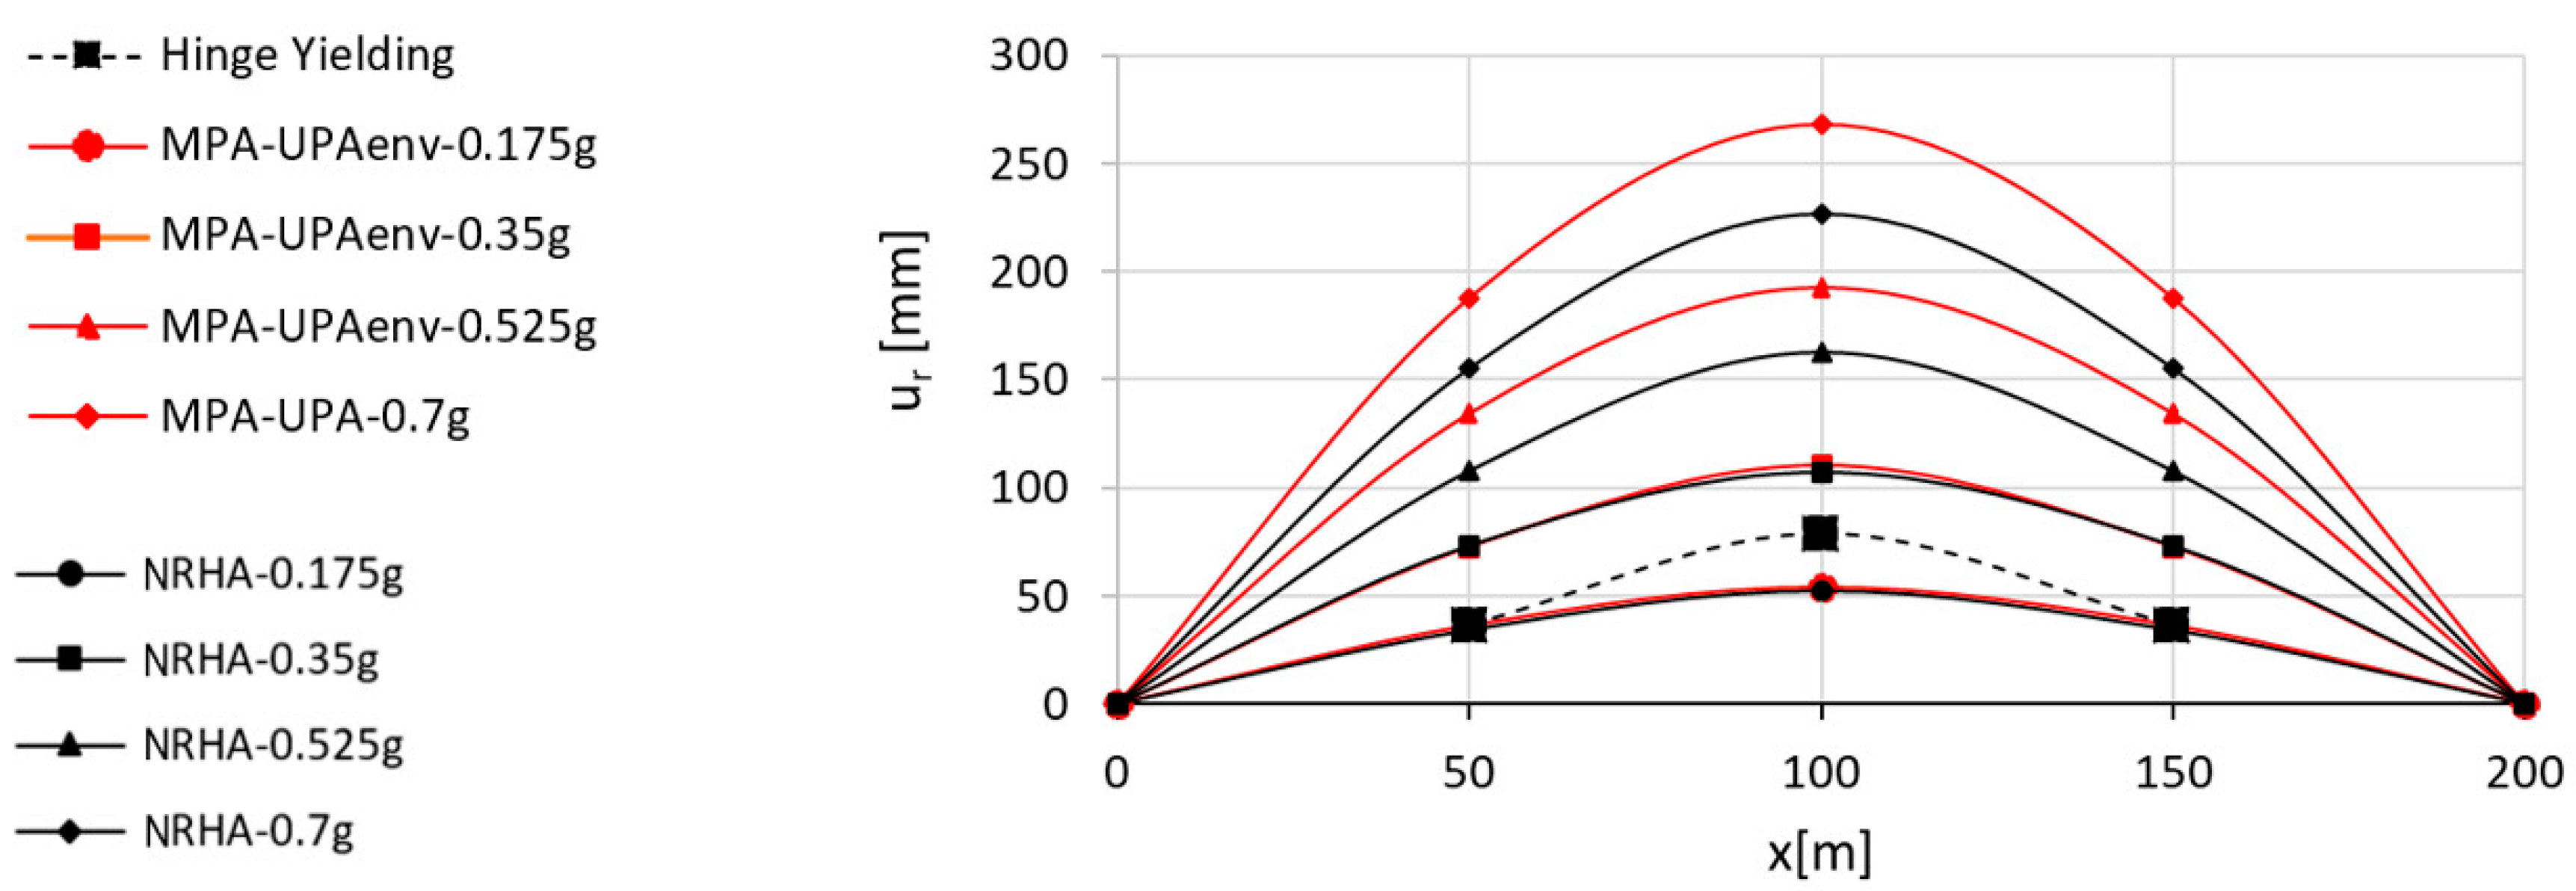
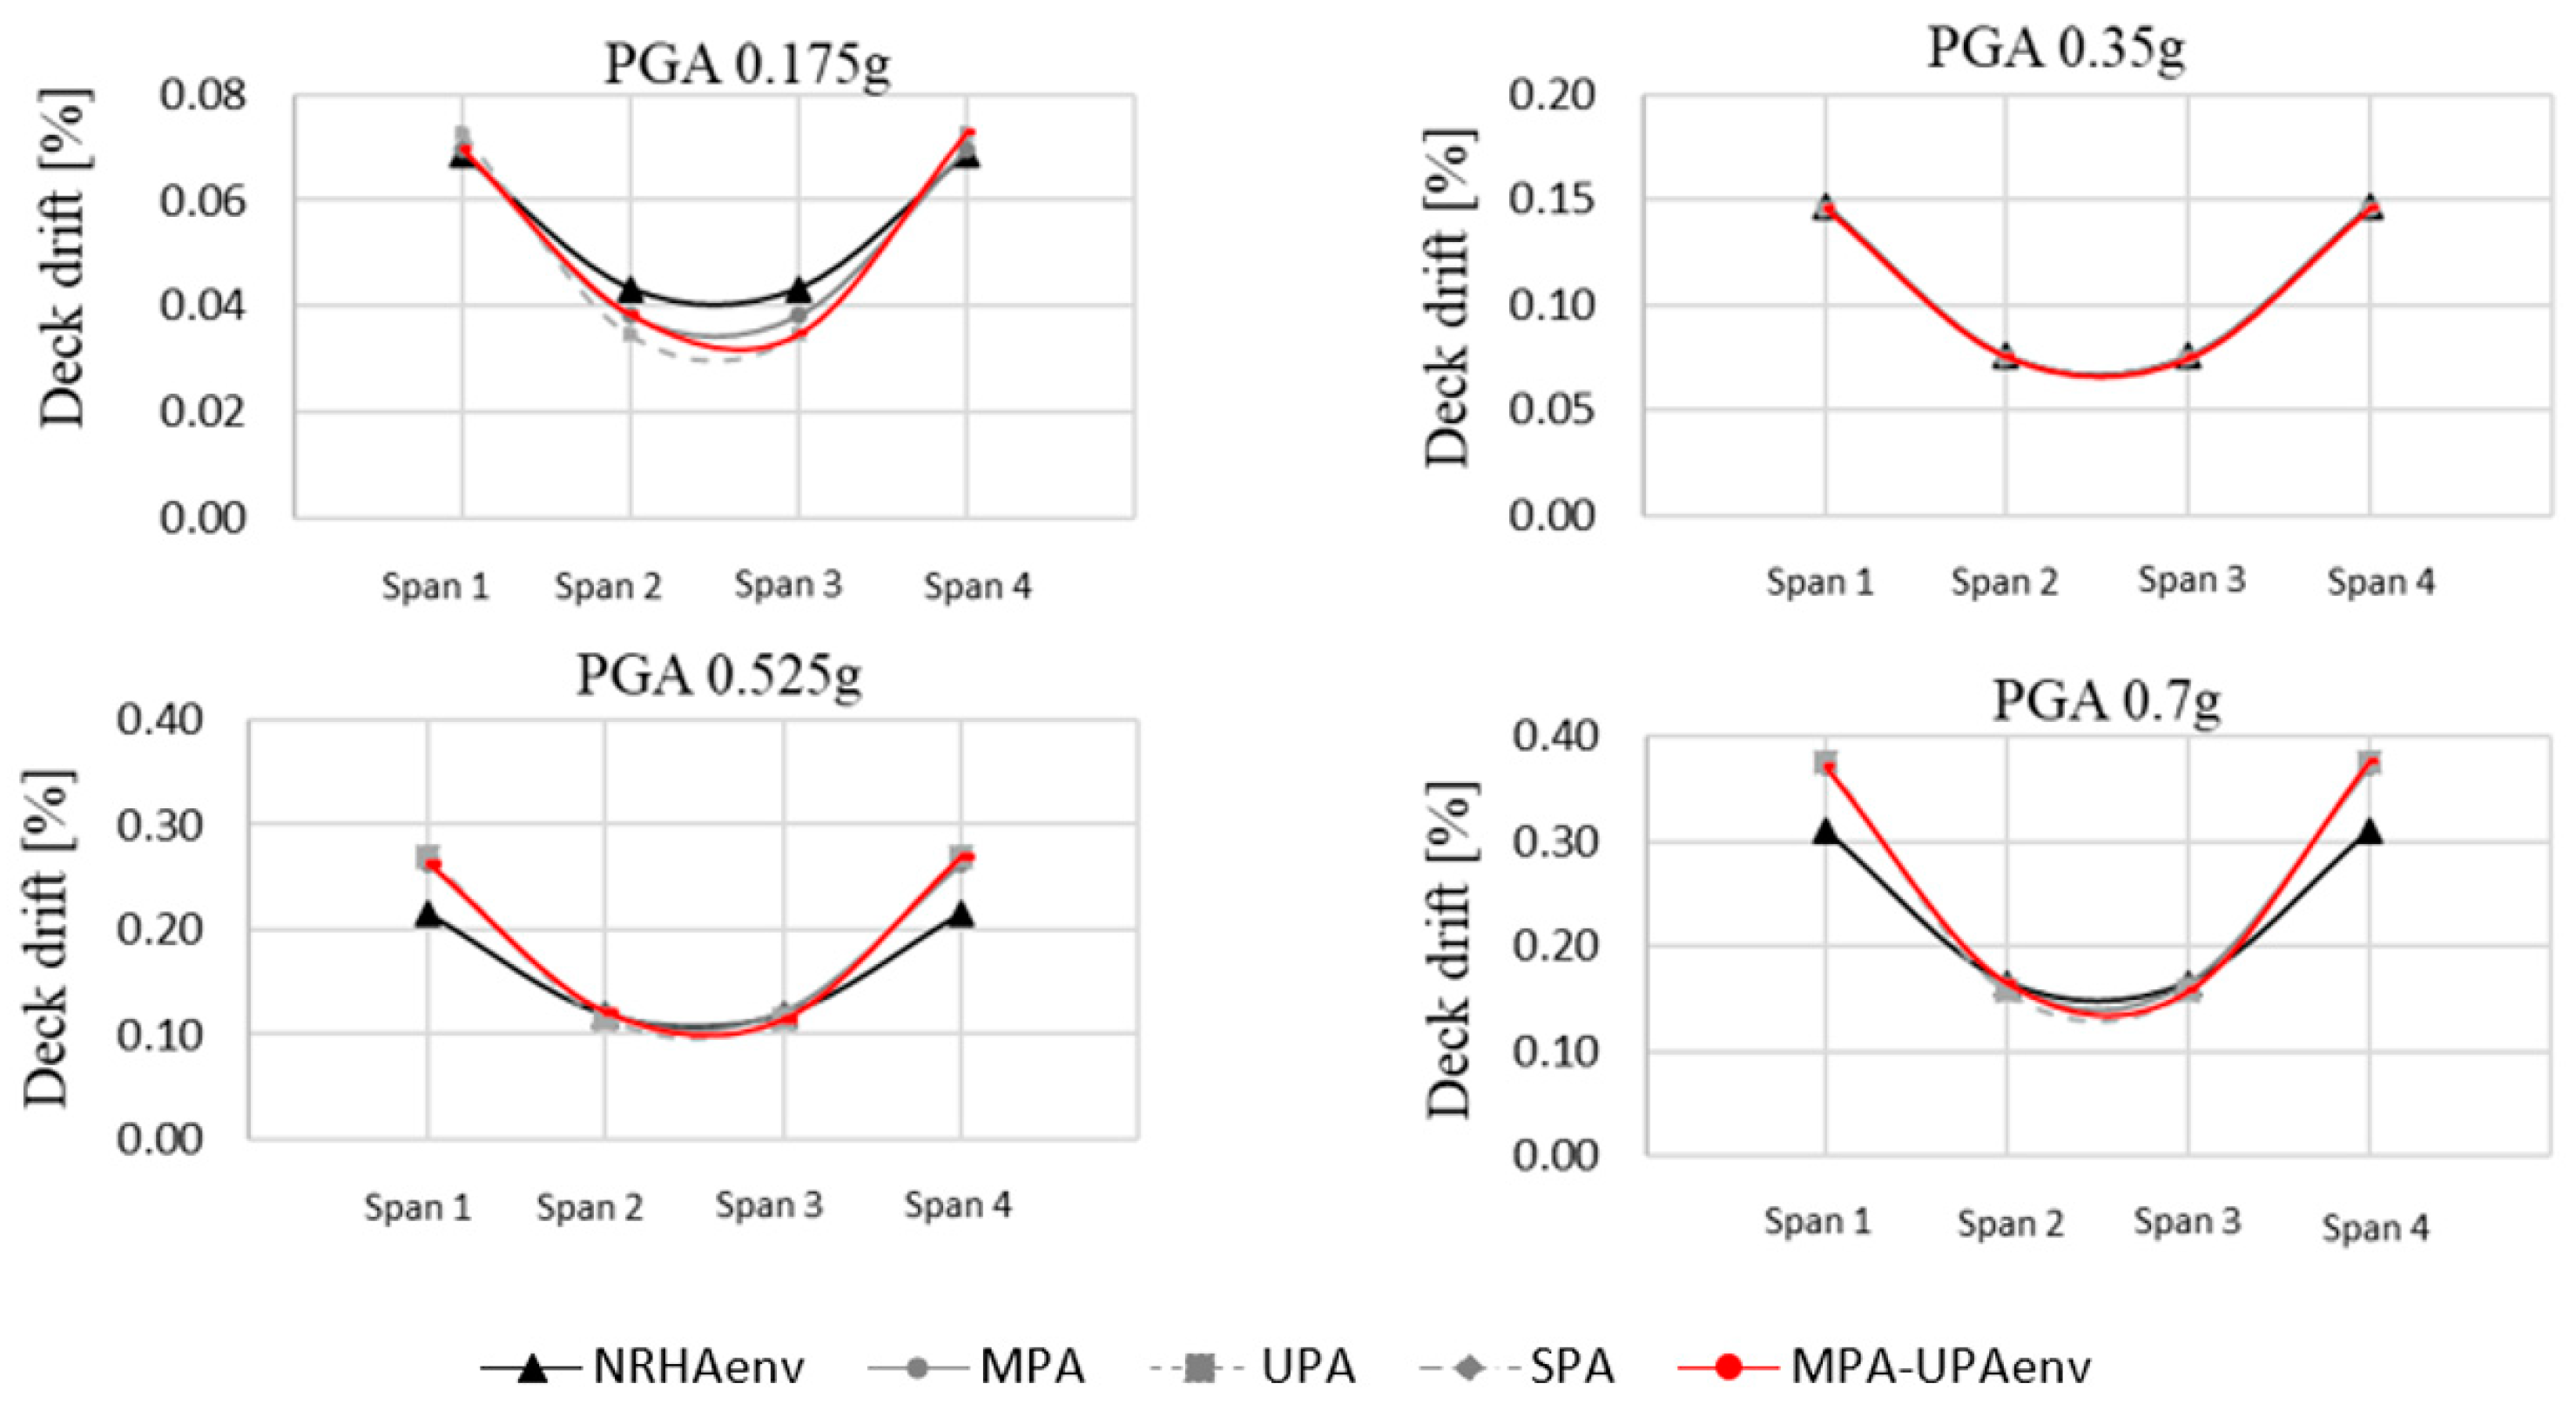
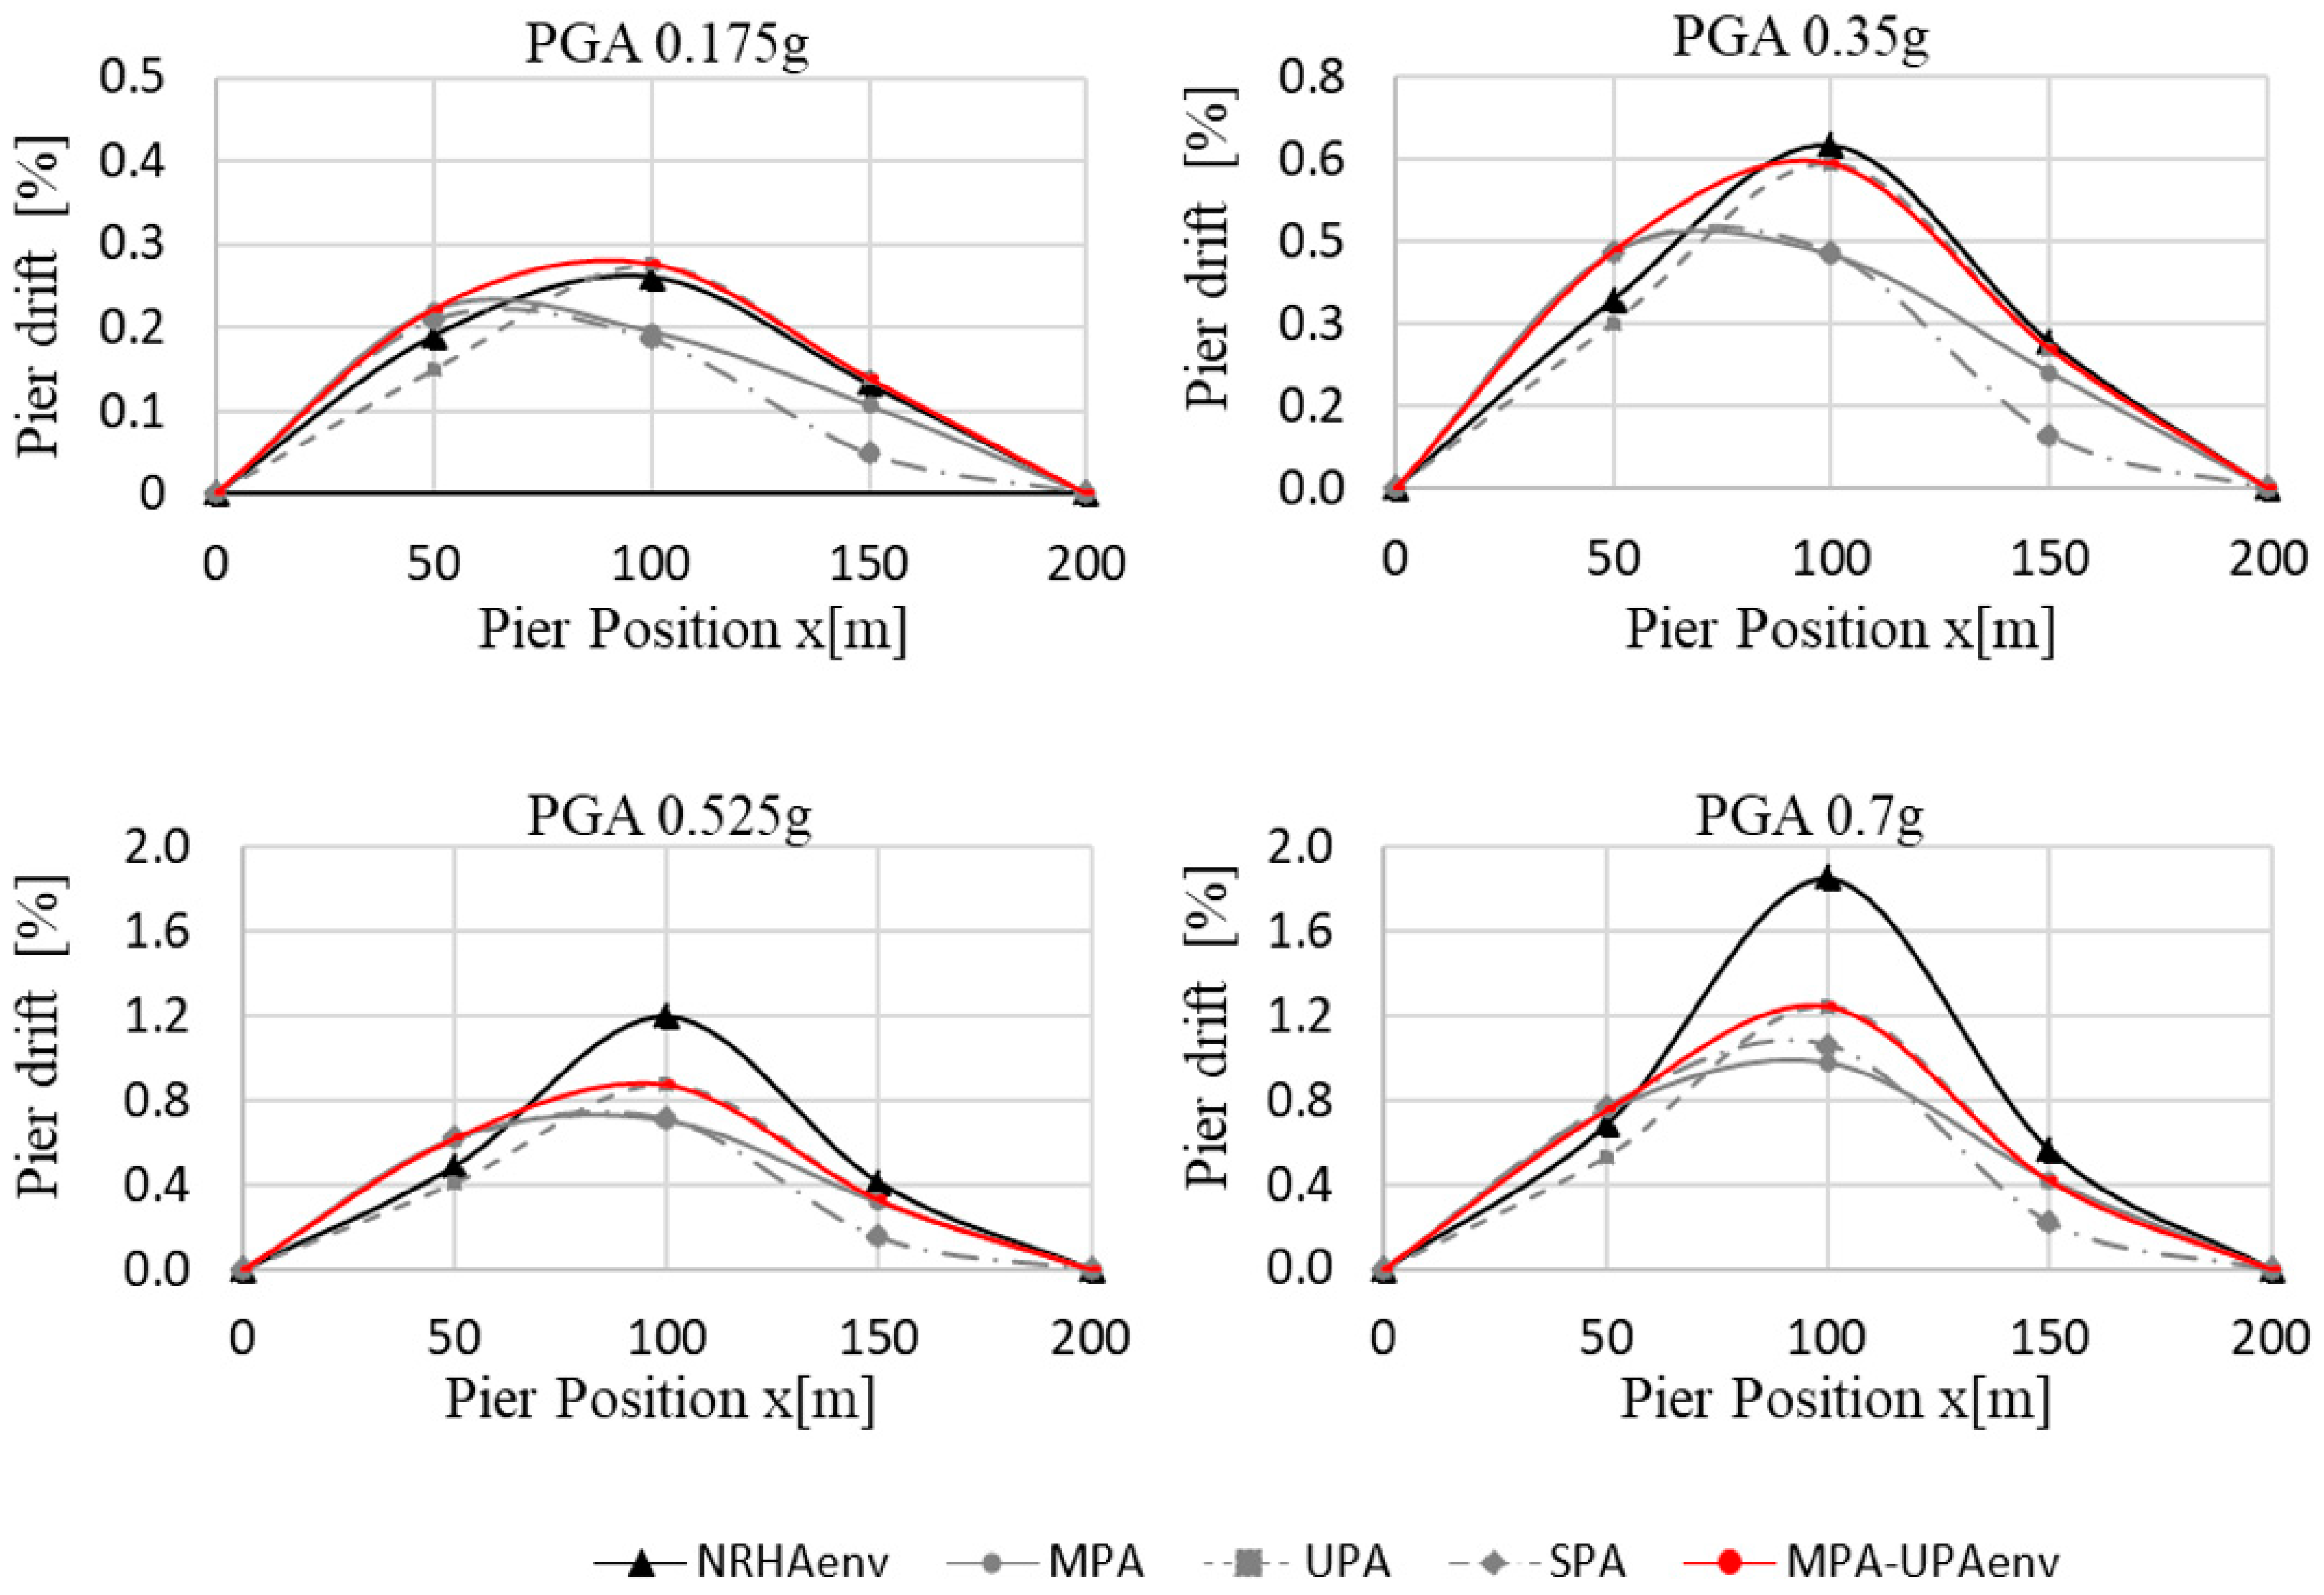
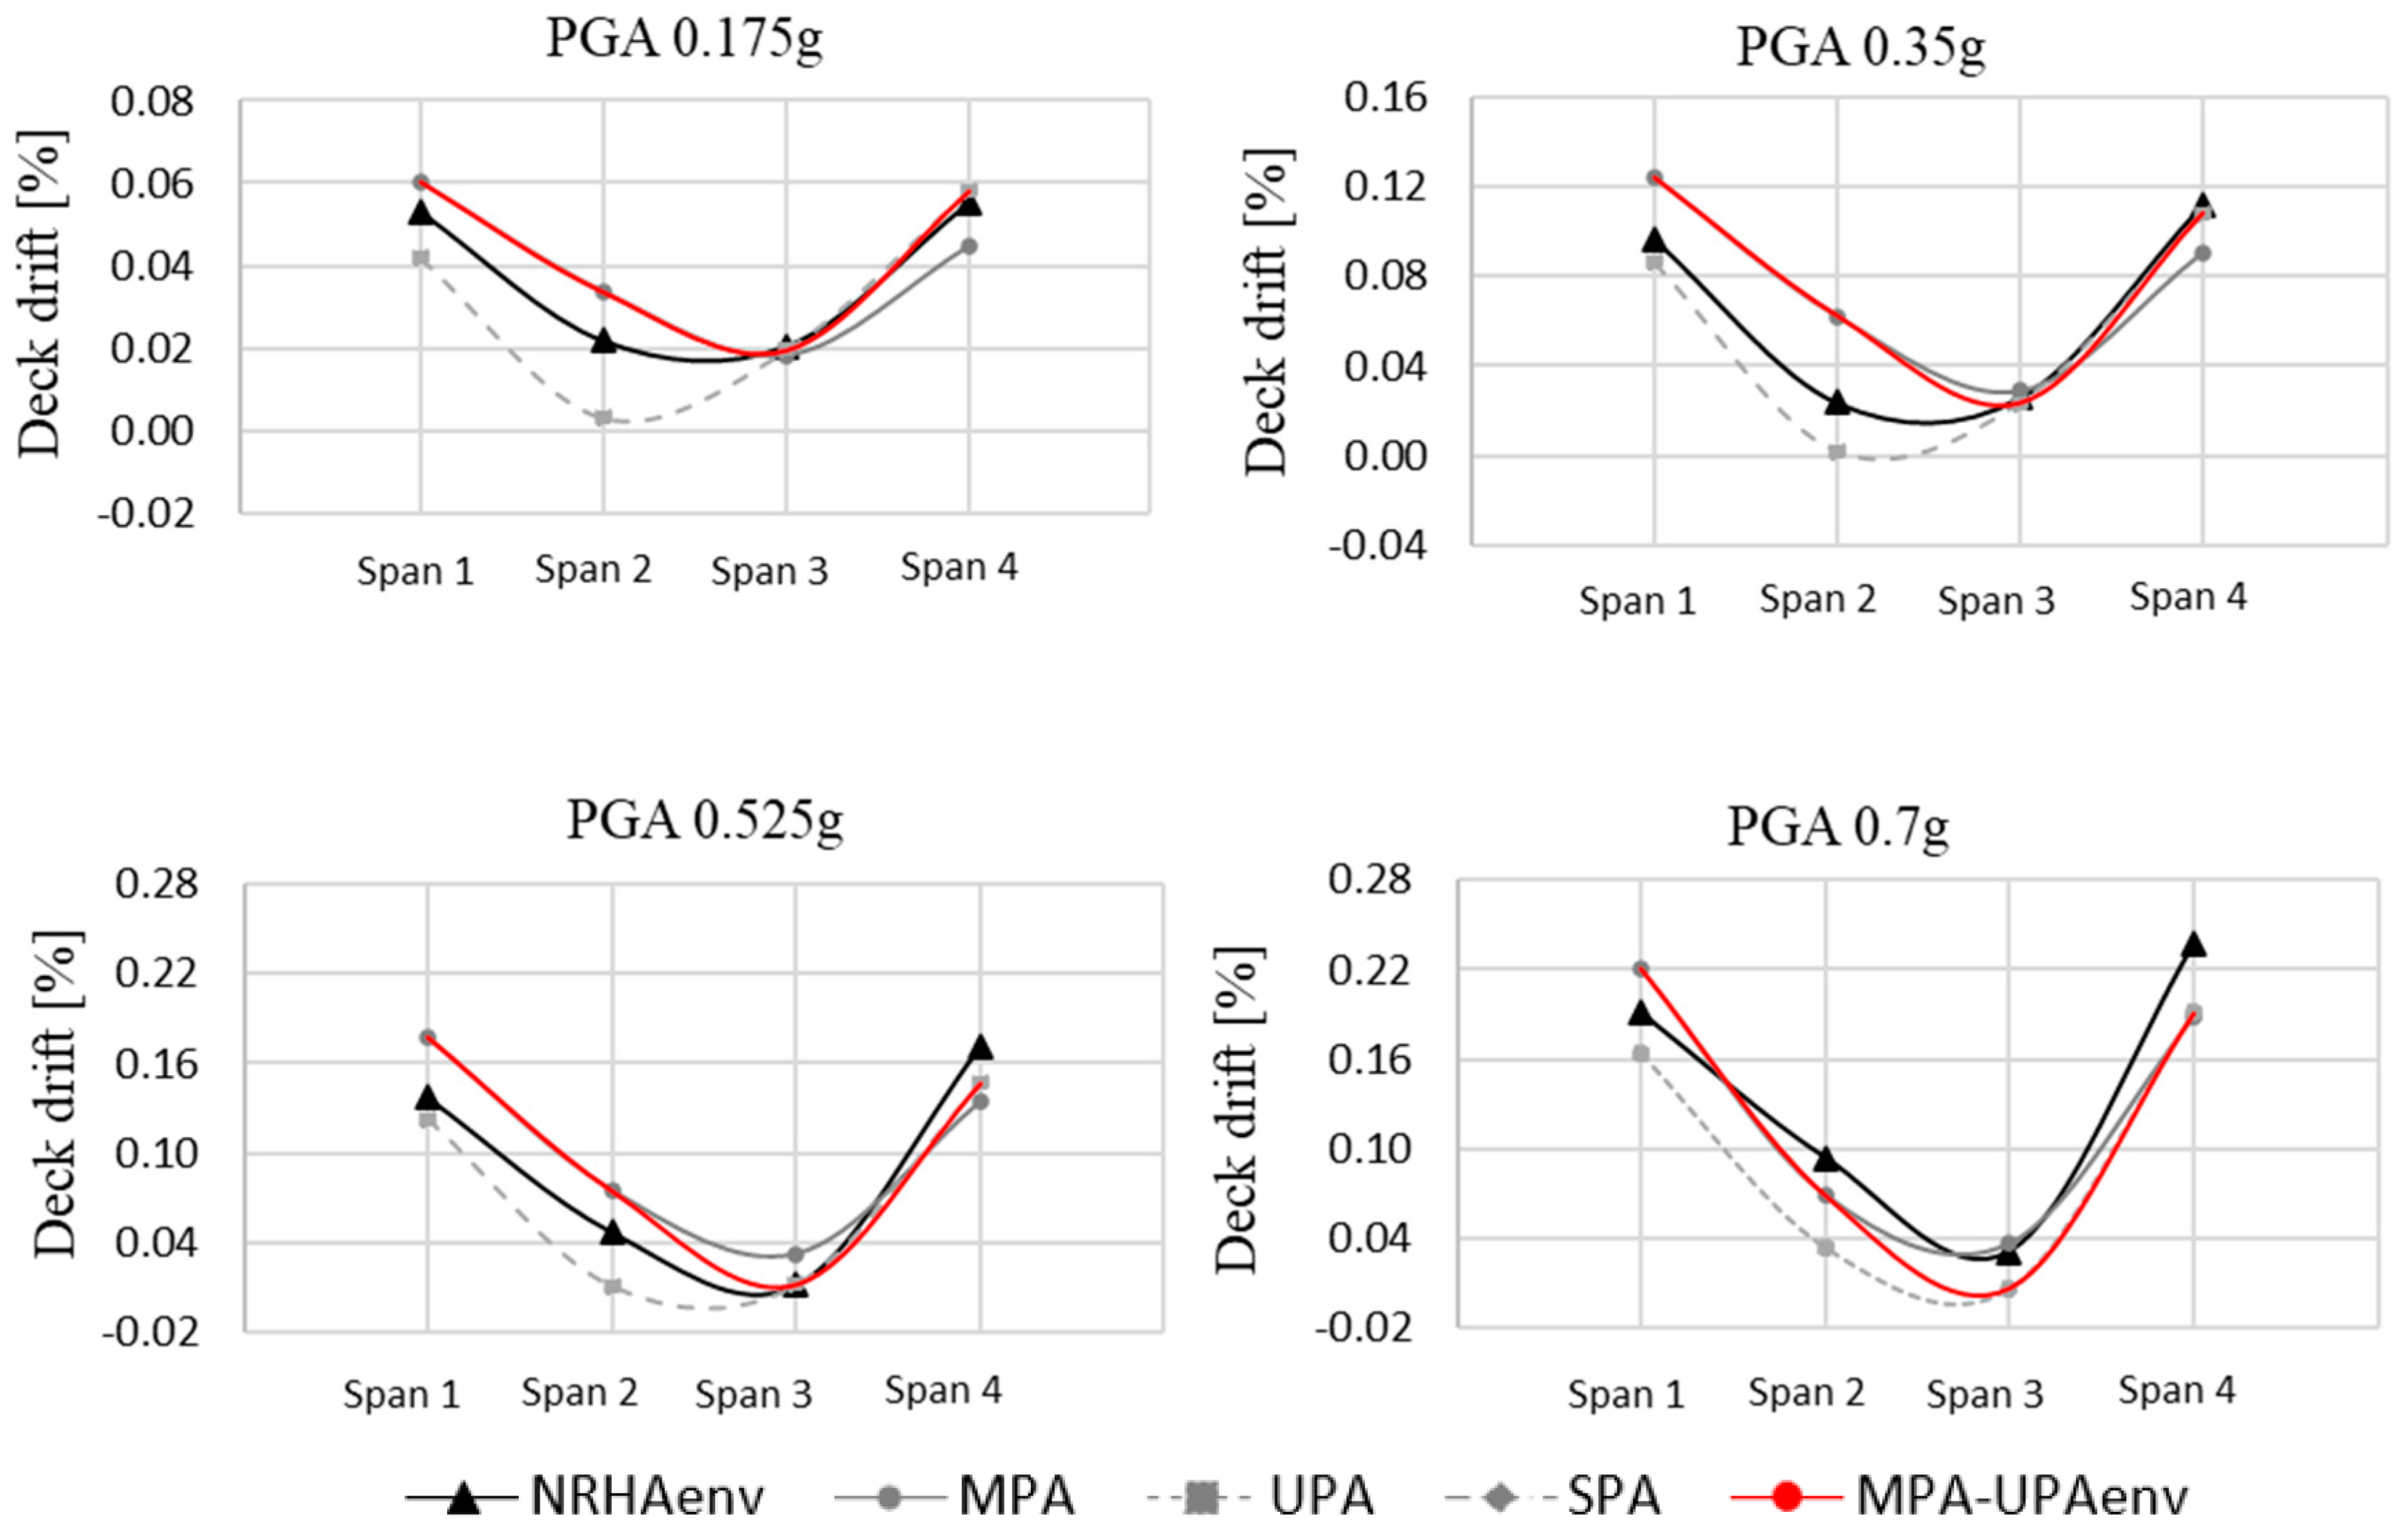
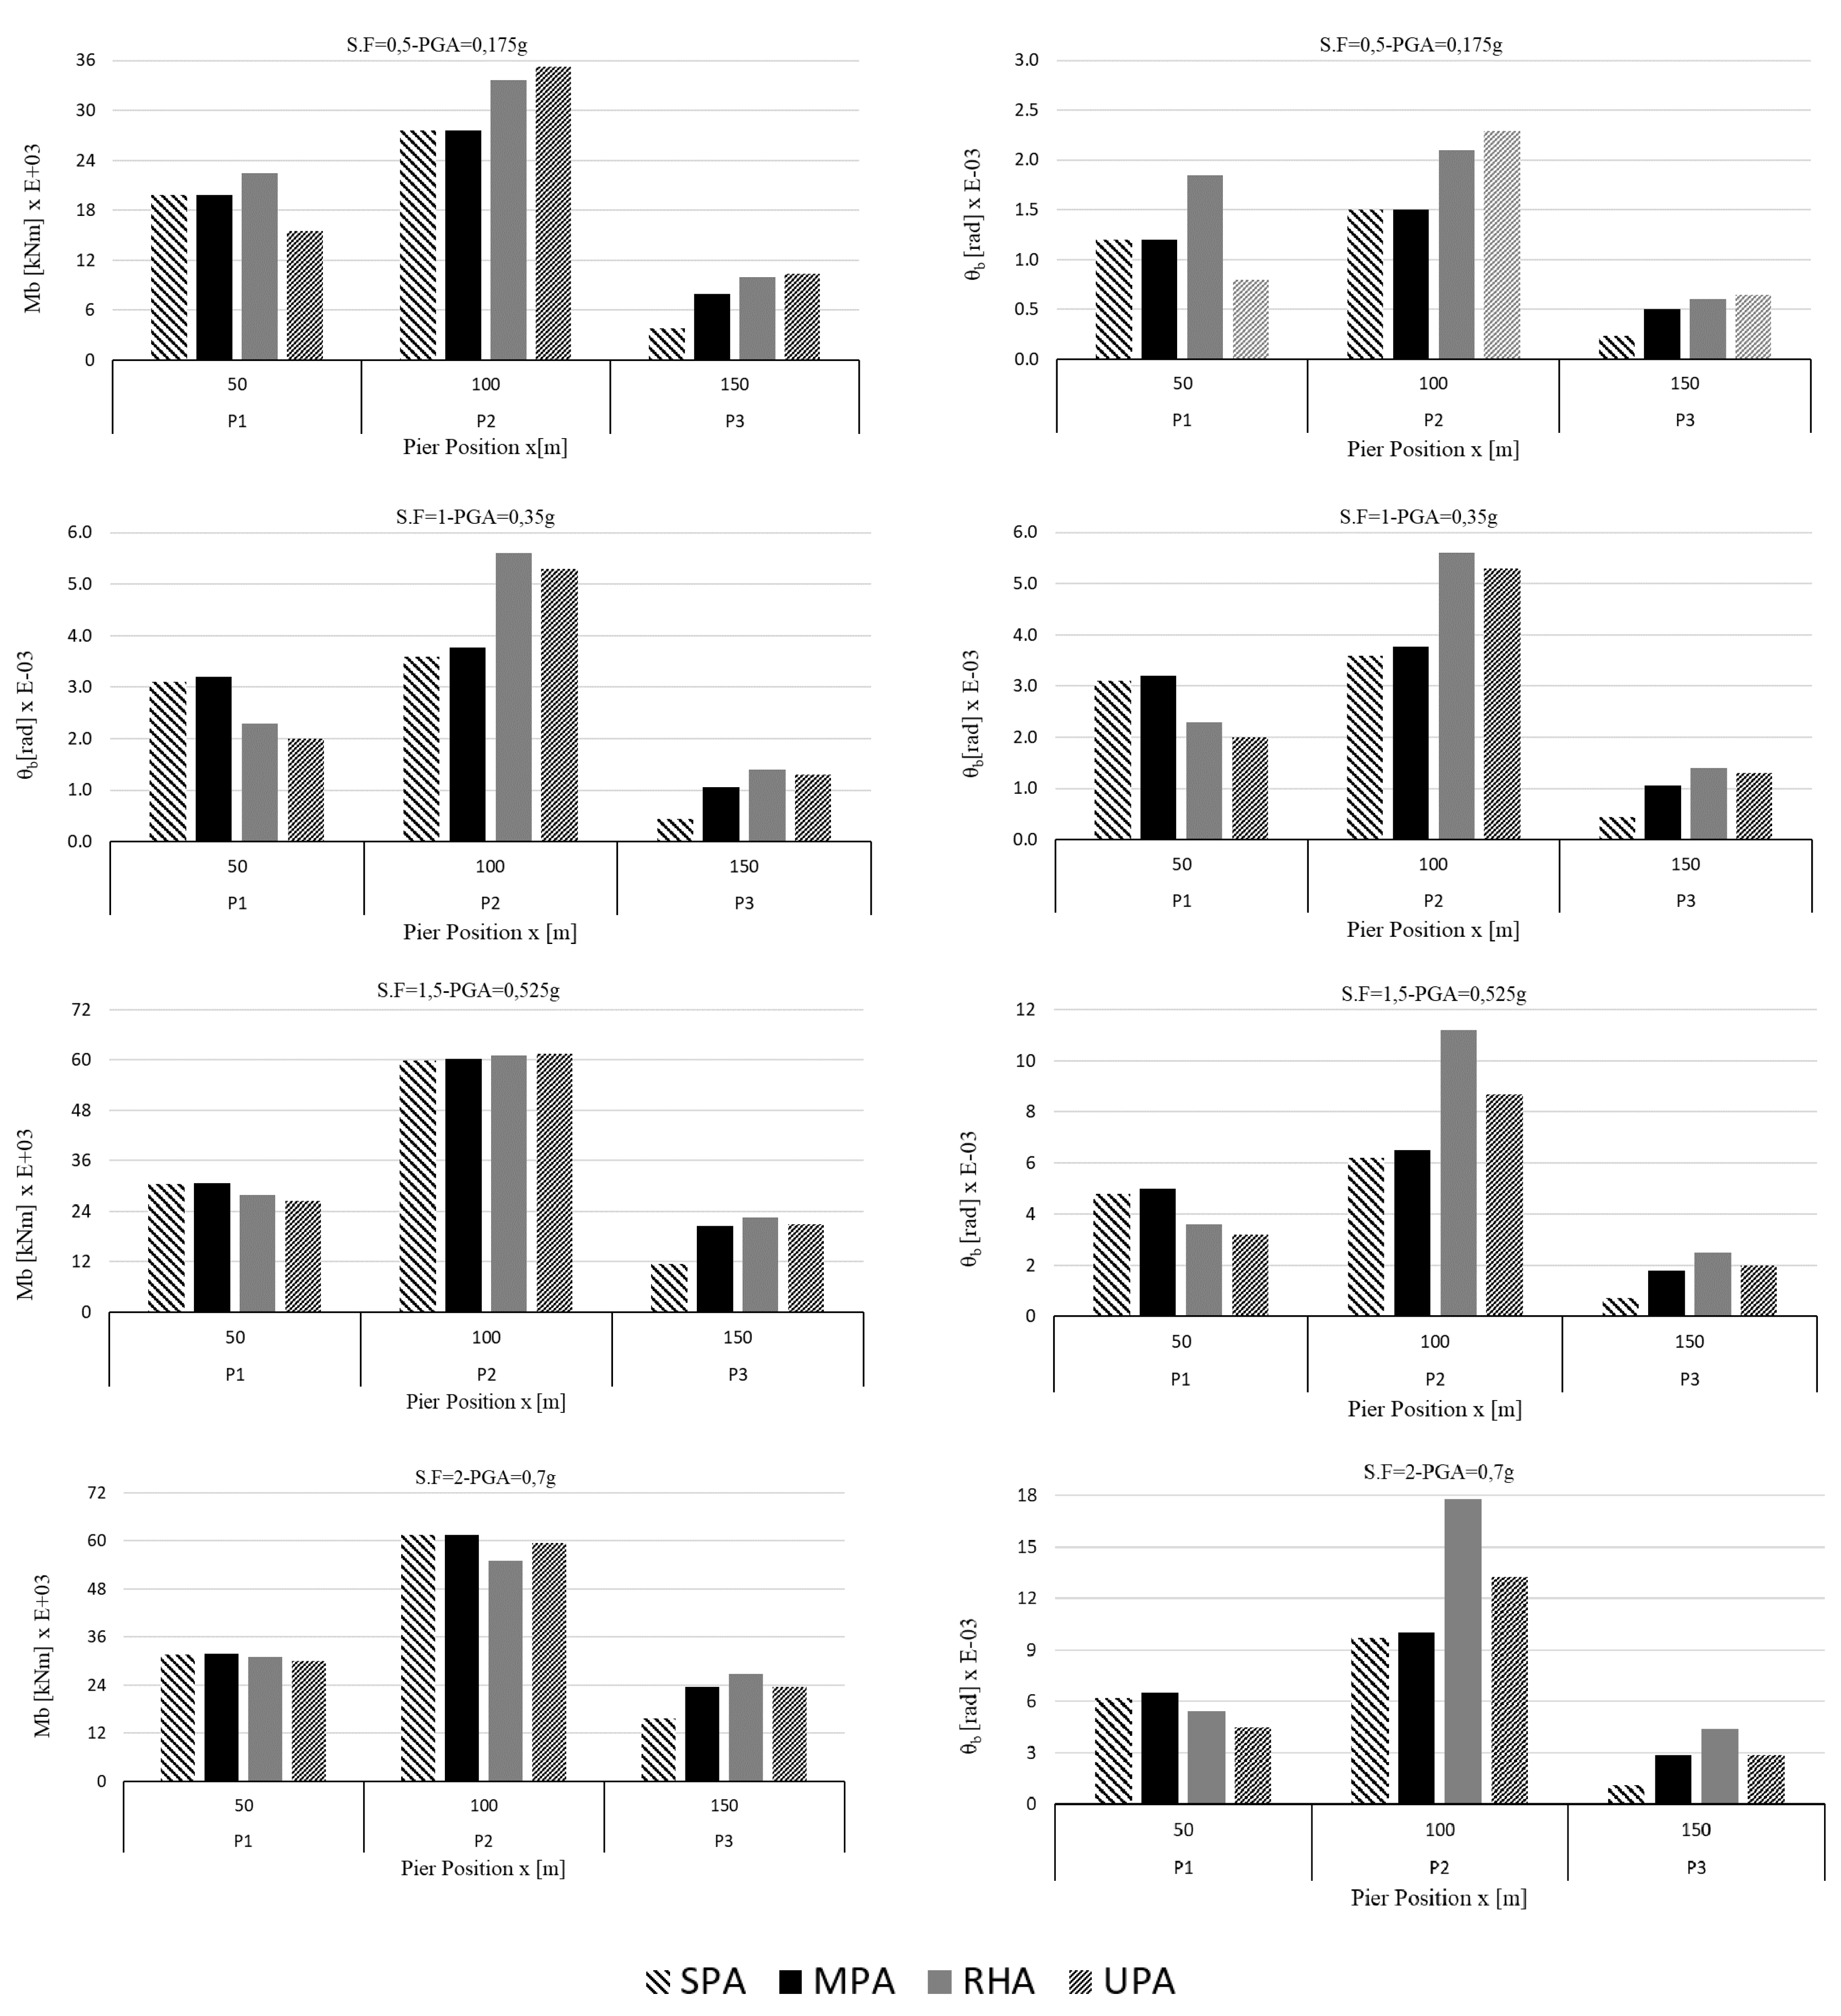
For higher intensities (scale factors 1.5 and 2.0: PGA over 0.525 g), a good estimation of displacement was observed. Figure 19 illustrates that the first plastic hinges were in Pier 2, first, and Pier 1 after (at a PGA of 0.175 g that was lower than the design intensity), whereas, in Pier 3, the first hinge emerged only at a very high intensity level (greater than PGA 0.525 g). It was observed that a limit state (ultimate limit state at the base of Pier 2) was reached for an intensity level close to PGA 0.525 g; therefore, for the scope of the procedure, investigating higher intensities was useless. In terms of hinge curvatures (Appendix A, Figure A3), results reflected the same behavior previously discussed. In terms of bending moments (Appendix A, Figure A4), the underestimation previously highlighted at Piers 2 and 3 was irrelevant, being the bridge in a plastic stage. In terms of deck drift (Figure 21 and Figure 22), for the relevant range of intensities (PGA < 0.525 g) previously indicated, the pushover procedures are all well performing, and the MPA–UPAenv results are the better solution, being the most conservative up to the design intensity and well performing for higher intensities.
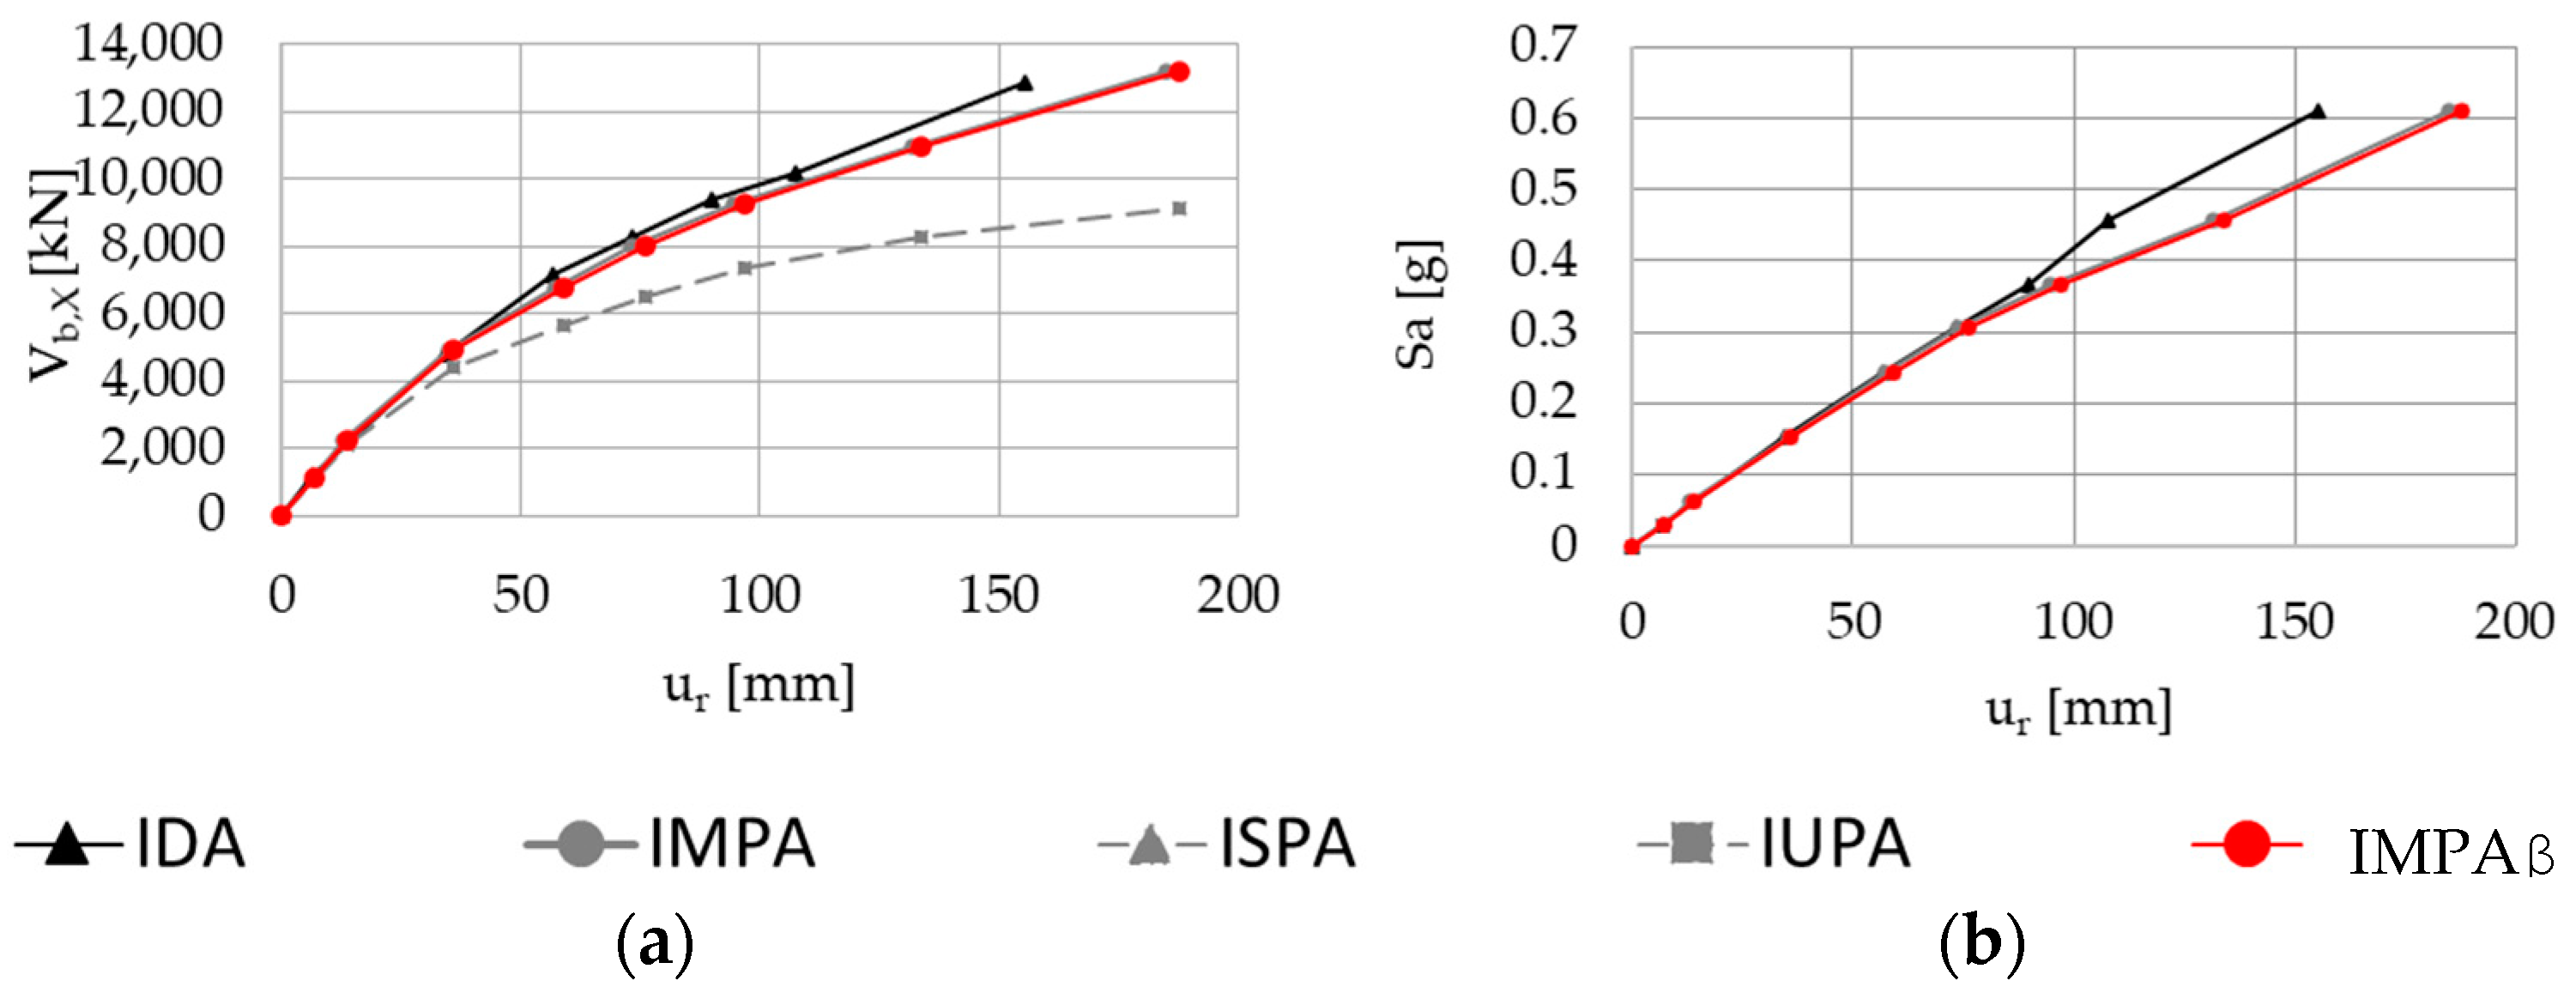
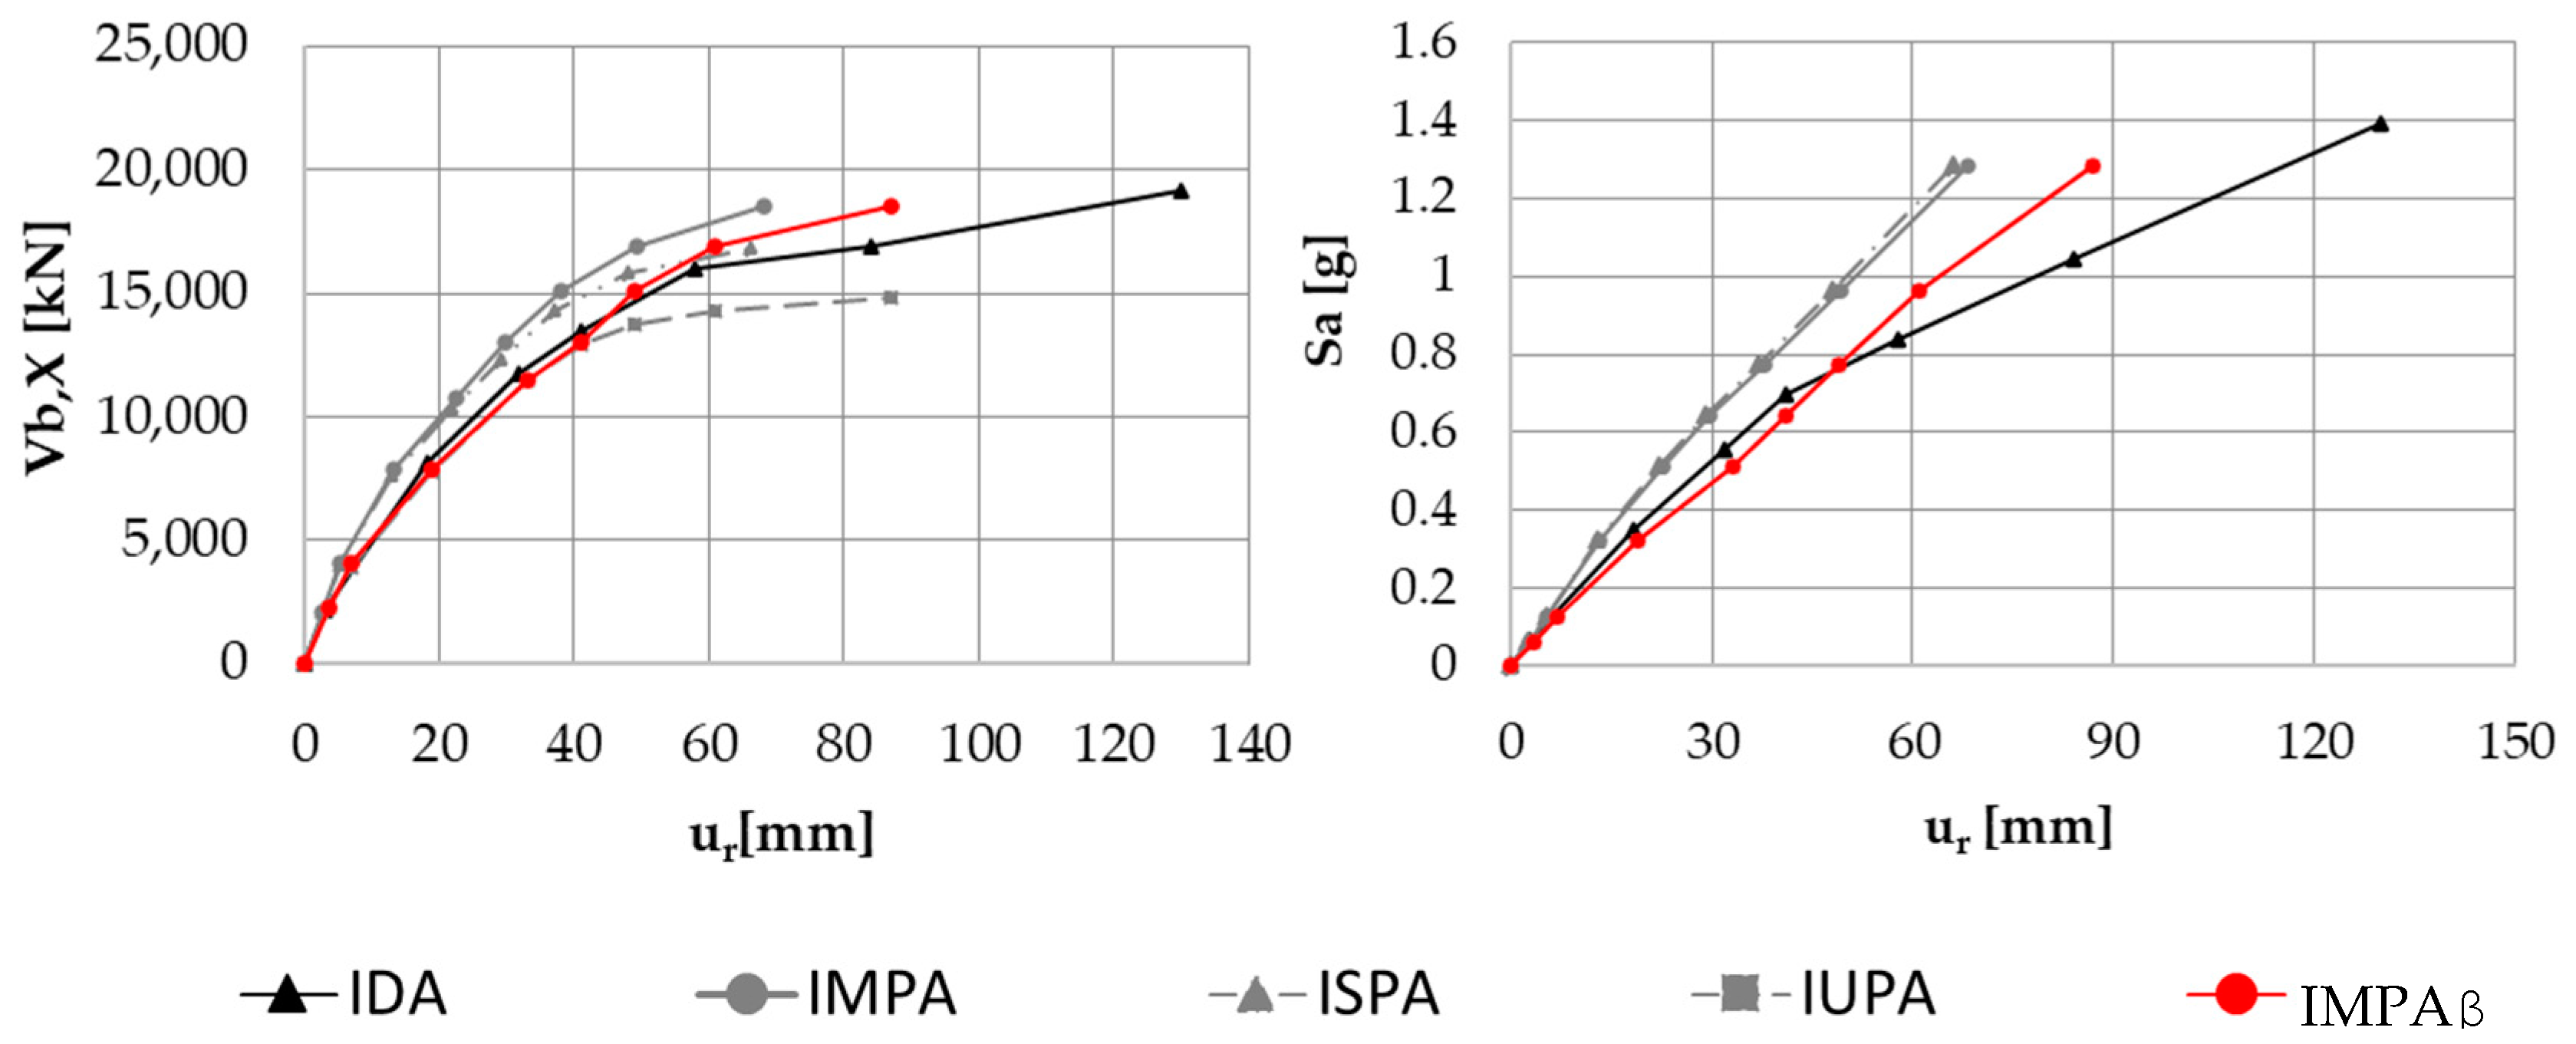
The capacity curves of the bridge (Figure 23) were determined by performing all the incremental pushover analyses tested (IMPA, ISPA, IUPA and IMPAβ) and the incremental dynamic analysis IDA. The comparison confirmed a very good accuracy for IMPAβ; the response obtained with IDA was included between IMPA and the incremental UPA (IUPA); therefore, the IMPAβ (envelope of IMPA and IUPA) is the better-performing approach (the capacity curve fits the IDA curve, or, for high intensities, results are conservative).
5. Discussion
The application of IMPAβ to the regular bridge (RB, Section 4.1) shows (see Figure 14, Figure 15, Figure 16, Figure 17 and Figure 18) that, for each intensity level, and for each monitoring point observed (top of piers P1, P2 or P3), the difference between MPA and UPA (or even SPA) is negligible, and the results are similar to the ones from NLHA up to the design intensity (see Figure 16 and Figure 17). The capacity curve obtained with IMPAβ, if compared with results from IDA (Figure 18), is suitable for the scope of investigating the structural response of a regular bridge throughout a wide range of seismic intensity.
The application to the irregular bridge (IB, Section 4.2) shows (see Figure 20, Figure 21 and Figure 22) that, unlike for the RB, the response evaluated with MPA and UPA (or even SPA) differs. In particular, observing results at the design intensity level (0.35 g), the following consideration can be drawn.
MPA overestimates the response at P1 and underestimates the response at P2 and P3, whereas UPA underestimates the response at P1, and, at P2 and P3, gives results very similar to IDA (UPA underestimate of about 3% and MPA underestimate of about 20%). Therefore, by performing IMPAβ according to the procedure described in Figure 4 and Figure 5, the response obtained is conservative or very similar to IDA.
Observing the capacity curves of Figure 23 (transversal displacement versus base shear of the piers), it is evident that, for the IB the capacity curves from UPA and MPA define a relatively narrow bound for IDA results, and the capacity curve from IMPAβ and IDA is very similar; for a very high intensity (beyond 0.6 g), IMPAβ overestimates the response.
6. Conclusions and Future Developments
An incremental modal pushover analysis for bridges (IMPAβ), which takes into account the effects of higher modes was proposed and applied to two case studies, a regular and an irregular bridge.
The procedure required us to apply to the bridge two load patterns for pushover, multimodal (MPA) and uniform (UPA), to obtain the response according to an envelope of base shear and displacements. Being an incremental analysis, the performance points are evaluated at different seismic intensities.
According to the presented results, the following conclusions can be drawn:
- The procedure keeps the simplicity and low computational effort typical of a standard pushover analysis. In fact, IMPAβ implies the execution of one nonlinear static analysis for each loading pattern, while performing IDA, several nonlinear response history analyses have to be performed, i.e., one for each of the seven ground motions, and it has to be repeated for every intensity level considered.
- If the capacity curve is obtained by using a multimodal load pattern only, it well matches the IDA curve, for both the regular and irregular bridge, up to the seismic design intensity only, while the present proposal allows us to analyze even higher intensities.
- IMPAβ produces a capacity curve very similar to what derived with IDA also beyond the seismic design intensity (0.35 g), and, for very high seismic intensities (beyond 0.6 g), the capacity curve of IMPAβ is conservative.
In order to validate the generalization of IMPAβ for bridges, statistical analyses of results based on responses obtained by using the single response spectra of the accelerograms used for IDA, the effects of the variation of the seismic input with intensity, the asynchronous seismic motion [42,43], near fault seismic input and all the different bridge configurations (i.e., deck shape and sections, constraints, bridge piers and bridge length) are in progress.
Author Contributions
Conceptualization, A.V.B. and C.N.; methodology, A.V.B., C.N. and D.L.; resources, A.V.B, C.N. and B.B., software analysis, A.V.B.; writing—original draft preparation, A.V.B.; writing—review and editing, A.V.B., G.F., C.N. and B.B. All authors have contributed substantially to the work reported. All authors have read and agreed to the published version of the manuscript.
Funding
The authors gratefully acknowledge the funding received by The Laboratories University Network of Seismic Engineering (ReLUIS): research project ReLUIS/DPC 2019–2021 Reinforced Concrete Existing Structures and the National Natural Science Foundation of China (grant no. 51778148).
Conflicts of Interest
The authors declare no conflict of interest.
Abbreviations
| C.S.M. | capacity spectrum method |
| GM | ground motion |
| IDA | incremental dynamic analysis |
| IMPA | incremental modal pushover analysis |
| IMPAβ | incremental modal pushover analysis for bridges |
| ISPA | incremental standard pushover |
| IUPA | incremental uniform pushover analysis |
| NSA | nonlinear static analysis |
| NRHA | nonlinear response history analysis |
| M.P. | monitoring point |
| MPA | modal pushover analysis |
| P.P. | performance point |
| RS | response spectrum |
| RSm | mean response spectrum |
| SPA | standard pushover analysis—loading pattern proportional to 1st modal shape |
| UPA | uniform pushover analysis—loading pattern proportional to masses |
| ur | monitored displacement |
| Vb | base shear |
Appendix A
Figure A1.
Regular bridge—bending moment (Mb) and curvatures (qb) at the hinge location, derived by performing nonlinear dynamic analysis and modal pushover according to each single mode (PGA from 0.175 to 0.7 g).
Figure A1.
Regular bridge—bending moment (Mb) and curvatures (qb) at the hinge location, derived by performing nonlinear dynamic analysis and modal pushover according to each single mode (PGA from 0.175 to 0.7 g).


Figure A2.
Regular bridge—bending moment (Mb) and curvatures (qb) at the hinge location, derived by performing nonlinear dynamic analysis and pushover analysis (PGA from 0.175 to 0.7 g).
Figure A2.
Regular bridge—bending moment (Mb) and curvatures (qb) at the hinge location, derived by performing nonlinear dynamic analysis and pushover analysis (PGA from 0.175 to 0.7 g).

Figure A3.
Irregular bridge—bending moment (Mb) and curvatures (qb) at the hinge location, derived by performing nonlinear dynamic analysis and modal pushover according to each single mode (PGA from 0.175 to 0.7 g).
Figure A3.
Irregular bridge—bending moment (Mb) and curvatures (qb) at the hinge location, derived by performing nonlinear dynamic analysis and modal pushover according to each single mode (PGA from 0.175 to 0.7 g).

Figure A4.
Irregular bridge—bending moment (Mb) and curvatures (qb) at the hinge location, derived by performing nonlinear dynamic analysis and pushover analysis (PGA from 0.175 to 0.7 g).
Figure A4.
Irregular bridge—bending moment (Mb) and curvatures (qb) at the hinge location, derived by performing nonlinear dynamic analysis and pushover analysis (PGA from 0.175 to 0.7 g).

References
- FEMA-356. Applied Technology Council (Report no 40); Applied Technology Council (ATC): Redwood City, CA, USA, 2000; Volume 1. [Google Scholar]
- ATC, Applied Technology Council. Seismic Evaluation and Retrofit of Concrete Buildings; ATC 40 Report; ATC: Redwood City, CA, USA, 1996. [Google Scholar]
- Vamvatsikos, D.; Cornell, C.A. Incremental dynamic analysis. Earthq. Eng. Struct. Dyn. 2002, 31, 491–514. [Google Scholar] [CrossRef]
- Vamvatisikos, D.; Cornell, C.A. Direct estimation of seismic demand and capacity of multi-degree of freedom systems through incremental dynamic analysis of single degree of freedom approximation. J. Struct. Eng. ASCE 2005, 131, 589–599. [Google Scholar] [CrossRef] [Green Version]
- Fajfar, P. A nonlinear analysis method for performance-based seismic design. Earthq. Spectra 2000, 16, 573–592. [Google Scholar] [CrossRef]
- Antoniou, S.; Pinho, R. Development and verification of a displacement-based adaptive pushover procedure. J. Earthq. Eng. 2004, 8, 643–661. [Google Scholar] [CrossRef]
- Bento, R.; Bhatt, C.; Pinho, R. Using nonlinear static procedures for seismic assessment of the 3D irregular SPEAR building. Earthq. Struct. 2010, 1, 177–195. [Google Scholar] [CrossRef]
- Bhatt, C.; Bento, R. Assessing the seismic response of existing RC buildings using the extended N2 method. Bull. Earthq. Eng. 2011, 9, 1183–1201. [Google Scholar] [CrossRef]
- Bhatt, C.; Bento, R. Extension of the CSM-FEMA440 to plan-asymmetric real building structures. Earthq. Eng. Struct. Dyn. 2011, 40, 1263–1282. [Google Scholar] [CrossRef]
- Kappos, A.J.; Saiidi, M.S.; Aydınoğlu, M.N.; Isaković, T. Seismic Design and Assessment of Bridges: Inelastic Methods of Analysis and Case Studies; Kappos, A.J., Saiidi, M.S., Aydınoğlu, M.N., Isaković, T., Eds.; Springer Science & Business Media: Berlin/Heidelberg, Germany, 2012; Volume 21. [Google Scholar]
- Pinho, R.; Casarotti, C.; Antoniou, S. A comparison of single-run pushover analysis techniques for seismic assessment of bridges. Earthq. Eng. Struct. Dyn. 2007, 36, 1347–1362. [Google Scholar] [CrossRef]
- Muljati, I.; Warnitchai, P. A modal pushover analysis on multi-span concrete bridges to estimate inelastic seismic responses. Civil. Eng. Dimens. 2007, 9, 33–41. [Google Scholar]
- Kappos, A.J.; Goutzika, E.D.; Stefanidou, S.P.; Sextos, A.G. Problems in pushover analysis of bridges sensitive to torsion. In Computational Methods in Earthquake Engineering; Springer: Dordrecht, The Netherlands, 2010; Volume 21. [Google Scholar] [CrossRef]
- Kappos, A.J.; Paraskeva, T.S. Nonlinear static analysis of bridges accounting for higher mode effects. In Workshop on Nonlinear Static Methods for Design/Assessment of 3D Structures; Springer: Lisbon, Portugal, 2008. [Google Scholar]
- Goel, R.K.; Chopra, A.K. Evaluation of modal and FEMA pushover analyses: SAC buildings. Earthq. Spectra 2004, 20, 225–254. [Google Scholar] [CrossRef] [Green Version]
- Chopra, A.K.; Goel, R.K. A modal pushover analysis procedure for estimating seismic demands for buildings. Earthq. Eng. Struct. Dyn. 2002, 31, 561–582. [Google Scholar] [CrossRef] [Green Version]
- Han, S.W.; Chopra, A.K. Approximate incremental dynamic analysis using the modal pushover analysis procedure. Earthq. Eng. Struct. Dyn. 2006, 35, 1853–1873. [Google Scholar] [CrossRef]
- Fajfar, P.; Marusic, D.; Perus, I. The extension of the N2 method to asymmetric buildings, In Proceedings of the 4th European Workshop on the Seismic Behaviour of Irregular and Complex Structures, Thessaloniki, Greece, 26–27 August 2005.
- Bergami, A.V.; Nuti, C.; Liu, X. Proposal and application of the Incremental Modal Pushover Analysis (IMPA). In Proceedings of the IABSE Conference, Geneva 2015: Structural Engineering: Providing Solutions to Global Challenges—Report, Geneva, Switzerland, 23–25 September 2015; pp. 1695–1700. [Google Scholar]
- Bergami, A.V.; Forte, A.; Lavorato, D.; Nuti, C. Proposal of an Incremental Modal Pushover Analysis (IMPA); Earthquake & Structures; Techno Press: Daejeon, Korea, 2017; Volume 13, pp. 539–549. ISSN 2092-7614. [Google Scholar]
- Bergami, A.V.; Nuti, C. A Design Procedure of Dissipative Braces for Seismic Upgrading Structures; Earthquake & Structures; Techno Press: Daejeon, Korea, 2013; Volume 4, pp. 85–108. ISSN 2092-7614. [Google Scholar]
- Bergami, A.V.; Forte, A.; Lavorato, D.; Nuti, C. Non-linear static analysis: Application of existing concrete building. In Proceedings of the Italian Concrete Days, Rome, Italy, 27–28 October 2016. [Google Scholar]
- Bommer, J.; Acevedo, A. The use of real earthquake accelerograms as input to dynamic analysis. J. Earthq. Eng. 2004, 8, 43–91. [Google Scholar] [CrossRef]
- Calvi, G.M.; Priestley, M.J.N. Seismic design and retrofitting of reinforced concrete bridges. In Proceedings of the International Workshop, LitoLine Arti Grafiche, Pavia, 2–5 April 1991. [Google Scholar]
- European Committee for Standardization. Eurocode 8—Design of Structures for Earthquake Resistance—Part 1: General Rules, Seismic Actions and Rules for Buildings; European Committee for Standardization: Brussels, Belgium, 2005. [Google Scholar]
- European Committee for Standardization. Eurocode 8—Design of Structures for Earthquake Resistance—Part 2: Bridges; European Committee for Standardization: Brussels, Belgium, 2005. [Google Scholar]
- Isaković, T.; Fischinger, M. Higher modes in simplified inelastic seismic analysis of single column bent viaducts. Earthq. Eng. Struct. Dyn. 2006, 35, 95–114. [Google Scholar] [CrossRef]
- Isaković, T.; Lazaro, M.P.N.; Fischinger, M. Applicability of pushover methods for the seismic analysis of single-column bent viaducts. Earthq. Eng. Struct. Dyn. 2008, 37, 1185–1202. [Google Scholar] [CrossRef]
- Paraskeva, T.S.; Kappos, A.J.; Sextos, A.G. Extension of modal pushover analysis to seismic assessment of bridges. Earthq. Eng. Struct. Dyn. 2006, 35, 1269–1293. [Google Scholar] [CrossRef]
- Paraskeva, T.S.; Kappos, A.J. Further development of a multimodal pushover analysis procedure for seismic assessment of bridges. Earthq. Eng. Struct. Dyn. 2010, 39, 211–222. [Google Scholar] [CrossRef]
- Paraskeva, T.S.; Kappos, A.J. Seismic assessment of complex bridges using an improved modal pushover analysis procedure. In Proceedings of the Fifth European Workshop on the Seismic Behaviour of Irregular and Complex Structures, Catania, Italy, 16–17 September 2008; pp. 335–348. [Google Scholar]
- Mohtashami, E.; Shooshtari, A. A multimode adaptive pushover procedure for seismic assessment of integral bridges. Adv. Civ. Eng. 2013, 2013, 941905. [Google Scholar] [CrossRef] [Green Version]
- Isakovic, T.; Fischinger, M.; Kante, P. Bridges: When is single mode seismic analysis adequate? Struct. Build. 2003, 156, 163–173. [Google Scholar] [CrossRef]
- Decreto 17 gennaio 2018 Aggiornamento delle «Norme tecniche per le costruzioni». (18A00716) (GU Serie Generale n.42 del 20-02-2018—Suppl. Ordinario n. 8). In Italian. Available online: https://www.gazzettaufficiale.it/eli/gu/2018/02/20/42/so/8/sg/pdf (accessed on 22 June 2020).
- Beyer, K.; Bommer, J. Selection and scaling of real accelerograms for bi-directional loading: A review of current practice and code provisions. J. Earthq. Eng. 2006, 11, 13–45. [Google Scholar] [CrossRef]
- Kastanos, E.I.; Sextos, A.G.; Manolis, G.D. Selection of earthquake ground motion records: A state of the art review from a structural perspective. Soil Dyn. Earthq. Eng. 2010, 30, 157–169. [Google Scholar]
- Iervolino, I.; Galasso, C.; Cosenza, E. REXEL: Computer aided record selection for code-based seismic structural analysis. Bull. Earthq. Eng. 2010, 8, 339–362. [Google Scholar] [CrossRef]
- Computers and Structures Inc. SAP2000 Nonlinear Version 10 (2005) User’s Reference Manual; Computers and Structures Inc.: Berkeley, CA, USA, 2005. [Google Scholar]
- Mander, J.B.; Priestley, M.J.N.; Park, R. Theoretical stress–strain model for confined concrete. J. Struct. Eng. 1988, 114, 1804–1826. [Google Scholar] [CrossRef] [Green Version]
- Forte, A.; Santini, S.; Fiorentino, G.; Lavorato, D.; Bergami, A.V.; Nuti, C. Influence of materials knowledge level on the assessment of the shear strength characteristic value of existing RC beams. In Proceedings of the 12th FIB International PhD Symposium in Civ. Engineering, Prague, Czech Republic, 29–31 August 2018; pp. 979–986. [Google Scholar]
- Lavorato, D.; Fiorentino, G.; Bergami, A.V.; Ma, H.-B.; Nuti, C.; Briseghella, B.; Vanzi, I.; Zhou, W. Surface generation of asynchronous seismic signals for the seismic response analysis of bridges. In Proceedings of the 6th International Conference on Computational Methods in Structural Dynamics and Earthquake Engineering, Rhodes Island, Greece, 15–17 June 2017; Volume 1, pp. 2203–2213. [Google Scholar]
- Lavorato, D.; Bergami, A.V.; Rago, C.; Ma, H.-B.; Nuti, C.; Vanzi, I.; Briseghella, B.; Zhuo, W.-D. Seismic behaviour of isolated RC bridges subjected to asynchronous seismic input. In Proceedings of the 6th International Conference on Computational Methods in Structural Dynamics and Earthquake Engineering, Rhodes Island, Greece, 15–17 June 2017; Volume 1, pp. 2214–2216. [Google Scholar]
- Lavorato, D.; Fiorentino, G.; Pelle, A.; Rasulo, A.; Bergami, A.V.; Briseghella, B.; Nuti, C. A corrosion model for the interpretation of cyclic behavior of reinforced concrete sections. Struct. Concr. 2019, 1–15. [Google Scholar] [CrossRef]
- Liu, T.; Zordan, T.; Zhang, Q.; Briseghella, B. Equivalent viscous damping of bilinear hysteretic oscillators. J. Struct. Eng. 2015, 141, 06015002. [Google Scholar] [CrossRef]
- Aviram, A.; Mackie, K.R.; Stojadinović, B. Guidelines for Nonlinear Analysis of Bridge Structures in California; Report No. UCB/PEER 2008/03; Pacific Earthquake Engineering Research Center, University of California: Berkeley, CA, USA, 2008. [Google Scholar]
Figure 1.
IMPA procedure. (a) Evaluation of the performance points (P.P.) for each capacity curve that belongs to the pushover analysis: proportional to Mode 1. Mode n. (b) Evaluation of the P.P. for each capacity curve: e.g., via C.S.M. (c) Capacity curve plotted in the ur-intensity plane (ur is the displacement of the monitoring point along the investigated direction, e.g., the transverse direction).


Figure 2.
Degree of freedom of the bridge: by performing the NSA, the displacement ur of the monitoring point is controlled. In this work, ur is the transversal displacement.
Figure 2.
Degree of freedom of the bridge: by performing the NSA, the displacement ur of the monitoring point is controlled. In this work, ur is the transversal displacement.

Figure 3.
Application of the Square Root of the Sum of Squares rule to a bridge.

Figure 4.
Evaluation of the IMPAβ capacity curve: envelope of IUPA and IMPA.

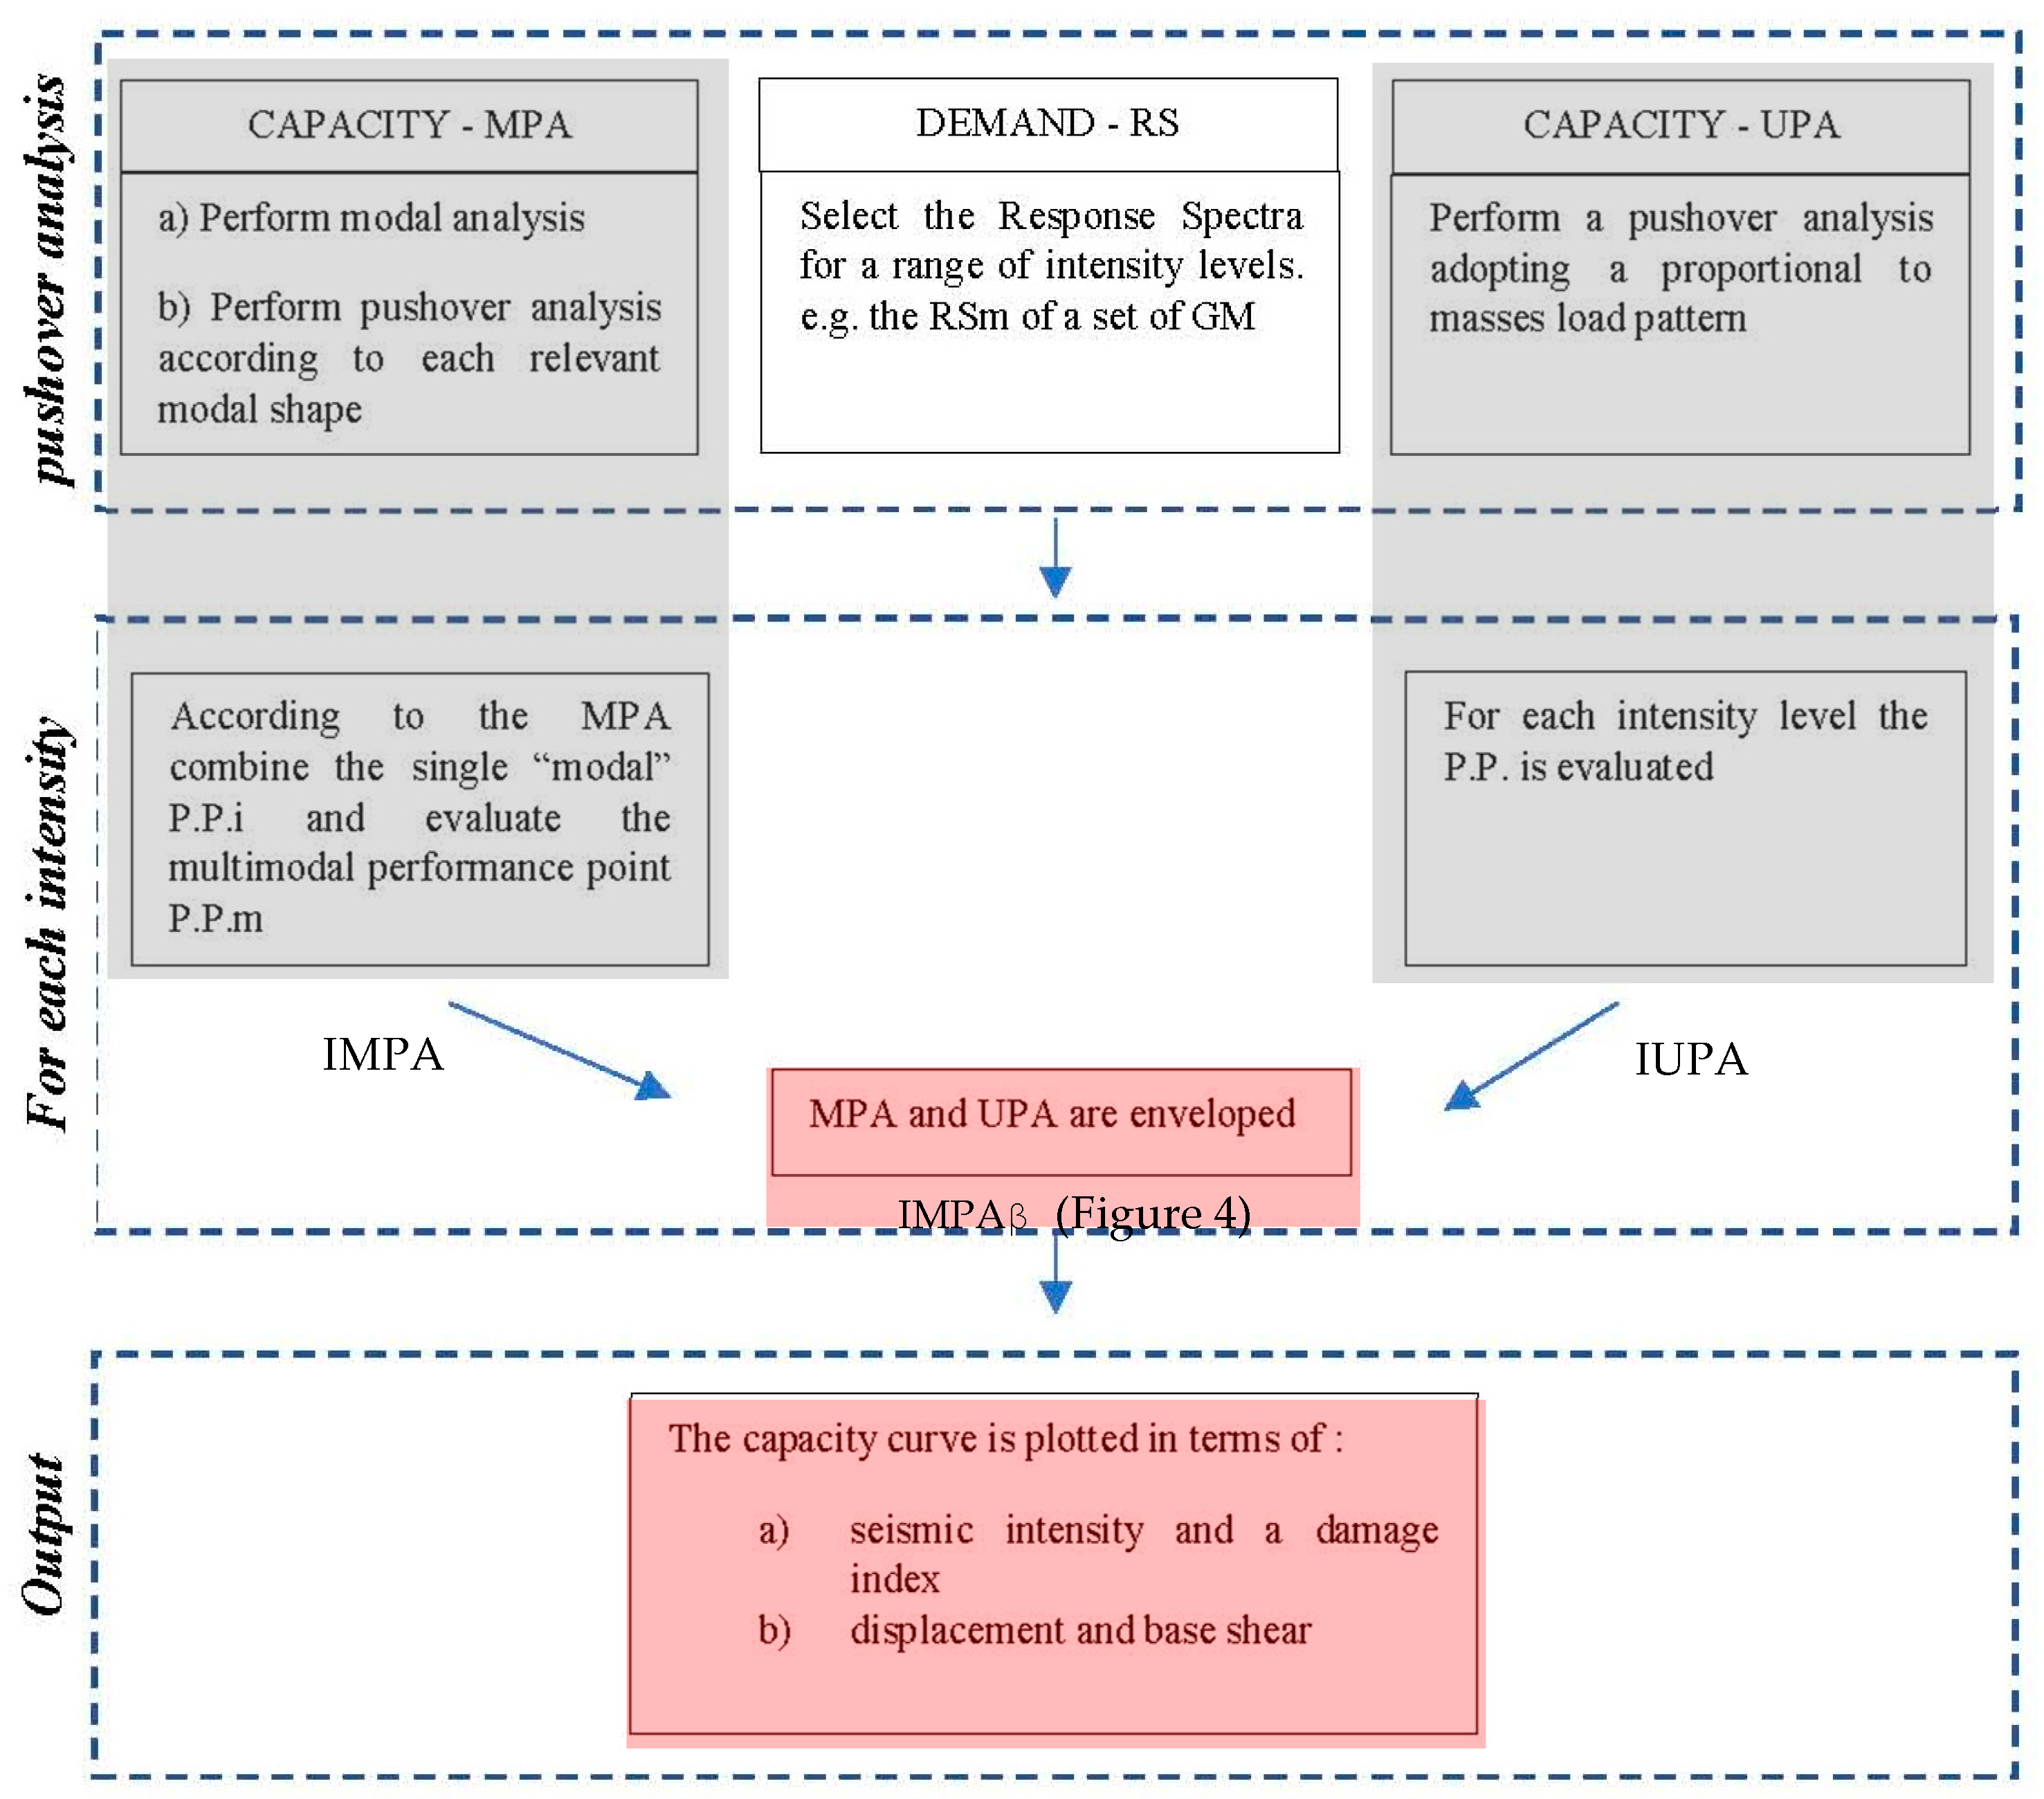
Figure 5.
Flowchart of IMPAβ procedure.

Figure 6.
Layout of the bridges: regular bridge (RB) and irregular bridge (IB).

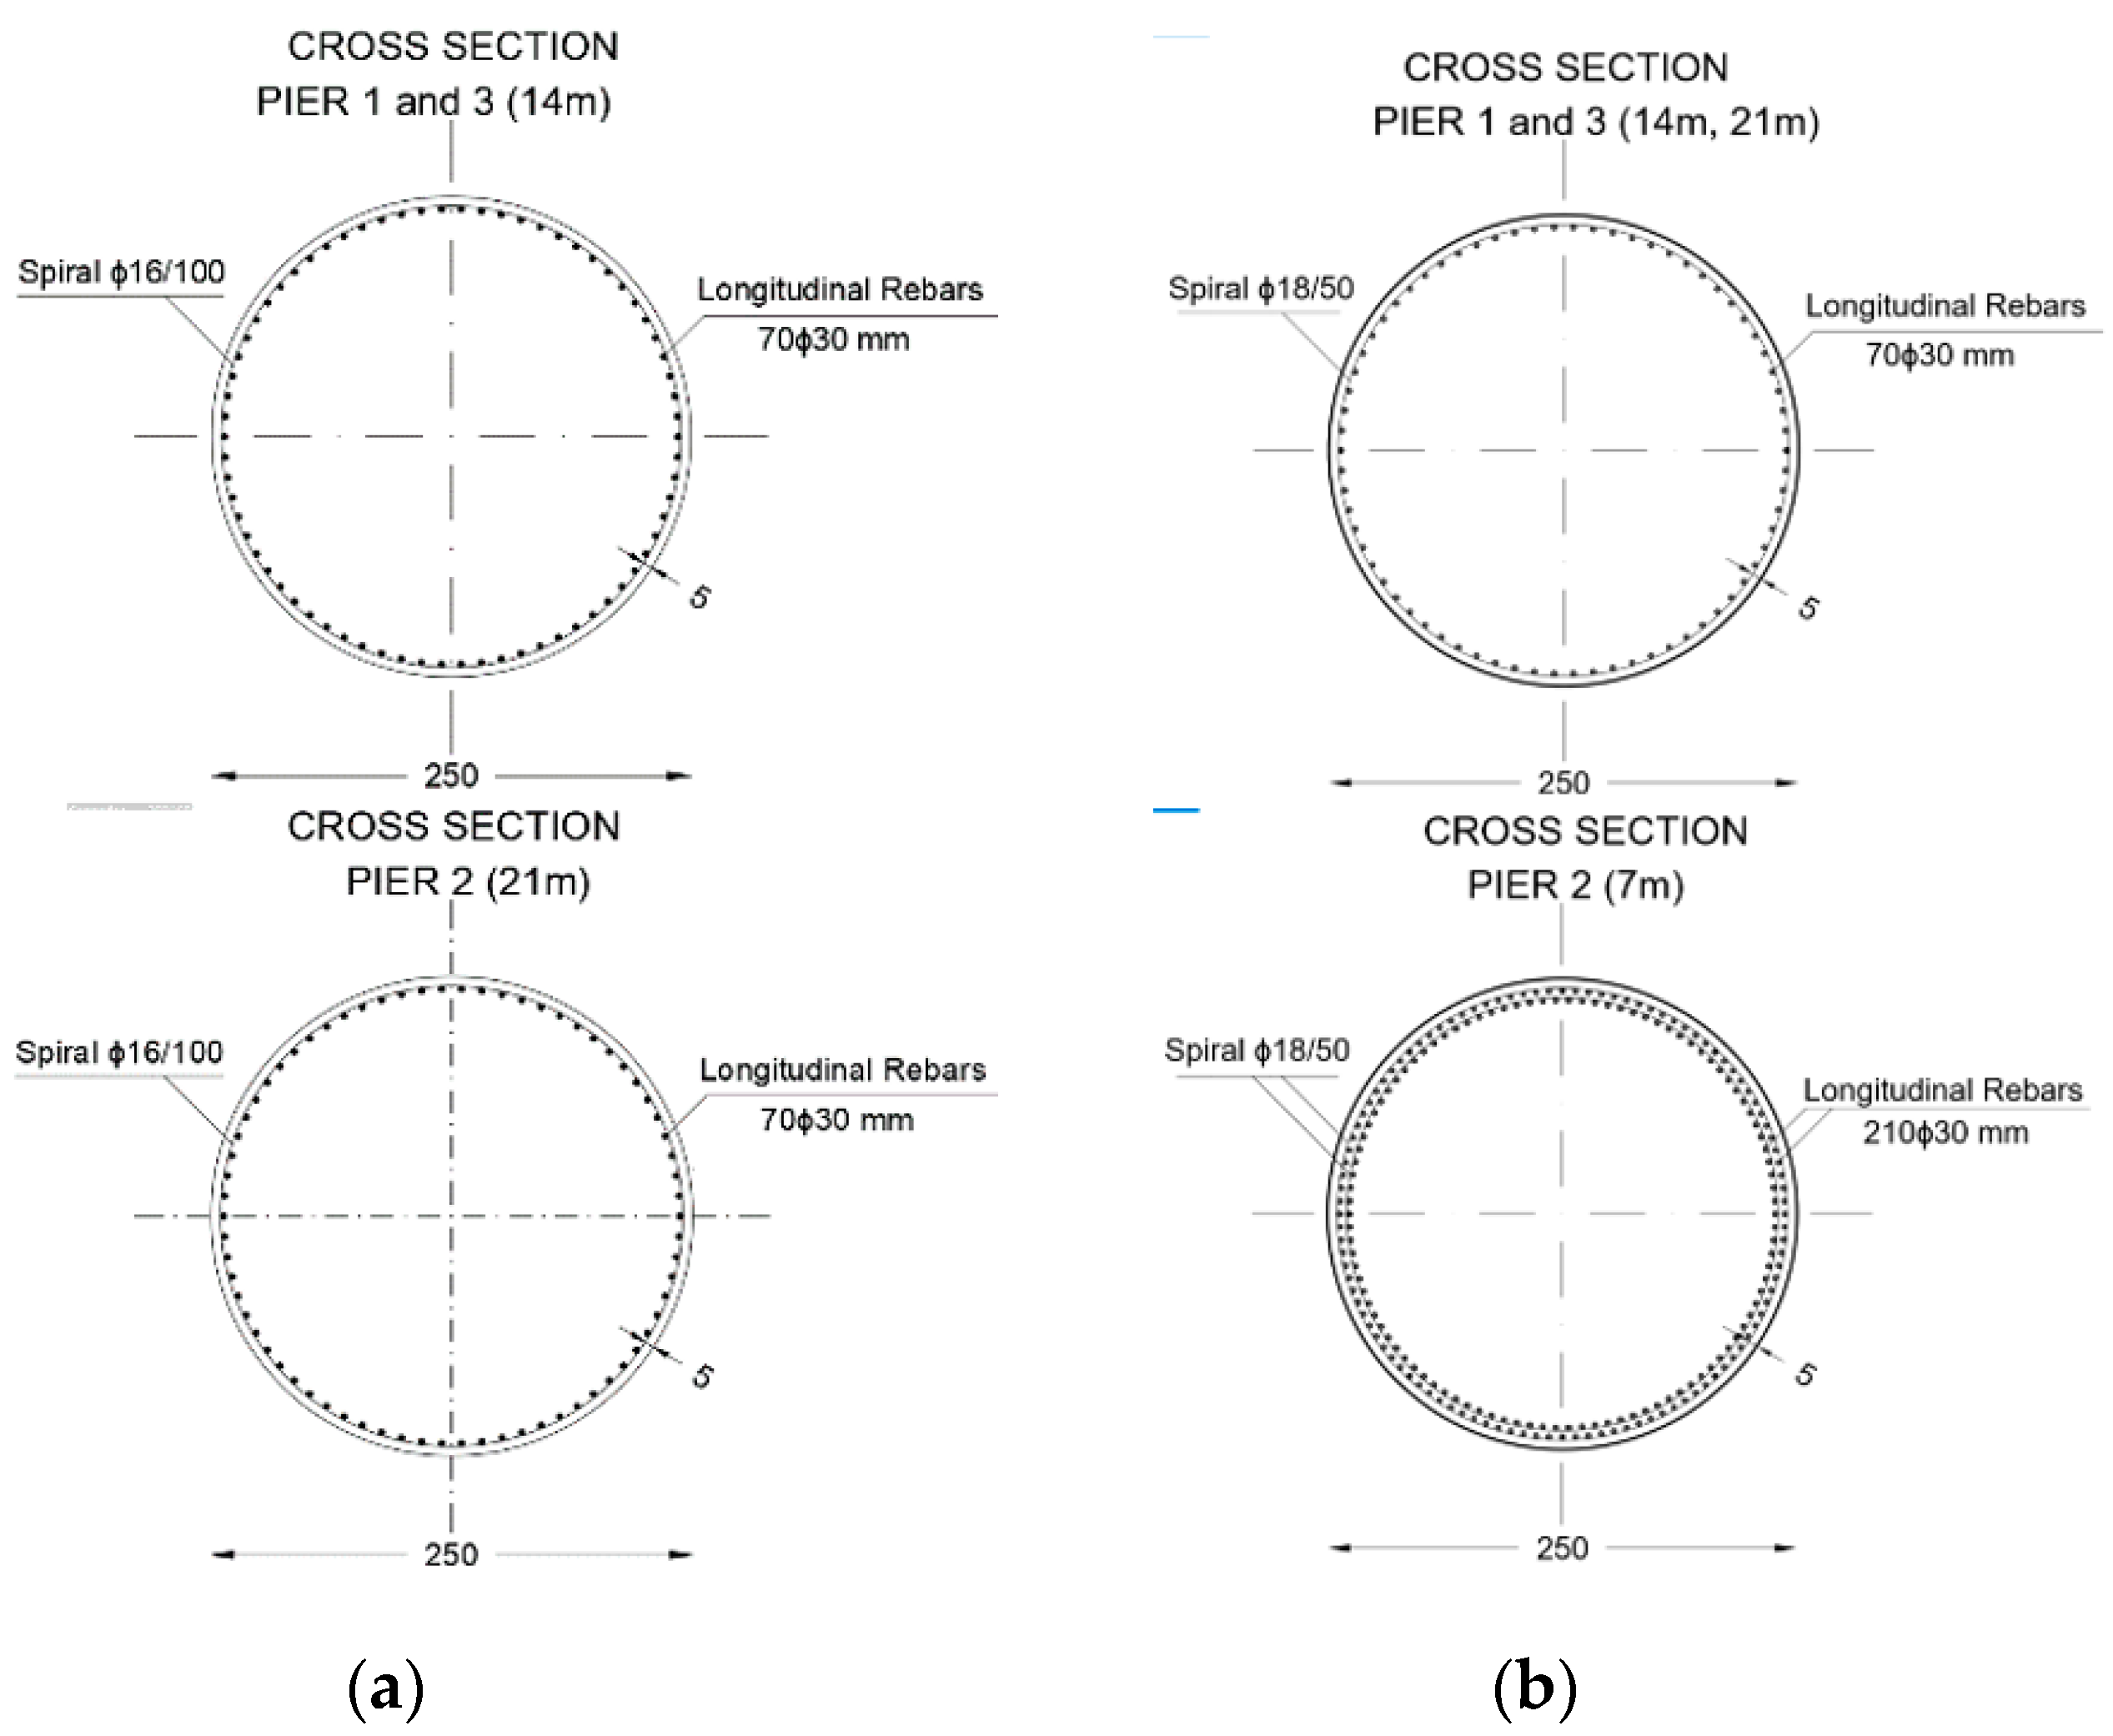
Figure 7.
(a) Regular bridge: pier sections. (b) Irregular bridge: pier sections.

Figure 8.
Individual response spectra ζ = 5%, “component” of the ground motion records (transverse direction of bridge models) for the seven unscaled ground motions (RS1, …, RS7) and their median response spectrum (RSm), used for the pushover analyses, with the RS being the code elastic spectrum used for the bridges (RB and IB) design.

Figure 9.
(a) Bridge structural model, (b) SAP 2000 model of the regular bridge and (c) SAP 2000 model of the irregular bridge.
Figure 9.
(a) Bridge structural model, (b) SAP 2000 model of the regular bridge and (c) SAP 2000 model of the irregular bridge.

Figure 10.
Regular bridge—mode shapes (transverse direction).

Figure 11.
Irregular bridge—mode shapes (transverse direction).

Figure 12.
Regular bridge—deck displacements derived by performing pushover analysis (ag = 0.7 g), with a load pattern proportional to the main mode shapes, with respect to different monitoring points (M.P.). Pushover with Mode 2 (a) or Mode 4 (b).
Figure 12.
Regular bridge—deck displacements derived by performing pushover analysis (ag = 0.7 g), with a load pattern proportional to the main mode shapes, with respect to different monitoring points (M.P.). Pushover with Mode 2 (a) or Mode 4 (b).

Figure 13.
Irregular bridge—deck displacements derived by performing pushover analysis (ag = 0.7 g), with a load pattern proportional to the main mode shapes, with respect to different monitoring points (M.P.). Pushover with Mode 1 (a), Mode 3 (b) or Mode 4 (c).
Figure 13.
Irregular bridge—deck displacements derived by performing pushover analysis (ag = 0.7 g), with a load pattern proportional to the main mode shapes, with respect to different monitoring points (M.P.). Pushover with Mode 1 (a), Mode 3 (b) or Mode 4 (c).

Figure 14.
Regular bridge—deck displacements derived by performing nonlinear dynamic analysis and pushover analysis according to the approaches considered (PGA from 0.175 to 0.7 g).
Figure 14.
Regular bridge—deck displacements derived by performing nonlinear dynamic analysis and pushover analysis according to the approaches considered (PGA from 0.175 to 0.7 g).

Figure 15.
Regular bridge—deck displacements derived by performing nonlinear dynamic analysis and pushover analysis according to the approaches considered (PGA from 0.175 to 0.7 g).
Figure 15.
Regular bridge—deck displacements derived by performing nonlinear dynamic analysis and pushover analysis according to the approaches considered (PGA from 0.175 to 0.7 g).

Figure 16.
Regular bridge—pier drift (transversal top displacement/height) derived by performing nonlinear dynamic analysis and pushover analysis according to the approaches considered (PGA from 0.175 to 0.7 g).
Figure 16.
Regular bridge—pier drift (transversal top displacement/height) derived by performing nonlinear dynamic analysis and pushover analysis according to the approaches considered (PGA from 0.175 to 0.7 g).

Figure 17.
Regular bridge—deck drift (relative displacement between two consecutive joints Pi and Pi+1/Pi-Pi+1 span length) derived by performing nonlinear dynamic analysis and pushover analysis according to the approaches considered (PGA 0.175–0.7 g).
Figure 17.
Regular bridge—deck drift (relative displacement between two consecutive joints Pi and Pi+1/Pi-Pi+1 span length) derived by performing nonlinear dynamic analysis and pushover analysis according to the approaches considered (PGA 0.175–0.7 g).

Figure 18.
Regular bridge—incremental curve (displacement-intensity) and capacity curves derived with IDA (maximum values of ur and Vb,x) or IMPAβ (the design PGA was 0.35 g, corresponding to a transversal base shear of Vb,x ~ 9200 kN).
Figure 18.
Regular bridge—incremental curve (displacement-intensity) and capacity curves derived with IDA (maximum values of ur and Vb,x) or IMPAβ (the design PGA was 0.35 g, corresponding to a transversal base shear of Vb,x ~ 9200 kN).

Figure 19.
Irregular bridge—deck displacements derived by performing nonlinear dynamic analysis and pushover analysis according to the approaches considered (PGA from 0.175 to 0.7 g).
Figure 19.
Irregular bridge—deck displacements derived by performing nonlinear dynamic analysis and pushover analysis according to the approaches considered (PGA from 0.175 to 0.7 g).

Figure 20.
Irregular bridge—deck displacements derived by performing nonlinear dynamic analysis and pushover analysis according to the approaches considered (PGA from 0.175 to 0.7 g).
Figure 20.
Irregular bridge—deck displacements derived by performing nonlinear dynamic analysis and pushover analysis according to the approaches considered (PGA from 0.175 to 0.7 g).

Figure 21.
Irregular bridge—pier drift (transversal top displacement/height) derived by performing nonlinear dynamic analysis and pushover analysis according to the approaches considered (PGA from 0.175 to 0.7 g).
Figure 21.
Irregular bridge—pier drift (transversal top displacement/height) derived by performing nonlinear dynamic analysis and pushover analysis according to the approaches considered (PGA from 0.175 to 0.7 g).

Figure 22.
Irregular bridge—deck drift (relative disp. between two consecutive joints, Pi and Pi+1/Pi-Pi+1 span length) derived by performing nonlinear dynamic analysis and pushover analysis according to the approaches considered (PGA 0.175–0.7 g).
Figure 22.
Irregular bridge—deck drift (relative disp. between two consecutive joints, Pi and Pi+1/Pi-Pi+1 span length) derived by performing nonlinear dynamic analysis and pushover analysis according to the approaches considered (PGA 0.175–0.7 g).

Figure 23.
Case study—incremental curve (displacement-intensity) and capacity curves derived with IDA (maximum values of ur and Vb,x) or IMPAβ (the design PGA was 0.35 g, corresponding to a transversal base shear of Vb,x ~ 13,000 kN).
Figure 23.
Case study—incremental curve (displacement-intensity) and capacity curves derived with IDA (maximum values of ur and Vb,x) or IMPAβ (the design PGA was 0.35 g, corresponding to a transversal base shear of Vb,x ~ 13,000 kN).


Table 1.
Loads and actions.
| Load | kN/m | kN | |
|---|---|---|---|
| Dead | Self-weight | 200 | - |
| Live | Vehicle loads (Qik) | - | 1200 |
| Live | Distributed load (qik) | 54.5 | - |
Table 2.
List of the selected ground motions.
| Etq ID | Earthquake Name | Waveform | Date | PGA (g) |
|---|---|---|---|---|
| 1635 | South Iceland | 4674-xa | 17/06/2000 | 0.31 |
| 1635 | South Iceland | 4674-ya | 17/06/2000 | 0.31 |
| 2309 | Bingol | 7142-xa | 01/05/2003 | 0.50 |
| 2309 | Bingol | 7142-ya | 01/05/2003 | 0.50 |
| 2142 | South Iceland (aftershock) | 6349-xa | 21/06/2000 | 0.72 |
| 2142 | South Iceland (aftershock) | 6332-ya | 21/06/2000 | 0.51 |
| 1635 | South Iceland | 6277-ya | 17/06/2000 | 0.35 |
| - | Mean | - | 0.46 |
Etq ID: Earthquake identification number.
Table 3.
Regular bridge—modal properties.
| Mode | Period | Participating Mass |
|---|---|---|
| N° | S | % |
| 2 | 1.02 | 78.0 |
| 4 | 0.33 | 12.0 |
Table 4.
Irregular bridge—modal properties.
| Mode | Period | Participating Mass |
|---|---|---|
| N° | S | % |
| 1 | 0.65 | 16.9 |
| 3 | 0.53 | 71.3 |
| 4 | 0.13 | 4.5 |
© 2020 by the authors. Licensee MDPI, Basel, Switzerland. This article is an open access article distributed under the terms and conditions of the Creative Commons Attribution (CC BY) license (http://creativecommons.org/licenses/by/4.0/).
Share and Cite
MDPI and ACS Style
Bergami, A.V.; Nuti, C.; Lavorato, D.; Fiorentino, G.; Briseghella, B. IMPAβ: Incremental Modal Pushover Analysis for Bridges. Appl. Sci. 2020, 10, 4287. https://doi.org/10.3390/app10124287
AMA Style
Bergami AV, Nuti C, Lavorato D, Fiorentino G, Briseghella B. IMPAβ: Incremental Modal Pushover Analysis for Bridges. Applied Sciences. 2020; 10(12):4287. https://doi.org/10.3390/app10124287
Chicago/Turabian StyleBergami, Alessandro Vittorio, Camillo Nuti, Davide Lavorato, Gabriele Fiorentino, and Bruno Briseghella. 2020. "IMPAβ: Incremental Modal Pushover Analysis for Bridges" Applied Sciences 10, no. 12: 4287. https://doi.org/10.3390/app10124287
Note that from the first issue of 2016, this journal uses article numbers instead of page numbers. See further details here.