Review

The Dark Target Algorithm for Observing the Global Aerosol System: Past, Present, and Future

1
Joint Center for Earth Systems Technology-UMBC, Baltimore, MD 21250, USA
2
NASA-Goddard Space Flight Center (GSFC), Greenbelt, MD 20771-0001, USA
3
Science Systems and Applications (SSAI), Lanham, MD 20706, USA
4
CNRS, UMR 8518-LOA-Laboratoire d’Optique Atmosphérique, University of Lille, F-59000 Lille, France
5
Science and Technology Institute, Universities Space Research Association (USRA), Huntsville, AL 35806, USA
6
Marshall Space Flight Center, Huntsville, AL 35806, USA
7
Department of Physics, University of Maryland-Baltimore County (UMBC), Baltimore, MD 21250, USA
8
Maxar Technologies, Westminster, CO 80234, USA
9
Universities Space Research Association (USRA), Columbia, MD 21046, USA
10
College of Arts & Sciences, Howard University, Washington, DC 20059, USA
11
Naval Research Laboratory, Code 7231, Washington, DC 20375, USA
12
Earth System Science Interdisciplinary Center (ESSIC), University of Maryland, College Park, MD 20737, USA
*
Author to whom correspondence should be addressed.
Remote Sens. 2020, 12(18), 2900; https://doi.org/10.3390/rs12182900
Submission received: 29 July 2020 / Revised: 1 September 2020 / Accepted: 3 September 2020 / Published: 7 September 2020

Abstract

:
The Dark Target aerosol algorithm was developed to exploit the information content available from the observations of Moderate-Resolution Imaging Spectroradiometers (MODIS), to better characterize the global aerosol system. The algorithm is based on measurements of the light scattered by aerosols toward a space-borne sensor against the backdrop of relatively dark Earth scenes, thus giving rise to the name “Dark Target”. Development required nearly a decade of research that included application of MODIS airborne simulators to provide test beds for proto-algorithms and analysis of existing data to form realistic assumptions to constrain surface reflectance and aerosol optical properties. This research in itself played a significant role in expanding our understanding of aerosol properties, even before Terra MODIS launch. Contributing to that understanding were the observations and retrievals of the growing Aerosol Robotic Network (AERONET) of sun-sky radiometers, which has walked hand-in-hand with MODIS and the development of other aerosol algorithms, providing validation of the satellite-retrieved products after launch. The MODIS Dark Target products prompted advances in Earth science and applications across subdisciplines such as climate, transport of aerosols, air quality, and data assimilation systems. Then, as the Terra and Aqua MODIS sensors aged, the challenge was to monitor the effects of calibration drifts on the aerosol products and to differentiate physical trends in the aerosol system from artefacts introduced by instrument characterization. Our intention is to continue to adapt and apply the well-vetted Dark Target algorithms to new instruments, including both polar-orbiting and geosynchronous sensors. The goal is to produce an uninterrupted time series of an aerosol climate data record that begins at the dawn of the 21st century and continues indefinitely into the future.

Graphical Abstract

1. Introduction

The global aerosol system [1,2,3] is an integral component of Earth system science [4]. The concept of the global aerosol system brings a holistic perspective to aerosol science, viewing each specific aerosol source, type, transport, transformation, influence, and sink as part of a global whole. The concept encourages a far-reaching scope that encompasses aerosol influence on climate, hydrology, biology, and health, and how these other systems affect aerosols. The examination of aerosols as a global system, rather than a local one, is only 30 years old 273 (Using Google Scholar, no scientific works use the term “global aerosol system” before 1990, only a handful use the term from 1990 to 2000, and then over 100 use the term from 2000 to 2010. Reference [5] is the first use found). An important factor in creating this shift in perspective from local to global was tied directly to the advent of satellite remote sensing of aerosol.
Satellites provide the best means of observing and characterizing the global aerosol system [1]. These space-borne sensors point at Earth scenes and measure radiation that has been reflected or emitted by the Earth’s surface and atmosphere. Satellite aerosol remote sensing requires deconvolving the signal measured by the sensor into a component originating from the Earth’s atmosphere from that originating from the surface beneath, and then isolating the aerosol signal from other atmospheric constituents. The process requires extensive knowledge of aerosol optical properties: the degree to which particles emit, absorb, or scatter incident radiation. For the purpose of this paper, we consider only the absorption and scattering of solar radiation, and not emission at longer wavelengths. Particle properties determine the fraction of radiation scattered in a particular direction (i.e., toward the satellite), and this information is wavelength-dependent. Higher particle concentrations increase the measurable radiation scattered toward the satellite. The range of radiation levels measured by the sensor are translated into a quantification of aerosol loading in the observed scene. Particle optical properties depend on their chemical composition, as well as their size and shape. If the satellite sensor measures sufficient angular and/or spectral information, and if the aerosol signal can be sufficiently separated from the signals due to the surface and other atmospheric constituents, then other information about the aerosol physical properties can be inferred from the measurements.
Using satellite observations to retrieve quantitative information about aerosols began with the Multispectral Scanner (MSS) on board the Earth Resources Technology-1 (ERTS-1) satellite, a precursor to the modern Landsat missions [6,7,8]. These studies from the 1970s proved the concept of quantifying aerosol from space, but the MSS imagery with its nadir-only view and repeat cycle of 18 days could not adequately visualize or quantify aerosol as a global system. The technique of quantitative retrieval was adapted to the Advanced Very-High-Resolution Radiometer (AVHRR) on board a series of National Oceanographic and Atmospheric Administration (NOAA) polar-orbiting satellites that had a larger swath and more frequent repeat cycle [9]. It was this AVHRR-based aerosol product, available only over ocean, that provided the first visualizations of aerosol as a global system [10].
Motivation was high to expand upon this pioneering work and fully develop a global aerosol product which could characterize aerosol as a global system. National Aeronautics and Space Administration (NASA) instituted “Mission to Planet Earth” in the early 1990s [11] and was developing a new generation of sensors with expanded capabilities called the Earth Observing System. As part of this effort, NASA was investing in science teams that would produce a set of operational products to characterize the many facets of the Earth system. Aerosols would be one of those products. Producing an operational algorithm that would run automatically, efficiently, globally, and in all aerosol and environmental conditions was a significant challenge beyond the proof-of-concept studies and the early NOAA AVHRR products. Despite the challenges, the scientific value of a successful product would be high.
The first operational aerosol algorithm applied to Moderate-Resolution Imaging Spectroradiometer (MODIS) data was ready at the time of NASA’s Terra satellite launch in late 1999, after nearly a decade of development [12,13]. The algorithm made use of enhanced MODIS instrument capabilities such as a broader spectral range, wide (2330 km) swath, and on-board calibration to characterize the aerosol system in a globally consistent manner. In parallel to the development of the aerosol algorithm, NASA invested in the development of abilities to validate the products that the algorithm would produce. Validation efforts included aircraft instruments and airborne campaigns, but the primary suborbital initiative that would dovetail with the MODIS aerosol algorithm for validation was the creation and expansion of the Aerosol Robotic Network (AERONET) [14]. The combination of the MODIS aerosol product with AERONET to support its development and validation became an irresistible one-two punch that changed our perception of the global aerosol system forever.
The original algorithm, termed Dark Target (DT) [15] for its use of dark surfaces as targets of opportunity to measure the contrast of the bright aerosol above, has undergone continuous modifications and improvements over the two decades it has been in operation [15,16,17,18,19,20,21,22,23,24]. These changes were implemented as remote sensing science progressed, as validation identified areas of concern that could be remedied, and as the instruments themselves aged. Change is a necessity in improving a satellite product, and yet change interferes with the goal of being able to use these products to discern trends in the global aerosol system. To maintain consistency in the products, there have been major efforts to reprocess the archive of data from the beginning of missions with more modern computational resources; however, consistency and continuity remain challenging.
The impact of the DT aerosol algorithm on remote sensing science, on Earth science, and on related applications has been immense. Initially applied to the MODIS sensors on the Terra and Aqua satellites, the algorithm grew to be much more than “the MODIS aerosol algorithm”. The algorithm is now retrieving aerosol properties from new sensors such as the Visible Infrared Imaging Radiometer Suite (VIIRS) on the Suomi-National Polar-Orbiting Partnership (S-NPP) satellite and has been adapted non-operationally for a fleet of geosynchronous sensors. In addition to direct adaptation, the DT algorithm has inspired other algorithm families in a variety of ways, including the introduction of techniques for cloud and snow masking, and the development of best practices for the validation of satellite-based aerosol products. These influences are discussed in Section 7.5. Meanwhile, many advances in understanding how aerosols affect climate, clouds, biological systems, and air quality can be traced directly to research using DT products. We currently understand the global aerosol system much better than we did 20 years ago, in part due to the influence of this one algorithm.
The objectives of this paper are as follows:
(a)
to illustrate the development of an evolving algorithm so as to provide a template for present and future development teams to learn from the example;
(b)
to provide an annotated reference list of a multidecade body of work;
(c)
to critically examine the concept of continuity with a continuously evolving algorithm applied to aging sensors over a 20-year period;
(d)
to preview future characterization of the global aerosol system using the DT algorithm as an example as the community moves forward to new sensors.

2. Observing the Global Aerosol System before MODIS

Before the launch of Terra with the first MODIS instrument at the end of 1999, there were already satellite-derived views of the global aerosol system. Some of these operational and research products from the 1990s proved to be direct predecessors of the MODIS DT product. One of these was the NOAA operational aerosol product that used inputs from the AVHRR instruments aboard NOAA’s polar-orbiting satellite series [9,10,25,26,27,28]. The NOAA product was based on the “dark target” premise, that aerosol above a dark surface would appear brighter. Furthermore, with appropriate assumptions about the surface reflectance and the properties of the aerosol and atmosphere, the aerosol loading could be quantified as an aerosol optical thickness (AOT) or aerosol optical depth (AOD) through radiative transfer modeling. For the remainder of this paper, AOT and AOD are used interchangeably. AVHRR had only two reflective bands centered at 0.63 µm and 0.86 µm. The NOAA AVHRR algorithm used one band (0.63 µm) and only derived AOD over the ocean where the reflectance of the dark ocean surface was readily characterized. The algorithm was applied to 4 km native pixel resolution data, and clouds were screened using a relatively simple 2 × 2 pixel spatial variability test, discarding all four pixels whenever the difference between the maximum and minimum value exceeded a threshold. Once determined to be “suitable” for retrieval, the aerosol properties were assumed to be static, set to best represent state-of-the-art understanding of maritime aerosol—a single mode size distribution, with a set value of the real part of the refractive index, and no absorption (imaginary part set to zero). While crude, this AOD product was successfully validated by comparison with ground-based in situ measurements at rare island sites. Such validation could only be qualitative, as the in situ measurements did not measure total column aerosol loading [9]. Later, when ground-based total column ambient measures of AOD were available from ground sites, the NOAA AVHRR product made use of this sunphotometer-measured AOD for validation [10].
In addition to NOAA’s operational algorithm, there were other research algorithms applied to AVHRR. These research algorithms also limited retrievals to over oceans, but these algorithms employed both reflective wavelengths from AVHRR. The added wavelength permitted a retrieval of spectral AOD at two wavelengths [29,30,31,32,33] or three wavelengths [34] and the Angstrom exponent. These multiwavelength algorithms allowed for a more sophisticated representation of the aerosol system. Using [31] as an example, they used fixed bimodal size distributions and a fixed complex refractive index. Validation was also more sophisticated, as they made use of the fledgling AERONET network to directly compare both AOD and Angstrom exponent. Due to the rarity of validation sites over ocean, the [31] validation dataset consisted of only 27 collocation points. Today, nearly 30 years later, the AVHRR data have been reprocessed with modern aerosol algorithms, and a lengthy time series of AOD is available over both land and ocean [35], and there are thousands of validation points.
While the AVHRR aerosol retrievals provided the theoretical underpinnings for the MODIS DT algorithm, there were also other aerosol retrievals in the 1990s working toward global views of the aerosol system. For example, there were retrievals applied to ultraviolet sensors such as the Total Ozone Monitoring Sensor (TOMS) [36]. Because the TOMS aerosol algorithm was based on different physical principles and did not directly influence the development of the MODIS DT algorithm, it is outside the scope of this paper.
The algorithms applied to AVHRR in the 1990s provided an unprecedented view of the aerosol system, but they were working with a sensor that was not designed for quantitative aerosol retrieval. AVHRR had limited spectral range, broad bands that were affected by water vapor absorption, no on-board calibration, and a native pixel resolution that made cloud masking a challenge. Furthermore, the NOAA satellites’ equator-crossing times drifted during each satellite’s lifetime, introducing uncertainty in characterizing global systems. Anticipating the need for quantitative observations of the entire Earth System, including aerosol, NASA planned for a series of missions called the Earth Observing System (EOS). The instruments aboard the EOS satellites were designed specifically to meet the requirements of science teams that were responsible for producing science products that would meet the needs of the international science community. MODIS, in particular, was the flagship EOS instrument. Compared to AVHRR, MODIS had seven times the number of spectral bands, narrower channels in window regions, on-board calibration with an entire calibration team to assure characterization, and pixel resolution as fine as 250 m at nadir. This new hardware would be available to propel aerosol remote sensing into a new age.

3. Developing the First Global MODIS Aerosol Product

The first global MODIS aerosol product made use of the advances provided by the MODIS instrument and permitted operational quantitative aerosol retrieval over land, as well as ocean. This represented a significant challenge, as the algorithm must evaluate a number of scenarios and observation conditions, including avoiding pixels with clouds, before carrying out the extraction of aerosol-related information. Because there was no prior experience of carrying out aerosol detection using multiple visible and shortwave infrared (SWIR) channels, much of this approach had to be created from scratch. Conceptually, the heart of the retrieval was and still remains the comparison of satellite-measured radiances with pre-calculated top-of-atmosphere (TOA) radiances computed with the modeled aerosol properties. The observed and modeled radiances were compared via a cost function where the best match or matches were reported as the retrieved values for the pixel under observation [12,13]. This methodology is commonly referred to in the DT algorithm concept as a look-up table (LUT) approach. The quantifiable signal was the contrast between a bright aerosol layer over a dark surface, with the aerosol brightening the scene because of the particles’ scattering properties.
The primary challenge for the DT algorithm was the separation between the contribution from the surface and the atmosphere. Because the DT algorithm is limited to “dark” scenes where the surface contribution is minimal, most of the satellite-observed radiance originates from the atmosphere and the challenge is mitigated. There are two types of Earth surfaces that offer “dark” scenes, non-glint open ocean (coastal zones require a specific treatment as explained in Section 5.1.1) and dark vegetated landscapes over land. Of the two types of “dark” scenes, the ocean surface is easier to characterize, allowing more aerosol information to be derived from the satellite measurements. The different challenges and opportunities associated with the two types of surfaces led to the development of two independent algorithms, one for over oceans and the other for vegetated land surfaces. These two algorithms are described in the next two sections.

3.1. Retrievals of Aerosol Loading and Particle Size over Oceans

Over ocean, the operational and research grade AVHRR retrievals provided the necessary inspiration for the MODIS algorithm. However, a MODIS algorithm having more spectral information than the limited AVHRR should be able to use this information to better retrieve particle size parameters [13]. MODIS has two bands at 0.25 km and five at 0.50 km spatial resolution, and, except for cloud masking, these seven bands provided all the measured information for the algorithm. With seven bands, it was hoped that there would be seven “pieces of information” and that the algorithm could, therefore, retrieve seven characteristics of the aerosol particles. This might be AOD plus six constraints on the particle size distribution, shape, absorption, and aerosol layer height. In practice, this is not the case, as, for instance, over ocean, there is variable ocean color due to chlorophyll blooms and other hydrosols. Because this variability so highly affects blue wavelengths, the 0.47 µm channel cannot be used for retrieval. Even with the remaining wavelengths (0.55 µm, 0.66 µm, 0.86 µm, 1.24 µm, 1.63 µm, and 2.11 µm), the available pieces of information are fewer than six, as the information from each wavelength is not independent [37]. As it turned out, the DT algorithm over ocean is able to retrieve the AOD at one wavelength (chosen to be 0.55 µm) and then provide one or two constraints on the size distribution [13].
The LUT was created with four fine modes and five coarse modes, where each is an independent lognormal single mode size distribution with assigned complex refractive index. The terminology fine and coarse mode indicated modal radii in the submicron (i.e., <1 µm) and supermicron (i.e., >1 µm) ranges, respectively, although noting the tails of each mode would overlap. The aerosol models used to represent the single fine and coarse modes for the LUT calculations were based on existing literature [38], modified by field experiment results [39,40] and early AERONET inversion products [14,41,42,43]. Operationally, the algorithm matches one fine (out of four) and one coarse mode (out of five), iterating through each of 20 combinations of fine and coarse modes, while adjusting the number of particles in each mode. The “solution” is represented by the combination (or combinations) of fine and coarse modes that most closely match(es) the observed spectral reflectances at the top of atmosphere. The two modes and the relative weight between the two constitute the retrieved size distribution. The governing equation in the LUT is shown in Equation (1),
ρ λ = η ρ λ f + ( 1 η ) ρ λ c ,
where ρλ* is the top of atmosphere reflectance at wavelength, while the superscripts f and c indicate fine mode and coarse mode, respectively.
The parameter is the “fine-mode weighting” FMW or “fine-mode fraction” (FMF). Note that η is defined by weighting of reflectances, not by AOD. The LUT is then created, indexed by AOD at 0.55 µm for all wavelengths of reflectance. The parameter, as defined, is not wavelength-dependent. η represents the actual relative sizes of the particle volume in each lognormal mode. The appendix in [16] shows that η is also the ratio of the fine-mode AOD at 0.55 µm to the total AOD at 0.55 µm, assuming single scattering. The parameter has proven to be a useful indicator of particle size and type within the context of the DT products [44,45,46], and it correlates with other retrieval products of similar, but not exactly the same definition [47]. However, the parameter is tightly bound to the construction of the DT algorithm. Its climatological statistics vary with nuanced changes in either the algorithm or instrument calibration [48,49], and the translation of η from a weighting of reflectances to a weighting of AOD will break down as aerosol loading increases and the assumption of single scattering breaks down.
The conclusions in [37] assuming the single scattering approximation indicate that AOD and η are the two main products of the ocean retrieval, and that, if one mode dominates the size distribution, there is sufficient information to also retrieve the effective radius of the dominant mode. The algorithm is not sensitive to all other parameters of the aerosol: other details of the size distribution, complex refractive index, degree of nonsphericity, or aerosol layer height. This does not mean that uncertainty cannot be introduced into the retrieval by these other factors, but it does mean that the algorithm cannot retrieve these other parameters with any skill. Understanding these strengths and weaknesses of the information content and retrieval proved to be essential in constructing a robust operational algorithm. In addition to reconciling ourselves to the limitations of information content, we also had to accept that the inversion did not result in a unique solution. There could be multiple combinations of modes that could produce spectral reflectance at the top of the atmosphere that would match satellite-measured values equally well. To choose the best solution that was only slightly better than the second best solution did not necessarily provide the most useful description of aerosol parameters. Operationally, the algorithm reported both the “best” solution and the “average” of all solutions that met minimum matching requirements. In testing the algorithm and retrieval, the “average” solution was identified as the more robust of the two, and all statistics, climatology, and validation of the ocean aerosol algorithm were based on the results of the “average” solution.
The proto-ocean algorithm was first tested with observations from the MODIS Airborne Simulator (MAS) [50], where the results showed promising quantification of smoke plumes over the ocean [13,51]. A few years later, the Tropospheric Aerosol Radiative Forcing Observational Experiment (TARFOX) field experiment [52], which took place more than three years before Terra launch, provided a more comprehensive pre-launch test of the ocean aerosol algorithm. In that experiment, the NASA ER-2 aircraft flew at high altitude (20 km) collecting spectral imagery that would mimic MODIS measurements to use as input to the proto-algorithm [39]. Other aircraft flying at low altitude provided ground truth for verifying the retrieval [53,54]. Of particular importance was the Ames Airborne Tracking Sunphotometer [55,56] flying on the University of Washington C131-A aircraft that measured the spectral dependence of the AOD over the ocean, but below the aerosol layer. Moreover, there was a ship sailing with an AERONET sunphotometer on board and a station on the island of Bermuda that provided additional validation data [52]. Spectral AOD retrieved from MODIS-like imagery at high altitude could be compared with the low-altitude measurements. For a majority of the passes across several days of flights, the proto-algorithm showed that it could match the ground truth across the spectrum [39] (see Figure 1). There were a few situations where the match was less than optimal, which caused us to make modifications to the algorithm, mostly in terms of expanding the glint mask. Masking for clouds, glint, etc. is addressed in Section 5.1 and Section 5.2.
The key elements contributing to a successful aerosol over ocean algorithm were as follows:
  • Basing the retrieval in physical understanding of aerosols, as well as their environment and radiative transfer.
  • Avoiding the blue channel in the retrieval to minimize uncertainty introduced by ocean color.
  • Understanding the limitations of the information content and designing a simplified retrieval based on these limitations, but with sufficient flexibility to find the right solution.
  • Introducing the new parameter, which proved to be the key for many subsequent applications using the MODIS DT product [44,57].
  • Accepting that the algorithm produced non-unique solutions and adapting expectations to make use of the multiple solutions.
  • Using new total, column ambient measures of aerosol optical properties to modify the assumptions in the LUT.
  • Developing and testing the algorithm from field experiment data, especially making use of over-ocean measurements of spectral AOD from sunphotometers on aircraft, ships, and islands.
The ocean algorithm proved to be exceptionally robust, requiring only cosmetic changes in the 20 years since launch. The same basic algorithm continues to produce highly accurate operational aerosol products over the global oceans from the MODIS instrument aboard NASA’s Terra and Aqua satellites, as well as the Visible Infrared Imaging Radiometer Suite (VIIRS) instrument aboard NOAA’s Suomi-NPP and NOAA-20 polar-orbiting satellites, and it has been adapted for nonoperational purposes using inputs from instruments on geostationary satellites including NOAA’s Advanced Baseline Imager (ABI) on the Geostationary Operational Environmental Satellite (GOES)-East and GOES-West and the Advanced Himawari Imager (AHI) on the Japan Meteorological Agency’s Himawari-8 satellite.

3.2. Retrievals of Aerosol Loading over Land

Over land, there was no precedent for a global operational aerosol product from AVHRR, as there was for the ocean retrieval. Instead, the new algorithm was inspired by a prior study [58] that made use of dark dense vegetation (DDV) to quantify the aerosol loading. In that early study, both the surface reflectance of the DDV targets and the aerosol optical properties were given a priori assumed values. For an operational algorithm to have global validity, those rigid assumptions would require greater flexibility. There were two significant innovations that made an operational global over-land aerosol retrieval possible: (1) parameterization of the land surface reflectance, and (2) development of total column, ambient, and aerosol optical models [12].

3.2.1. Over-Land Surface Parameterization

The land surface reflectance parameterization was based on an observation that there is a physical connection between light absorption in visible (VIS) wavelengths involved in photosynthesis (blue and red) due to specific pigments and the light absorbed by liquid water in the shortwave infrared (SWIR) in vegetation. The pigments are dissolved in liquid water in the plant leaves. Therefore, where there is photosynthesis occurring, vegetation is green, due to absorption in the blue and red by pigments, and dark in the SWIR, due to absorption by the corresponding liquid water in the leaf. Furthermore, non-vegetated surfaces appear darker to the eye (in visible) when wet, because of changes to the refractive index when water fills in between the soil or sand grains, again linking light absorption in the visible to the SWIR. Other factors contribute to reinforcing this relationship between the VIS and SWIR, including shadowing, especially in plant canopies, that darkens the scene throughout the reflective spectrum. This physically based hypothesis was tested and refined using the 3.75 µm channel on AVHRR for the SWIR wavelength [59], from Landsat Thematic Mapper images, from data collected by the NASA Airborne Visible InfraRed Imaging Spectrometer (AVIRIS) imager now using 2.2 µm for the SWIR [60], and from spectrometer data collected by hand from low-flying light aircraft [61]. The relationship was also supported by theoretical analysis [62]. The result of this work allowed the surface visible reflectance to be parameterized by the surface reflectance in the SWIR. At launch, this parameterization was a simple rsfc0.47 = 0.25 rsfc2.1 and rsfc0.66 = 0.50 rsfc2.1, where rsfc0.47, rsfc0.66, and rsfc2.1 are the surface reflectances at 0.47 µm, 0.66 µm, and 2.1 µm, respectively.
Later, we used surface reflectance derived from top-of-atmosphere MODIS measurements atmospherically corrected from collocated AERONET measurements to confirm and modify this simple parameterization [19]. Today, we can obtain tens of thousands of ordered pairs (VIS, SWIR) of surface reflectances using atmospheric correction at each of hundreds of AERONET stations distributed globally over a broad dynamic range of surface conditions. Using previously unpublished data, Figure 2 demonstrates the relationship between the surface red (0.66 µm) reflectance and the surface SWIR (2.11 µm) reflectance from atmospherically corrected Aqua-MODIS measurements collocated with AERONET from 2015–2019. The data cover the range in SWIR normalized difference vegetation index (NDVISWIR) from highly vegetated (>0.70) to bare surfaces (<0.15). NDVISWIR is defined as
NDVI SWIR = ( ρ 1.24 ρ 2.11 ) / ( ρ 1.24 + ρ 2.11 ) ,
where r*1.24 and r*2.11 are the top-of-atmosphere reflectances at 1.24 µm and 2.11 µm. In Figure 2, we see that, even when using modern data and a different technique, we still arrive at a relationship between VIS and SWIR surface reflectance that is very close to the at-launch parameterization.
The advantage to using SWIR is that aerosol scattering is much reduced at longer wavelengths for submicron aerosol particles, and, even for larger particles such as dust, the wavelength is less sensitive to the aerosol than in the VIS. The original idea was to use the SWIR band to characterize the surface reflectance, and then apply that information to the blue and red bands in the VIS. The algorithm would employ simple single channel retrievals in the blue and red bands, using the surface reflectance derived empirically from the SWIR to act as the bottom boundary condition in the radiative transfer equation. The second-generation over-land algorithm replaced the single-channel retrievals with a three-channel inversion (0.47 µm, 0.66 µm, and 2.1 µm), but it continued to incorporate similar empirical surface reflectance parameterizations.
At the time of Terra launch, the use of SWIR to parameterize surface reflectance in the VIS was extremely innovative. It allowed a global operational retrieval to begin producing aerosol products at launch. There was no need to acquire a global database of land surface reflectance over several years, and it automatically corrected for seasonal or land-use changes. Although the simple empirical relationships developed from early aircraft measurements and later expanded using atmospherically corrected MODIS reflectance may represent “average” global conditions, they do contain significant scatter around those averages. Applying new dependencies on scattering angle and vegetation index only cuts the scatter marginally. Other algorithms that constrain surface reflectance by means of a database or that require temporal stability over a finite time period can outperform the DT land retrieval, suggesting that, as we move forward, this method that was highly innovative 20 years ago may not be the best choice for applications where the land surface can be well known using a priori information.

3.2.2. Over-Land Aerosol Optical Models

The second innovation of the original DT aerosol retrieval over land was the development of new dynamic aerosol models for the LUT calculations. These models were based on the fledgling inversions of ground-based radiometer measurements of the angular sky radiance [40,63,64,65]. By dynamic, we mean that the aerosol optical properties were indexed by a total column parameter, such as AOD, and allowed to vary in optical properties as a function of that index. In this way, the aerosol optical properties for a certain location would be represented by a certain set of properties (size, shape, complex refractive index) for low aerosol loading and another set of properties for high aerosol loading. For a site dominated by water soluble sulfates, for example, the optical properties would change as the particle swelled with humidity, becoming larger and more dilute. Because the optical properties were derived from optical measurements of the whole column in ambient conditions, we could avoid all the angst of determining species type, mixing rules, and vertical profiles. The method side-stepped all of the chemistry and all of the issues of in situ measurements [66] that were irrelevant for creating optical property inputs for radiative transfer calculations of the LUT.

3.2.3. Over-Land Algorithm Synthesis

As with the over-ocean aerosol algorithm, the over-land algorithm was tested from airborne imagery during field experiments. These were primarily the Smoke/Sulfates, Clouds, and Radiation field campaigns, conducted over the Atlantic (SCAR-A), in California (SCAR-C), and in Brazil (SCAR-B) in 1993, 1994, and 1995, respectively, as well as during TARFOX in 1996. These experiments combining high-altitude imagers to simulate future MODIS measurements with low-altitude and ground-based measurements created a rich database to explore the surface reflectance parameterizations, the dynamic aerosol models, and the structure of the new algorithm [12,13,39,60,64,65,66,67,68]. There would be a functional operational algorithm for producing AOD over global land for the first time at Terra launch. This success was based on the following:
  • Basing the retrieval in physical understanding of aerosols, their environment, and radiative transfer.
  • Limiting the retrieval to only dark targets, where contrast with overlaying aerosol was strongest and error propagation of poor surface reflectance assumptions was smallest.
  • Avoiding rigid a priori assumptions as much as possible and instead using empirically derived dynamic relationships for surface reflectance and particle optical properties.
  • Using new total column ambient measures of aerosol optical properties to create the LUT.
  • Collecting a test bed of imagery and ground truth from a series of field experiments to derive the dynamic relationships in relevant environments.
The at-launch over-land algorithm was the first of its kind and provided the aerosol and climate community with unprecedented views of the total global aerosol system. It soon also caught the eye of the air-quality community. However, the product had flaws that slowly became apparent after launch. It was susceptible to subpixel snow contamination, especially in the spring thaw of the northern hemisphere, and its spectral and particle size information products were not reliable in the same way that similar products from the ocean algorithm were. There have been a series of add-ons and changes to the over-land algorithm over time, but the basic premise of the algorithm has persisted for 20 years.

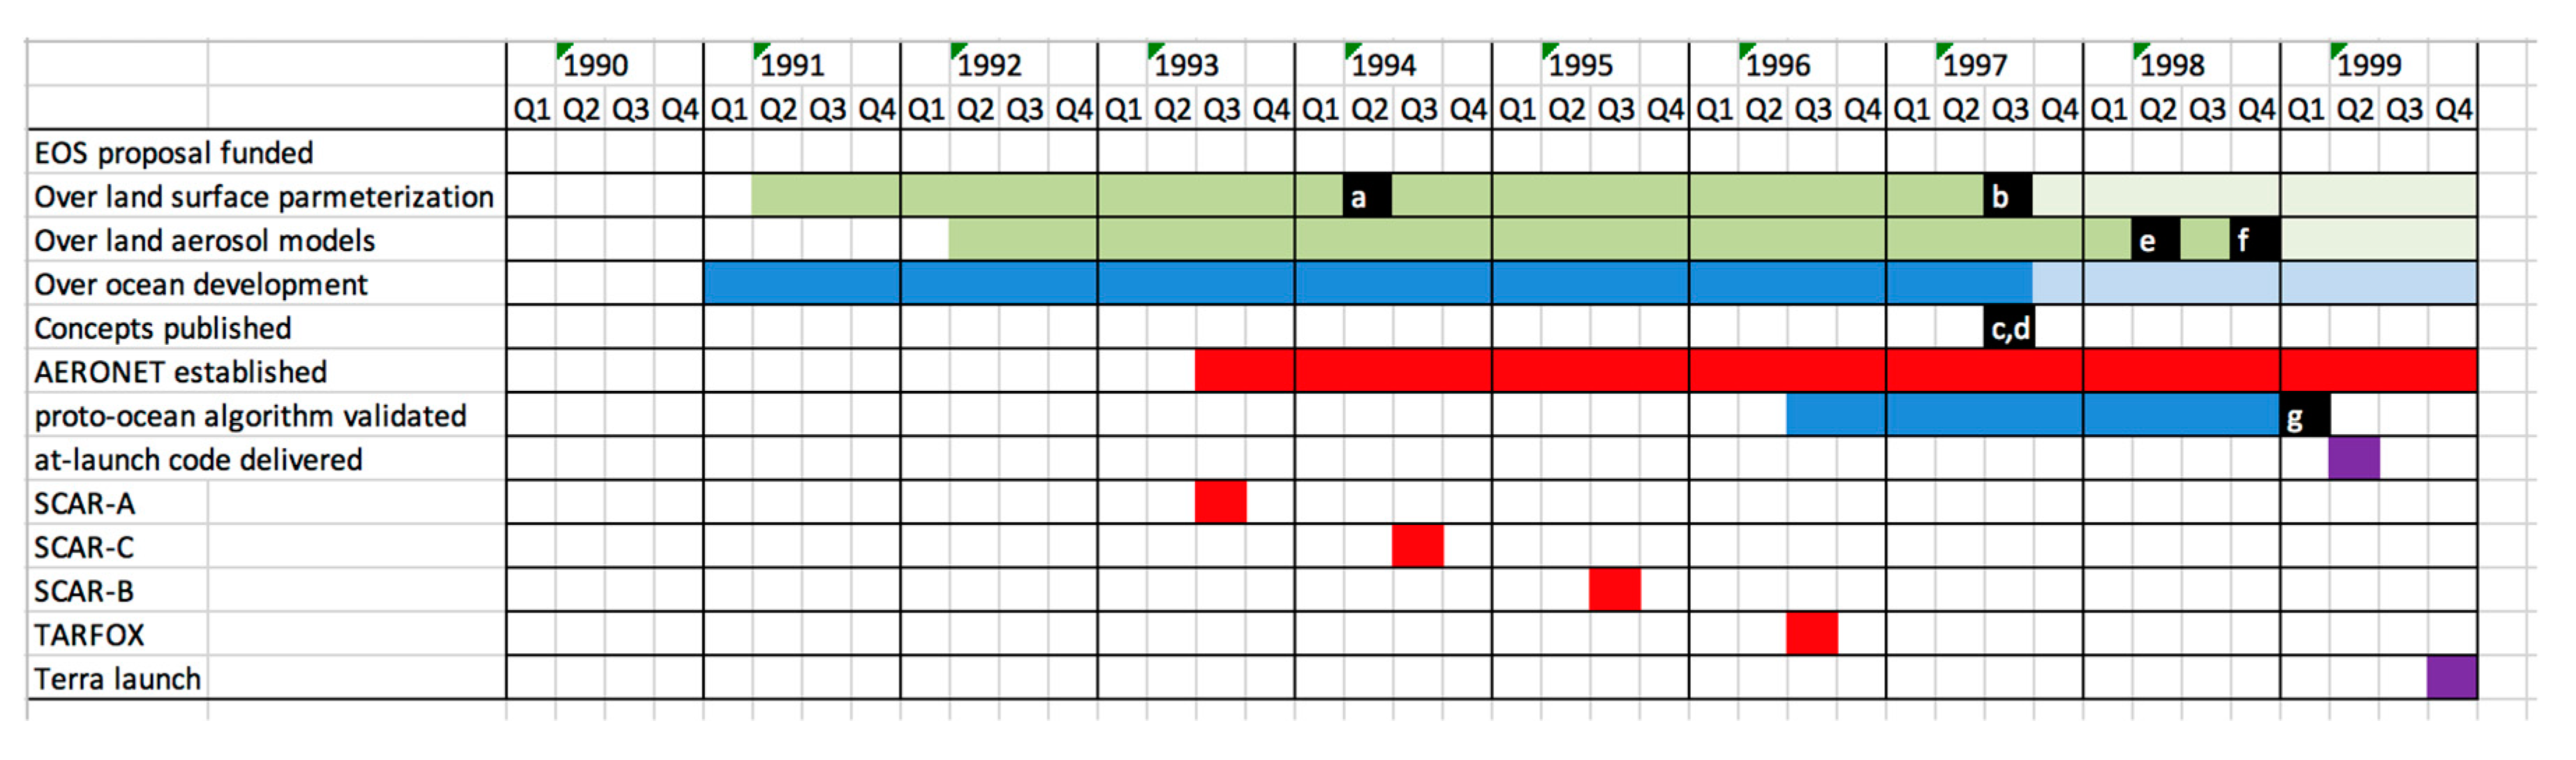
3.3. The Decade of Algorithm Development

During the development period (1990 to 1999), previous experience and fundamental understanding of radiative transfer combined to create the concepts that would become the at-launch DT algorithm. The three primary areas of focus were surface parameterization and aerosol models over land, and the production of a comprehensive inversion over ocean. The AERONET program began at about the same time that work began on the MODIS aerosol algorithm, and the deployment of AERONET stations during the four field experiments in conjunction with the airborne spectral imagers (MODIS Airborne Simulator (MAS) and AVIRIS) played a key role in all aspects of the development including validation of the ocean proto-ocean algorithm following TARFOX. The major creative periods each leading to a major milestone culminated in a seminal publication, which were followed by a less intense, but continued effort of testing, modifications, and adjustments in preparation for Terra launch. Figure 3 illustrates this first decade of DT development.
The decade of development ended with Terra launch at the end of 1999. After a commissioning phase, MODIS Terra began sending data and the DT algorithm began producing aerosol products. Figure 4 illustrates the view of the global aerosol system after the first full year of Terra MODIS DT data production. The most notable addition from the heritage products was the extension of the aerosol characterization over land, but the use of the fine-mode fraction (η) also allowed a clear distinction of dust (greenish hues) from smoke/pollution (red) when aerosol loading rose above background levels. The products were delivered at two levels. Level 2 offered geolocated but ungridded aerosol products along the orbital swaths of the instrument. These were the nominal 10 km products, available once per day. Level 3 delivered the statistics of the Level 2 product by aggregating the data to a stable 1° equal-angle latitude–longitude grid [69]. Level 3 products are available as daily, eight-day, or monthly means. The 1° Level 3 data simplified the ability to make use of the data products, and systems set up for on-line visualization, analysis, and download encouraged early adoption of the products for a variety of applications [70]. Note that Figure 4 was constructed from Level 2 data and not from Level 3.

4. Validation: Building Confidence

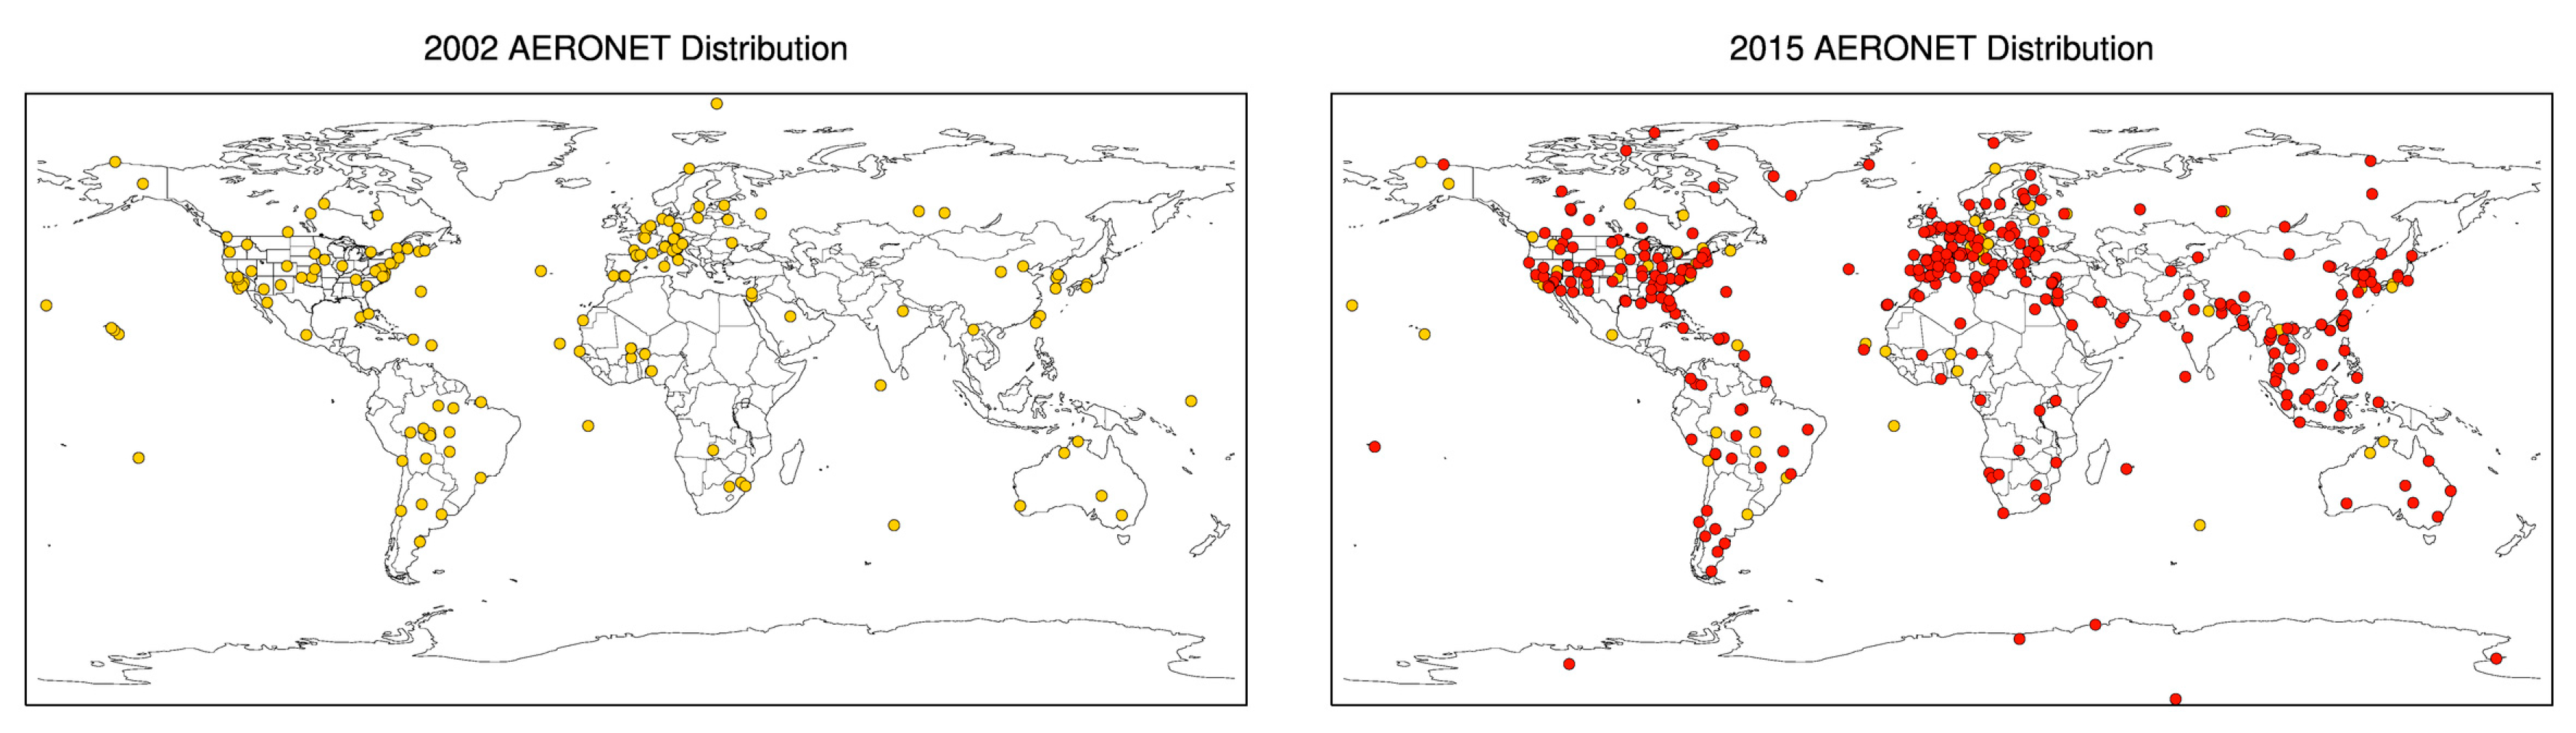
4.1. Validation Strategy and Infrastructure

Fundamental to the aerosol algorithm developed for the MODIS sensors was the creation of a means to validate the products once they were being produced operationally. The primary form of that validation would prove to be the AERONET network of autonomous upward-looking sun/sky radiometers [14,41,42,71,72,73,74]. AERONET began to play a major role in the DT algorithm development even before launch, as the sky inversion parameters provided the information for the algorithms’ optical properties in the calculations of the LUTs, and the sun products served as validation for proto-algorithms applied to imagery from high-altitude airborne radiometers.
The ability to test the algorithm before launch in mission-relevant situations with high-quality ground truth allowed us to evaluate the algorithm and to project forward expectations of the final products’ uncertainty [75]. Thus, the Dark Target team met the first post-launch products already with expectations of how well those products should match ground truth. Expectations were based on both theoretical analysis [12,13] and field experiment results [39,68,75]. For AOD, the at-launch expected uncertainty or “error” for ocean was ±0.03 + 5% of AOD and that for land was ±0.05 + 15% of AOD [16]. To the DT team, this meant that we should expect 66% of the collocations between satellite and ground truth to have differences in AOD within those error bars. Over the years, “expected error” has been invoked by the team in two ways. First, products produced by new versions of the algorithm are always evaluated against previous expectations. Percentage falling within expected error (%EE) has become an essential validation metric used by the DT team [15,16,76,77] and adopted by many other aerosol remote sensing teams around the world [78,79,80,81,82]. Second, the expected error bars themselves have been evaluated and adjusted through the decades as algorithms change and validation datasets expand. For example, error bars were increased to ±0.05 + 20% of AOD over land for the new 3 km product [17], while the standard 10 km error bars have maintained consistency over land for 20 years [15,20]; however, over ocean, the comparison with AERONET AOD is best represented with error bars (+0.04 + 10 %; −0.02 + 10 %) that have increased the relative error from pre-launch estimates and that also denote the asymmetrical absolute error. Retrieved AOD is more likely to be slightly higher than slightly lower. In the validation we describe below, we specify the error bars used when reporting the metric %EE.
The AERONET direct-sun observations were utilized because of their inherent accuracy (AOD within ±0.02 at most wavelengths), as well as their versatility (could be installed in remote environments and only required minor maintenance). Note that direct-sun observations can validate spectral AOD and Angstrom exponent, but the over-ocean effective radius and fine-mode fraction products would require comparison with inversions of AERONET sky radiance [41,42,43] or the AERONET spectral deconvolution algorithm (SDA) [83]. The SDA product provides a parameter inverted from the direct sun measurements similar to, but not exactly the same as, the DT ocean algorithm h parameter or fine-mode fraction (FMF). These AERONET SDA products offer another means to evaluate the DT ocean aerosol size retrieval [47]. We note, however, that both AERONET sky radiometry retrievals of aerosol particle effective radius and direct-sun SDA FMF parameters are themselves inversions. They can provide a valuable constraint on the satellite products but are not the same robust validation as can be achieved by comparing the satellite products to the direct-sun measurements.
Collocating MODIS-retrieved AOD with measurements from the stationary AERONET instruments required consideration of how the aerosol was observed by each instrument system. The MODIS product is a snapshot in time, having a spatial resolution of 10 × 10 km at nadir, but increasing to 20 × 40 km at the edges of the swath. AERONET represents the aerosol at a point on Earth’s surface (ignoring the angle of observation) but measures approximately every 15 min. Therefore, the validation effort had to assume that there could be a match between the spatial statistics of the MODIS retrieval and the temporal statistics of the AERONET measurements [84]. After comparing average AOD values at different MODIS array sizes with coincident AERONET average AOD for a 1 h time period at representative locations around the globe, we found the most robust solution to be using an array of 5 × 5 MODIS retrieval boxes (approximately ±25 km from the center box) with ±30 min of AERONET observations. The physical justification was that, since global average wind speeds are approximately 6−7 m/s, aerosol could be traveling ±25 km in the ±30 min. Rarely would a collocation occur when all 25 MODIS retrieval boxes in the 5 × 5 domain reported an AOD value or the AERONET time series consisted of all four or five observations. Clouds, inappropriate surfaces, and land/ocean coastlines would prevent a DT retrieval or AERONET observation from taking place in particular retrieval boxes within the 5 × 5 collocation square. A collocation without representative population in either the MODIS spatial domain or the AERONET temporal domain would render the match invalid. A valid match required retrievals from at least five of the 25 MODIS retrieval boxes and reports from at least two of the five possible AERONET observations. The same match-up criteria could be used for both land and ocean retrievals, as coastal stations would have a good portion of their surrounding 5 × 5 retrieval boxes over the ocean. The validation infrastructure, later called the Multisensor Aerosol Products Sampling System (MAPSS) [85], was a sophisticated investment of resources, requiring nearly as many lines of software code as the algorithm itself. Initially designed for validation of the DT algorithm, MAPSS evolved into a community resource, expanding to incorporate aerosol retrievals from other satellite sensors [85]. Eventually, it became part of the Giovanni analysis infrastructure [86]. The validation, more than anything, encouraged the community to embrace the products. Without AERONET, the close collaboration between the MODIS and AERONET teams, and the investment into MAPSS, it would have taken much longer for the MODIS aerosol products to find acceptance across multiple communities and applications.

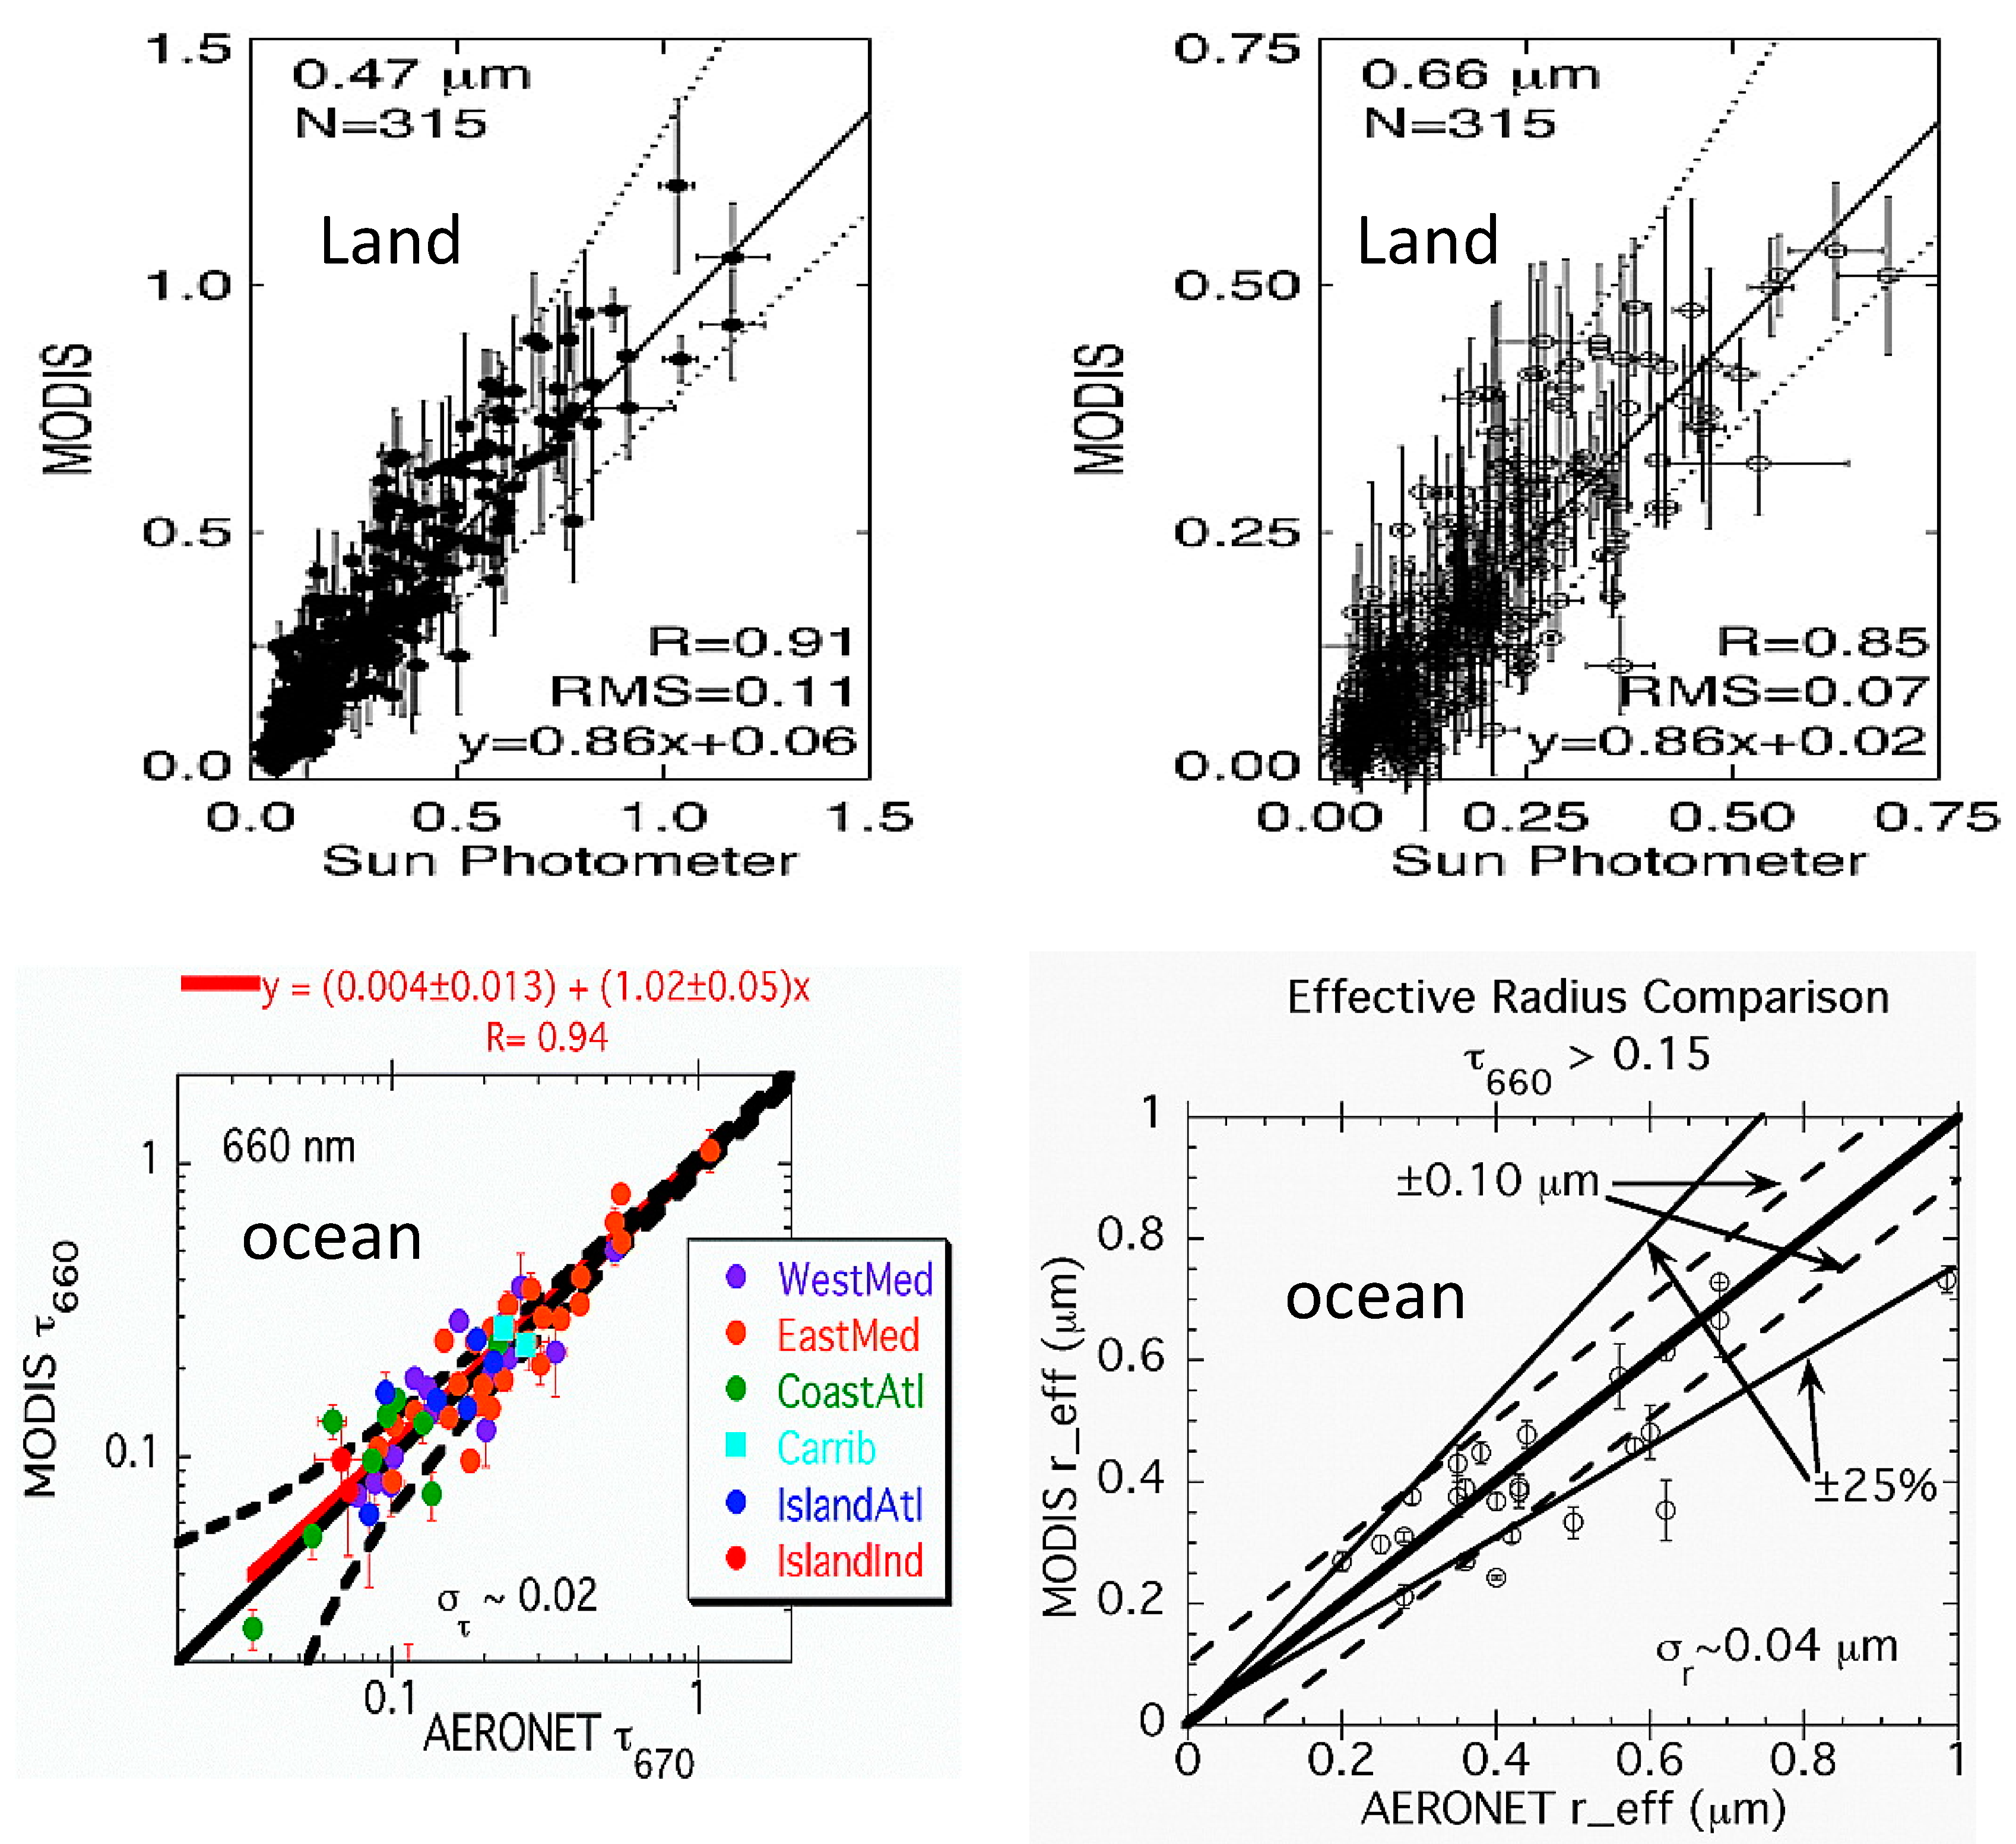
4.2. Earliest Validation

Figure 5 shows the earliest publication of validation for the Dark Target aerosol algorithm [87,88]. At that time from the entire global database, there were 315 collocations over land and 64 collocations for AOD over ocean but only 25 ocean collocations for effective radius, as we required AOD > 0.15 for a valid retrieval of particle size. The results show high fidelity of the new retrieval to simultaneous AERONET measurements. Over land, correlations (R) were 0.85 to 0.91, depending on wavelength, root-mean-square error (RMSE) = 0.07 to 0.11, regression slope 0.86, and intercepts 0.02 to 0.06. This was a remarkable result for the first over-land operational aerosol retrieval. Over ocean, the statistics were even better for AOD, and the retrieved effective radius gave indication that it could match AERONET sky inversion products to within ±0.10 µm. We note that, for effective radius, we are matching one inversion to another inversion, which is different than the validation against direct-sun measurements for AOD. The points shown in Figure 5 represent collocations from all over the globe, in all types of aerosol conditions, and demonstrate the power of MODIS–AERONET match-ups to build confidence in the satellite product.
There have been dozens of published studies showing validation of the MODIS DT products against AERONET, mostly using a form of the original spatiotemporal collocation methodology. The following list is only a small sample emphasizing some of the earliest and latest papers: [15,16,47,87,88,89,90,91,92,93,94,95,96,97,98,99,100,101,102,103,104,105,106,107,108,109,110,111]. The most recently published validation focuses on East Asia, China, and specific localities within China, with the exception of [98]. That specific paper better resembles the earlier studies and takes a more global perspective.

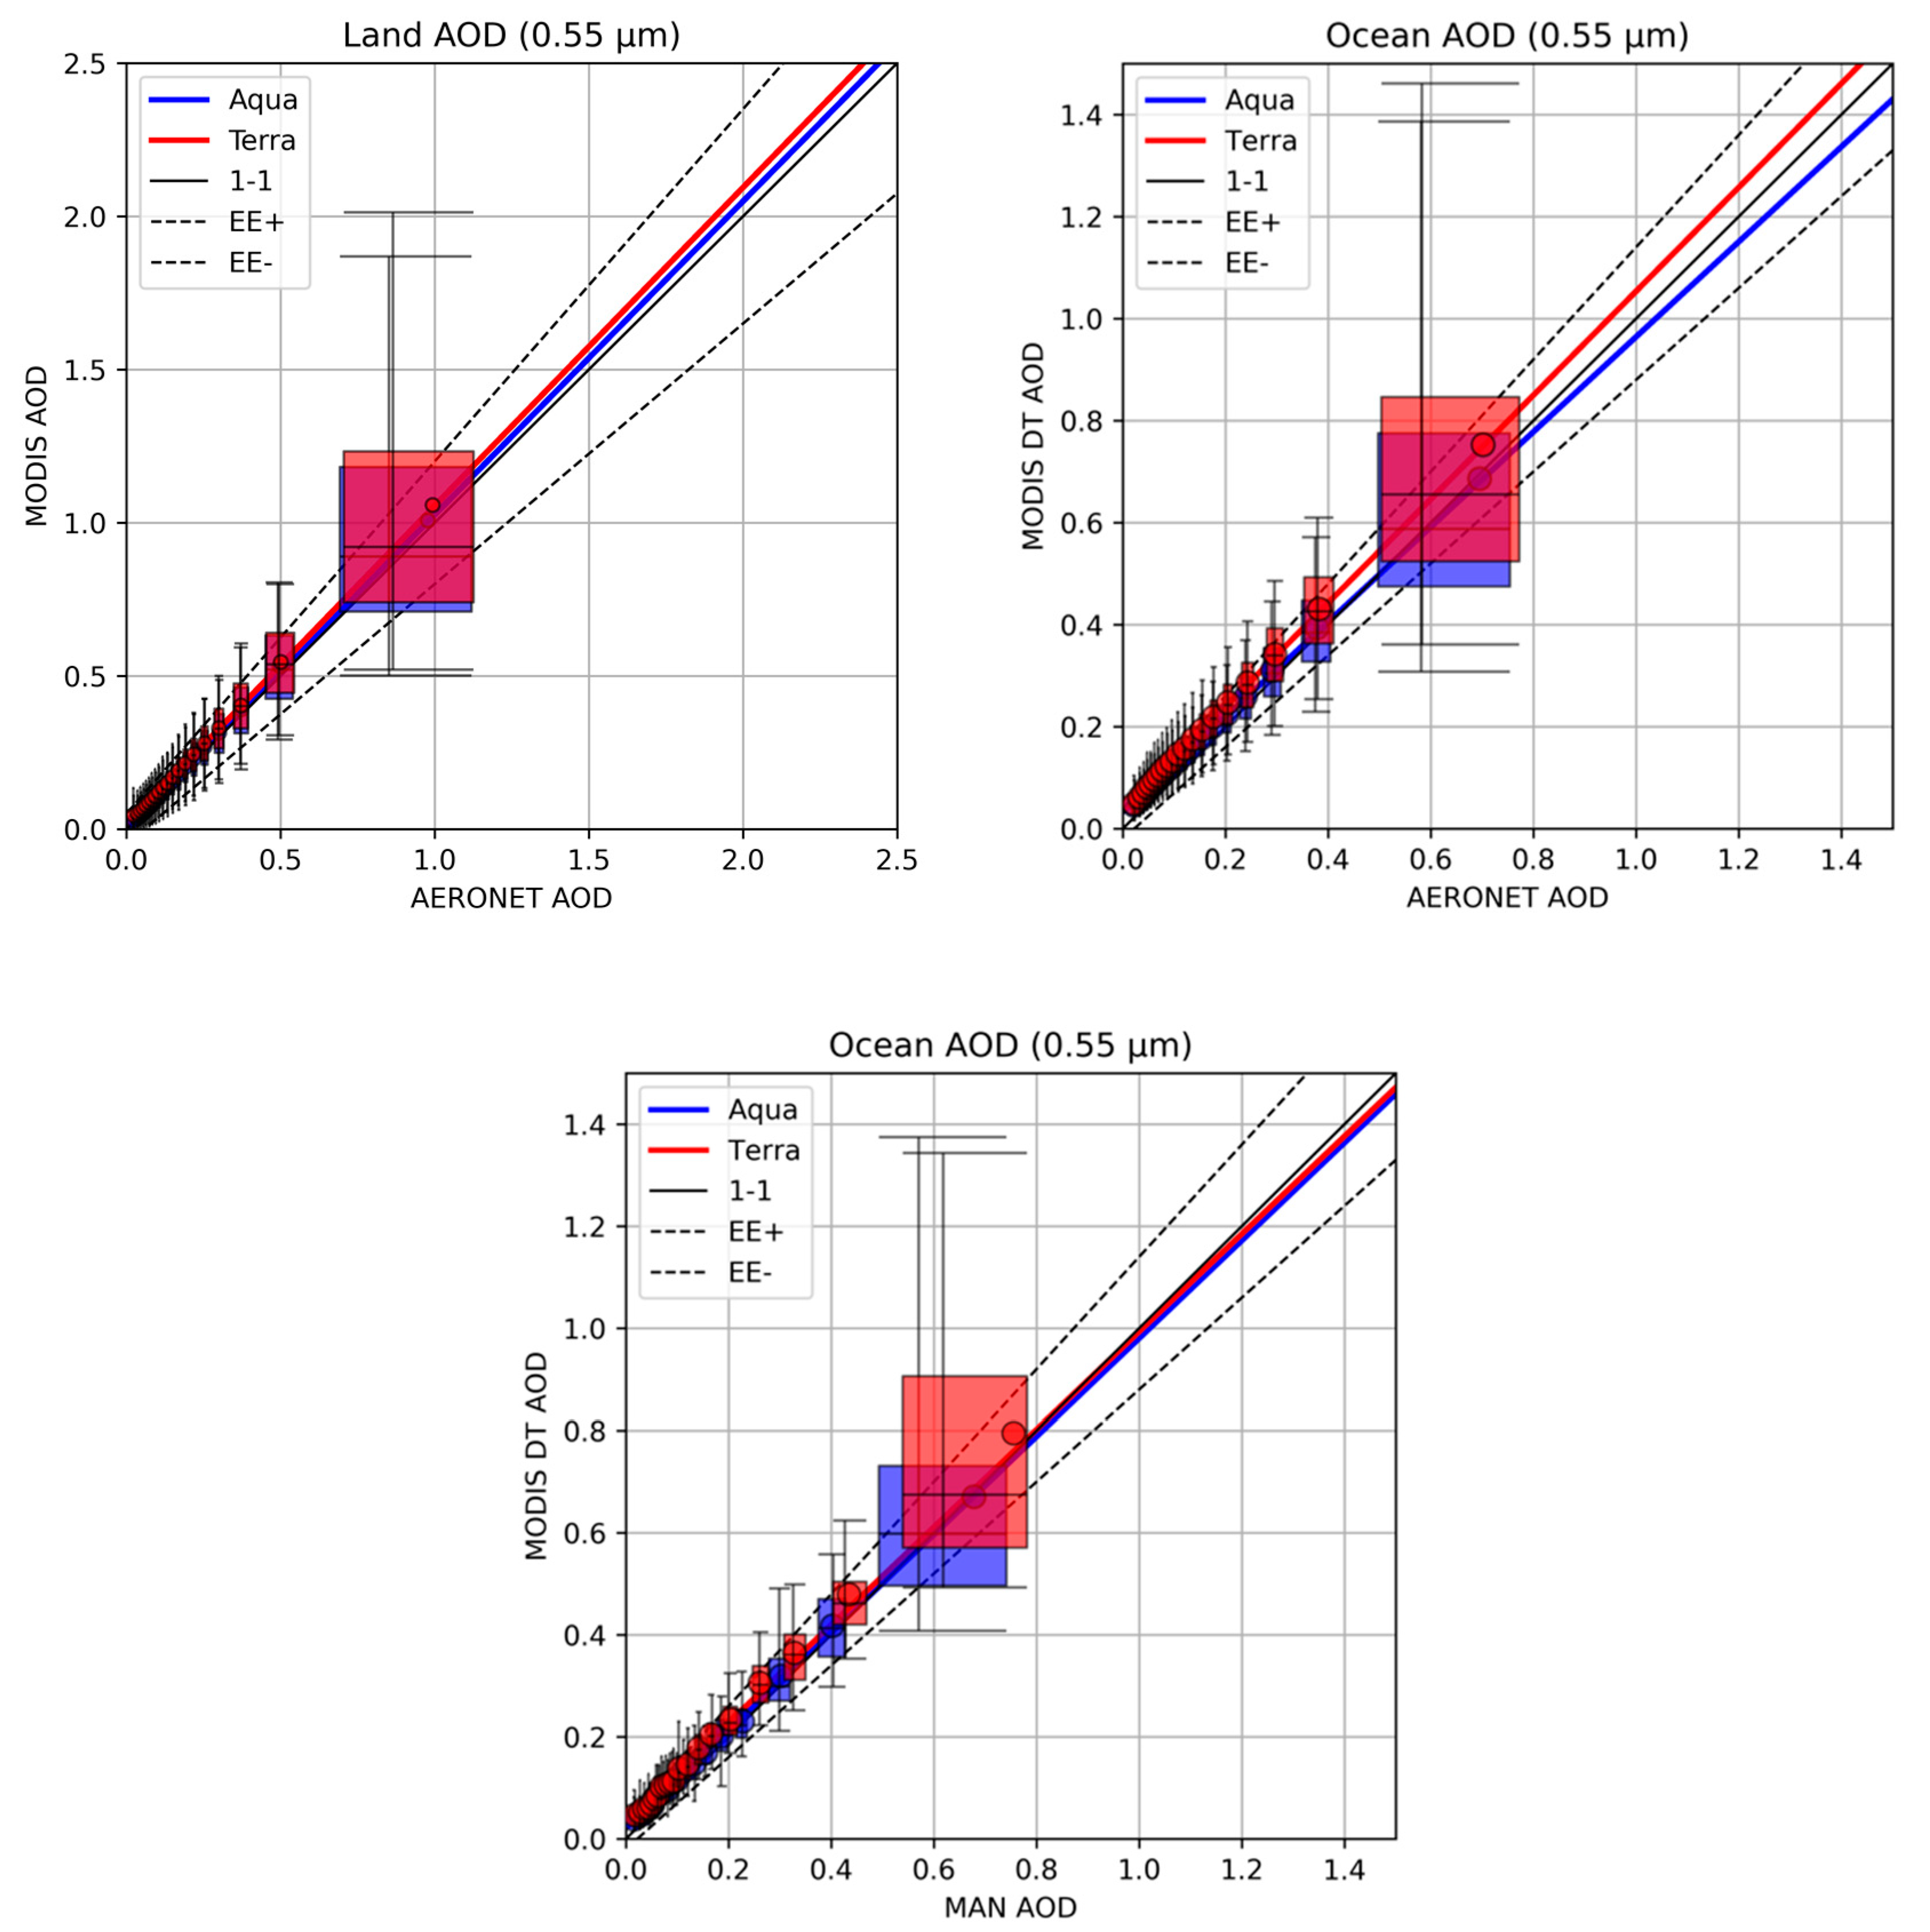
4.3. Present Day Validation

The network of a few AERONET sensors in 1998 has grown to at least 370 active sites today (August 2020). Coupled with the increase in sites, there have been improvements regarding calibration and algorithms (gas corrections, sun-pointing accuracy, cloud-screening, etc.) leading to AERONET Version 2 in the mid-2000s [112] and the Version 3 we have today [74]. In addition to improving the network of “fixed” AERONET sites on land and coastal platforms, the AERONET team developed the Marine Aerosol Network (MAN), which uses handheld devices on mobile ship (cruise and experiment) platforms [73]. With MAN, we have learned to evaluate the satellite aerosol retrievals in remote oceans by accounting for slowly moving platforms. Before MAN validation, offshore validation efforts relied on airborne sunphotometers during specific short-term field experiments [39,89,91,113,114,115,116,117]. In addition to MAN, AERONET introduced the concept of the Distributed Regional Aerosol Gridded Observation Network (DRAGON). This is an array of relatively short-term AERONET stations deployed across a region in a grid with spatial resolution of approximately 10 km [118]. The DRAGONs provide insight into aerosol gradients and the process at a mesoscale level, but they also allowed confirmation that the DT product was accurately representing those gradients [76,78,102].
Figure 6 shows the most recent validation of the MODIS DT C6.1 product against AERONET and MAN (unpublished). Validation metrics are shown in Table 1. The match-up method is slightly different from how it was done in 2002. Currently, we are still using ±30 min of MODIS overpass but defining a circle of 27.5 km radius around the AERONET station for the MODIS spatial statistics instead of using a “square” of 5 × 5 retrieval boxes. The temporal average of AERONET observations within the collocated window and the spatial average of MODIS pixels within the spatial collocation are applied. We require that the MODIS quality assurance flag (QA) be QA > 0 over ocean and QA = 3 over land. The averaging requires that at least 20% of valid MODIS pixels exist within the 27.5 km circle and at least two AERONET observations are within the temporal window. In addition to validating the over-ocean AOD from coastal ground-based AERONET sites, as we did in 2002, we can now collocate MODIS products with MAN sites over open ocean. The validation against MAN shows that the DT AOD over-ocean data are almost on the 1:1 line. Correlation coefficients are 0.92 and 0.96, with median bias values are 0.022 and 0.013, with regression slopes of 0.96 and 0.96 and intercepts of 0.036 and 0.021, for Terra and Aqua, respectively.
These results show that the DT AOD product continues to match AERONET values well, with not much overall change in the validation statistics from 2002, despite increasing the number of collocations by three orders of magnitude. The MAN validation provides assurance that coastal stations are not inherently biased from the situation over open ocean. The modern AOD is biased slightly high as compared with AERONET, more so over ocean than land, and Terra is biased high as compared with Aqua.
While the basic validation methodology has remained the same for 20 years, the analysis has expanded to include bias statistics as functions of various parameters, and more emphasis is placed on noting the percentage of retrievals that fall within expected errors. Varying collocation methodology can make a difference to results, but not enough to change overall conclusions, except when attempting to establish accuracy of a finer-spatial-resolution product to resolve fine-resolution variability [17].

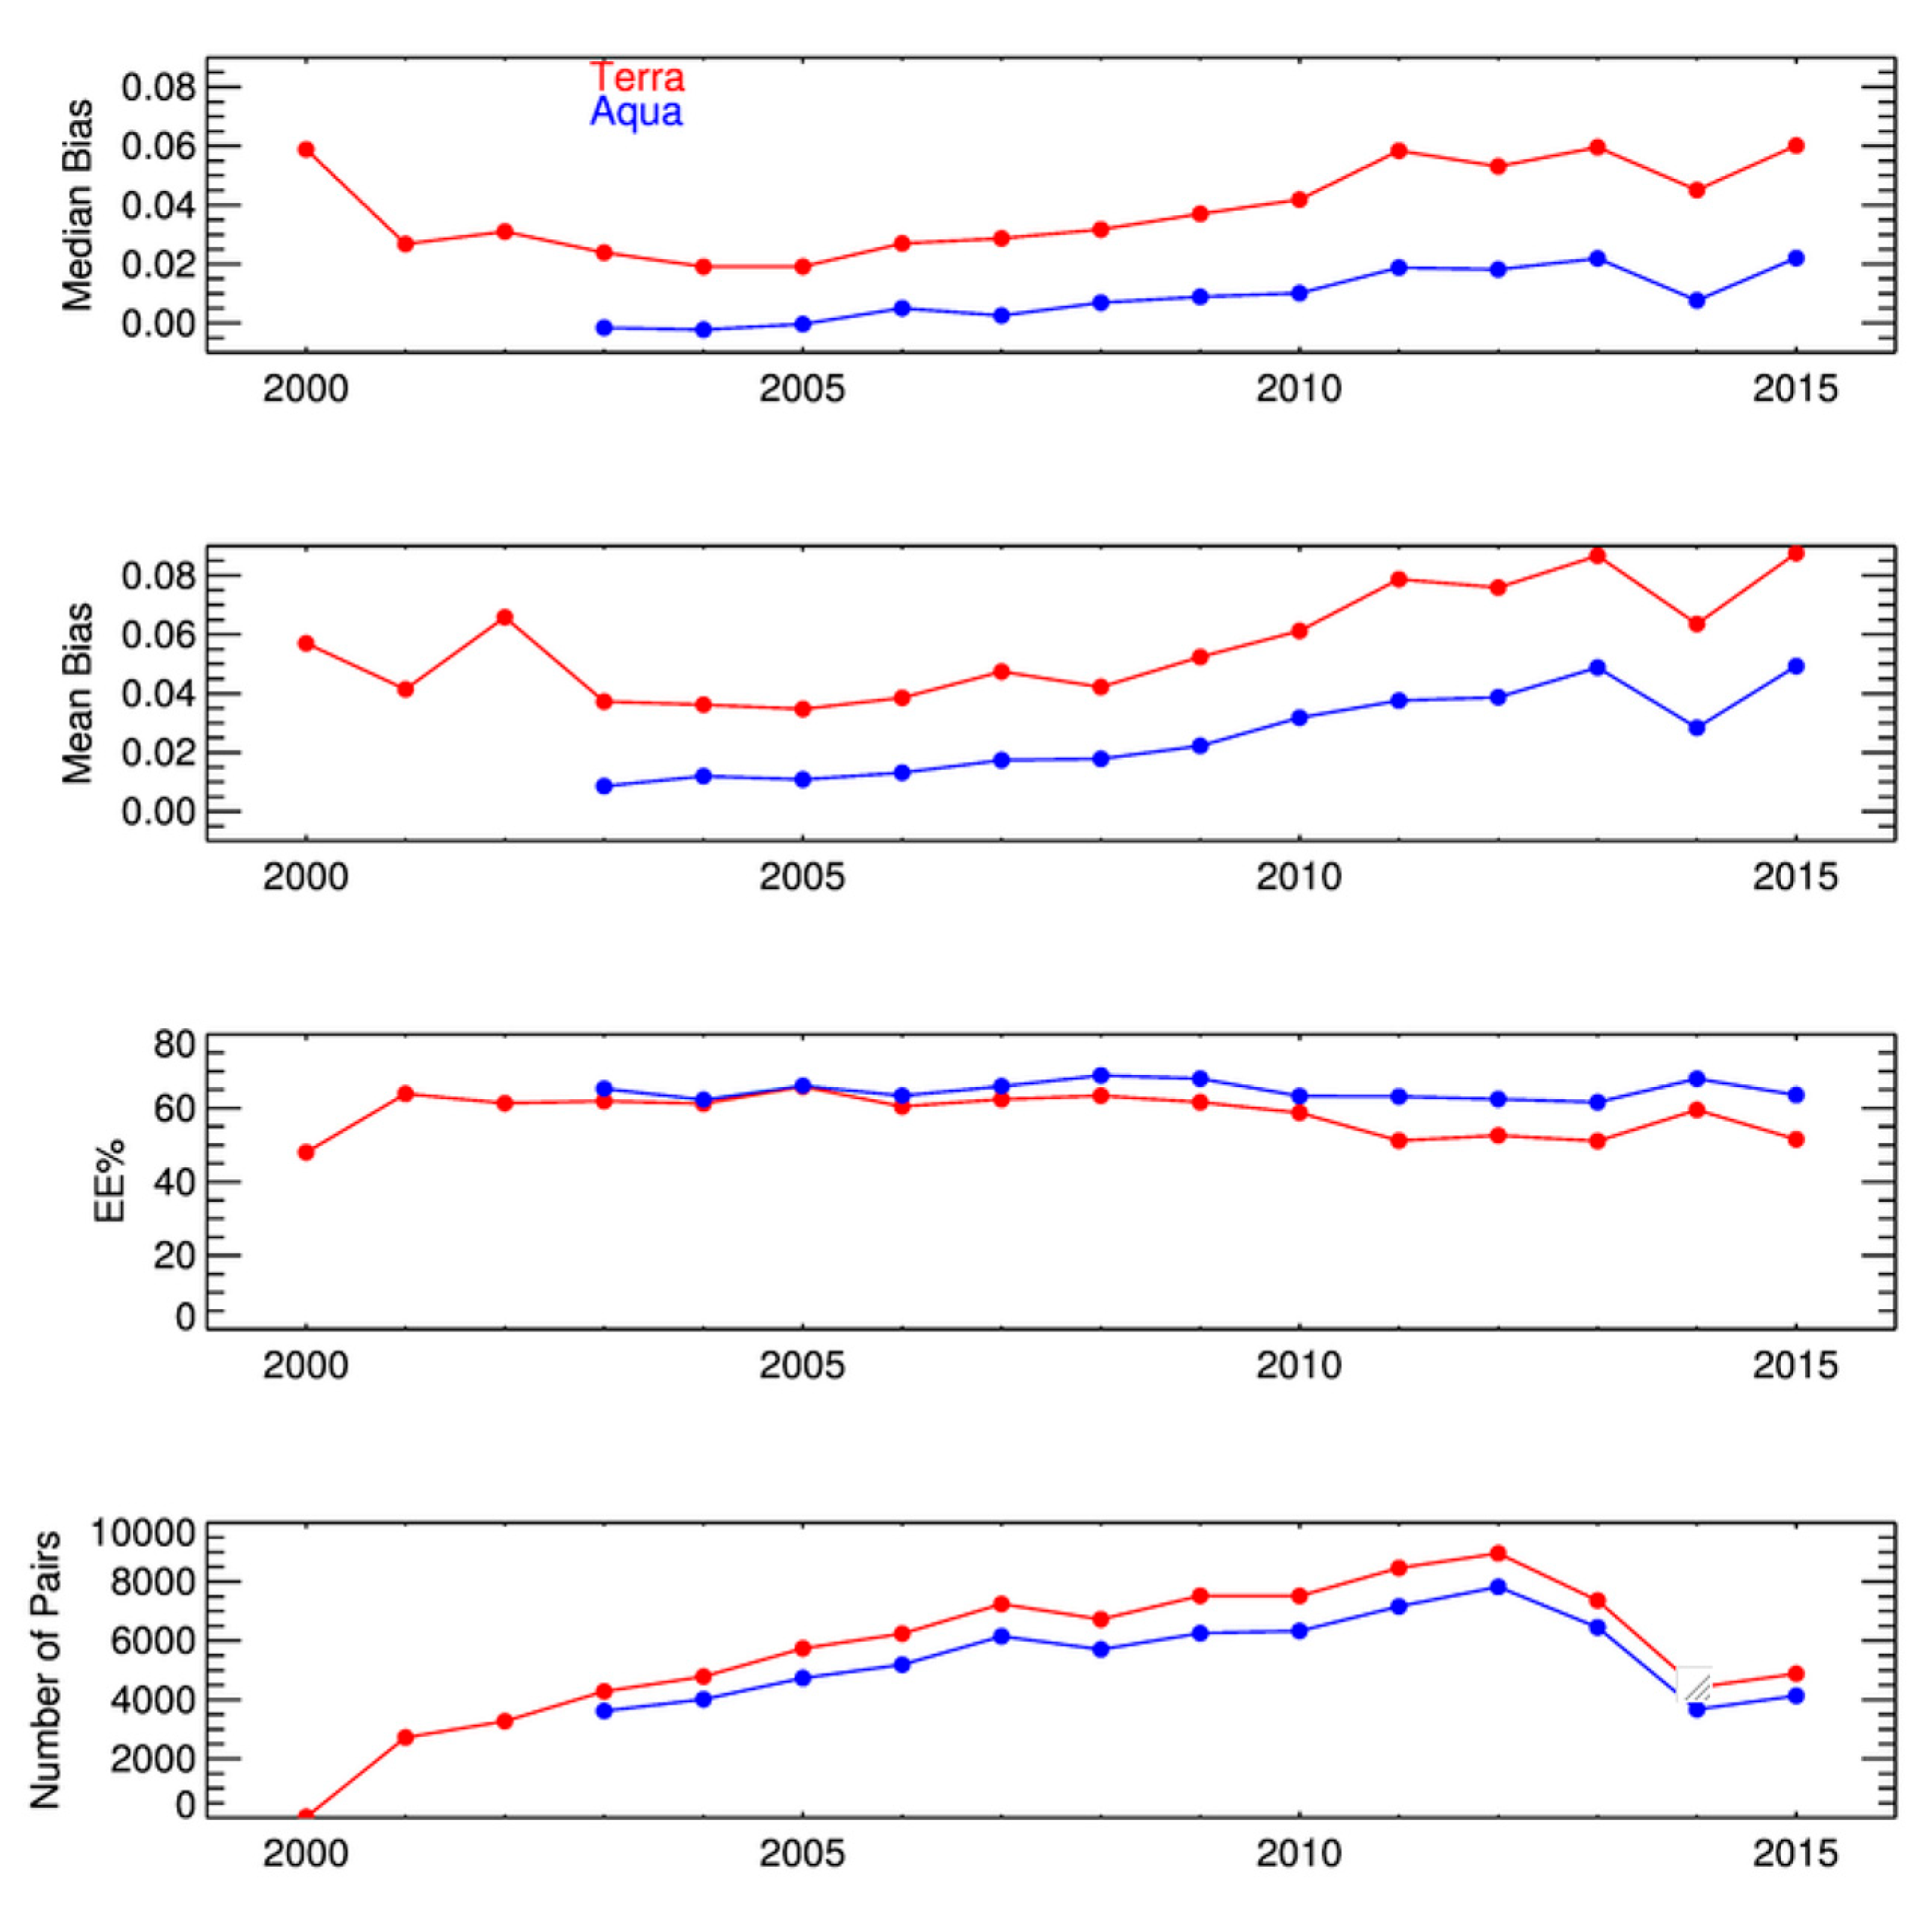
4.4. Interannual Variation in Validation Metrics

The expansion of the AERONET network over the past two decades introduces an interesting issue when interpreting validation over time. Because different AERONET stations contribute to the global AERONET database at different points in the time series, the ground-truth database is constantly changing. This could result in different validation statistics at different points in the time series, even if the actual satellite product accuracy remained constant [17]. Figure 7 shows time series of annual validation statistics for the operational 3 km product calculated from collocations with AERONET each year from 2000 when 129 stations reported data at least for a part of the year to 2015 when 400 stations reported. Note that Figure 7 shows validation statistics for the 3 km product, while Figure 6 shows statistics for the 10 km product. Looking only at the red curve representing MODIS on Terra, the number of collocations grew from about 100 in 2000 to over 8000 in 2012. This reflects the additional stations deployed, as well as the fact that stations were operational in the field for longer durations. The decrease after 2012 reflects the lag between the time the dataset was acquired for analysis and the process of generating the quality assurance for the observations and elevating them to Level 2.0 status. Only AERONET Level 2.0 measurements were used in the analysis. The validation metrics of median and mean bias also exhibit long-term trends in this dataset. For Terra, the mean bias of the MODIS AOD against AERONET is about 0.04 during the period 2003 to 2005. By 2010 to 2013, that bias doubled. Has the Terra AOD accuracy degraded by that much over time? It is possible. As shown in Section 6 there have been drifts in instrument characterization, although most of that was mitigated for the data analyzed in Figure 7. Figure 8 shows that the AERONET stations reporting data in 2003–2005 are different from the ones in 2015. Not only are there overall more stations in 2015, but also many stations that were in 2002 no longer exist. There are very few long-term stations, meaning that the representation of the global aerosol system by the AERONET network continuously changes. Biases can be regionally dependent [15,20,77] and there could be proportionally more stations in favorable locations in 2003–2005 than there are in 2010–2013 or later. Because the ground-truth distribution changes over time, interpreting time series of changing validation statistics is challenging. Reference [77] chose to limit the analysis of interannual validation metrics to just a few long-term locations, widely spaced across the globe in different aerosol regimes.

5. Twenty Years of On-Orbit DT Aerosol Production

5.1. The First Decade (2000–2009)

Beginning with Terra MODIS first light in early 2000 and continuing for roughly a decade, effort was concentrated on validation, as well as identifying and solving issues that were not encountered during the pre-launch period (see Figure 9). The products were being produced and there was a sense of urgency to understand apparent problems and to fix the problems that turned out to be real. Early in this period, we participated in aerosol-focused field experiments such as the Puerto Rico Dust Experiment (PRIDE) [91,120], the Chesapeake Lighthouse and Aircraft Measurements for Satellites (CLAMS) [92,121], and the Southern Africa Regional Science Initiative (SAFARI-2000) [90], but later relied more and more on AERONET’s expanding network and improved sky inversions [41,42,43] and the MAPSS system to lead the validation effort. Masking efforts came first, and development of the second-generation land algorithm was a close second. This is the time period when NASA began to invest in major reprocessing efforts to try to maintain a consistent time series of products. These consistent time series are known as collections. During the 2000 to 2009 decade we saw the implementation of five different collections. This was also the decade when different science and applications communities began to find value in the product and publish their scientific results, using the MODIS DT product as one of their data sources.

5.1.1. Sediment and Snow/Ice Masking

At Terra launch, the DT algorithm produced a viable algorithm creating products, as expected from applying the proto-algorithm to imagery from airborne radiometers. In the first validation, with a limited number of collocations, the AOD products appeared to fall within the error bounds determined from the pre-launch field experiments [39,68,75]. These were ±0.03 + 5% of AOD for ocean and ±0.05 + 15% of AOD for land. There were a few surprises. In the ocean algorithm, sediments at the mouth of rivers and shallow shoals created unrealistic, stationary hot spots in the spatial plots of AOD. A mask making use of the slope between visible (0.47 µm) and SWIR bands (0.86 µm, 1.24 µm, and 2.11 µm) was implemented to avoid these locations [124]. In the land algorithm, the first spring, especially the month of May, produced a band of exceptionally high AOD across the northern hemisphere land masses. This artefact was traced to melting snow that violated the assumptions of the surface reflectance ratios. Initially, the algorithm relied on ancillary data to identify snow in pixels, which did fine at the onset of northern winter and through the heart of the snowy season but did not adequately identify the snow during the spring thaw. A mask was developed, again using the reflectance at 0.86 µm and 1.24 µm bands, along with the brightness temperature at 11 µm, to identify pixels with subpixel snow amounts, and the artefact was eliminated [127].

5.1.2. Cloud Mask and Critical Look at Cloud Contamination

The at-launch algorithm also relied on ancillary inputs to identify and mask cloud pixels. The ancillary data were the MODIS cloud mask product, MOD35. The initial issue with this mask was not that it created cloud contamination in the aerosol product, but that it considered heavy aerosol to be a cloud. The product was losing vital heavy aerosol events of importance for climate applications and later for air quality. We found no way to use just the spectral information from the blue channels through the thermal infrared, to confidently distinguish between all clouds and heavy aerosol. Instead, we turned to spatial variability as the driving factor in a new internal cloud mask, relying on the textural differences between the fractal nature of clouds and the general homogeneity of aerosol layers [122]. The spatial variability test proved to be a strong cloud mask, but it was supplemented by several key individual tests from MOD35 to help with specific cloud types. Thin cirrus had to be dealt with separately, and, for that cloud type, we used the 1.38 µm channel that was new to MODIS [133,134,135] but is now widely used [136].
Cloud contamination has always been an issue in the Dark Target aerosol product. To avoid losing heavy aerosol events, the algorithm has opted to err on the side of “too much cloud” rather than “not enough aerosol”. However, the construct of the algorithm, especially during the process of aggregating from 0.5 km pixels to 10 km retrieval boxes, eliminates much of the residual cloudy pixels that escape the a priori masking and also helps the algorithm avoid pixels in cloud shadows [137]. During this process, the algorithm eliminates 50% of the non-cloudy pixels over ocean and 70% of the non-cloudy pixels over land. This elimination process reduces much residual contamination. Nevertheless, some studies began to report strong correlation between the DT-retrieved AOD and cloud fraction [138,139]. Early on, we examined the effect these decisions had on the product by making a critical examination of cloud contamination [126]. The study looked at the overall effect on the “global mean” AOD, finding that clouds added 0.020 to 0.025 AOD to the MODIS-derived global mean. At the time, this would translate to roughly 10% to 17% of the AOD, depending on whether it is over land or ocean [57,140]. This amount of cloud contamination could be addressed when calculating an observational estimate of aerosol radiative effect [57] from the MODIS product. However, the global value was less useful when considering cloud contamination on a local retrieval-by-retrieval basis. The effect could be much higher at the local level. It continues to be difficult to impossible to fully assess the effect of true contamination on the product as there are several explanations for the observed increase of retrieved AOD near clouds. These explanations include the so-called cloud three-dimensional (3D) effect, which is an adjacency effect when bright clouds send photons that enter into the field of view of nearby non-cloud, less bright pixels [141,142]. Nonetheless, there are physical reasons for AOD to increase near clouds or with cloud fraction including particles swelling with humidity and dissipating cloud droplets in the scene [143,144]. Different processes take precedence in different situations, but careful examination of specific cases point to 3D effects and physical enhancements as being more common than actually mistaking a cloudy pixel for non-cloudy and including it in the retrieval [145].

5.1.3. Second-Generation Land Algorithm

The at-launch operational aerosol algorithm was unprecedented and very welcomed by the community, even in a qualitative sense. Initial validation suggested that there was also quantitative skill (Figure 5) [87]. However, it became apparent over time as more data were processed and as AERONET expanded into new land and aerosol situations that there was room for major improvements to the algorithm. All assumptions of land surface reflectance parameterization, aerosol models, and distribution of aerosol models were re-evaluated and updated [18,19]. This included turning simple ratios of land surface reflectance into regression models, dependent on view geometry and vegetation index. The at-launch aerosol models were derived for global conditions from a limited grouping of AERONET stations in only three regions of the globe. In the second-generation algorithm, a formal clustering analysis was made of the global AERONET dataset, now expanded to reflect a much more diverse global aerosol system. The expanded AERONET distribution of stations also allowed us to better apply the different models to the right regions. All of these changes to the assumptions in the land algorithm were important but did not contradict the original assumptions. For example, cluster analysis still resulted in four aerosol model types, with similar particle properties, and placed these four models in roughly the same geographical locations.
Specifically, the four models included three that were dominated by fine-mode particles and one dominated by a coarse mode. The three fine-mode models had small differences in their size distributions but were distinctive in their light absorption properties. The model with the most light absorption, with mid-visible single scattering albedo (SSA) of 0.85, was found seasonally in tropical and southern hemisphere biomass burning regions and over particular high-population-density zones of countries with developing economies. The model exhibiting the least light absorption with SSA = 0.95 was found in the postindustrial countries of the northern hemisphere. The remainder of the globe was assigned a model with a moderate level of light absorption (SSA = 0.90). These three models with dominant fine modes were matched within the retrieval with the one model with dominant coarse mode. As with the over ocean algorithm, the inversion mixed the two models to find a solution that best matched the measured top-of-atmosphere reflectances. The same coarse-dominant model was applied globally. In regions with significant coarse-mode dust, the inversion mixed in more of the available coarse-dominant model, and regions without dust would minimize the amount of coarse-dominant model mixed into the retrieval. Details of the models and the algorithm can be found in [18,19].
The major difference between the second-generation land algorithm and the at-launch algorithm was a structural change that replaced the two individual channel retrievals at 0.47 µm and 0.66 µm with an inversion linking the two channels together by the aerosol model. The inversion used reflectance at 0.47 µm, 0.66 µm, and 2.1 µm and three radiative transfer equations, one for each wavelength. The surface reflectances at each wavelength in the radiative transfer equations were linked by the assumed parameterization. The spectral dependence of AOD was determined by the aerosol model. Like the ocean algorithm, values in the new LUT were indexed by AOD at 0.55 µm. The algorithm was given limited flexibility to create an aerosol model by finding the best weighting parameter between two bimodal aerosol models, one dominated by fine mode and one dominated by coarse mode. In reality, this weighting parameter more often than not jumped between 0 for a completely dust-dominated scene and 1 for a completely fine-mode-dominated scene. The inversion received three pieces of information (top-of-atmosphere reflectance at 0.47 µm, 0.66 µm, and 2.1 µm) and returned three outputs (AOD at 0.55 µm, the weighting parameter that defined the aerosol model and, thus, the spectral dependence of AOD, and the surface reflectance at 2.1 µm). From these three pieces of information, one could, through the assumptions, reconstruct the AOD and surface reflectance at any wavelength. The inversion never assumed that the atmosphere was transparent at 2.1 µm, such that top of atmosphere reflectance at 2.1 µm did not equal the surface reflectance at that wavelength.
This second-generation land algorithm with its adjusted surface reflectance parameterization and aerosol models, and with its reconstructed comprehensive inversion went into operations as part of Collection 5.1 in 2008 (see Figure 9). Subsequent validation showed that these changes did make substantial improvement [15]. However, it was also noted at this point that the aerosol size parameter, which had been used up to this point as a valid quantitative retrieval product, was at best a qualitative indicator of whether small or large particles dominated the scene. Spectral AOD was presented as a product, but spectral dependence accuracy over land is weak, and retrieved AOD at 0.55 µm shows better accuracy in validation on a global basis than does AOD at the other wavelengths. These are global observations. In particular locations where surface reflectance matches assumptions especially well, there is a possibility that retrievals of aerosol spectral dependence over land will show greater skill.

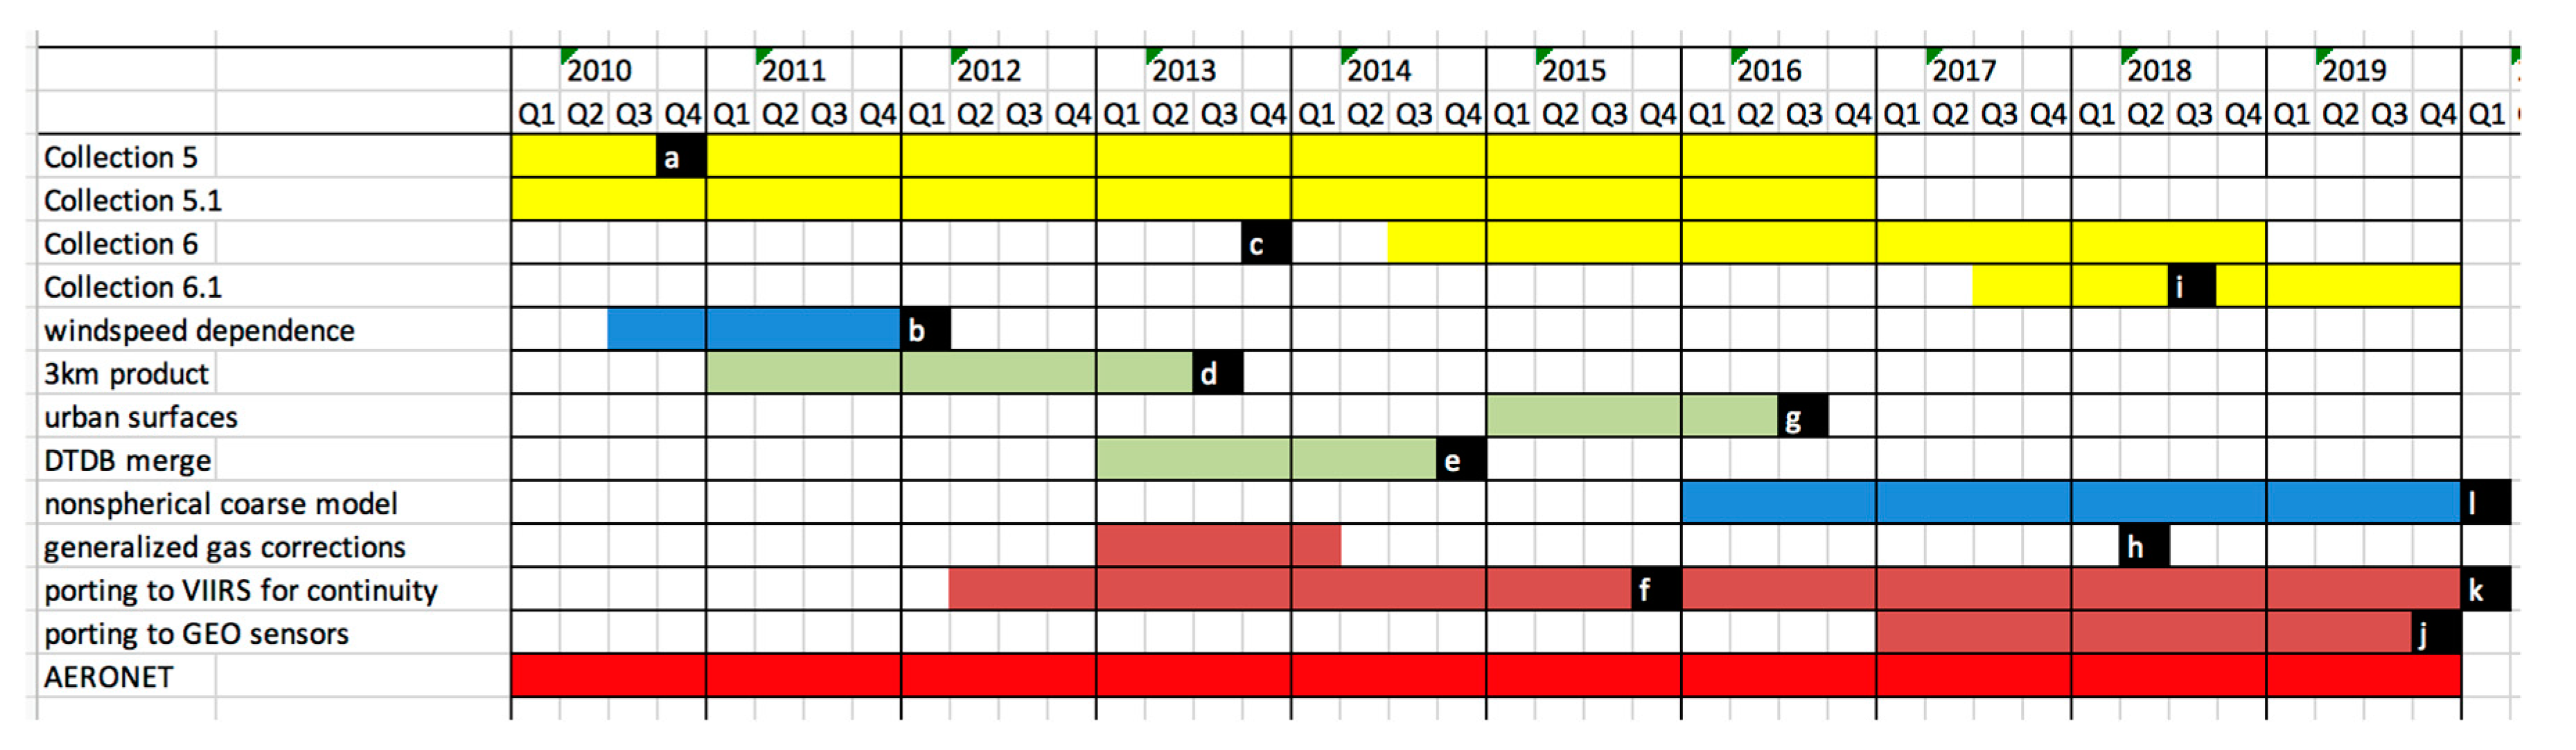
5.2. The Second Decade (2010–2020)

The past 10+ years (2010–2020) cover the period of time when Collections 5 and 5.1 were running, and when Collections 6 and 6.1 were started (see Figure 10). In this decade, there were a few important modifications concerning surfaces and the introduction of a 3 km product, but emphasis switched from adding new features to maintaining a consistent product data record. This included identifying temporal drifts in the MODIS data products due to drifting instrument characterization of these aging sensors, which is the main reason Collection 6.1 was implemented in 2017. It also included looking ahead to when the MODIS sensors would finish their missions and the community would need to switch to alternative sensors. In light of that need for continuity, the DT algorithm has been successfully ported to the VIIRS sensor [24] and is in the process of being adapted for the current fleet of geosynchronous sensors. Throughout this decade, as was the case for the 20 years previously, AERONET has been an essential partner in the continuous development, validation, and maintenance of the DT algorithm.

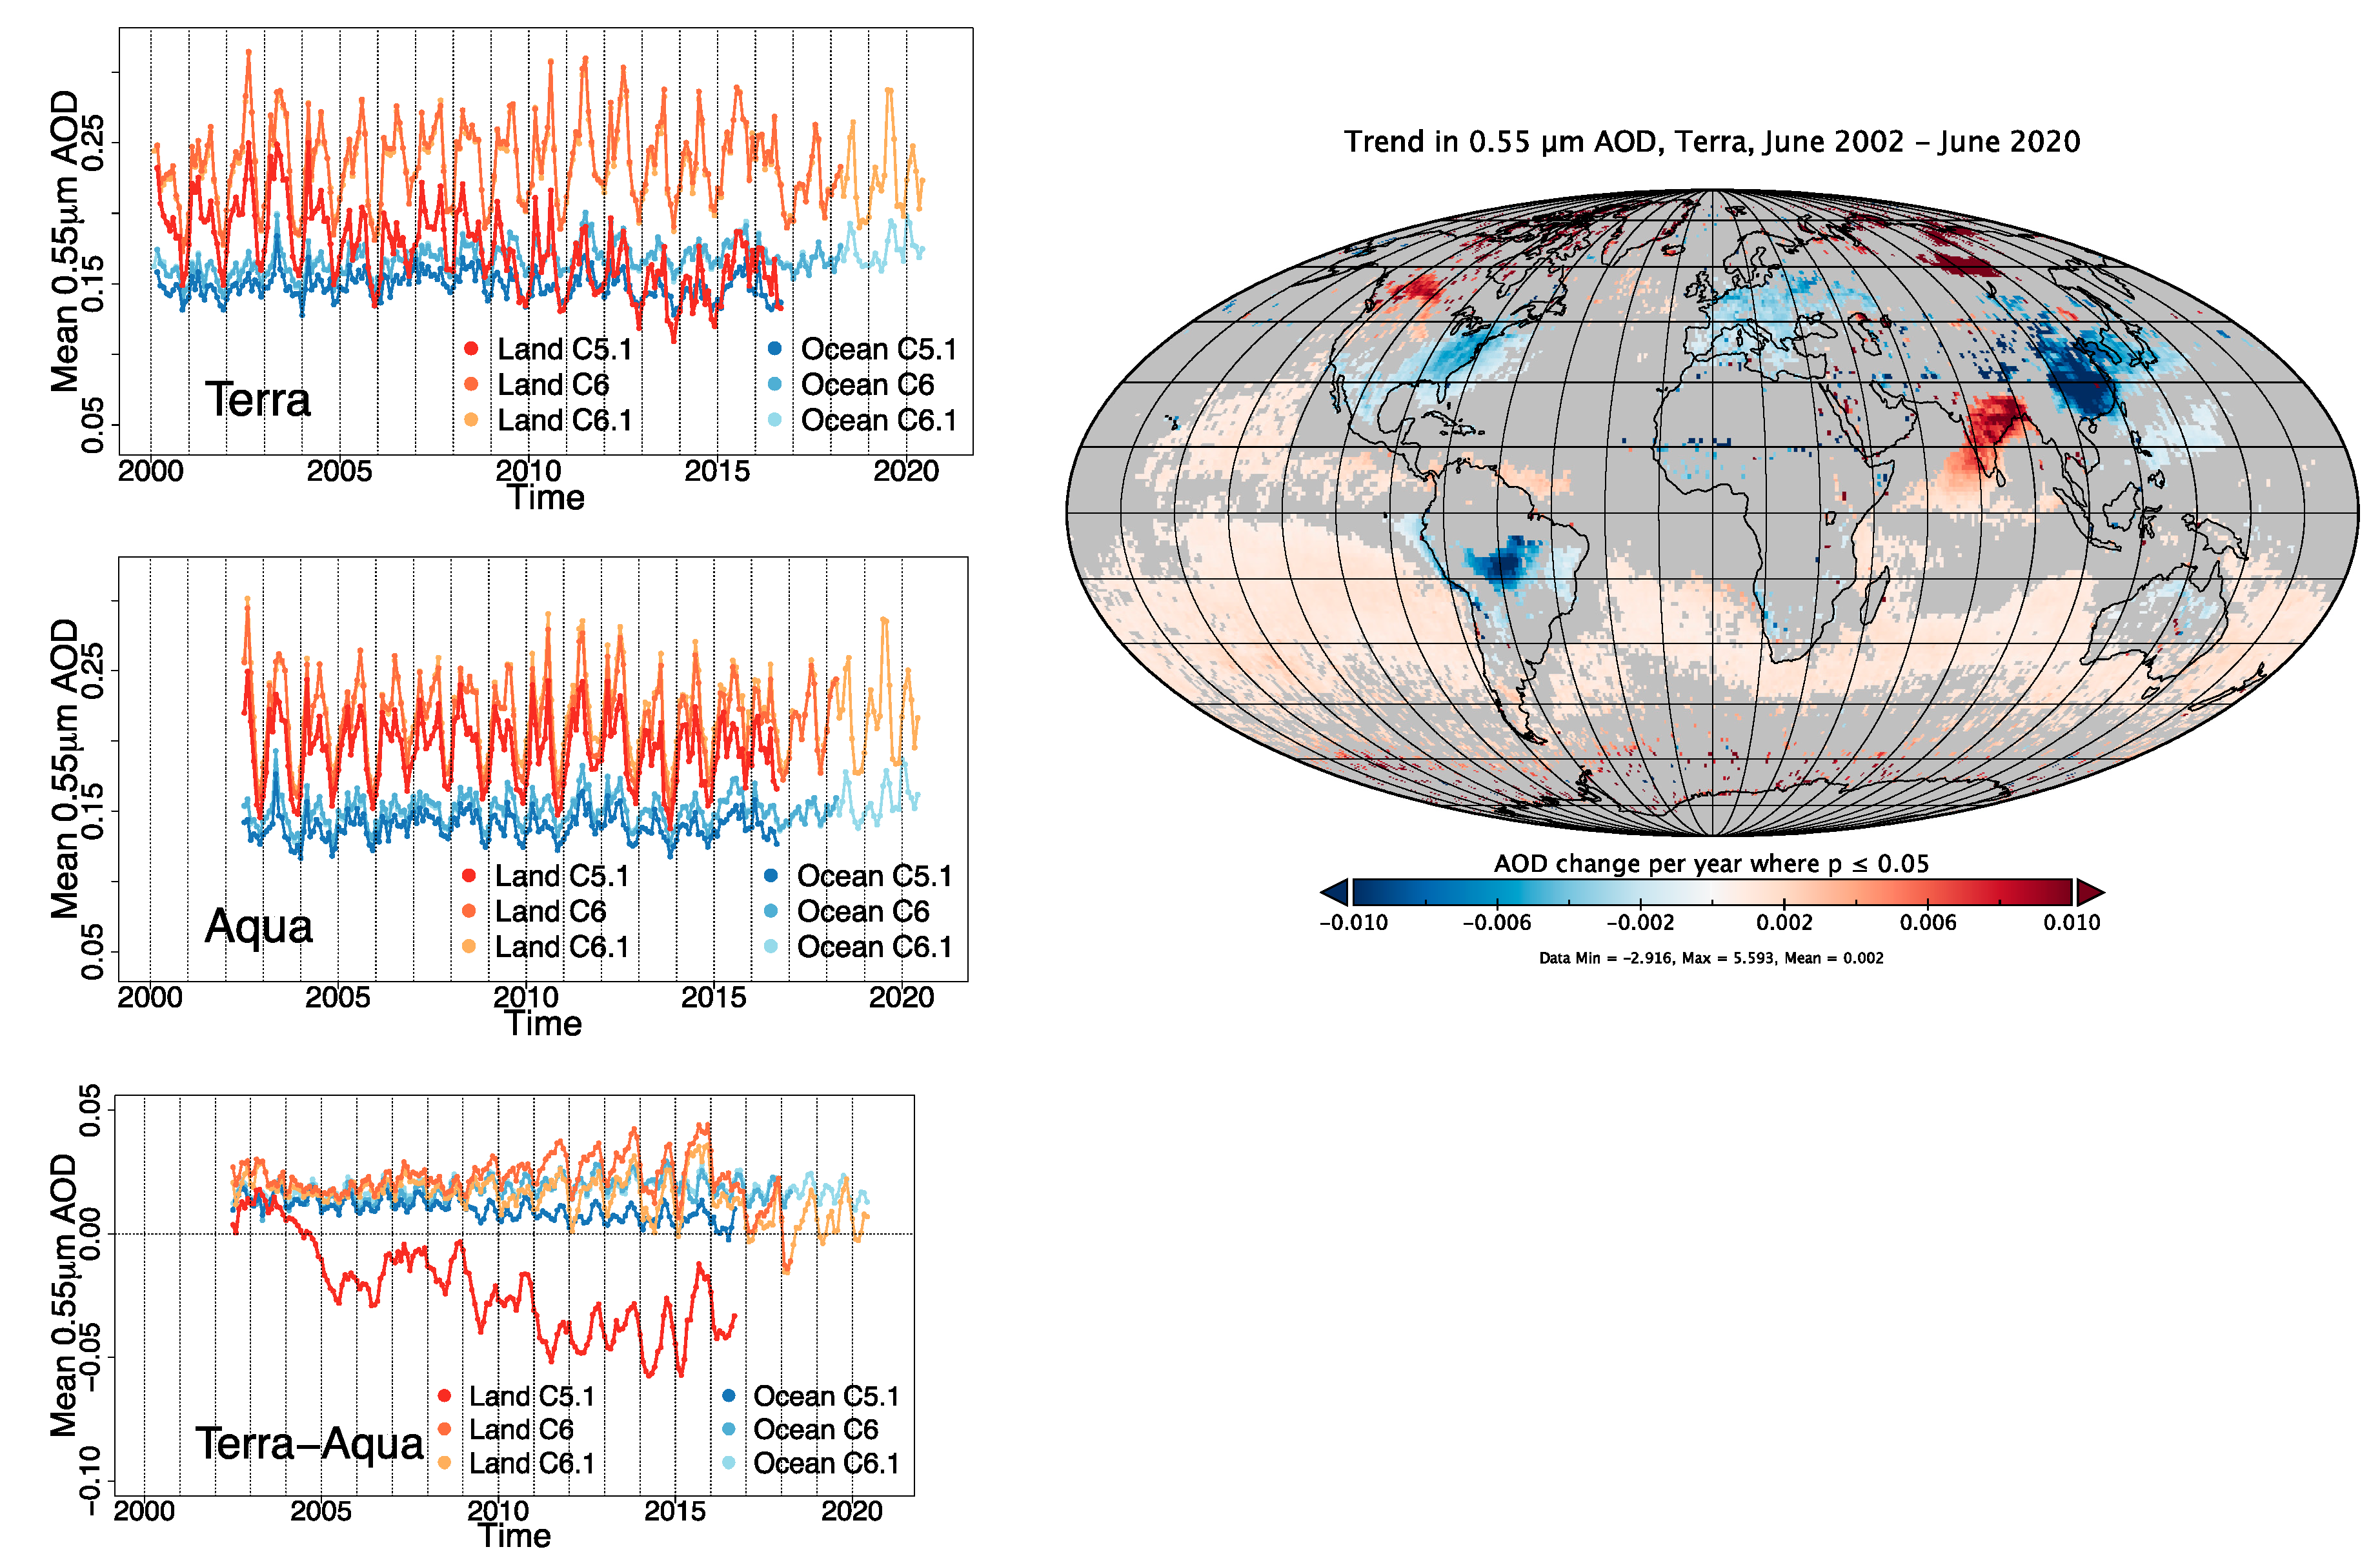
5.2.1. Offset between Terra and Aqua

The surprise of the Collection 5 version of the Terra- and Aqua-reprocessed products released in 2008 was the unexpected offset between Terra and Aqua AOD. Although there had been a small offset between Terra in Collection 4 and Aqua in Collection 3 [94] when Aqua was upgraded to the Collection 4 inputs and algorithm, Aqua matched the results of Terra nearly perfectly, showing no offset and no discernible “diurnal signature” in the Collection 4 time series [152]. After Collection 5, Terra developed a 0.015–0.020 offset from previous values and from Aqua, and this offset continued into Collection 6 and to the present day [20,140]. The offset is a retrieval artefact, not caused by a temporal component of the aerosol system. The obvious culprit is instrument calibration; however, after years of working with the MODIS characterization team and trying alternative calibrations, some mitigation has been achieved, while the basic offset remains [20].

5.2.2. Wind Speed Dependence Added to the Ocean Algorithm

The at-launch ocean algorithm used the global mean surface wind speed of 6 m/s as a constant in the [153] surface reflectance parameterization. This led to a degradation of the ocean retrieval accuracy in areas just outside of the 40° glint mask [146]. A change was made to ingest ancillary 2 m wind speed data from the Global Data Assimilation System (GDAS) produced by the National Center for Environmental Prediction (NCEP), and to use this ancillary information to adjust surface reflectance. The change made an important improvement in mostly remote regions of the southern subtropical oceans [146].

5.2.3. Introduction of a Finer-Resolution Product

One interesting post-launch surprise had nothing to do with performance of the algorithm, but with the communities that showed interest in it. The algorithm was designed with climate applications in mind, but the air-quality community also began to use the products for forecasting and mitigation work. To serve that community better, we implemented operational production of a 3 km product to supplement the standard 10 km product [17,76]. The 3 km product serves its purpose with sufficient accuracy but is less accurate than the standard product [77]. The team continues to recommend the 10 km product, unless finer resolution is necessary for the application.

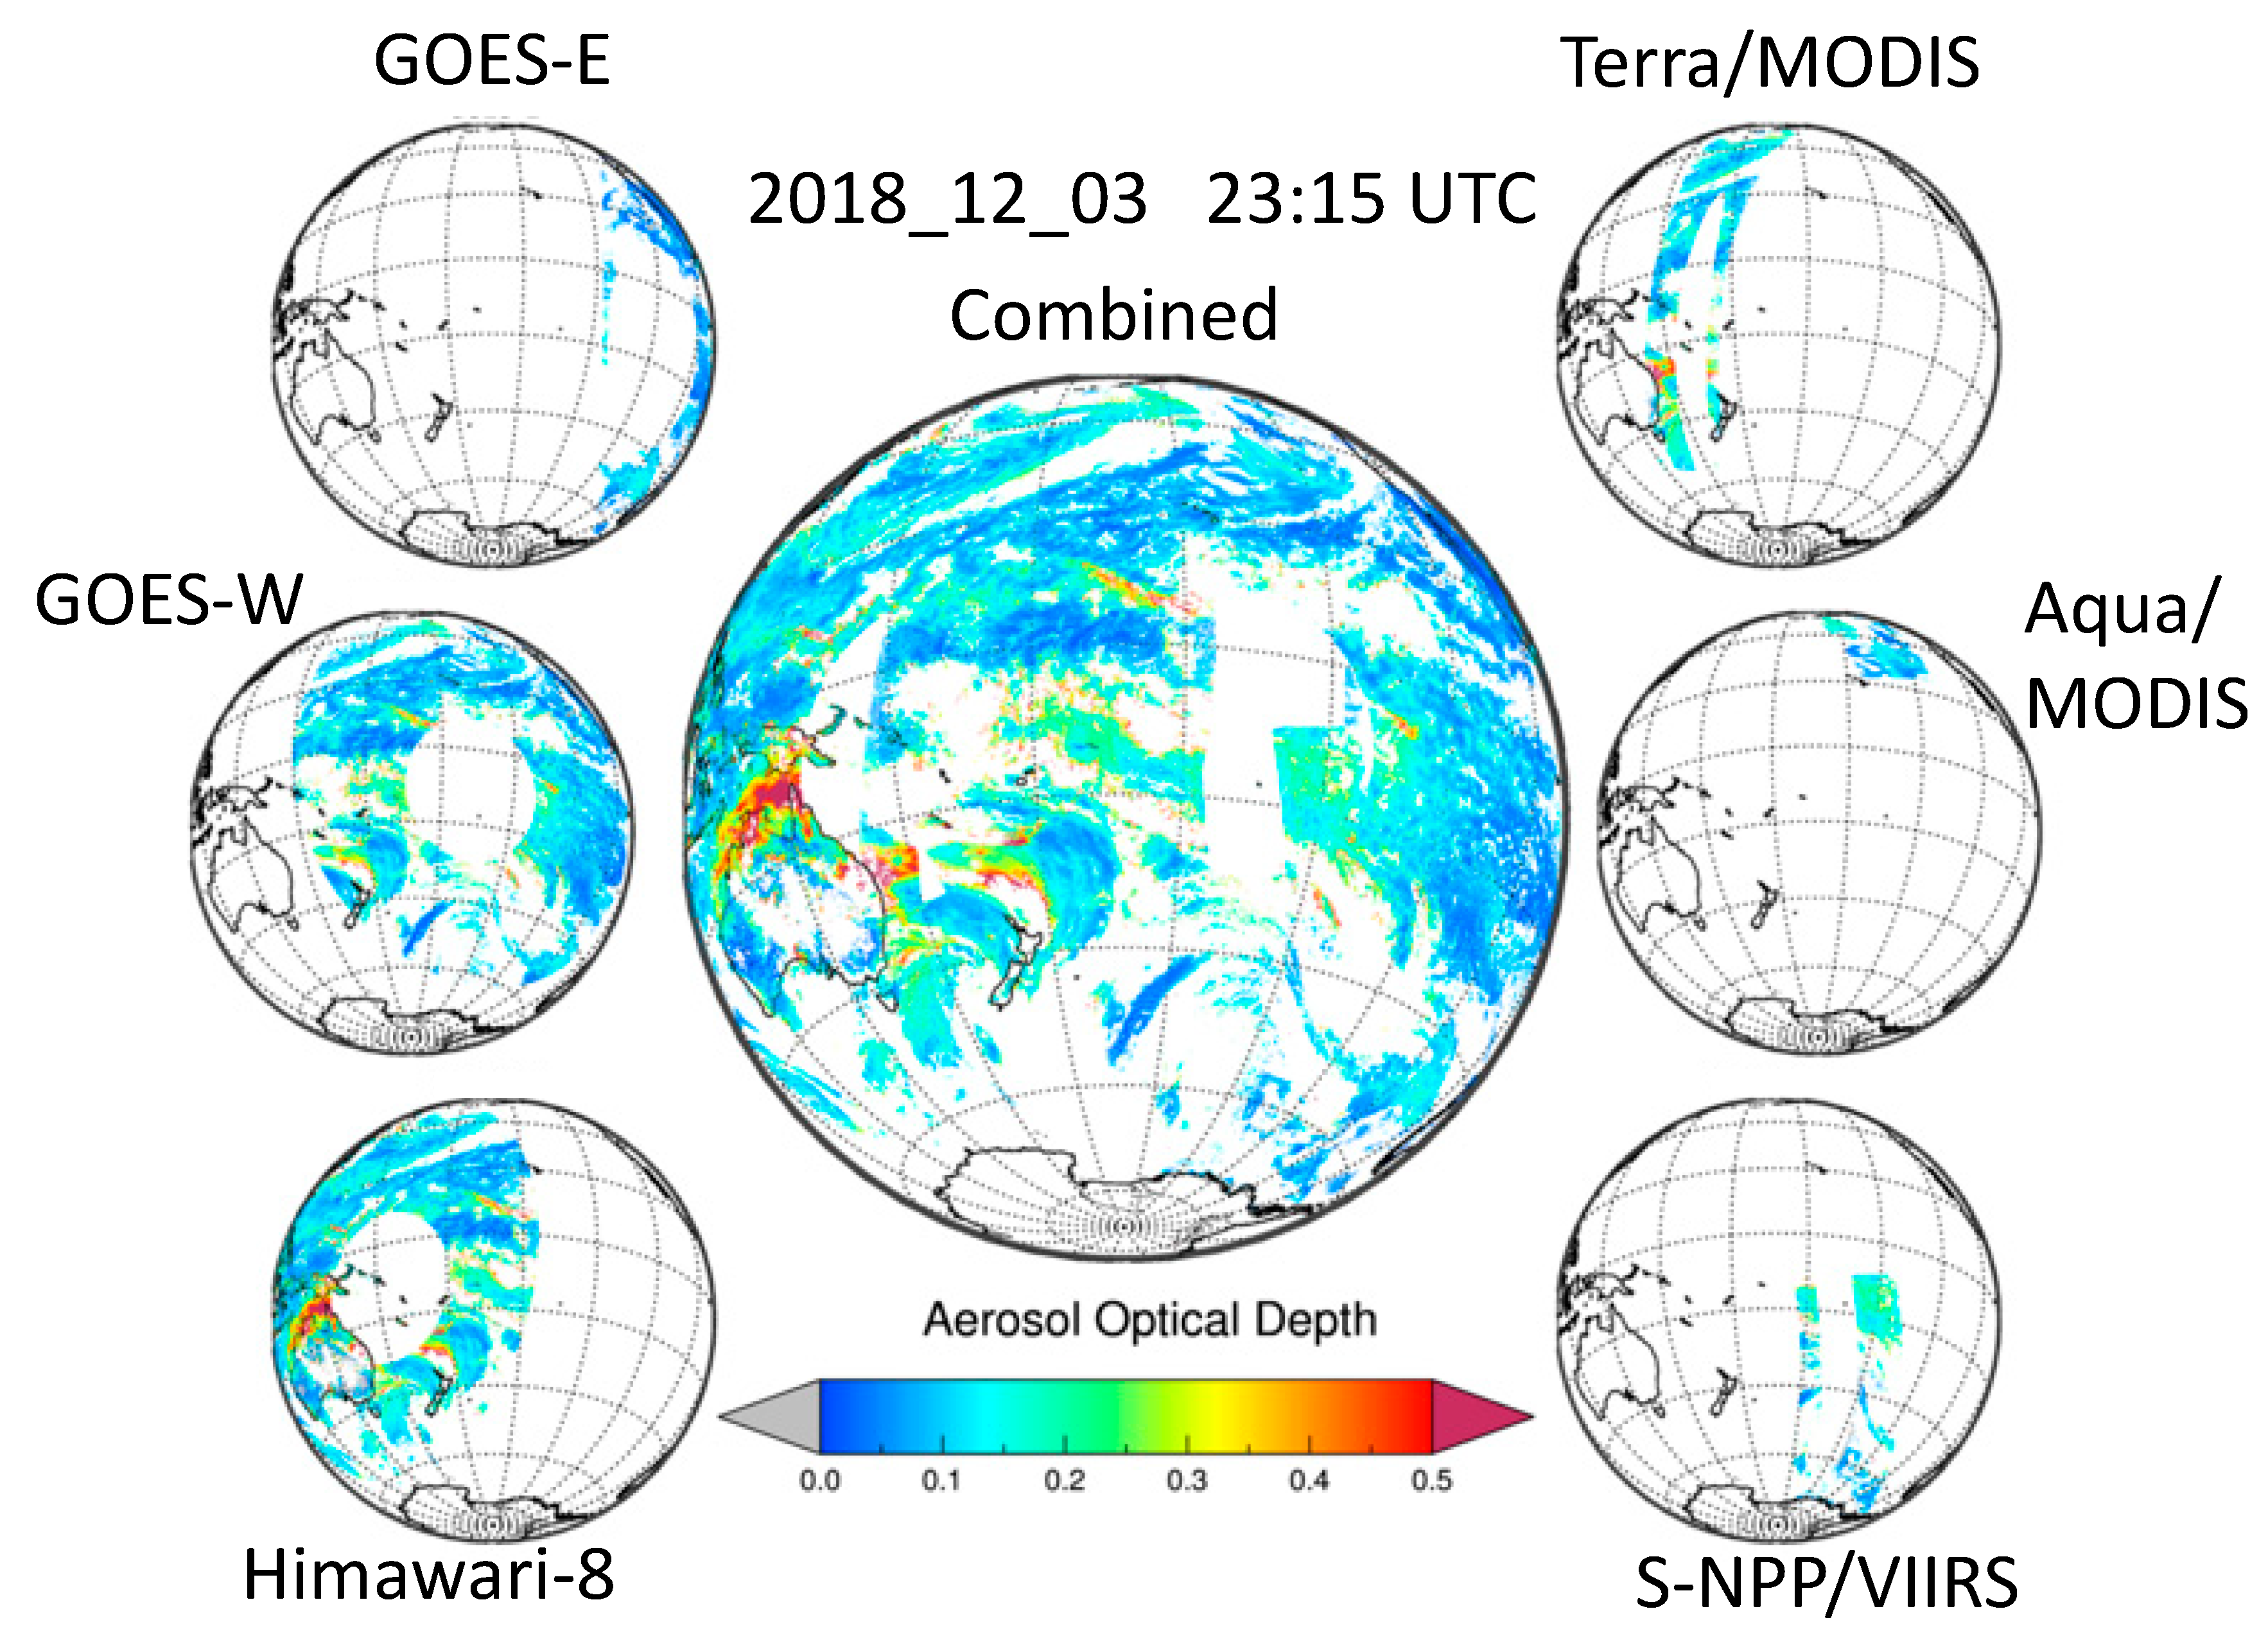
5.2.4. Creating a Merged Product from Dark Target and Deep Blue

The DT land algorithm, by definition, avoids brighter surfaces because the premise of the algorithm is to deduce the aerosol signal from the aerosol scattering that brightens dark surfaces. A second MODIS product, called Deep Blue [80,154], was initially developed to produce aerosol products over land surfaces too bright for the DT algorithm. Subsequently, the Deep Blue algorithm has expanded to darker, vegetated surfaces [80]. However, there was continued interest in combining the results of the experienced Dark Target algorithm from darker surfaces with the results of the Deep Blue algorithm from brighter surfaces to produce a more complete, global view. This has been called the DTDB merge and appears in all MODIS aerosol product files from Collection 6 onward [20]. A database of MODIS-derived monthly mean NDVI values was developed for all months of the year at a 0.25° spatial resolution. Over land, pixels with an NDVI value ≤0.2 are populated by Deep Blue retrievals, and pixels with an NDVI value ≥0.3 are populated with the DT retrieval. For pixels with an intermediate NDVI value (>0.2 and <0.3), retrieval with a higher-quality flag is chosen, and a simple average of DB and DT is used if both retrievals are present and of highest quality. Because Deep Blue aerosol retrievals are not performed for MODIS over ocean, the product uses DT retrievals for all ocean pixels [20,147].

5.2.5. Expanding Gaseous Correction

To better characterize gaseous absorption and derive consistent atmospheric corrections for retrievals from different sensors, we switched to the High-Resolution Transmission (HITRAN) gas database and line-by-line radiative transfer model (LBLRTM) to calculate gaseous absorption in each band of each sensor for the LUT. Previous to Collection 5, the DT algorithm used the 6S Radiative Transfer code with the Moderate-Resolution Transmission (MODTRAN) gas database for this purpose. Furthermore, previously, only water vapor, ozone, and carbon dioxide were considered for atmospheric gas corrections. We have now (starting with MODIS Collection 6) expanded to include additional atmospheric gases (O3, O2, N2O, NO2, NO, SO2, CO2, CO, and CH4); however, for bands used in aerosol retrievals, only N2O, CH4, O2, and SO2 are found to have some absorption [23]. This was an important step for preparing the algorithm for adaptation to other sensors. Note that the previously ignored methane is an important absorber in VIIRS band 11 (2.25 µm), whereas it had not been important in any of the MODIS bands. However, oxygen is an important absorber in MODIS band 5 (1.24 µm), and it had been mistakenly ignored in previous MODIS collections. Although the satellite sensors now have narrower channels in window regions, the absorption from gases is non-negligible and can introduce biases in the AOD retrievals [20,23]. For creating a consistent long-term climate data record from multiple satellite datasets, such as from MODIS and VIIRS, consistency and accuracy of atmospheric gas correction are critical. The team will continue to revise and update gas corrections with any improvements in gas database (HITRAN) and updates in LBLRTM versions.

5.2.6. New Surface Parameterizations for Urban Surfaces

To support the air-quality community, we examined the surface reflectance parameterization in urban centers and found that the parameterization designed for vegetation and natural surfaces is not at all applicable for man-made surfaces [155]. Recently, a more applicable surface parameterization for urban surfaces was implemented, with the algorithm naturally blending the two parameterizations as a function of percentage of urban land-cover type from ancillary data [22].

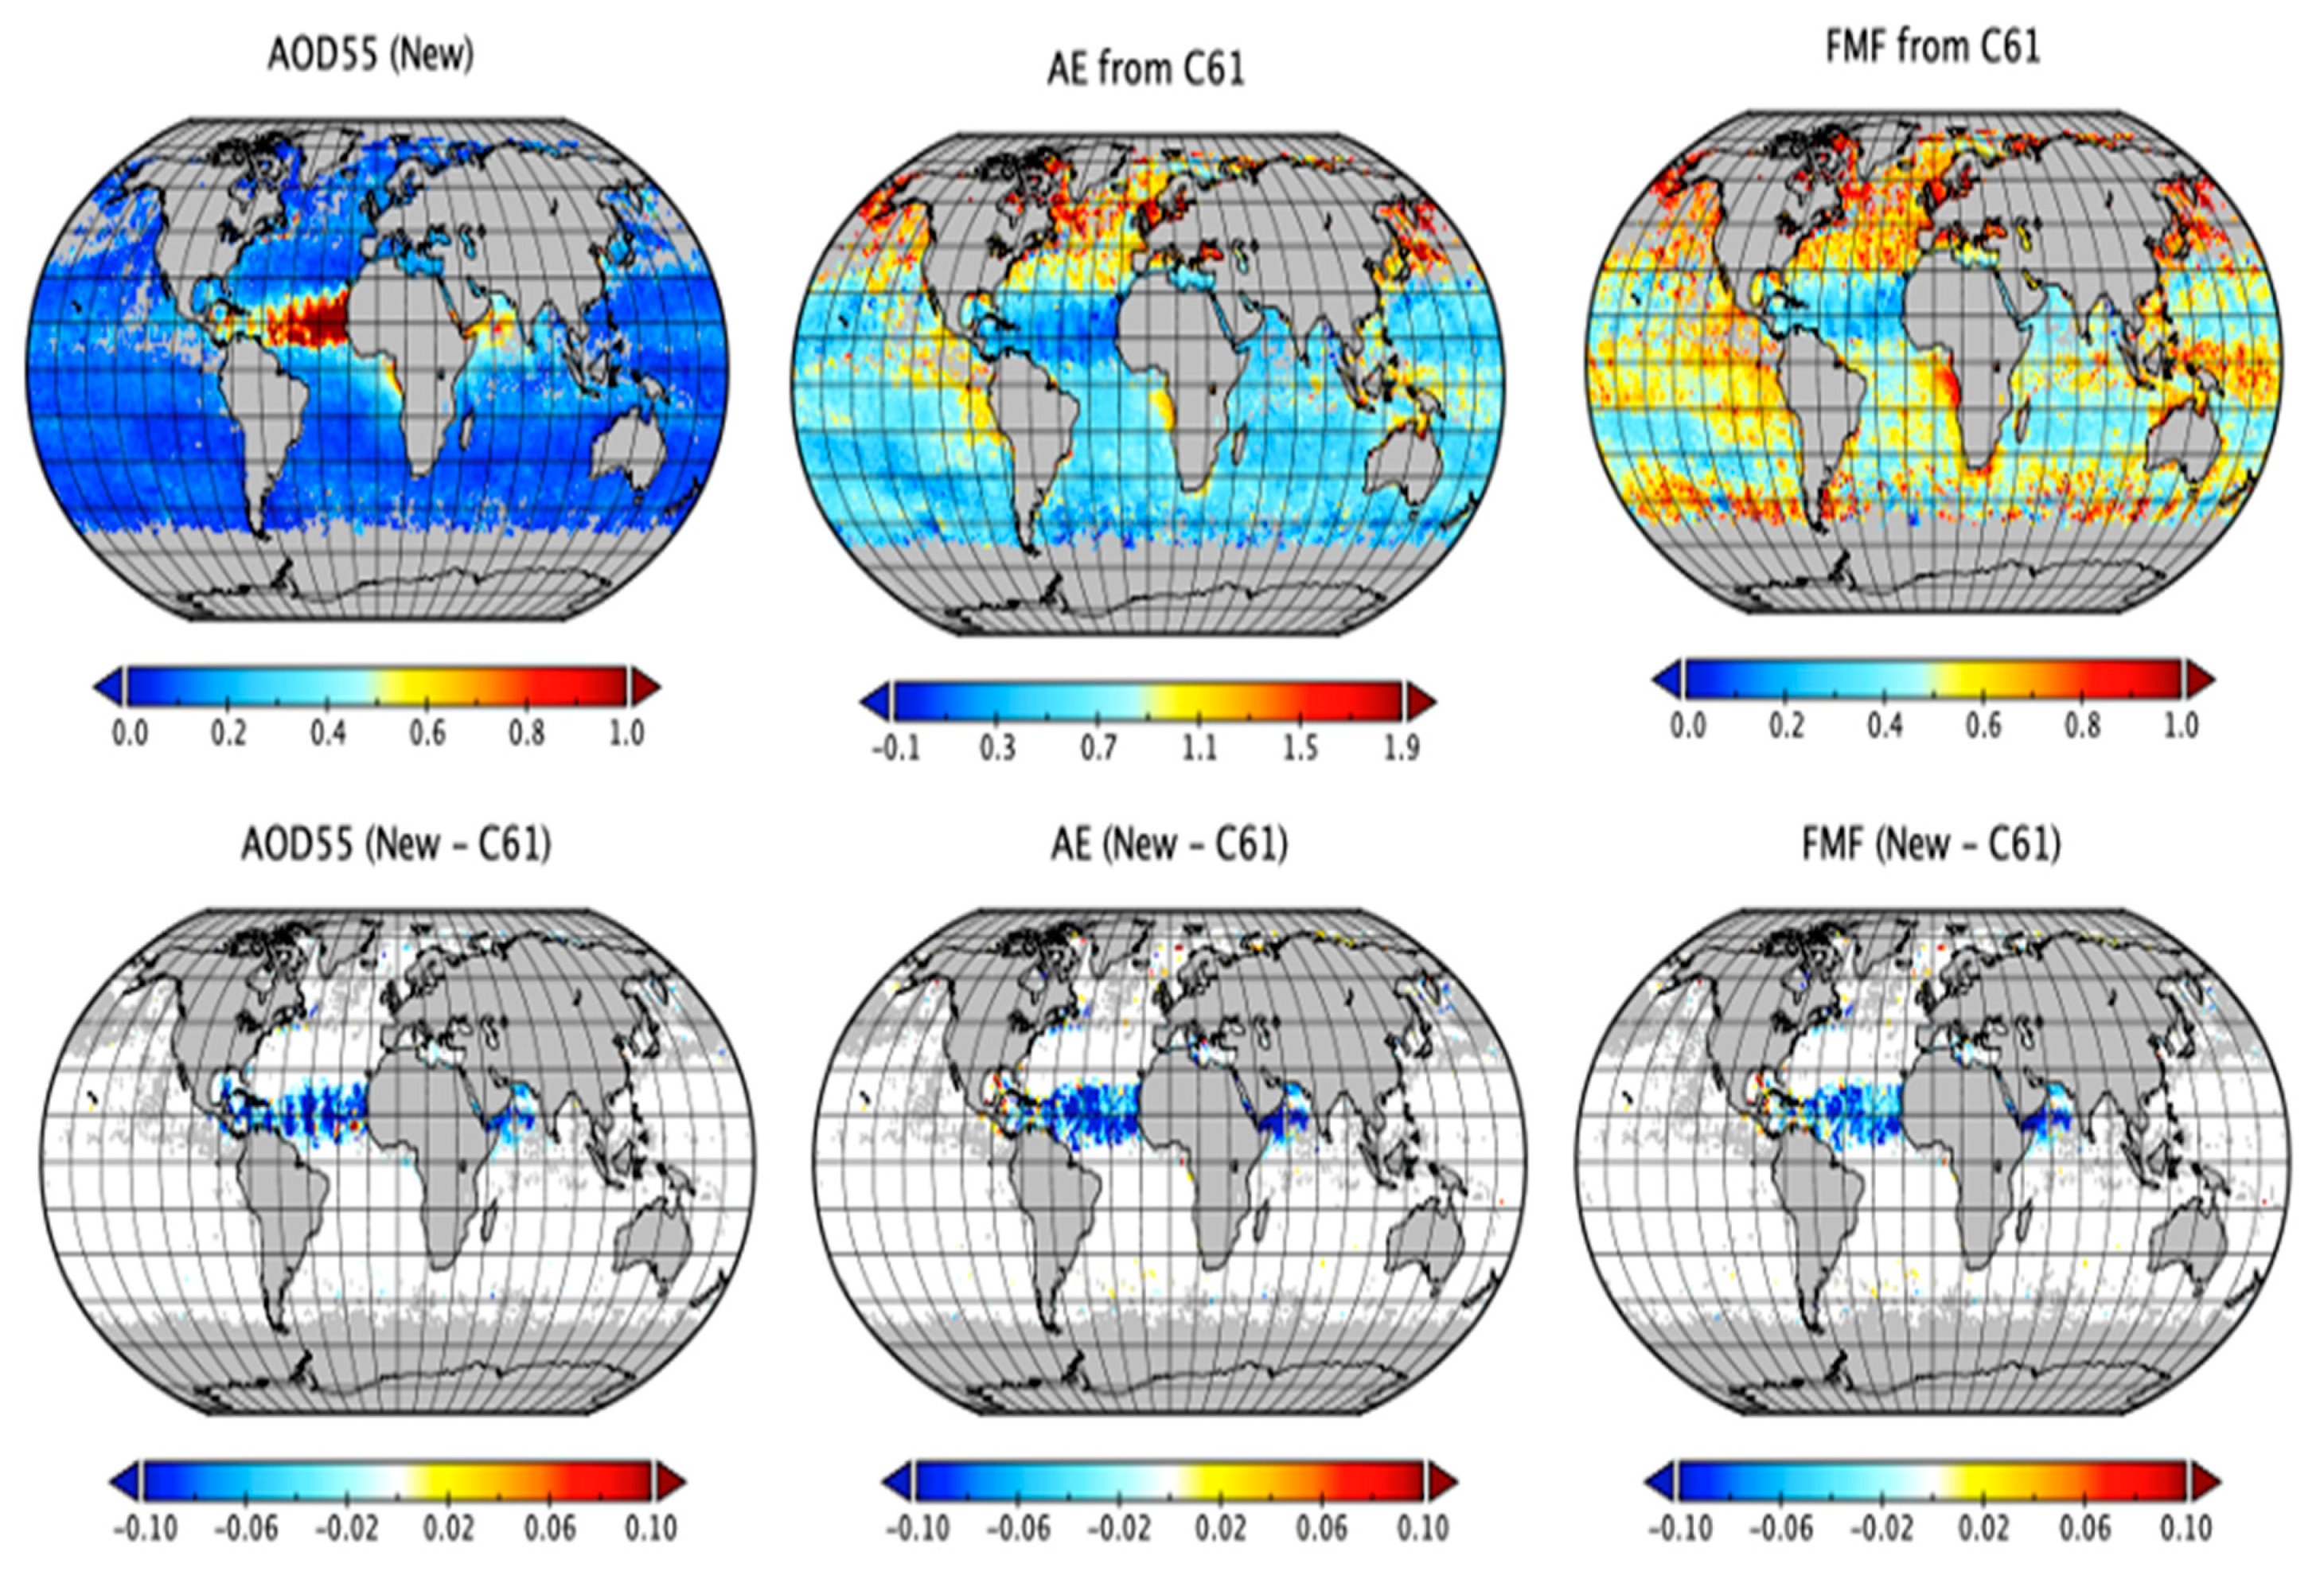
5.2.7. Specific LUT with Nonspherical Coarse Mode for Dust over Ocean

To improve the retrieval of dust over ocean, we recently introduced a new nonspherical coarse mode into the over ocean retrieval and developed a logic tree to identify dust to direct the retrieval to this new coarse mode [150,151]. Before this modification, over the ocean, the DT algorithm was known to contain scattering-angle-dependent biases in its retrievals of AOD, Angstrom exponent (AE), and fine-mode fraction (FMF) for dust aerosols. The modification uses a two-step strategy to improve the DT retrieval of dust over ocean. First, a combination of spectral tests using near-ultraviolet (UV) (deep blue), visible, and thermal infrared (TIR) wavelengths is applied to detect dusty pixels [150]. Second, a new dust model assumes a mixture of spheroid particles to represent global dust optical properties [151], and this new dust model is applied to only those pixels that are identified as dusty. Initial validation with AERONET-identified dusty pixels indicates a significant reduction of AOD bias (from 0.06 to 0.02) while improving the fraction of retrievals within expected error (%EE) from 64% to 82%. At the same time, the overall bias in AE is reduced from 0.13 to 0.06, and the scattering-angle-dependent AE bias is largely eliminated. Figure 11 shows the impact of the new retrieval on a two-week average of AOD, AE, and fine-mode fraction (FMF) during a recent historic dust transport event across the Atlantic Ocean from 13–26 June 2020. The reductions in all three parameters in the dust transport route from the coast of West Africa to the Caribbean are significant. The new retrieval suggests the need for a re-estimate of global and regional dust radiative forcing and dust mass transport across Atlantic and Pacific Oceans.

5.2.8. DT Product over Regions with Intense Aerosol Loading

Finally, to support air-quality monitoring and hazard response/management, as well as to complete our understanding of aerosol regional distributions at the extreme high end of AOD, we analyzed the DT product in circumstances of very high aerosol loading such as over wintertime China and the 2015 Indonesian forest fire event [156]. We increased the DT product data coverage by first identifying these extreme aerosol events and then adjusted masking thresholds to allow more AOD to be retrieved. As retrieval coverage increased, we modified aerosol model and aerosol layer height assumptions in the retrieval to ensure continued accuracy in high-AOD conditions. These adjustments allow DT to retrieve over heavily polluted regions or retrieve closer to the source of the emissions. This modification to the DT algorithm for heavy-aerosol situations is still in research form and has not been adapted for the operational code.

6. Continuity in Light of a Constantly Evolving Sensor and Algorithm

For 20 years, the DT algorithm has been retrieving aerosol products using inputs from MODIS observations. While the fundamental aspects of the algorithm have remained the same, the algorithm that is running today is not the same algorithm that was implemented at launch (see Figure 9 and Figure 10). Change is part of the algorithm’s success. Change is necessary to react to new information, new opportunities, and new user communities. However, since change can also be disruptive of continuity and a consistent climate data record, NASA has implemented a system of collections, in which the entire data stream is reprocessed from the beginning of the mission to the present using updated algorithms. Currently, we are in the era of Collection 6.1, which was implemented in early 2017. The identical algorithm is run on both Terra and Aqua MODIS observations, using historical observations prior to 2017, known as re-processing, and new observations (until present), known as forward-processing.
Prior to launch, MODIS was calibrated to a laboratory source. Through its expected 5–7-year lifetime, the calibration and performance were expected to change with age and exposure, including degradation of the electronics, the telescope, the mirrors, and the onboard calibration source [157,158]. All changes affect the electronic signal that is observed, which furthermore impacts the calibration coefficients and the accuracy of the observation data used in the DT and other retrievals. Many of these changes are gradual (e.g., degradation) and can be modeled and forecasted. In fact, the MODIS Calibration and Support team (MCST) has continuously been developing novel techniques for mitigating some of these degradations and drifts, reducing striping in the imagery, and otherwise improving the reflectances, radiances, and geolocation information used by the DT and other algorithms. Each collection, therefore, also represents a stable implementation of the calibration algorithm, where there is a continuum between the pre-launch (laboratory) calibration and the observed calibration at the point of new collection implementation.
The one caveat in this system is that discontinuity or trends can occur, not from algorithmic changes or from physical changes of the Earth system, but from sudden or unexpected changes to the sensor itself. While MCST may become aware of the problem, it may take until the start of a new collection to mitigate and apply a new calibration strategy. Figure 12 shows the time series of globally averaged, area-weighted, and quality-flag-weighted AOD for the 0.55 µm AOD product derived from Terra MODIS and Aqua MODIS data. Plotted are three curves for AOD over land and three curves for AOD over ocean, each corresponding to a different collection—C5.1, C6, and C6.1. Over land, Terra Collection 5.1 developed a significant trend in decreasing AOD, on the order of 18% per decade, but Aqua did not. There was no physical or algorithm-related explanation for this behavior. Analysis of the Collection 5.1 DT aerosol record, along with comparisons to Aqua (e.g., [20]), showed clear evidence that there was a drift in some of the visible wavelength channels (primarily the blue band) used in the over-land retrieval. Reference [159] explained how unexpected degradation of the internal “Lambertian” source led to the inaccurate calibration, and MCST developed the Earth-View calibration method [160] to mitigate this artificial drift. This new calibration method was applied for Collection 6 (starting 2013 and then reprocessed through the full record) and one can observe from Figure 12 how the −18%/decade trend over land was reduced to near zero. The differences between Collection 5.1 and Collection 6 in the early years (e.g., prior to 2004) are much smaller, and we can attribute much of that to the newer retrieval algorithm rather than calibration. The differences in the later years are due to the de-trending of the calibration.
Rather than algorithm updates, the primary driver for a new Collection 6.1 in 2017 was also calibration. A known solar flare event affected Terra and caused electronic noise that severely degraded some of the infrared wavelength bands used for cloud masking. Unchecked, the data records could have been useless. Instead, our DT algorithm was revised to reduce reliance on the thermal cloud masking. At the same time, MCST introduced a new set of visible/near-IR calibration coefficients that accounted for drift in additional channels. Potential discontinuities due to the “Terra anomaly” were reduced, leading to the smooth-looking data record seen in Figure 12.
The point is that the impact of calibration drift has been seen in the MODIS DT aerosol record, and, in fact, the DT aerosol record provides a useful “check” on the calibration. Even a 2% drift in calibrated reflectance (which still meets required specifications) impacts the aerosol time series. Through Collections 5, 6, and now 6.1, the differences attributed to the new DT algorithms is generally less than the impact of calibration updates. Now that we believe that there is general consistency between Terra and Aqua MODIS, as well as among other sensors, we are left with little or no significant trend on the global scale. By reducing the systematic drift on the global scale, we can study whether there are significant trends on the regional scale, as demonstrated in the right-hand panel of Figure 12.

7. Major Impacts of the Dark Target Algorithm

The MODIS DT aerosol algorithm was the first operational algorithm to produce nearly daily global coverage of aerosol products over ocean and land, and it was one of the first to make its debut during the AERONET era when validation could be demonstrated quickly and easily. The data-processing stream created two levels of aerosol products. Level 2 offered aerosol parameters along the orbital swath at nominal 10 km resolution, but Level 3 simplified the aerosol product by aggregating it into an equal angle grid of 1° latitude by 1° longitude. The Level 3 gridded product encouraged global analysis and comparison with global models. In addition, NASA invested in data distribution infrastructure that made acquiring, visualizing, and understanding the products straightforward. The Goddard Distributed Active Archive Center (DAAC), now the Level 1 and Atmosphere Archive and Distribution System (LAADS), made data acquisition easy for bulk analysis [161]. The GIOVANNI system provided quick data exploration online [162], and the Earth Observatory, an online magazine [163], highlighted new science and innovations made possible by NASA satellite products. The NASA Earth Data site [164] is a more recent compilation of web-based visualization tools, including WorldView [165], that continues to introduce and popularize the aerosol product, among many other satellite-derived products. In addition, the DT group produced a “stand-alone code” for other groups to adopt into their own algorithms and for students to develop understanding of radiative transfer through the atmosphere from hands-on experimentation [166]. Soon after the launch of the Terra and Aqua satellites, and the production of a suite of new satellite products, the aerosol products, in particular, were adopted by multiple communities early in the mission and have made a lasting impact on science, applications, and other aerosol remote sensing algorithms ever since.

7.1. Impact on Climate Prediction and Processes

The initial motivation for proposing an algorithm to produce aerosol characteristics from MODIS observations was to narrow the uncertainties in climate prediction. The first publication in this direction made use of MODIS aerosol products and Clouds and the Earth’s Radiant Energy System (CERES) satellite products of reflected clear-sky solar flux to define the direct radiative efficiency of the aerosol in an aggregated, global sense [123]. Soon following this paper were several others that used the MODIS product, sometimes in conjunction with other aerosol measurements or models, to put observational constraints on the direct radiative effects and anthropogenic direct forcing of the aerosol either regionally [90,167,168,169,170] or globally [45,57,171,172,173,174,175,176,177]. Another singularly important study is [178], which approached the radiative effect more holistically, not distinguishing between cloud-free and cloudy skies, instead using MODIS aerosol products in conjunction with CERES retrievals of all-sky radiative fluxes.
Other papers pioneered the use of satellite aerosol products, specifically the MODIS DT product, for evaluating global climate model representation of aerosol characteristics [179,180,181]. As the years passed, it became more common to rely on the DT product among other satellite-derived aerosol products for observationally based estimates of direct aerosol effects and forcing, and to use these products with AERONET to evaluate and constrain different aspects of the global models we rely on to estimate future climate scenarios [172,174,182,183,184,185,186,187,188,189,190,191,192,193].
The MODIS DT aerosol products have influenced one aspect of aerosol in climate prediction that requires specific attention, and that is the insight into aerosol–cloud relationships and aerosol indirect effects. The first paper in this category that used the DT product was [125], which demonstrated the inverse relationship between smoke loading and cloud cover over the Amazon basin when AOD was at moderate to high levels, and then showed that the decrease in cloud cover created a positive radiative effect (warming) that easily overpowered the direct negative effect of the aerosol itself (cooling). Following [125], many studies made use of the MODIS DT aerosol product in conjunction with other products, observations, and modeling to identify, quantify, or interpret aerosol–cloud associations in these datasets [194,195,196,197,198,199,200,201,202,203,204,205,206,207]. Without modeling, identified associations between MODIS DT AOD and cloud or other parameters may suggest, but do not prove, a physical process. However, the observed relationships between variables provide a greater challenge for models to duplicate than does the challenge of representing each variable independently.
The studies cited above are far from an exhaustive list, and we chose to highlight these few on the basis of their pioneering contribution or because of their impact, as evidenced by their high number of citations. The MODIS DT aerosol products were part of a revolution of satellite observational data that helped to narrow the uncertainties on some aspects of climate change prediction, such as aerosol direct radiative effects and forcing. At the same time, these observations, especially documented relationships between different parameters, challenged the community to consider some climate processes in a new light. The MODIS DT aerosol products, and the studies that made use of these products made a contribution to climate change assessment and prediction. The Fourth Intergovernmental Panel on Climate Change (IPCC) Assessment (AR4) highlighted the product with its own two-panel color figure [208] and made multiple references to the product and the observationally based estimates of aerosol radiative effects and forcing associated with this product. AR4 was the first IPCC report to include a category of observation based on its chart of aerosol direct radiative forcing and cited three studies that had all used the MODIS DT aerosol products [172,174,177]. Six years later, with the Fifth IPCC Assessment (AR5) [209], the novelty of constraining total column AOD and clear-sky direct aerosol radiative forcing with global satellite datasets such as the MODIS DT product had dissipated. Instead, the report emphasized climate-relevant processes with an expanded section on aerosol–cloud processes, stating “satellite-based remote sensing continues to be the primary source of global data for aerosol–cloud interaction”, and then stating a concern about the fidelity of the satellite datasets in proximity to clouds. The section in the AR5 on aerosol–cloud interaction is supported by dozens of references to both modeling and observational studies. Included in those references are many that used the MODIS DT aerosol products to find associations between DT AOD and other parameters, as cited above.

7.2. Impact on Long-Range Particle Transport

One important area that the MODIS aerosol product advanced considerably is quantification and characterization of long-range particle transport. The inspiration to use the product quantitatively for this purpose came from [210], which showed the potential of using the DT satellite product to identify dust aerosol over ocean but relied on field data to quantify the dust deposition. The first paper to address this geophysical application quantitatively using the MODIS product estimated the amount of African dust that crossed the Atlantic ocean [44], suggesting that African dust brought a significant amount of nutrients to the Amazon basin. Following that paper, the product has been used multiple times to produce an independent observationally based estimate of intercontinental particle transport and deposition [46,48,211,212,213,214]. The observationally based estimates provided an important constraint on modeled estimates [215,216,217,218,219,220] and were used to consider microbial transport on dust particles [221].

7.3. Impact on Air-Quality Monitoring and Mitigation

Although initially designed for climate applications, the concept of using the satellite-retrieved total column aerosol loading to infer the particle mass (PM) at ground level has been one of the most wide-spread applications involving the DT product. A bridge between AOD and PM on the ground is the total column mass loading, and this was first attempted by [54]. The first studies investigating the possibility of using MODIS-retrieved AOD for a true air-quality application were [128,129]. These papers were published within two weeks of each other. This was quickly followed by another pioneering study [222], leading to an effort to make the product available and usable to the operational air-quality forecast community [130]. In the 15 years since these early efforts, there has been an abundance of increasingly sophisticated attempts to make use of the MODIS DT and other aerosol products for air-quality monitoring, health impact assessment, and mitigation [223,224,225,226,227,228,229,230,231,232,233,234,235,236,237,238,239,240]. The cited papers are far from an exhaustive list, but they do represent a sample of highly cited studies that made use of the MODIS DT aerosol product in the field of air quality and exposure science.

7.4. Impact on Assimilation Systems

A key development in Earth system science that ran in parallel with the advancements in satellite remote sensing was the concept and implementation of global data assimilation systems [241]. These are modeling/observational hybrids that use an objective scheme to create physically consistent fields of different parameters in the Earth system. Originally, assimilation was the first step in numerical weather prediction, in which observations of meteorological variables such as wind, temperature, and humidity fields would be assimilated into 3D grids and used as input in a forecast model. As new Earth system parameters became available from satellite remote sensing, including aerosol, assimilation systems began to ingest these parameters in addition to the meteorological observations. The first system to ingest the MODIS DT aerosol product was the Naval Research Laboratory (NRL) Atmospheric Variational Data Assimilation System (NAVDAS) [131]. This was followed soon after by the European Center for Medium-Range Weather Forecasts (ECMWF) integrated forecast system [132]. In both of these cases, the operational AOD product had to be carefully screened to assure only the highest-quality product entered the system, but the studies reported that ingesting the MODIS DT product significantly improved the aerosol-forecasting ability of the models and reduced variance when comparing with ground truth [131]. Initially, only the DT AOD over ocean was used; however, after the second-generation DT product over land was made operational [18,19], the assimilation systems also began using the global land AOD [242]. Other examples using MODIS DT AOD in assimilation systems include [243,244,245]. The success with the MODIS DT AOD product was an encouraging first step, and assimilation systems have now matured to encompass a wide range of different geophysical observations including AOD from multiple satellites and products [246,247].
In many ways, the original goals in developing the DT aerosol products, which were to provide new insight into the global aerosol system and to help constrain estimates of climate forcing and change, are best served by assimilation systems which act to integrate many observations into a single system. The MODIS DT aerosol product played a significant role in advancing the capabilities of these important systems.

7.5. Impact on Aerosol Remote Sensing

In addition to having impact on Earth science and applications, the DT aerosol algorithm has been a major influence in the field of aerosol remote sensing. The innovations put into place to create a nearly global aerosol product, over ocean and land, have been copied, adapted, and improved upon by many other groups over the past 30 years. For example, the MODIS pre-launch algorithm for atmospheric correction over land [248] intended to use the at-launch MODIS DT aerosol product as input. Soon after launch, the atmospheric correction developers made a few adjustments to the AOD product, mostly creating a finer-resolution product needed by the land community [249]; however, the fundamental algorithm remained the same. By Collection 5, the atmospheric correction algorithm had added additional wavelengths to the aerosol retrieval (490 nm, 443 nm, 412 nm) and changed the wavelengths at which the surface reflectance ratios were calculated [250]. Eventually the MODIS atmospheric correction algorithm was ported to new sensors (e.g., Landsat-8 Operational Land Imager). At this stage, the aerosol retrieval part of the algorithm was still based on the original principles of [12], but the aerosol models, the wavelengths used in the inversion, and the surface reflectance ratios had all changed [251]. Most importantly, when the MODIS DT algorithm moved to the second generation over land [18,19], the MODIS atmospheric correction algorithm and its descendants did not; thus, the two algorithms now do not use the same inversion method. Nonetheless, the influence of the original MODIS DT algorithm on the atmospheric correction is apparent in that the atmospheric correction algorithm still assumes surface reflectance ratios to translate assumptions about the surface from wavelengths less sensitive to aerosol to wavelengths more sensitive, and then retrieve where the sensitivity is greatest.
Other algorithms can also trace their heritage back to the MODIS DT algorithm. For example, many algorithms and groups make use of the Dark Target concept over land, using relationships between visible and shortwave infrared bands to separate atmospheric and surface contributions to satellite-measured reflectance. These include the family of algorithms connected with the Along Track Scanning Radiometer (ATSR), Advanced ATSR (AATSR), and ATSR-2 [252,253] and derivatives from these original algorithms (e.g., [254]). Other over-land algorithms that follow the DT innovation for surface reflectance include the algorithms developed by the group at Yonsei University and applied to the Meteorological Imager (MI) [255] Geostationary Ocean Color Imager (GOCI) [256,257,258], Advanced Himawari Imager (AHI) [259], and others [260]. The NOAA aerosol algorithms over land, both the at-launch algorithm applied to VIIRS [261] and the Enterprise Processing System (EPS) applied to VIIRS and the Advanced Baseline Imagers [262], are Dark Target algorithms that have evolved from the original DT concept described in [12,60]. The Deep Blue (DB) aerosol algorithm [152], the DT’s sister algorithm on MODIS and VIIRS, turned into a DT-type land surface parameterization when the previously bright surface algorithm was adapted for vegetated surfaces [80,263]. Even the third aerosol algorithm on MODIS, the Multiangle Implementation of Atmospheric Correction (MAIAC) [264] makes use of assumed relationships between the shortwave infrared and the visible channels during its retrieval.
At least two algorithm families have adapted the DT ocean algorithm [13] in nearly its entirety. These are the MEdium Resolution Imaging Spectrometer (MERIS) Aerosol Load and Altitude from MERIS over Ocean (ALAMO) [265,266] and NOAA [261,262] algorithms. Other algorithms such as the Polarization and Anisotropy of Reflectances for Atmospheric Science coupled with Observations from a Lidar (PARASOL)-POLarization and Directionality of Earth’s Radiances (POLDER) algorithm were influenced by the DT ocean algorithm, incorporating a retrieval that mixes one fine mode and one coarse mode [267,268], but otherwise deviates from DT to make use of the multiangle polarization of POLDER.
We see the influence of DT innovations across the aerosol remote sensing community. Many algorithms followed the DT lead in turning to total column inversions from AERONET to define their aerosol models [257,260,261,269], but others continued to use other databases derived from in situ measurements [254]. The 3 × 3 spatial variability cloud mask [122] and the subpixel snow detection [127] have made their way into subsequent algorithms [257,260,270]. The fact is that the innovations that the DT algorithm brought to aerosol remote sensing are now implemented so widely that they are now standard practice across the community.

8. Discussion

After 30 years, the DT algorithm is well on its path forward, expanding to other sensors beyond MODIS. Currently a version of DT is running operationally using VIIRS observations as inputs [24,148] and a prototype DT algorithm has been applied to the Advanced Himawari Imager (AHI) [149] and the two Advanced Baseline Imagers (ABIs) currently in geosynchronous orbit on the Himawari, GOES-E, and GOES-W satellites [271]. The goal is to provide aerosol data users with a comprehensive view of the global aerosol system, combining the global coverage of polar-orbiting satellites in low Earth orbit (LEO) with the high temporal coverage of sensors in geosynchronous orbit (GEO). Using the same basic algorithm across all sensors and platforms provides a necessary level of consistency for global studies. Even so, differences in sensor characteristics including wavelengths, spatial and temporal resolution, geometries, and unresolved calibration offsets make the task challenging. The DT team intends to homogenize these differences as much as possible and present the data on a common moderate spatial and temporal resolution grid. Figure 13 demonstrates how a DT merged GEO/LEO view of the global aerosol system might look at a single point in time. The combination of DT retrievals from all of these sensors smoothly fills in holes left by any individual sensor. Such spatial coverage will repeat at every time step, likely to be at minimum every 30 min.
The Dark Target algorithm can also be applied to more advanced multiangle polarimeters that have hyperspectral or multiband wavelengths across the same range as MODIS. Examples of such sensors include the Polarization and Directionality of Earth Reflectances (POLDER) [268] and the radiometer and polarimeters of the Plankton, Aerosol, Clouds, Ocean Ecosystems (PACE) mission [272]. This provides a well-understood baseline for global statistics of aerosol parameters and an opportunity to continue and maintain long-term monitoring of the aerosol system into the coming decades.

9. Conclusions

The Dark Target aerosol algorithm produced satellite-derived products that changed our view of the global aerosol system, enabled innovative scientific studies, contributed to new ways of monitoring and forecasting air quality, and influenced the field of aerosol remote sensing. By all accounts, the DT algorithm has been one of NASA’s important contributions to Earth science and applications. Looking back now, over three decades, we can pinpoint the features of the algorithm and the environment in which it was developed, produced, and disseminated that enabled its widespread acceptance and integration into various user communities.
  • The algorithm is based on physical understanding of aerosols, as well as their environment and radiative transfer. The algorithms are not mathematical inversions in the purest sense but are tuned to work within the realities of the physical world. Nevertheless, the algorithm retains as much flexibility as possible, given the information content of multiwavelength sensors.
  • Extensive pre- and postlaunch field experiments with multiple types of measurements including simulations of the future sensor, validation for proto-algorithms, and characterization of parameters that would become assumptions in the algorithm were essential elements contributing to the DT success.
  • Concurrent development of a robust ground validation program, involving AERONET, MAN, and the MAPSS validation system that automatically linked the ground truth with the satellite products was the single most critical element of success. Characterizing the uncertainty of the aerosol products provided assurance to potential users.
  • Having an “at-launch” algorithm ready to go on day 1 of the satellite mission required an investment of a decade of development time. It also required an algorithm that could function “on the fly” and not wait for an accumulation of statistics to constrain assumptions, such as a database of land surface reflectances.
  • The concept of data collections allowed state-of-the-science algorithms to produce stable time series. This kept the algorithms and calibration fresh and relevant, while guaranteeing consistency to user communities.
  • Investment in easily accessible visualization, analysis, and dissemination tools lowered the barrier of entry for users of all levels of ability. Providing the data in 1° × 1° gridded Level 3 arrays was key to enticing the global modeling community to use the data in their studies, while providing the 10 km and later the 3 km Level 2 data along the orbital swaths attracted the air quality community. Having a simple, functional data dissemination service, responsive to users, was another important element of success.
  • The products were delivered at multiple levels of difficulty to satisfy multiple needs. The goal was to maintain simplicity in the products, while not sacrificing the quality science behind the algorithm or the variety of retrieved parameters necessary for sophisticated analysis.
  • Continued investment in maintenance of the algorithm was essential, to keep the algorithm relevant as user needs evolved, particularly as the sensors degraded.
We note that many of the elements contributing to the success of the DT algorithm and products lay beyond the scope of the DT team. NASA’s investment in AERONET, field experiments, reprocessing, a user-friendly data infrastructure, and a long-term commitment to maintaining and improving the algorithm were equally (or more) important than the accomplishments of the team itself.
Now looking forward, we have an opportunity to take these “lessons learned” and apply them to a constellation of new opportunities. The DT algorithm has already been ported to the polar-orbiting VIIRS sensor and to the geosynchronous AHI sensor. Each time the algorithm is applied to a new sensor, we face new challenges. Both VIIRS and AHI introduced new viewing geometries, and they required adjustments to gaseous absorption and to specific aspects of the traditional algorithm because of missing wavelengths. However, the future of the DT algorithm and of operational satellite remote sensing in general is the unification of multiple sensors aboard many satellite platforms in a variety of orbits. The best way to move forward toward this unification is to apply a single algorithm or family of algorithms across all the sensors and platforms, managing consistency in the process. In this way, the attempt of characterizing the global aerosol system that began over 30 years ago will grow closer to reality.

Author Contributions

Conceptualization, L.A.R., R.C.L., S.M., and D.T.; software, S.M., Y.S., V.S., and L.A.M.; validation, Y.S., V.S., L.A.M., C.I., R.C.L., R.G.K., and B.N.H.; formal analysis, P.G., Y.S., V.S., Y.Z., M.K., F.P., and R.-R.L.; writing—original draft preparation, L.A.R.; writing—review and editing, D.T., C.I., L.A.M., V.S., Y.S., Y.Z., R.C.L., S.G., S.M., R-R.L., M.K., F.P., P.G., R.G.K., and B.N.H.; visualization, V.S., Y.S., P.G., M.K., R-R.L., R.K., and R.C.L.; supervision, R.C.L. and S.M.; project administration, R.C.L.; funding acquisition, R.C.L. All authors have read and agreed to the published version of the manuscript.

Funding

This research was funded by “NASA Earth Science Senior Review 2017 MODIS algorithm maintenance” and “NASA Making Earth System Data Records for Use in Research Environments (NNH17ZDA001N-MEASURES)”. C.I. is also grateful for partial support received during the preparation of this article from the Educational Partnership Program of the National Oceanic and Atmospheric Administration (NOAA), US Department of Commerce, under Agreement No. #NA16SEC4810006.

Acknowledgments

The authors acknowledge the many individuals who have contributed to the Dark Target algorithm but who are too many to list by name. These include all the members of the AERONET team, all the individual AERONET investigators, and all the site managers who together have created an indispensable tool for studying the global aerosol system. A special acknowledgement to D. Allen Chu who contributed significant hands-on work during the first two decades of the Dark Target journey. We also want to acknowledge the leadership within the MODIS Science Team and at NASA Earth Science for investing in the concept of Earth System Science, in which the global aerosol system plays a role. Finally, we remember Yoram J. Kaufman who conceived the algorithm and led this team for 15 years and, by doing so, changed our understanding of the global aerosol system.

Conflicts of Interest

The authors declare no conflict of interest.

References

  1. Kaufman, Y.; Tanré, D.; Boucher, O. A satellite view of aerosols in the climate system. Nature 2002, 419, 215–223. [Google Scholar] [CrossRef]
  2. Tanré, D.; Kaufman, Y.; Nakajima, T.; Ramanathan, V. Preface to special section on Global Aerosol System. J. Geophys. Res. 2005, 110, D10S01. [Google Scholar] [CrossRef] [Green Version]
  3. Stier, P.; Feichter, J.; Roeckner, E.; Kloster, S.; Esch, M. The evolution of the global aerosol system in a transient climate simulation from 1860 to 2100. Atmos. Chem. Phys. 2006, 6, 3059–3076. [Google Scholar] [CrossRef] [Green Version]
  4. Lawton, J. Earth System Science. Science 2001, 292, 1965. [Google Scholar] [CrossRef]
  5. Bowdle, D.A.; Rothermel, J.; Arnold, J.E.; Williams, S.F. GLObal Backscatter Experiment (GLOBE) Pacific survey mission. In 4th Airborne Geoscience Workshop; NASA: Washington, WA, USA, 1991; pp. 107–110. [Google Scholar]
  6. Griggs, M. Measurements of Atmospheric Aerosol Optical Thickness over Water Using ERTS-1 Data. J. Air Poll. Control. Assoc. 1975, 25, 626. [Google Scholar] [CrossRef] [PubMed] [Green Version]
  7. Fraser, R.S. Satellite measurement of mass of Sahara dust in the atmosphere. Appl. Opt. 1976, 15, 2471–2479. [Google Scholar] [CrossRef]
  8. Mekler, Y.; Quenzel, H.; Ohring, G.; Marcus, I. Relative atmospheric aerosol content from ERTS observations. J. Geophys. Res. 1977, 82, 967–972. [Google Scholar] [CrossRef]
  9. Stowe, L.L.; Carey, R.M.; Pellegrino, P.P. Monitoring the Mt. Pinatubo aerosol layer with NOAA/11 AVHRR data. Geophys. Res. Lett. 1992, 19, 159–162. [Google Scholar] [CrossRef] [Green Version]
  10. Husar, R.B.; Stowe, L.L.; Prospero, J.M. Characterization of tropospheric aerosols over the oceans with the NOAA Advanced Very High Resolution Radiometer optical thickness operational product. J. Geophys. Res. 1997, 102, 16889–16910. [Google Scholar] [CrossRef] [Green Version]
  11. Tilford, S.G.; Asrar, G.; Backlund, P.W. Mission to planet earth. Adv. Space Res. 1994, 14, 5–9. [Google Scholar] [CrossRef]
  12. Kaufman, Y.J.; Tanré, D.; Remer, L.A.; Vermote, E.; Chu, A.; Holben, B.N. Operational remote sensing of tropospheric aerosol over land from EOS moderate resolution imaging spectroradiometer. J. Geophys. Res. 1997, 102, 17051–17067. [Google Scholar] [CrossRef]
  13. Tanré, D.; Kaufman, Y.J.; Herman, M.; Mattoo, S. Remote sensing of aerosol properties over oceans using the MODIS/EOS spectral radiances. J. Geophys. Res. 1997, 102, 16971–16988. [Google Scholar] [CrossRef]
  14. Holben, B.N.; Eck, T.F.; Slutsker, I.; Tanre, D.; Buis, J.P.; Setzer, A.; Vermote, E.; Reagan, J.A.; Kaufman, Y.; Nakajima, T.; et al. AERONET—A federated instrument network and data archive for aerosol characterization. Rem. Sens. Environ. 1998, 66, 1–16. [Google Scholar] [CrossRef]
  15. Levy, R.C.; Remer, L.A.; Kleidman, R.G.; Mattoo, S.; Ichoku, C.; Kahn, R.; Eck, T.F. Global evaluation of the Collection 5 MODIS dark-target aerosol products over land. Atmos. Chem. Phys. 2010, 10, 10399–10420. [Google Scholar] [CrossRef] [Green Version]
  16. Remer, L.A.; Kaufman, Y.J.; Tanré, D.; Mattoo, S.; Chu, D.A.; Martins, J.V.; Li, R.-R.; Ichoku, C.; Levy, R.C.; Kleidman, R.G.; et al. The MODIS aerosol algorithm, products and validation. J. Atmos. Sci. 2005, 62, 947–973. [Google Scholar] [CrossRef] [Green Version]
  17. Remer, L.A.; Mattoo, S.; Levy, R.C.; Munchak, L.A. MODIS 3 km aerosol product: Algorithm and global perspective. Atmos. Meas. Tech. 2013, 6, 1829–1844. [Google Scholar] [CrossRef] [Green Version]
  18. Levy, R.C.; Remer, L.A.; Dubovik, O. Global aerosol optical properties and application to Moderate Resolution Imaging Spectroradiometer aerosol retrieval over land. J. Geophys. Res. 2007, 112, D13210. [Google Scholar] [CrossRef] [Green Version]
  19. Levy, R.C.; Remer, L.A.; Mattoo, S.; Vermote, E.F.; Kaufman, Y.J. Second-generation operational algorithm: Retrieval of aerosol properties over land from inversion of Moderate Resolution Imaging Spectroradiometer spectral reflectance. J. Geophys. Res. 2007, 112, D13211. [Google Scholar] [CrossRef] [Green Version]
  20. Levy, R.C.; Mattoo, S.; Munchak, L.A.; Remer, L.A.; Sayer, A.M.; Patadia, F.; Hsu, N.C. The Collection 6 MODIS aerosol products over land and ocean. Atmos. Meas. Tech. 2013, 6, 2989–3034. [Google Scholar] [CrossRef] [Green Version]
  21. Levy, R.C.; Mattoo, S.; Sawyer, V.; Shi, Y.; Colarco, P.R.; Lyapustin, A.I.; Wang, Y.; Remer, L.A. Exploring systematic offsets between aerosol products from the two MODIS sensors. Atmos. Meas. Tech. 2018, 11, 4073–4092. [Google Scholar] [CrossRef] [Green Version]
  22. Gupta, P.; Levy, R.C.; Mattoo, S.; Remer, L.A.; Munchak, L.A. A surface reflectance scheme for retrieving aerosol optical depth over urban surfaces in MODIS Dark Target retrieval algorithm. Atmos. Meas. Tech. 2016, 9, 3293–3308. [Google Scholar] [CrossRef] [Green Version]
  23. Patadia, F.; Levy, R.C.; Mattoo, S. Correcting for trace gas absorption when retrieving aerosol optical depth from satellite observations of reflected shortwave radiation. Atmos. Meas. Tech. 2018, 11, 3205–3219. [Google Scholar] [CrossRef] [Green Version]
  24. Sawyer, V.; Levy, R.; Mattoo, S.; Cureton, G.; Shi, Y.; Remer, L.A. Continuing the MODIS Dark Target aerosol time series with VIIRS. Remote Sens. 2020, 12, 308. [Google Scholar] [CrossRef] [Green Version]
  25. Rao, C.R.N.; Stowe, L.L.; McClain, E.P. Remote sensing of aerosols over the oceans using AVHRR data Theory, practice and applications. Int. J. Rem. Sens. 1989, 10, 743–749. [Google Scholar] [CrossRef]
  26. Stowe, L.L.; Ignatov, A.M.; Singh, R.R. Development, validation, and potential enhancements to the second-generation operational aerosol product at the National Environmental Satellite, Data, and Information Service of the National Oceanic and Atmospheric Administration. J. Geophys. Res. Atmos. 1997, 102, 16923–16934. [Google Scholar] [CrossRef] [Green Version]
  27. Long, C.S.; Stowe, L.L. Using the NOAA/AVHRR to study stratospheric aerosol optical thicknesses following the Mt. Pinatubo eruption. Geophys. Res. Lett. 1994, 21, 2215–2218. [Google Scholar] [CrossRef]
  28. Ignatov, A.; Stowe, L.; Singh, R. Sensitivity study of the Angstrom exponent derived from AVHRR over oceans. Adv. Space Res. 1998, 21, 439–442. [Google Scholar] [CrossRef]
  29. Durkee, P.A.; Pfeil, F.; Frost, E.; Shema, R. Global analysis of aerosol particle characteristics. Atmos. Environ. Part A Gen. Topics 1991, 25, 2457–2471. [Google Scholar] [CrossRef]
  30. Nakajima, T.; Higurashi, A. A use of two-channel radiances for an aerosol characterization from space. Geophys. Res. Lett. 1998, 25, 3815–3818. [Google Scholar] [CrossRef]
  31. Higurashi, A.; Nakajima, T. Development of a Two-Channel Aerosol Retrieval Algorithm on a Global Scale Using NOAA AVHRR. J. Atmos. Sci. 1999, 56, 924–941. [Google Scholar] [CrossRef]
  32. Mishchenko, M.I.; Geogdzhayev, I.V.; Cairns, B.; Rossow, W.B.; Lacis, A.A. Aerosol retrievals over the ocean by use of channels 1 and 2 AVHRR data: Sensitivity analysis and preliminary results. Appl. Opt. 1999, 38, 7325–7341. [Google Scholar] [CrossRef] [PubMed]
  33. Geogdzhayev, I.V.; Mishchenko, M.I.; Rossow, W.B.; Cairns, B.; Lacis, A.A. Global Two-Channel AVHRR Retrievals of Aerosol Properties over the Ocean for the Period of NOAA-9 Observations and Preliminary Retrievals Using NOAA-7 and NOAA-11 Data. J. Atmos. Sci. 2002, 59, 262–278. [Google Scholar] [CrossRef] [Green Version]
  34. Ignatov, A.; Sapper, J.; Cox, S.; Laszlo, I.; Nalli, N.R.; Kidwell, K.B. Operational Aerosol Observations (AEROBS) from AVHRR/3 On Board NOAA-KLM Satellites. J. Atmos. Oceanic Technol. 2004, 21, 3–26. [Google Scholar] [CrossRef]
  35. Hsu, N.C.; Lee, J.; Sayer, A.M.; Carletta, N.; Chen, S.-H.; Tucker, C.J.; Holben, B.N.; Tsay, S.-C. Retrieving near-global aerosol loading over land and ocean from AVHRR. J. Geophys. Res. Atmos. 2017, 122, 9968–9989. [Google Scholar] [CrossRef] [Green Version]
  36. Herman, J.R.; Bhartia, P.K.; Torres, O.; Hsu, C.; Seftor, C.; Celarier, E. Global distribution of UV-absorbing aerosols from Nimbus 7/TOMS data. J. Geophys. Res. 1997, 102, 16911–16922. [Google Scholar] [CrossRef]
  37. Tanré, D.; Herman, M.; Kaufman, Y.J. Information on the Aerosol Size Distribution contained in the Solar Reflected Spectral Radiances. J. Geophys. Res. 1996, 101, 19043–19060. [Google Scholar] [CrossRef]
  38. D’Almeida, G.A. On the variability of desert aerosol radiative characteristics. J. Geophys. Res. 1987, 92, 3017–3026. [Google Scholar] [CrossRef]
  39. Tanré, D.; Remer, L.A.; Kaufman, Y.J.; Mattoo, S.; Hobbs, P.V.; Livingston, J.M.; Russell, P.B.; Smirnov, A. Retrieval of Aerosol Optical Thickness and Size Distribution over Ocean from the MODIS Airborne Simulator during TARFOX. J. Geophys. Res. 1999, 104, 2261–2278. [Google Scholar] [CrossRef]
  40. Tanré, D.; Kaufman, Y.J.; Holben, B.N.; Chatenet, B.; Karnieli, A.; Lavenu, F.; Blarel, L.; Dubovik, O.; Remer, L.A.; Smirnov, A. Climatology of dust aerosol size distribution and optical properties derived from remotely sensed data in the solar spectrum. J. Geophys. Res. 2001, 106, 18205–18218. [Google Scholar] [CrossRef] [Green Version]
  41. Dubovik, O.; King, M.D. A flexible inversion algorithm for retrieval of aerosol optical properties from sun and sky radiance measurements. J. Geophys. Res. 2000, 105, 20673–20696. [Google Scholar] [CrossRef] [Green Version]
  42. Dubovik, O.; Smirnov, A.; Holben, B.N.; King, M.D.; Kaufman, Y.J.; Eck, T.F.; Slutsker, I. Accuracy assessment of aerosol optical properties retrieval from AERONET sun and sky radiance measurements. J. Geophys. Res. 2000, 105, 9791–9806. [Google Scholar] [CrossRef] [Green Version]
  43. Dubovik, O.; Holben, B.N.; Eck, T.F.; Smirnov, A.; Kaufman, Y.J.; King, M.D.; Tanré, D.; Slutsker, I. Variability of absorption and optical properties of key aerosol types observed in worldwide locations. J. Atmos. Sci. 2002, 59, 590–608. [Google Scholar] [CrossRef]
  44. Kaufman, Y.J.; Koren, I.; Remer, L.A.; Tanré, D.; Ginoux, P.; Fan, S. Dust transport and deposition observed from the Terra-Moderate Resolution Imaging Spectroradiometer (MODIS) spacecraft over the Atlantic Ocean. J. Geophys. Res. 2005, 110, D10S12. [Google Scholar] [CrossRef] [Green Version]
  45. Kaufman, Y.J.; Boucher, O.; Tanré, D.; Chin, M.; Remer, L.A.; Takemura, T. Aerosol anthropogenic component estimated from satellite data. Geophys. Res. Lett. 2005, 32, L17804. [Google Scholar] [CrossRef]
  46. Yu, H.; Remer, L.A.; Chin, M.; Bian, H.-S.; Tan, Q.; Yuan, T.; Zhang, Y. Aerosols from Overseas Rival Domestic Emissions over North America. Science 2012, 337, 566–569. [Google Scholar] [CrossRef] [PubMed]
  47. Kleidman, R.G.; O’Neill, N.T.; Remer, L.A.; Kaufman, Y.J.; Eck, T.F.; Tanré, D.; Dubovik, O.; Holben, B.N. Comparison of MODIS and AERONET remote sensing retrievals of aerosol fine mode fraction over ocean. J. Geophys. Res. 2005, 110, D22205. [Google Scholar] [CrossRef]
  48. Yu, H.; Remer, L.A.; Chin, M.; Bian, H.; Kleidman, R.G.; Diehl, T. A satellite-based assessment of transpacific transport of pollution aerosol. J. Geophys. Res. 2008, 113, D14S12. [Google Scholar] [CrossRef] [Green Version]
  49. Yu, H.; Chin, M.; Remer, L.A.; Kleidman, R.G.; Bellouin, N.; Bian, H.S.; Diehl, T. Variability of marine aerosol fine-mode fraction and estimates of anthropogenic aerosol component over cloud-free oceans from the Moderate Resolution Imaging Spectroradiometer (MODIS). J. Geophys. Res. 2009, 114, D10206. [Google Scholar] [CrossRef] [Green Version]
  50. King, M.D.; Menzel, W.P.; Grant, P.S.; Myers, J.S.; Arnold, G.T.; Platnick, S.E.; Gumley, L.E.; Tsay, S.-C.; Moeller, C.C.; Fitzgerald, M.; et al. Airborne scanning spectrometer for remote sensing of cloud, aerosol, water vapor and surface properties. J. Atmos. Ocean. Technol. 1996, 13, 777–794. [Google Scholar] [CrossRef] [Green Version]
  51. Gassó, S.; Hegg, D.A. Comparison of columnar aerosol optical properties measured by the MODIS airborne simulator with in situ measurements. Rem. Sens. Environ. 1998, 66, 138–152. [Google Scholar] [CrossRef]
  52. Russell, P.B.; Hobbs, P.V.; Stowe, L.L. Aerosol properties and radiative effects in the United States East Coast haze plume: An overview of the Tropospheric Aerosol Radiative Forcing Observational Experiment (TARFOX). J. Geophys. Res. 1999, 104, 2213–2222. [Google Scholar] [CrossRef]
  53. Hobbs, P.V. An overview of the University of Washington airborne measurements and results from the Tropospheric Aerosol Radiative Forcing Observational Experiment (TARFOX). J. Geophys. Res. 1999, 104, 2233–2238. [Google Scholar] [CrossRef]
  54. Gassó, S.; Hegg, D.A. On the retrieval of columnar aerosol mass and CCN concentration by MODIS. J. Geophys. Res. 2003, 108, 4010. [Google Scholar] [CrossRef]
  55. Matsumoto, T.; Russell, P.; Mina, C.; Van Ark, W.; Banta, V. Airborne Tracking Sunphotometer. J. Atmos. Ocean. Technol. 1987, 4, 336–339. [Google Scholar] [CrossRef]
  56. Russell, P.B.; Livingston, J.M.; Hignett, P.; Kinne, S.; Wong, J.; Chien, A.; Bergstrom, R.; Durkee, P.; Hobbs, P.V. Aerosol-induced radiative flux changes off the United States mid-Atlantic coast: Comparison of values calculated from sunphotometer and in situ data with those measured by airborne pyranometer. J. Geophys. Res. 1999, 104, 2289–2307. [Google Scholar] [CrossRef]
  57. Remer, L.A.; Kaufman, Y.J. Aerosol direct radiative effect at the top of the atmosphere over cloud free ocean derived from four years of MODIS data. Atmos. Chem. Phys. 2006, 6, 237–253. [Google Scholar] [CrossRef] [Green Version]
  58. Kaufman, Y.J.; Sendra, C. Algorithm for atmospheric corrections. Int. J. Remote Sens. 1988, 9, 1357–1381. [Google Scholar] [CrossRef]
  59. Kaufman, Y.J.; Remer, L.A. Detection of Forests Using Mid-IR Reflectance: An Application for Aerosol Studies. IEEE Trans. Geosci. Rem. Sens. 1994, 32, 672–683. [Google Scholar] [CrossRef]
  60. Kaufman, Y.J.; Wald, A.E.; Remer, L.A.; Gao, B.-C.; Li, R.-R.; Flynn, L. The MODIS 2.1 µm Channel—Correlation with visible reflectance for use in remote sensing of aerosol. IEEE Trans. Geosci. 1997, 35, 1286–1298. [Google Scholar] [CrossRef]
  61. Remer, L.A.; Wald, A.E.; Kaufman, Y.J. Angular and Seasonal Variation of Spectral Surface Reflectance Ratios: Application to the Remote Sensing of Aerosol Over Land. IEEE Trans. Geosci. Rem. Sens. 2001, 39, 275–283. [Google Scholar] [CrossRef] [Green Version]
  62. Kaufman, Y.J.; Gobron, N.; Pinty, B.; Widlowski, J.-L.; Verstraete, M.M. Relationship between surface reflectance in the visible and mid-IR used in MODIS aerosol algorithm—Theory. Geophys. Res. Lett. 2002, 29, 2116. [Google Scholar] [CrossRef] [Green Version]
  63. Kaufman, Y.J.; Gitelson, A.; Karnieli, A.; Ganor, E.; Fraser, R.S.; Nakajima, T.; Mattoo, S.; Holben, B.N. Size distribution and scattering phase function of aerosol particles retrieved from sky brightness measurements. J. Geophys. Res. 1994, 99, 10341–10356. [Google Scholar] [CrossRef] [Green Version]
  64. Remer, L.A.; Kaufman, Y.J. Dynamical Aerosol Model: Urban/industrial Aerosol. J. Geophys. Res. 1998, 103, 13859–13871. [Google Scholar] [CrossRef] [Green Version]
  65. Remer, L.A.; Kaufman, Y.J.; Holben, B.N.; Thompson, A.M.; McNamara, D. A model of tropical biomass burning smoke aerosol size distribution. J. Geophys. Res. 1998, 103, 31879–31891. [Google Scholar] [CrossRef] [Green Version]
  66. Remer, L.A.; Gassó, S.; Hegg, D.A.; Kaufman, Y.J.; Holben, B.N. Urban/industrial aerosol: Ground-based sun/sky radiometer and airborne in situ measurements. J. Geophys. Res. 1997, 102, 16849–16859. [Google Scholar] [CrossRef]
  67. Yamasoe, M.A.; Kaufman, Y.J.; Dubovik, O.; Remer, L.A.; Holben, B.N.; Artaxo, P. Retrieval of the real part of the refractive index of aerosols from sun/sky radiometers during SCAR-B. J. Geophys. Res. 1998, 103, 31893–31902. [Google Scholar] [CrossRef] [Green Version]
  68. Chu, D.A.; Kaufman, Y.J.; Remer, L.A.; Holben, B.N. Remote sensing of smoke from MODIS airborne simulator during the SCAR-B experiment. J. Geophys. Res. 1998, 103, 31979–31988. [Google Scholar] [CrossRef]
  69. King, M.D.; Menzel, W.P.; Kaufman, Y.J.; Tanré, D.; Gao, B.-C.; Platnick, S.E.; Ackerman, S.A.; Remer, L.A.; Pincus, R.; Hubanks, P.A. Cloud and aerosol properties, precipitable water, and profiles of temperature and water vapor from MODIS. IEEE Trans. Geo. Rem. Sens. 2003, 41, 442–458. [Google Scholar] [CrossRef] [Green Version]
  70. Berrick, S.W.; Leptoukh, G.; Farley, J.D.; Rui, H. Giovanni: A Web Service Workflow-Based Data Visualization and Analysis System. IEEE Trans. Geo. Rem. Sens. 2009, 47, 106–113. [Google Scholar] [CrossRef]
  71. Holben, B.N.; Tanre, D.; Smirnov, A.; Eck, T.F.; Slutsker, I.; Abuhassan, N.; Newcomb, W.W.; Schafer, J.; Chatenet, B.; Lavenue, F.; et al. An emerging ground-based aerosol climatology: Aerosol Optical Depth from AERONET. J. Geophys. Res. 2001, 106, 12067–12097. [Google Scholar] [CrossRef]
  72. Smirnov, A.; Holben, B.N.; Eck, T.F.; Dubovik, O.; Slutsker, I. Cloud screening and quality control algorithms for the AERONET database. Rem. Sens. Environ. 2000, 73, 337–349. [Google Scholar] [CrossRef]
  73. Smirnov, A.; Holben, B.N.; Slutsker, I.; Giles, D.M.; McClain, C.R.; Eck, T.F.; Sakerin, S.M.; Macke, A.; Croot, P.; Zibordi, G.; et al. Maritime Aerosol Network as a component of Aerosol Robotic Network. J. Geophys. Res. 2009, 114, D06204. [Google Scholar] [CrossRef] [Green Version]
  74. Giles, D.M.; Sinyuk, A.; Sorokin, M.G.; Schafer, J.S.; Smirnov, A.; Slutsker, I.; Eck, T.F.; Holben, B.N.; Lewis, J.R.; Campbell, J.R.; et al. Advancements in the Aerosol Robotic Network (AERONET) Version 3 database—Automated near-real-time quality control algorithm with improved cloud screening for Sun photometer aerosol optical depth (AOD) measurements. Atmos. Meas. Tech. 2019, 12, 169–209. [Google Scholar] [CrossRef] [Green Version]
  75. King, M.D.; Kaufman, Y.J.; Tanré, D.; Nakajima, T. Remote Sensing of Tropospheric Aerosols from Space: Past, Present, and Future. Bull. Amer. Meteor. Soc. 1999, 80, 2229–2260. [Google Scholar] [CrossRef] [Green Version]
  76. Munchak, L.A.; Levy, R.C.; Mattoo, S.; Remer, L.A.; Holben, B.N.; Schafer, J.S.; Hostetler, C.A.; Ferrare, R.A. MODIS 3 km aerosol product: Applications over land in an urban/suburban region. Atmos. Meas. Tech. 2013, 6, 1747–1759. [Google Scholar] [CrossRef] [Green Version]
  77. Gupta, P.; Remer, L.A.; Levy, R.C.; Mattoo, S. Validation of MODIS 3 km land aerosol optical depth from NASA’s EOS Terra and Aqua missions. Atmos. Meas. Tech. 2018, 11, 3145–3159. [Google Scholar] [CrossRef] [Green Version]
  78. Xiao, Q.; Zhang, H.; Choi, M.; Li, S.; Kondragunta, S.; Kim, J.; Holben, B.; Levy, R.C.; Liu, Y. Evaluation of VIIRS, GOCI, and MODIS Collection 6 AOD retrievals against ground sunphotometer observations over East Asia. Atmos. Chem. Phys. 2016, 16, 1255–1269. [Google Scholar] [CrossRef] [Green Version]
  79. Xie, Y.; Zhang, Y.; Xiong, X.; Qu, J.J.; Che, H. Validation of MODIS aerosol optical depth product over China using CARSNET measurements. Atmos. Environ. 2011, 45, 5970–5978. [Google Scholar] [CrossRef]
  80. Hsu, N.C.; Jeong, M.-J.; Bettenhausen, C.; Sayer, A.M.; Hansell, R.; Seftor, C.S.; Huang, J.; Tsay, S.-C. Enhanced Deep Blue aerosol retrieval algorithm: The second generation. J. Geophys. Res. Atmos. 2013, 118, 9296–9315. [Google Scholar] [CrossRef]
  81. Liu, H.; Remer, L.A.; Huang, J.; Huang, H.-C.; Kondragunta, S.; Laszlo, I.; Oo, M.; Jackson, J.M. Preliminary evaluation of S-NPP VIIRS aerosol optical thickness. J. Geophys. Res. Atmos. 2014, 119, 3942–3962. [Google Scholar] [CrossRef]
  82. Nichol, J.E.; Bilal, M. Validation of MODIS 3 km resolution aerosol optical depth retrievals over Asia. Remote Sens. 2016, 8, 328. [Google Scholar] [CrossRef] [Green Version]
  83. O’Neill, N.T.; Eck, T.F.; Smirnov, A.; Holben, B.N.; Thulasiraman, S. Spectral discrimination of coarse and fine mode optical depth. J. Geophys. Res. 2003, 108, 4559–4573. [Google Scholar] [CrossRef]
  84. Ichoku, C.; Chu, D.A.; Mattoo, S.; Kaufman, Y.J.; Remer, L.A.; Tanré, D.; Slutsker, I.; Holben, B.N. A spatio-temporal approach for global validation and analysis of MODIS aerosol products. Geophys. Res. Lett. 2002, 29. [Google Scholar] [CrossRef] [Green Version]
  85. Petrenko, M.; Ichoku, C.; Leptoukh, G. Multi-sensor Aerosol Products Sampling System (MAPSS). Atmos. Meas. Tech. 2012, 5, 913–926. [Google Scholar] [CrossRef] [Green Version]
  86. MAPSS: Multi-Sensor Aerosol Products Sampling System. Available online: https://giovanni.gsfc.nasa.gov/mapss/ (accessed on 28 July 2020).
  87. Chu, D.A.; Kaufman, Y.J.; Ichoku, C.; Remer, L.A.; Tanré, D.; Holben, B.N. Validation of MODIS aerosol optical depth retrieval over land. Geophys. Res. Lett. 2002, 29. [Google Scholar] [CrossRef] [Green Version]
  88. Remer, L.A.; Tanré, D.; Kaufmann, Y.J.; Ichoku, C.; Mattoo, S.; Levy, R.; Chu, D.A.; Holben, B.; Dubovik, O.; Smirnov, A.; et al. Validation of MODIS aerosol retrieval over ocean. Geophys. Res. Lett. 2002, 29. [Google Scholar] [CrossRef] [Green Version]
  89. Chu, D.A.; Remer, L.A.; Kaufman, Y.J.; Schmid, B.; Redemann, J.; Knobelspiesse, K.; Chern, J.-D.; Livingston, J.; Russell, P.B.; Xiong, X.; et al. Evaluation of aerosol properties over ocean from Moderate Resolution Imaging Spectroradiometer (MODIS) during ACE-Asia. J. Geophys. Res. 2005, 110, D07308. [Google Scholar] [CrossRef] [Green Version]
  90. Ichoku, C.; Remer, L.A.; Kaufman, Y.J.; Levy, R.; Chu, D.A.; Tanré, D.; Holben, B.N. MODIS observation of aerosols and estimation of aerosol radiative forcing over southern Africa during SAFARI 2000. J. Geophys. Res. 2003, 108, 8499. [Google Scholar] [CrossRef]
  91. Levy, R.C.; Remer, L.A.; Tanré, D.; Kaufman, Y.J.; Ichoku, C.; Holben, B.N.; Livingston, J.M.; Russell, P.B.; Maring, H. Evaluation of the MODIS retrievals of dust aerosol over the ocean during PRIDE. J. Geophys. Res. 2003, 108. [Google Scholar] [CrossRef]
  92. Levy, R.C.; Remer, L.A.; Martins, J.V.; Kaufman, Y.J.; Plana-Fattori, A.; Redemann, J.; Russell, P.B.; Wenny, B. Evaluation of the MODIS aerosol retrievals over ocean and land during CLAMS. J. Atmos. Sci. 2005, 62, 974–992. [Google Scholar] [CrossRef]
  93. Xia, X.A.; Chen, H.B.; Wang, P.C. Validation of MODIS aerosol retrievals and evaluation of potential cloud contamination in East Asia. J. Environ. Sci. (China) 2004, 16, 832–837. [Google Scholar]
  94. Ichoku, C.; Remer, L.A.; Eck, T.F. Quantitative evaluation and intercomparison of morning and afternoon Moderate Resolution Imaging Spectroradiometer (MODIS) aerosol measurements from Terra and Aqua. J. Geophys. Res. 2005, 110, D10S03. [Google Scholar] [CrossRef] [Green Version]
  95. Tripathi, S.N.; Dey, S.; Chandel, A.; Srivastava, S.; Singh, R.P.; Holben, B.N. Comparison of MODIS and AERONET derived aerosol optical depth over the Ganga Basin, India. Ann. Geophys. 2005, 23, 1093–1101. [Google Scholar] [CrossRef] [Green Version]
  96. Sayer, A.M.; Hsu, N.C.; Eck, T.F.; Smirnov, A.; Holben, B.N. AERONET-based models of smoke-dominated aerosol near source regions and transported over oceans, and implications for satellite retrievals of aerosol optical depth. Atmos. Chem. Phys. 2014, 14, 11493–11523. [Google Scholar] [CrossRef] [Green Version]
  97. Wang, Y.; Yuan, Q.; Li, T.; Shen, H.; Zheng, L.; Zhang, L. Evaluation and comparison of MODIS Collection 6.1 aerosol optical depth against AERONET over regions in China with multifarious underlying surfaces. Atmos. Environ. 2019, 200, 280–301. [Google Scholar] [CrossRef] [Green Version]
  98. Wei, J.; Li, Z.; Peng, Y.; Sun, L. MODIS Collection 6.1 aerosol optical depth products over land and ocean: Validation and comparison. Atmos. Environ. 2019, 201, 428–440. [Google Scholar] [CrossRef]
  99. Bilal, M.; Nazeer, M.; Nichol, J.; Qiu, Z.; Wang, L.; Bleiweiss, M.P.; Shen, X.; Campbell, J.R.; Lolli, S. Evaluation of Terra-MODIS C6 and C6. 1 Aerosol Products against Beijing, XiangHe, and Xinglong AERONET Sites in China during 2004–2014. Remote Sens. 2019, 11, 486. [Google Scholar] [CrossRef] [Green Version]
  100. Bright, J.M.; Gueymard, C.A. Climate-specific and global validation of MODIS Aqua and Terra aerosol optical depth at 452 AERONET stations. Sol. Energy 2019, 183, 594–605. [Google Scholar] [CrossRef]
  101. Zhang, M.; Liu, J.; Li, W.; Bilal, M.; Zhao, F.; Zhang, C.; Yuan, B.; Khedher, K.M. Evaluation of the Aqua-MODIS C6 and C6. 1 Aerosol Optical Depth Products in the Yellow River Basin, China. Atmosphere 2019, 10, 426. [Google Scholar] [CrossRef] [Green Version]
  102. Choi, M.; Lim, H.; Kim, J.; Lee, S.; Eck, T.F.; Holben, B.N.; Garay, M.J.; Hyer, E.J.; Saide, P.E.; Liu, H. Validation, comparison, and integration of GOCI, AHI, MODIS, MISR, and VIIRS aerosol optical depth over East Asia during the 2016 KORUS-AQ campaign. Atmos. Meas. Tech. 2019, 12, 4619–4641. [Google Scholar] [CrossRef] [Green Version]
  103. Tian, X.; Gao, Z. Validation and Accuracy Assessment of MODIS C6. 1 Aerosol Products over the Heavy Aerosol Loading Area. Atmosphere 2019, 10, 548. [Google Scholar] [CrossRef] [Green Version]
  104. Fan, X.; Xia, X.; Chen, H. Intercomparison of Multiple Satellite Aerosol Products against AERONET over the North China Plain. Atmosphere 2019, 10, 480. [Google Scholar] [CrossRef] [Green Version]
  105. Che, H.; Yang, L.; Liu, C.; Xia, X.; Wang, Y.; Wang, H.; Wang, H.; Lu, X.; Zhang, X. Long-term validation of MODIS C6 and C6. 1 Dark Target aerosol products over China using CARSNET and AERONET. Chemosphere 2019, 236, 124268. [Google Scholar] [CrossRef] [PubMed]
  106. Mei, L.; Zhao, C.; de Leeuw, G.; Che, H.; Che, Y.; Rozanov, V.; Vountas, M.; Burrows, J.P. Understanding MODIS dark-target collection 5 and 6 aerosol data over China: Effect of surface type, aerosol loading and aerosol absorption. Atmos. Res. 2019, 228, 161–175. [Google Scholar] [CrossRef]
  107. Huang, J.; Kondragunta, S.; Laszlo, I.; Liu, H.; Remer, L.A.; Zhang, H.; Superczynski, S.; Ciren, P.; Holben, B.N.; Petrenko, M. Validation and expected error estimation of Suomi-NPP VIIRS aerosol optical thickness and Ångström exponent with AERONET. J. Geophys. Res. Atmos. 2016, 121, 7139–7160. [Google Scholar] [CrossRef] [Green Version]
  108. Huang, Y.; Zhu, B.; Zhu, Z.; Zhang, T.; Gong, W.; Ji, Y.; Xia, X.; Wang, L.; Zhou, X.; Chen, D. Evaluation and Comparison of MODIS Collection 6.1 and Collection 6 Dark Target Aerosol Optical Depth over Mainland China Under Various Conditions Including Spatiotemporal Distribution, Haze Effects, and Underlying Surface. Earth Space Sci. 2019, 6, 2575–2592. [Google Scholar] [CrossRef] [Green Version]
  109. Li, Y.; Shi, G.; Sun, Z. Evaluation and improvement of MODIS aerosol optical depth products over China. Atmos. Environ. 2020, 223, 117251. [Google Scholar] [CrossRef]
  110. You, Y.; Zhao, T.; Xie, Y.; Zheng, Y.; Zhu, J.; Xia, J.; Cao, L.; Wang, C.; Che, H.; Liao, Y.; et al. Variation of the aerosol optical properties and validation of MODIS AOD products over the eastern edge of the Tibetan Plateau based on ground-based remote sensing in 2017. Atmos. Environ. 2020, 223, 117257. [Google Scholar] [CrossRef]
  111. Yang, X.; Zhao, C.; Luo, N.; Zhao, W.; Shi, W.; Yan, X. Evaluation and Comparison of Himawari-8 L2 V1. 0, V2. 1 and MODIS C6. 1 aerosol products over Asia and the oceania regions. Atmos. Environ. 2020, 220, 117068. [Google Scholar] [CrossRef]
  112. Holben, B.N.; Eck, T.F.; Slutsker, I.; Smirnov, A.; Sinyuk, A.; Schafer, J.; Giles, D.; Dubovik, O. Aeronet’s Version 2.0 quality assurance criteria. Proc. SPIE Int. Soc. Opt. Eng. 2006, 6408, 64080Q. [Google Scholar] [CrossRef]
  113. Schmid, B.; Redemann, J.; Russell, P.B.; Hobbs, P.V.; Hlavka, D.L.; McGill, M.J.; Holben, B.N.; Welton, E.J.; Campbell, J.R.; Torres, O.; et al. Coordinated airborne, spaceborne, and ground-based measurements of massive thick aerosol layers during the dry season in southern Africa. J. Geophys. Res. 2003, 108, 8496. [Google Scholar] [CrossRef] [Green Version]
  114. Livingston, J.M.; Russell, P.B.; Reid, J.; Allen, D.A.; Dubovik, O.; Welton, E.J.; Campbell, J.R.; Christopher, S.; Redemann, J.; Schmid, B.; et al. Airborne Sun photometer measurements of aerosol optical depth and columnar water vapor during the Puerto Rico Dust Experiment and comparison with land, aircraft, and satellite measurements. J. Geophys. Res. 2003, 108, 8588. [Google Scholar] [CrossRef] [Green Version]
  115. Redemann, J.; Zhang, Q.; Livingston, J.; Russell, P.; Shinozuka, Y.; Clarke, A.; Johnson, R.; Levy, R. Testing aerosol properties in MODIS Collection 4 and 5 using airborne sunphotometer observations in INTEX-B/MILAGRO. Atmos. Chem. Phys. 2009, 9, 8159–8172. [Google Scholar] [CrossRef] [Green Version]
  116. Redemann, J.; Schmid, B.; Eilers, J.A.; Kahn, R.; Levy, R.C.; Russell, P.B.; Livingston, J.M.; Hobbs, P.V.; Smith, W.L., Jr.; Holben, B.N. Suborbital measurements of spectral aerosol optical depth and its variability at subsatellite grid scales in support of CLAMS 2001. J. Atmos. Sci. 2005, 62, 993–1007. [Google Scholar] [CrossRef] [Green Version]
  117. Russell, P.B.; Livingston, J.M.; Redemann, J.; Schmid, B.; Ramirez, S.A.; Eilers, J.; Kahn, R.; Chu, D.A.; Remer, L.; Quinn, P.K.; et al. Multi-grid-cell validation of satellite aerosol property retrievals in INTEX/ITCT/ICARTT 2004. J. Geophys. Res. 2007, 112, D12S09. [Google Scholar] [CrossRef] [Green Version]
  118. Holben, B.N.; Kim, J.; Sano, I.; Mukai, S.; Eck, T.F.; Giles, D.M.; Schafer, J.S.; Sinyuk, A.; Slutsker, I.; Smirnov, A.; et al. An overview of mesoscale aerosol processes, comparisons, and validation studies from DRAGON networks. Atmos. Chem. Phys. 2018, 18, 655–671. [Google Scholar] [CrossRef] [Green Version]
  119. Eck, T.F.; .Holben, B.N.; Reid, J.S.; Dubovik, O.; Smirnov, A.; O’Neill, N.T.; Slutsker, I.; Kinne, S. Wavelength dependence of the optical depth of biomass burning, urban and desert dust aerosols. J. Geophys. Res. 1999, 104, 31333–31350. [Google Scholar] [CrossRef]
  120. Reid, J.S.; Maring, H.B. Foreword to special section on the Puerto Rico Dust Experiment (PRIDE). J. Geophys. Res. 2003, 108, 8585. [Google Scholar] [CrossRef]
  121. Charlock, T.P.; Smith, W.L. PREFACE. J. Atmos. Sci. 2005, 62, 901–902. [Google Scholar] [CrossRef]
  122. Martins, J.V.; Tanré, D.; Remer, L.; Kaufman, Y.; Mattoo, S.; Levy, R. MODIS Cloud screening for remote sensing of aerosols over oceans using spatial variability. Geophys. Res. Lett. 2002, 29. [Google Scholar] [CrossRef] [Green Version]
  123. Christopher, S.A.; Zhang, J. Shortwave aerosol radiative forcing from MODIS and CERES observations over the oceans. Geophys. Res. Lett. 2002, 29, 6-1-6-4. [Google Scholar] [CrossRef] [Green Version]
  124. Li, R.-R.; Kaufman, Y.J.; Gao, B.-C.; Davis, C.O. Remote Sensing of Suspended Sediments and Shallow Coastal Waters. IEEE Trans. Geosci. Rem. Sens. 2003, 41, 559–566. [Google Scholar] [CrossRef]
  125. Koren, I.; Kaufman, Y.J.; Remer, L.A.; Martins, J.V. Measurement of the effect of Amazon smoke on the inhibition of cloud formation. Science 2004, 303, 1342–1345. [Google Scholar] [CrossRef] [PubMed] [Green Version]
  126. Kaufman, Y.J.; Remer, L.A.; Tanré, D.; Li, R.-R.; Kleidman, R.; Mattoo, S.; Levy, R.C.; Eck, T.F.; Holben, B.N.; Ichoku, C.; et al. A critical examination of the residual cloud contamination and diurnal sampling effects on MODIS estimates of aerosol over ocean. IEEE Trans. Geosci. Rem. Sens. 2005, 43, 2886–2897. [Google Scholar] [CrossRef]
  127. Li, R.-R.; Remer, L.; Kaufman, Y.J.; Mattoo, S.; Gao, B.-C.; Vermote, E. Snow and ice mask for the MODIS aerosol products. IEEE Geosci. Rem. Sens. Lett. 2005, 2, 306–310. [Google Scholar] [CrossRef]
  128. Wang, J.; Christopher, S.A. Intercomparison between satellite-derived aerosol optical thickness and PM2. 5 mass: Implications for air quality studies. Geophys. Res. Lett. 2003, 30, 2095. [Google Scholar] [CrossRef]
  129. Chu, D.A.; Kaufman, Y.J.; Zibordi, G.; Chern, J.D.; Mao, J.; Li, C.; Holben, B.N. Global monitoring of air pollution over land from the Earth Observing System-Terra Moderate Resolution Imaging Spectroradiometer (MODIS). J. Geophys. Res. Atmos. 2003, 108, 4661. [Google Scholar] [CrossRef]
  130. Al-Saadi, J.; Szykman, J.; Pierce, R.B.; Kittaka, C.; Neil, D.; Chu, D.A.; Remer, L.; Gumley, L.; Prins, E.; MacDonald, C.; et al. Improving National Air Quality Forecasts with Satellite Aerosol Observations. Bull. Amer. Meteor. Soc. 2005, 86, 1249–1262. [Google Scholar] [CrossRef]
  131. Zhang, J.; Reid, J.S.; Westphal, D.L.; Baker, N.L.; Hyer, E.J. A system for operational aerosol optical depth data assimilation over global oceans. J. Geophys. Res. Atmos. 2008, 113, D10208. [Google Scholar] [CrossRef]
  132. Benedetti, A.; Morcrette, J.J.; Boucher, O.; Dethof, A.; Engelen, R.J.; Fisher, M.; Flentje, H.; Huneeus, N.; Jones, L.; Kaiser, J.W.; et al. Aerosol analysis and forecast in the European centre for medium-range weather forecasts integrated forecast system: 2. Data assimilation. J. Geophys. Res. Atmos. 2009, 114, D13205. [Google Scholar] [CrossRef] [Green Version]
  133. Gao, B.-C.; Goetz, A.F.H.; Wiscombe, W.J. Cirrus cloud detection from Airborne Imaging Spectrometer data using the 1.38 µm water vapor band. Geophys. Res. Lett. 1993, 20, 301–304. [Google Scholar] [CrossRef]
  134. Gao, B.C.; Kaufman, Y.J. Selection of the 1.375-µm MODIS channel for remote sensing of cirrus clouds and stratospheric aerosols from space. J. Atmos. Sci. 1995, 52, 4231–4237. [Google Scholar] [CrossRef]
  135. Gao, B.C.; Kaufman, Y.J.; Tanre, D.; Li, R.R. Distinguishing tropospheric aerosols from thin cirrus clouds for improved aerosol retrievals using the ratio of 1.38-μm and 1.24-μm channels. Geophys. Res. Lett. 2002, 29, 36-1. [Google Scholar] [CrossRef] [Green Version]
  136. Gao, B.-C.; Li, R.-R. Removal of Thin Cirrus Scattering Effects in Landsat 8 OLI Images Using the Cirrus Detecting Channel. Remote Sens. 2017, 9, 834. [Google Scholar] [CrossRef] [Green Version]
  137. Remer, L.A.; Mattoo, S.; Levy, R.C.; Heidinger, A.; Pierce, R.B.; Chin, M. Retrieving aerosol in a cloudy environment: Aerosol product availability as a function of spatial resolution. Atmos. Meas. Tech. 2012, 5, 1823–1840. [Google Scholar] [CrossRef] [Green Version]
  138. Zhang, J.; Reid, J.S.; Holben, B.N. An analysis of potential cloud artifacts in MODIS over ocean aerosol optical thickness products. Geophys. Res. Lett. 2005, 32, L15803. [Google Scholar] [CrossRef]
  139. Shi, Y.; Zhang, J.; Reid, J.S.; Holben, B.; Hyer, E.J.; Curtis, C. An analysis of the collection 5 MODIS over-ocean aerosol optical depth product for its implication in aerosol assimilation. Atmos. Chem. Phys. 2011, 11, 557–565. [Google Scholar] [CrossRef] [Green Version]
  140. Remer, L.A.; Kleidman, R.G.; Levy, R.C.; Kaufman, Y.J.; Tanré, D.; Mattoo, S.; Martins, J.V.; Ichoku, C.; Koren, I.; Yu, H.; et al. Global aerosol climatology from the MODIS satellite sensors. J. Geophys. Res. 2008, 113, D14S07. [Google Scholar] [CrossRef] [Green Version]
  141. Wen, G.; Marshak, A.; Cahalan, R.F.; Remer, L.A.; Kleidman, R.G. 3D aerosol-cloud radiative interaction observed in collocated MODIS and ASTER images of cumulus cloud fields. J. Geophys. Res. 2007, 112, D13204. [Google Scholar] [CrossRef] [Green Version]
  142. Várnai, T.; Marshak, A. MODIS observations of enhanced clear sky reflectance near clouds. Geophys. Res. Lett. 2009, 36, L06807. [Google Scholar] [CrossRef]
  143. Koren, I.; Remer, L.A.; Kaufman, Y.J.; Rudich, Y.; Martins, J.V. On the twilight zone between clouds and aerosols. Geophys. Res. Lett. 2007, 34, L08805. [Google Scholar] [CrossRef] [Green Version]
  144. Charlson, R.J.; Ackerman, A.S.; Bender, F.A.-M.; Anderson, T.L.; Liu, Z. On the climate forcing consequences of the albedo continuum between cloudy and clear air. Tellus B Chem. Phys. Meteorol. 2007, 59, 715–727. [Google Scholar] [CrossRef]
  145. Spencer, R.S.; Levy, R.C.; Remer, L.A.; Mattoo, S.; Arnold, G.T.; Hlavka, D.L.; Meyer, K.; Marshak, A.; Wilcox, E.M.; Platnick, S. Exploring aerosols near clouds with high-spatial-resolution aircraft remote sensing during SEAC4RS. J. Geophys. Res. Atmos. 2019, 124, 2148–2173. [Google Scholar] [CrossRef] [PubMed]
  146. Kleidman, R.G.; Smirnov, A.; Levy, R.C.; Mattoo, S.; Tanre, D. Evaluation and Wind Speed Dependence of MODIS Aerosol Retrievals Over Open Ocean. IEEE Trans. Geosci. Rem. Sens. 2012, 50, 429–435. [Google Scholar] [CrossRef]
  147. Sayer, A.M.; Munchak, L.A.; Hsu, N.C.; Levy, R.C.; Bettenhausen, C.; Jeong, M.-J. MODIS Collection 6 aerosol products: Comparison between Aqua’s e-Deep Blue, Dark Target, and “merged” data sets, and usage recommendations. J. Geophys. Res. Atmos. 2014, 119, 13965–13989. [Google Scholar] [CrossRef]
  148. Levy, R.C.; Munchak, L.A.; Mattoo, S.; Patadia, F.; Remer, L.A.; Holz, R.E. Towards a long-term global aerosol optical depth record: Applying a consistent aerosol retrieval algorithm to MODIS and VIIRS-observed reflectance. Atmos. Meas. Tech. 2015, 8, 4083–4110. [Google Scholar] [CrossRef] [Green Version]
  149. Gupta, P.; Levy, R.C.; Mattoo, S.; Remer, L.A.; Holz, R.E.; Heidinger, A.K. Applying the Dark Target aerosol algorithm with Advanced Himawari Imager observations during the KORUS-AQ field campaign. Atmos. Meas. Tech. 2019, 12, 6557–6577. [Google Scholar] [CrossRef] [Green Version]
  150. Zhou, Y.; Levy, R.; Remer, L.; Mattoo, S.; Shi, Y.X.; Wang, C.X. Dust Aerosol Retrieval over the Oceans with the MODIS/VIIRS Dark Target Algorithm. Part I: Dust Detection. Earth Space Sci. 2020. Available online: https://www.researchgate.net/publication/340491412_Dust_Aerosol_Retrieval_Over_the_Oceans_with_the_MODISVIIRS_Dark_Target_algorithm_Part_I_Dust_Detection (accessed on 3 September 2020).
  151. Zhou, Y.; Levy, R.; Remer, L.; Mattoo, S.; Espinosa, R. Dust Aerosol Retrieval over the Oceans with the MODIS/VIIRS Dark Target Algorithm. Part II: Non-Spherical Dust Model. Earth Space Sci. 2020. Available online: https://www.researchgate.net/publication/340489983_Dust_Aerosol_Retrieval_Over_the_Oceans_with_the_MODISVIIRS_Dark_Target_algorithm_Part_II_Non-Spherical_Dust_Model (accessed on 3 September 2020).
  152. Remer, L.A.; Kaufman, Y.J.; Kleidman, R.G. Comparison of Three Years of Terra and Aqua MODIS Aerosol Optical Thickness over the Global Oceans. IEEE Geosci. Rem. Sens. Lett. 2006, 3, 537–540. [Google Scholar] [CrossRef]
  153. Cox, C.; Munk, W. Measurement of the Roughness of the Sea Surface from Photographs of the Sun’s Glitter. J. Opt. Soc. Am. 1954, 44, 838–850. [Google Scholar] [CrossRef]
  154. Hsu, N.C.; Tsay, S.C.; King, M.D.; Herman, J.R. Deep blue retrievals of Asian aerosol properties during ACE-Asia. IEEE Trans. Geosci. Rem. Sens. 2006, 44, 3180–3195. [Google Scholar] [CrossRef]
  155. Dark Target Aerosol Retrieval Algorithm: ATBD Land Algorithm. Available online: https://darktarget.gsfc.nasa.gov/atbd/land-algorithm (accessed on 28 July 2020).
  156. Shi, Y.R.; Levy, R.C.; Eck, T.F.; Fisher, B.; Mattoo, S.; Remer, L.A.; Slutsker, I.; Zhang, J. Characterizing the 2015 Indonesia fire event using modified MODIS aerosol retrievals. Atmos. Chem. Phys. 2019, 19, 259–274. [Google Scholar] [CrossRef] [Green Version]
  157. Barnes, W.L.; Pagano, T.S.; Salomonson, V.V. Prelaunch characteristics of the Moderate Resolution Imaging Spectroradiometer (MODIS) on EOS-AM1. IEEE Trans. Geo. Rem. Sens. 1998, 36, 1088–1100. [Google Scholar] [CrossRef] [Green Version]
  158. Xiong, X.; Chiang, K.; Esposito, J.; Guenther, B.; Barnes, W. MODIS on-orbit calibration and characterization. Metrologia 2003, 40, S89. [Google Scholar] [CrossRef]
  159. Lyapustin, A.; Wang, Y.; Xiong, X.; Meister, G.; Platnick, S.; Levy, R.; Franz, B.; Korkin, S.; Hilker, T.; Tucker, J.; et al. Scientific impact of MODIS C5 calibration degradation and C6+ improvements. Atmos. Meas. Tech. 2014, 7, 4353–4365. [Google Scholar] [CrossRef] [Green Version]
  160. Sun, J.; Angal, A.; Xiong, X.; Chen, H.; Geng, X.; Wu, A.; Choi, T.; Chu, M. MODIS reflective solar bands calibration improvements in Collection 6. Earth Obs. Missions Sens. Dev. Implement. Charact. II 2012, 8528, 85280N. [Google Scholar] [CrossRef]
  161. LAADS DAAC. Available online: https://ladsweb.modaps.eosdis.nasa.gov (accessed on 18 July 2020).
  162. Giovanni the Bridge between Data and Science. Available online: https://giovanni.gsfc.nasa.gov/giovanni/ (accessed on 18 July 2020).
  163. Earth Observatory. Available online: https://earthobservatory.nasa.gov (accessed on 18 July 2020).
  164. Earth Observation Data. Available online: https://earthdata.nasa.gov/earth-observation-data (accessed on 18 July 2020).
  165. World View. Available online: https://worldview.earthdata.nasa.gov (accessed on 18 July 2020).
  166. Levy, R.C.; Pinker, R.T. Remote Sensing of Spectral Aerosol Properties: A Classroom Experience. Bull. Amer. Meteor. Soc. 2007, 88, 25–30. [Google Scholar] [CrossRef]
  167. Zhang, J.; Christopher, S.A. Longwave radiative forcing of Saharan dust aerosols estimated from MODIS, MISR, and CERES observations on Terra. Geophys. Res. Lett. 2003, 30, 2188. [Google Scholar] [CrossRef] [Green Version]
  168. Li, F.; Vogelmann, A.M.; Ramanathan, V. Saharan dust aerosol radiative forcing measured from space. J. Climate 2004, 17, 2558–2571. [Google Scholar] [CrossRef]
  169. Ramanathan, V.; Ramana, M.V. Persistent, widespread, and strongly absorbing haze over the Himalayan foothills and the Indo-Gangetic Plains. Pure Appl. Geophys. 2005, 162, 1609–1626. [Google Scholar] [CrossRef]
  170. Satheesh, S.K.; Moorthy, K.K.; Kaufman, Y.J.; Takemura, T. Aerosol optical depth, physical properties and radiative forcing over the Arabian Sea. Meteorol. Atmos. Phys. 2006, 91, 45–62. [Google Scholar] [CrossRef]
  171. Yu, H.; Dickinson, R.E.; Chin, M.; Kaufman, Y.J.; Zhou, M.; Zhou, L.; Tian, Y.; Dubovik, O.; Holben, B.N. Direct radiative effect of aerosols as determined from a combination of MODIS retrievals and GOCART simulations. J. Geophys. Res. 2004, 109, D03206. [Google Scholar] [CrossRef] [Green Version]
  172. Yu, H.; Kaufman, Y.J.; Chin, M.; Feingold, G.; Remer, L.A.; Anderson, T.L.; Balkanski, Y.; Bellouin, N.; Boucher, O.; Christopher, S.; et al. A review of measurement-based assessment of the aerosol direct radiative effect and forcing. Atmos. Chem. Phys. 2006, 6, 613–666. [Google Scholar] [CrossRef] [Green Version]
  173. Zhang, J.; Christopher, S.A.; Remer, L.A.; Kaufman, Y.J. Shortwave aerosol radiative forcing over cloud-free oceans from Terra: 2. Seasonal and global distributions. J. Geophys. Res. 2005, 110, D10S24. [Google Scholar] [CrossRef] [Green Version]
  174. Bellouin, N.; Boucher, O.; Haywood, J.; Reddy, M.S. Global estimate of aerosol direct radiative forcing from satellite measurements. Nature 2005, 438, 1138–1141. [Google Scholar] [CrossRef]
  175. Abel, S.J.; Highwood, E.J.; Haywood, J.M.; Stringer, M.A. The direct radiative effect of biomass burning aerosols over southern Africa. Atmos. Chem. Phys. 2005, 5, 1999–2018. [Google Scholar] [CrossRef] [Green Version]
  176. Loeb, N.G.; Manalo-Smith, N. Top-of-Atmosphere Direct Radiative Effect of Aerosols over Global Oceans from Merged CERES and MODIS Observations. J. Climate 2005, 18, 3506–3526. [Google Scholar] [CrossRef]
  177. Chung, C.E.; Ramanathan, V.; Kim, D.; Podgorny, I.A. Global anthropogenic aerosol direct forcing derived from satellite and ground-based observations. J. Geophys. Res. 2005, 110, D24207. [Google Scholar] [CrossRef]
  178. Quaas, J.; Boucher, O.; Bellouin, N.; Kinne, S. Satellite-based estimate of the direct and indirect aerosol climate forcing. J. Geophys. Res. 2008, 113, D05204. [Google Scholar] [CrossRef]
  179. Kinne, S.; Lohmann, U.; Feichter, J.; Schulz, M.; Timmreck, C.; Ghan, S.; Easter, R.; Chin, M.; Ginoux, P.A.; Takemura, T.; et al. Monthly averages of aerosol properties: A global comparison among models, satellite data, and AERONET ground data. J. Geophys. Res. 2003, 108, 4634. [Google Scholar] [CrossRef]
  180. Reddy, M.S.; Boucher, O.; Bellouin, N.; Schulz, M.; Balkanski, Y.; Dufresne, J.-L.; Pham, M. Estimates of global multicomponent aerosol optical depth and direct radiative perturbation in the Laboratoire de Météorologie Dynamique general circulation model. J. Geophys. Res. 2005, 110, D10S16. [Google Scholar] [CrossRef] [Green Version]
  181. Quaas, J.; Boucher, O. Constraining the first aerosol indirect radiative forcing in the LMDZ GCM using POLDER and MODIS satellite data. Geophys. Res. Lett. 2005, 32, L17814. [Google Scholar] [CrossRef] [Green Version]
  182. Bellouin, N.; Jones, A.; Haywood, J.; Christopher, S.A. Updated estimate of aerosol direct radiative forcing from satellite observations and comparison against the Hadley Centre climate model. J. Geophys. Res. 2008, 113, D10205. [Google Scholar] [CrossRef] [Green Version]
  183. Bellouin, N.; Quaas, J.; Gryspeerdt, E.; Kinne, S.; Stier, P.; Watson-Parris, D.; Boucher, O.; Carslaw, K.S.; Christensen, M.; Daniau, A.; et al. Bounding global aerosol radiative forcing of climate change. Rev. Geophys. 2020, 58, e2019RG000660. [Google Scholar] [CrossRef] [Green Version]
  184. Stier, P.; Feichter, J.; Kinne, S.; Kloster, S.; Vignati, E.; Wilson, J.; Ganzeveld, L.; Tegen, I.; Werner, M.; Balkanski, Y.; et al. The aerosol-climate model ECHAM5-HAM. Atmos. Chem. Phys. 2005, 5, 1125–1156. [Google Scholar] [CrossRef] [Green Version]
  185. Ramanathan, V.; Li, F.; Ramana, M.V.; Praveen, P.S.; Kim, D.; Corrigan, C.E.; Nguyen, H.; Stone, E.A.; Schauer, J.J.; Carmichael, G.R.; et al. Atmospheric brown clouds: Hemispherical and regional variations in long-range transport, absorption, and radiative forcing. J. Geophys. Res. 2007, 112, D22S21. [Google Scholar] [CrossRef]
  186. Myhre, G.; Berglen, T.F.; Johnsrud, M.; Hoyle, C.; Berntsen, T.K.; Christopher, S.A.; Fahey, D.W.; Isaksen, I.S.; Jones, T.A.; Kahn, R.A.; et al. Modelled radiative forcing of the direct aerosol effect with multi-observation evaluation. Atmos. Chem. Phys. 2009, 9, 1365–1392. [Google Scholar] [CrossRef] [Green Version]
  187. Jaeglé, L.; Quinn, P.K.; Bates, T.S.; Alexander, B.; Lin, J.T. Global distribution of sea salt aerosols: New constraints from in situ and remote sensing observations. Atmos. Chem. Phys. 2011, 11, 3137–3157. [Google Scholar]
  188. Lu, Z.; Streets, D.G.; Zhang, Q.; Wang, S.; Carmichael, G.R.; Cheng, Y.F.; Wei, C.; Chin, M.; Diehl, T.; Tan, Q. Sulfur dioxide emissions in China and sulfur trends in East Asia since 2000. Atmos. Chem. Phys. 2010, 10, 6311–6331. [Google Scholar] [CrossRef] [Green Version]
  189. Lu, Z.; Zhang, Q.; Streets, D.G. Sulfur dioxide and primary carbonaceous aerosol emissions in China and India, 1996–2010. Atmos. Chem. Phys. 2011, 11, 9839–9864. [Google Scholar] [CrossRef] [Green Version]
  190. Zhang, K.; O’Donnell, D.; Kazil, J.; Stier, P.; Kinne, S.; Lohmann, U.; Ferrachat, S.; Croft, B.; Quaas, J.; Wan, H.; et al. The global aerosol-climate model ECHAM-HAM, version 2: Sensitivity to improvements in process representations. Atmos. Chem. Phys. 2012, 12, 8911–8949. [Google Scholar] [CrossRef] [Green Version]
  191. Shindell, D.T.; Lamarque, J.-F.; Schulz, M.; Flanner, M.; Jiao, C.; Chin, M.; Young, P.J.; Lee, Y.H.; Rotstayn, L.; Mahowald, N.; et al. Radiative forcing in the ACCMIP historical and future climate simulations. Atmos. Chem. Phys. 2013, 13, 2939–2974. [Google Scholar] [CrossRef] [Green Version]
  192. Chin, M.; Diehl, T.; Tan, Q.; Prospero, J.M.; Kahn, R.A.; Remer, L.A.; Yu, H.; Sayer, A.M.; Bian, H.; Geogdzhayev, I.V.; et al. Multi-decadal aerosol variations from 1980 to 2009: Observations and a global model. Atmos. Chem. Phys. 2014, 14, 3657–3690. [Google Scholar] [CrossRef] [Green Version]
  193. Pan, X.; Chin, M.; Gautam, R.; Bian, H.; Kim, D.; Colarco, P.R.; Diehl, T.L.; Takemura, T.; Pozzoli, L.; Tsigaridis, K.; et al. A multi-model evaluation of aerosols over South Asia: Common problems and possible causes. Atmos. Chem. Phys. 2015, 15, 5903–5928. [Google Scholar] [CrossRef] [Green Version]
  194. Kaufman, Y.J.; Koren, I.; Remer, L.A.; Rosenfeld, D.; Rudich, Y. The effect of smoke, dust, and pollution aerosol on shallow cloud development over the Atlantic Ocean. Proc. Natl. Acad. Sci. USA 2005, 102, 11207–11212. [Google Scholar] [CrossRef] [Green Version]
  195. Koren, I.; Kaufman, Y.J.; Rosenfeld, D.; Remer, L.A.; Rudich, Y. Aerosol invigoration and restructuring of Atlantic convective clouds. Geophys. Res. Lett. 2005, 32, L14828. [Google Scholar] [CrossRef] [Green Version]
  196. Koren, I.; Martins, J.V.; Remer, L.A.; Afargan, H. Smoke invigoration versus inhibition of clouds over the Amazon. Science 2008, 321, 946–949. [Google Scholar] [CrossRef] [Green Version]
  197. Koren, I.; Remer, L.A.; Altaratz, O.; Martins, J.V.; Davidi, A. Aerosol-induced changes of convective cloud anvils produce strong climate warming. Atmos. Chem. Phys. 2010, 10, 5001–5010. [Google Scholar] [CrossRef] [Green Version]
  198. Matsui, T.; Masunaga, H.; Kreidenweis, S.M.; Pielke Sr., R.A.; Tao, W.-K.; Chin, M.; Kaufman, Y.J. Satellite-based assessment of marine low cloud variability associated with aerosol, atmospheric stability, and the diurnal cycle. J. Geophys. Res. 2006, 111, D17204. [Google Scholar] [CrossRef] [Green Version]
  199. Chylek, P.; Dubey, M.K.; Lohmann, U.; Ramanathan, V.; Kaufman, Y.J.; Lesins, G.; Hudson, J.; Altmann, G.; Olsen, S. Aerosol indirect effect over the Indian Ocean. Geophys. Res. Lett. 2006, 33, L06806. [Google Scholar] [CrossRef] [Green Version]
  200. Myhre, G.; Stordal, F.; Johnsrud, M.; Kaufman, Y.J.; Rosenfeld, D.; Storelvmo, T.; Kristjansson, J.E.; Berntsen, T.K.; Myhre, A.; Isaksen, I.S.A. Aerosol-cloud interaction inferred from MODIS satellite data and global aerosol models. Atmos. Chem. Phys. 2007, 7, 3081–3101. [Google Scholar] [CrossRef] [Green Version]
  201. Yuan, T.; Li, Z.; Zhang, R.; Fan, J. Increase of cloud droplet size with aerosol optical depth: An observation and modeling study. J. Geophys. Res. 2008, 113, D04201. [Google Scholar] [CrossRef]
  202. Yuan, T.-L.; Remer, L.A.; Pickering, K.E.; Yu, H.-B. Observational evidence of aerosol enhancement of lightning activity and convective invigoration. Geophys. Res. Lett. 2011, 38, L04701. [Google Scholar] [CrossRef]
  203. Yuan, T.; Remer, L.; Yu, H. Microphysical, macrophysical and radiative signatures of volcanic aerosols in trade wind cumulus observed by the A-Train. Atmos. Chem. Phys. 2011, 11, 7119–7132. [Google Scholar] [CrossRef] [Green Version]
  204. Ten Hoeve, J.E.; Remer, L.A.; Jacobson, M.Z. Microphysical and radiative effects of aerosols on warm clouds during the Amazon biomass burning season as observed by MODIS: Impacts of water vapor and land cover. Atmos. Chem. Phys. 2011, 11, 3021–3036. [Google Scholar] [CrossRef] [Green Version]
  205. Manoj, M.G.; Devara, P.C.S.; Safai, P.D.; Goswami, B.N. Absorbing aerosols facilitate transition of Indian monsoon breaks to active spells. Climate Dyn. 2011, 37, 2181–2198. [Google Scholar] [CrossRef]
  206. Wang, M.; Ghan, S.; Liu, X.; L’Ecuyer, T.S.; Zhang, K.; Morrison, H.; Ovchinnikov, M.; Easter, R.; Marchand, R.; Chand, D.; et al. Constraining cloud lifetime effects of aerosols using A-Train satellite measurements. Geophys. Res. Lett. 2012, 39, L15709. [Google Scholar] [CrossRef] [Green Version]
  207. Costantino, L.; Bréon, F.M. Aerosol indirect effect on warm clouds over South-East Atlantic, from co-located MODIS and CALIPSO observations. Atmos. Chem. Phys. 2013, 13, 69–88. [Google Scholar] [CrossRef] [Green Version]
  208. Solomon, S.; Qin, D.; Manning, M.; Chen, Z.; Marquis, M.; Avery, K.B.; Tignor, M.; Miller, H.L. (Eds.) Contribution of Working Group 1 to the Fourth Assessment Report of the Intergovernmental Panel on Climate Change; Cambridge University Press: Cambridge, UK; New York, NY, USA, 2007. [Google Scholar]
  209. Boucher, O.; Randall, D.; Artaxo, P.; Bretherton, C.; Feingold, G.; Forster, P.; Kerminen, V.-M.; Kondo, Y.; Liao, H.; Lohmann, U.; et al. Clouds and Aerosols. In Climate Change 2013: The Physical Science Basis. Contribution of Working Group I to the Fifth Assessment Report of the Intergovernmental Panel on Climate Change; Stocker, T.F., Qin, D., Plattner, G.-K., Tignor, M., Allen, S.K., Boschung, J., Nauels, A., Xia, Y., Bex, V., Midgley, P.M., Eds.; Cambridge University Press: Cambridge, UK; New York, NY, USA, 2013. [Google Scholar]
  210. Gao, Y.; Kaufman, Y.J.; Tanré, D.; Kolber, D.; Falkowski, P.G. Seasonal distributions of aeolian iron fluxes to the global ocean. Geophys. Res. Lett. 2001, 28, 29–32. [Google Scholar] [CrossRef]
  211. Lin, I.-I.; Chen, J.-P.; Wong, G.T.F.; Huang, C.-W.; Lien, C.-C. Aerosol input to the South China Sea: Results from the MODerate Resolution Imaging Spectro-radiometer, the Quick Scatterometer, and the Measurements of Pollution in the Troposphere Sensor. Deep Sea Res. Part II Topical Stud. Oceanogr. 2007, 54, 1589–1601. [Google Scholar] [CrossRef]
  212. Yu, H.; Remer, L.A.; Kahn, R.A.; Chin, M.; Zhang, Y. Satellite perspective of aerosol intercontinental transport: From qualitative tracking to quantitative characterization. Atmos. Res. 2013, 124, 73–100. [Google Scholar] [CrossRef] [Green Version]
  213. Yu, H.; Tan, Q.; Chin, M.; Remer, L.A.; Kahn, R.A.; Bian, H.; Kim, D.; Zhang, Z.; Yuan, T.; Omar, A.; et al. Estimates of African dust deposition along the trans-Atlantic transit using the decadelong record of aerosol measurements from CALIOP, MODIS, MISR, and IASI. J. Geophys. Res. Atmos. 2019, 124, 7975–7996. [Google Scholar] [CrossRef] [PubMed]
  214. Gassó, S.; Stein, A.; Marino, F.; Castellano, E.; Udisti, R.; Ceratto, J. A combined observational and modeling approach to study modern dust transport from the Patagonia desert to East Antarctica. Atmos. Chem. Phys. 2010, 10, 8287–8303. [Google Scholar] [CrossRef] [Green Version]
  215. Heald, C.L.; Jacob, D.J.; Park, R.J.; Alexander, B.; Fairlie, T.D.; Yantosca, R.M.; Chu, D.A. Transpacific transport of Asian anthropogenic aerosols and its impact on surface air quality in the United States. J. Geophys. Res. 2006, 111, D14310. [Google Scholar] [CrossRef] [Green Version]
  216. Stohl, A.; Berg, T.; Burkhart, J.F.; Fjæraa, A.M.; Forster, C.; Herber, A.; Hov, Ø.; Lunder, C.; McMillan, W.W.; Oltmans, S.; et al. Arctic smoke record air pollution levels in the European Arctic during a period of abnormal warmth, due to agricultural fires in eastern Europe. Atmos. Chem. Phys 2007, 7, 511–534. [Google Scholar] [CrossRef] [Green Version]
  217. Mahowald, N.M.; Engelstaedter, S.; Luo, C.; Sealy, A.; Artaxo, P.; Benitez-Nelson, C.; Bonnet, S.; Chen, Y.; Chuang, P.Y.; Cohen, D.D.; et al. Atmospheric iron deposition: Global distribution, variability, and human perturbations. Annu. Rev. Mar. Sci. 2009, 1, 245–278. [Google Scholar] [CrossRef] [Green Version]
  218. Ridley, D.A.; Heald, C.L.; Ford, B. North African dust export and deposition: A satellite and model perspective. J. Geophys. Res. 2012, 117, D02202. [Google Scholar] [CrossRef]
  219. Kim, D.; Chin, M.; Yu, H.; Diehl, T.; Tan, Q.; Kahn, R.A.; Tsigaridis, K.; Bauer, S.E.; Takemura, T.; Pozzoli, L.; et al. Sources, sinks, and transatlantic transport of North African dust aerosol: A multimodel analysis and comparison with remote sensing data. J. Geophys. Res. Atmos. 2014, 119, 6259–6277. [Google Scholar] [CrossRef] [Green Version]
  220. Yu, H.; Yang, Y.; Wang, H.; Tan, Q.; Chin, M.; Levy, R.C.; Remer, L.A.; Smith, S.J.; Yuan, T.; Shi, Y. Interannual variability and trends of combustion aerosol and dust in major continental outflows revealed by MODIS retrievals and CAM5 simulations during 2003–2017. Atmos. Chem. Phys. 2020, 20, 139–161. [Google Scholar] [CrossRef] [Green Version]
  221. Schuerger, A.C.; Smith, D.J.; Griffin, D.W.; Jaffe, D.A.; Wawrik, B.; Burrows, S.M.; Christner, B.C.; González-Martín, C.; Lipp, E.K.; Iii, D.G.S.; et al. Science questions and knowledge gaps to study microbial transport and survival in Asian and African dust plumes reaching North America. Aerobiologia 2018, 34, 425–435. [Google Scholar] [CrossRef]
  222. Engel-Cox, J.A.; Holloman, C.H.; Coutant, B.W.; Hoff, R.M. Qualitative and quantitative evaluation of MODIS satellite sensor data for regional and urban scale air quality. Atmos. Environ. 2004, 38, 2495–2509. [Google Scholar] [CrossRef]
  223. Edwards, D.P.; Emmons, L.K.; Hauglustaine, D.A.; Chu, D.A.; Gille, J.C.; Kaufman, Y.J.; Pétron, G.; Yurganov, L.N.; Giglio, L.; Deeter, M.N.; et al. Observations of carbon monoxide and aerosols from the Terra satellite: Northern Hemisphere variability. J. Geophys. Res. 2004, 109, D24202. [Google Scholar] [CrossRef]
  224. Van Donkelaar, A.; Martin, R.V.; Park, R.J. Estimating ground-level PM2.5 using aerosol optical depth determined from satellite remote sensing. J. Geophys. Res. 2006, 111, D21201. [Google Scholar] [CrossRef]
  225. Van Donkelaar, A.; Martin, R.V.; Brauer, M.; Kahn, R.; Levy, R.; Verduzco, C.; Villeneuve, P.J. Global estimates of ambient fine particulate matter concentrations from satellite-based aerosol optical depth: Development and application. Environ. Health Perspect. 2010, 118, 847–855. [Google Scholar] [CrossRef] [Green Version]
  226. Van Donkelaar, A.; Martin, R.V.; Brauer, M.; Hsu, N.C.; Kahn, R.A.; Levy, R.C.; Lyapustin, A.; Sayer, A.M.; Winker, D.M. Global estimates of fine particulate matter using a combined geophysical-statistical method with information from satellites, models, and monitors. Environ. Sci. Technol. 2016, 50, 3762–3772. [Google Scholar] [CrossRef]
  227. Koelemeijer, R.B.A.; Homan, C.D.; Matthijsen, J. Comparison of spatial and temporal variations of aerosol optical thickness and particulate matter over Europe. Atmos. Environ. 2006, 40, 5304–5315. [Google Scholar] [CrossRef]
  228. Engel-Cox, J.A.; Hoff, R.M.; Rogers, R.; Dimmick, F.; Rush, A.C.; Szykman, J.J.; Al-Saadi, J.; Chu, D.A.; Zell, E.R. Integrating lidar and satellite optical depth with ambient monitoring for 3-dimensional particulate characterization. Atmos. Environ. 2006, 40, 8056–8067. [Google Scholar] [CrossRef]
  229. Gupta, P.; Christopher, S.A.; Wang, J.; Gehrig, R.; Lee, Y.C.; Kumar, N. Satellite remote sensing of particulate matter and air quality assessment over global cities. Atmos. Environ. 2006, 40, 5880–5892. [Google Scholar] [CrossRef]
  230. Kumar, N.; Chu, A.; Foster, A. An empirical relationship between PM2. 5 and aerosol optical depth in Delhi Metropolitan. Atmos. Environ. 2007, 41, 4492–4503. [Google Scholar] [CrossRef] [Green Version]
  231. Schaap, M.; Apituley, A.; Timmermans, R.M.A.; Koelemeijer, R.B.A.; De Leeuw, G. Exploring the relation between aerosol optical depth and PM 2.5 at Cabauw, the Netherlands. Atmos. Chem. Phys. 2009, 9, 909–925. [Google Scholar] [CrossRef] [Green Version]
  232. Guo, J.P.; Zhang, X.Y.; Che, H.Z.; Gong, S.L.; An, X.; Cao, C.X.; Guang, J.; Zhang, H.; Wang, Y.Q.; Zhang, X.C.; et al. Correlation between PM concentrations and aerosol optical depth in eastern China. Atmos. Environ. 2009, 43, 5876–5886. [Google Scholar] [CrossRef]
  233. Gupta, P.; Christopher, S.A. Particulate matter air quality assessment using integrated surface, satellite, and meteorological products: Multiple regression approach. J. Geophys. Res. 2009, 114, D14205. [Google Scholar] [CrossRef] [Green Version]
  234. Gupta, P.; Christopher, S.A. Particulate matter air quality assessment using integrated surface, satellite, and meteorological products: 2. A neural network approach. J. Geophys. Res. 2009, 114, D20205. [Google Scholar] [CrossRef]
  235. Zhang, H.; Hoff, R.M.; Engel-Cox, J.A. The relation between Moderate Resolution Imaging Spectroradiometer (MODIS) aerosol optical depth and PM2. 5 over the United States: A geographical comparison by US Environmental Protection Agency regions. J. Air Waste Man. Assoc. 2009, 59, 1358–1369. [Google Scholar] [CrossRef] [Green Version]
  236. Wang, Z.; Chen, L.; Tao, J.; Zhang, Y.; Su, L. Satellite-based estimation of regional particulate matter (PM) in Beijing using vertical-and-RH correcting method. Rem. Sens. Environ. 2010, 114, 50–63. [Google Scholar] [CrossRef]
  237. Lee, J.; Kim, J.; Song, C.H.; Ryu, J.H.; Ahn, Y.H.; Song, C.K. Algorithm for retrieval of aerosol optical properties over the ocean from the Geostationary Ocean Color Imager. Rem. Sens. Environ. 2010, 114, 1077–1088. [Google Scholar] [CrossRef]
  238. Philip, S.; Martin, R.V.; van Donkelaar, A.; Lo, J.W.H.; Wang, Y.; Chen, D.; Zhang, L.; Kasibhatla, P.S.; Wang, S.; Zhang, Q.; et al. Global chemical composition of ambient fine particulate matter for exposure assessment. Environ. Sci. Technol. 2014, 48, 13060–13068. [Google Scholar] [CrossRef] [Green Version]
  239. Xin, J.; Zhang, Q.; Wang, L.; Gong, C.; Wang, Y.; Liu, Z.; Gao, W. The empirical relationship between the PM2. 5 concentration and aerosol optical depth over the background of North China from 2009 to 2011. Atmos. Res. 2014, 138, 179–188. [Google Scholar] [CrossRef]
  240. McClure, C.D.; Jaffe, D.A. US particulate matter air quality improves except in wildfire-prone areas. Proc. Natl. Acad. Sci. USA 2018, 115, 7901–7906. [Google Scholar] [CrossRef] [Green Version]
  241. Lahoz, W.A.; Schneider, P. Data assimilation: Making sense of Earth Observation. Front. Environ. Sci. 2014, 2, 16. [Google Scholar] [CrossRef] [Green Version]
  242. Hyer, E.J.; Reid, J.S.; Zhang, J. An over-land aerosol optical depth data set for data assimilation by filtering, correction, and aggregation of MODIS Collection 5 optical depth retrievals. Atmos. Meas. Tech. 2011, 4, 379–408. [Google Scholar] [CrossRef] [Green Version]
  243. Liu, Z.; Liu, Q.; Lin, H.-C.; Schwartz, C.S.; Lee, Y.-H.; Wang, T. Three-dimensional variational assimilation of MODIS aerosol optical depth: Implementation and application to a dust storm over East Asia. J. Geophys. Res. 2011, 116, D23206. [Google Scholar] [CrossRef] [Green Version]
  244. Schutgens, N.A.J.; Miyoshi, T.; Takemura, T.; Nakajima, T. Applying an ensemble Kalman filter to the assimilation of AERONET observations in a global aerosol transport model. Atmos. Phys. Chem. 2010, 10, 2561–2576. [Google Scholar] [CrossRef] [Green Version]
  245. Huneeus, N.; Chevallier, F.; Boucher, O. Estimating aerosol emissions by assimilating observed aerosol optical depth in a global aerosol model. Atmos. Chem. Phys. 2012, 12, 4585–4606. [Google Scholar] [CrossRef] [Green Version]
  246. Lynch, P.; Reid, J.S.; Westphal, D.L.; Zhang, J.; Hogan, T.F.; Hyer, E.J.; Curtis, C.A.; Hegg, D.A.; Shi, Y.; Campbell, J.R.; et al. An 11-year global gridded aerosol optical thickness reanalysis (v1.0) for atmospheric and climate sciences. Geosci. Model Dev. 2016, 9, 1489–1522. [Google Scholar] [CrossRef] [Green Version]
  247. Gelaro, R. and Coauthors. The Modern-Era Retrospective Analysis for Research and Applications, Version 2 (MERRA-2). J. Clim. 2017, 30, 5419–5454. [Google Scholar] [CrossRef]
  248. Vermote, E.F.; El Saleous, N.; Justice, C.O.; Kaufman, Y.J.; Privette, J.L.; Remer, L.; Roger, J.C.; Tanré, D. Atmospheric correction of visible to middle-infrared EOS-MODIS data over land surfaces: Background, operational algorithm and validation. J. Geophys. Res. 1997, 102, 17131–17141. [Google Scholar] [CrossRef] [Green Version]
  249. Vermote, E.F.; El Saleous, N.Z.; Justice, C.O. Atmospheric correction of MODIS data in the visible to middle infrared: First results. Rem. Sens. Environ. 2002, 83, 97–111. [Google Scholar] [CrossRef]
  250. Vermote, E.F.; Kotchenova, S. Atmospheric correction for the monitoring of land surfaces. J. Geophys. Res. 2008, 113, D23S90. [Google Scholar] [CrossRef]
  251. Vermote, E.; Justice, C.; Claverie, M. Preliminatry analysis of the performance of the Landsat 8/OLI land surface reflectance product. Rem. Sens. Environ. 2016, 185, 46–56. [Google Scholar] [CrossRef] [PubMed]
  252. Veefkind, J.P.; De Leeuw, G.; Durkee, P.A. Retrieval of aerosol optical depth over land using two-angle view satellite radiometry during TARFOX. Geophys. Res. Lett. 1998, 25, 3135–3138. [Google Scholar] [CrossRef]
  253. Gonzalez, C.R.; Veefkind, J.P.; de Leeuw, G. Aerosol optical depth over Europe in August 1997 derived from ATSR-2 data. Geophys. Res. Lett. 2000, 27, 955–958. [Google Scholar] [CrossRef]
  254. Holzer-Popp, T.; Schroedter, M.; Gesell, G. Retrieving aerosol optical depth and type in the boundary layer over land and ocean from simultaneous GOME spectrometer and ATSR-2 radiometer measurements, 1, Method description. J. Geophys. Res. 2002, 107, 4578. [Google Scholar] [CrossRef] [Green Version]
  255. Kim, M.; Kim, J.; Jeong, U.; Kim, W.; Hong, H.; Holben, B.; Eck, T.F.; Lim, J.H.; Song, C.K.; Lee, S.; et al. Aerosol optical properties derived from the DRAGON-NE Asia campaign, and implications for a single-channel algorithm to retrieve aerosol optical depth in spring from Meteorological Imager (MI) on-board the Communication, Ocean, and Meteorological Satellite (COMS). Atmos. Chem. Phys. 2016, 16, 1789–1808. [Google Scholar] [CrossRef] [Green Version]
  256. Lee, H.J.; Liu, Y.; Coull, B.A.; Schwartz, J.; Koutrakis, P. A novel calibration approach of MODIS AOD data to predict PM 2.5 concentrations. Atmos. Chem. Phys. 2011, 11. [Google Scholar] [CrossRef] [Green Version]
  257. Choi, M.; Kim, J.; Lee, J.; Kim, M.; Park, Y.-J.; Jeong, U.; Kim, W.; Hong, H.; Holben, B.; Eck, T.F.; et al. GOCI Yonsei Aerosol Retrieval (YAER) algorithm and validation during the DRAGON-NE Asia 2012 campaign. Atmos. Meas. Tech. 2016, 9, 1377–1398. [Google Scholar] [CrossRef] [Green Version]
  258. Choi, M.; Kim, J.; Lee, J.; Kim, M.; Park, Y.J.; Holben, B.; Song, C.H. GOCI Yonsei aerosol retrieval version 2 products: An improved algorithm and error analysis with uncertainty estimation from 5-year validation over East Asia. Atmos. Meas. Tech. 2018, 11, 385–408. [Google Scholar] [CrossRef] [Green Version]
  259. Lim, H.; Choi, M.; Kim, J.; Kasai, Y.; Chan, P.W. AHI/Himawari-8 Yonsei aerosol retrieval (YAER): Algorithm, validation and merged products. Remote Sens. 2018, 10, 699. [Google Scholar] [CrossRef] [Green Version]
  260. Kim, J.; Yoon, J.-M.; Ahn, M.H.; Sohn, B.J.; Lim, H.S. Retrieving aerosol optical depth using visible and mid-IR channels from geostationary satellite MTSAT-1R. Int. J. Rem. Sens. 2008, 29, 6181–6192. [Google Scholar] [CrossRef]
  261. Jackson, J.M.; Liu, H.Q.; Laszlo, I.; Kondragunta, S.; Remer, L.A.; Huang, J.F.; Huang, H.C. Suomi-NPP VIIRS aerosol algorithms and data products. J. Geophys. Res. Atmos. 2013, 118, 12673–12689. [Google Scholar] [CrossRef]
  262. Laszlo, I.; Liu, H. EPS Aerosol Optical Depth (AOD) Algorithm Theoretical Basis Document. Version 3.0.1 NOAA NESDIS Center for Satellite Applications and Research. 2016. Available online: https://www.star.nesdis.noaa.gov/jpss/documents/ATBD/ATBD_EPS_Aerosol_AOD_v3.0.1.pdf (accessed on 28 July 2020).
  263. Hsu, N.C.; Lee, J.; Sayer, A.M.; Kim, W.; Bettenhausen, C.; Tsay, S.-C. VIIRS Deep Blue aerosol products over land: Extending the EOS long-term aerosol data records. J.Geophys. Res. Atmos. 2019, 124, 4026–4053. [Google Scholar] [CrossRef]
  264. Lyapustin, A.; Wang, Y.; Laszlo, I.; Kahn, R.; Korkin, S.; Remer, L.; Levy, R.; Reid, J.S. Multiangle implementation of atmospheric correction (MAIAC): 2. Aerosol algorithm. J. Geophys. Res. 2011, 116, D03211. [Google Scholar] [CrossRef]
  265. Holzer-Popp, T.; de Leeuw, G.; Griesfeller, J.; Martynenko, D.; Klüser, L.; Bevan, S.; Davies, W.; Ducos, F.; Deuzé, J.L.; Graigner, R.G.; et al. Aerosol retrieval experiments in the ESA aerosol cci project. Atmos. Meas. Tech. 2013, 6, 1919–1957. [Google Scholar] [CrossRef] [Green Version]
  266. De Leeuw, G.; Holzer-Popp, T.; Bevan, S.; Davies, W.H.; Descloitres, J.; Grainger, R.G.; Griesfeller, J.; Heckel, A.; Kinne, S.; Klüser, L.; et al. Evaluation of seven European aerosol optical depth retrieval algorithms for climate analysis. Rem. Sens. Environ. 2015, 162, 295–315. [Google Scholar] [CrossRef] [Green Version]
  267. Herman, M.; Deuze, J.-L.; Marchant, A.; Roger, B.; Lallart, P. Aerosol remote sensing from POLDER/ADEOS over the ocean: Improved retrieval using a nonspherical particle model. J. Geophys. Res. 2005, 110, D10S02. [Google Scholar] [CrossRef]
  268. Tanre, D.; Breón, F.M.; Deuze, J.L.; Dubovik, O.; Ducos, F.; Francois, P.; Goloub, P.; Herman, M.; Lifermann, A.; Waquet, F. Remote sensing of aerosols by using polarized, directional and spectral measurements within the A-Train: The PARASOL mission. Atmos. Meas. Tech. 2011, 4, 1383–1395. [Google Scholar] [CrossRef] [Green Version]
  269. Torres, O.; Tanskanen, A.; Veihelmann, B.; Ahn, C.; Braak, R.; Bhartia, P.K.; Veefkind, P.; Levelt, P. Aerosols and surface UV products from Ozone Monitoring Instrument observations: An overview. J. Geophys. Res. 2007, 112, D24S47. [Google Scholar] [CrossRef] [Green Version]
  270. Huang, J.; Laszlo, I.; Remer, L.A.; Liu, H.; Zhang, H.; Ciren, P.; Kondragunta, S. Screening for snow/snowmelt in SNPP VIIRS aerosol optical depth algorithm. Atmos. Meas. Tech. 2018, 11, 5813–5825. [Google Scholar] [CrossRef] [Green Version]
  271. Schmit, T.J.; Gunshor, M.M.; Menzel, W.P.; Gurka, J.J.; Li, J.; Bachmeier, A.S. Introducing the next-generation Advanced Baseline Imager on GOES-R. Bull. Amer. Meteor. Soc. 2005, 86, 1079–1096. [Google Scholar] [CrossRef]
  272. Werdell, P.J.; Behrenfeld, M.J.; Bontempi, P.S.; Boss, E.; Cairns, B.; Davis, G.T.; Franz, B.A.; Gliese, U.B.; Gorman, E.T.; Hasekamp, O.; et al. The Plankton, Aerosol, Cloud, ocean Ecosystem (PACE) mission: Status, science, advances. Bull. Amer. Meteor. Soc. 2019, 100, 1775–1794. [Google Scholar] [CrossRef]
Figure 1. Aerosol optical thickness measured by the Ames Airborne Tracking Sunphotometer (AATS-6) aboard the low flying C-131A aircraft and derived from the Moderate-Resolution Imaging Spectroradiometer (MODIS) Airborne Simulator (MAS) measurements made at high altitude from the ER-2 as a function of wavelength. The comparison is made over a point located at 37.49° north (N)/74.16° west (W) around 6:30 p.m. Coordinated Universal Time (UTC). Three subsequent tracks of the ER-2/MAS are plotted. Reprinted with permission from John Wiley and Sons.
Remotesensing 12 02900 g001
Figure 2. Surface reflectance in the red (0.66 µm) plotted against surface reflectance in the shortwave infrared (SWIR) (2.11 µm) obtained from applying atmospheric correction to top-of-atmosphere MODIS observations at collocated Aerosol Robotic Network (AERONET) stations from 2015–2019. Over 20,000 collocations are plotted. Colors denote ranges of normalized difference vegetation index (NDVISWIR) highest values of NDVISWIR corresponding to the brightest barest surfaces and the lowest values of NDVISWIR corresponding to the darkest most vegetated surfaces. Throughout the range of NDVISWIR, the red surface reflectance ranges from 0.48 to 0.61 of the SWIR.
Remotesensing 12 02900 g002
Figure 3. Timeline of key activities and milestones during the 10 years of Dark Target (DT) algorithm development (1990–1999). Green shading—land algorithm development elements; blue—ocean algorithm development elements; red—validation development or milestones; purple—mission level milestones. Lighter shading indicates a switch of focus from intense creative work to a period of testing and modifications. Years are divided into quarters. Black squares indicate important publications: (a) [59]; (b) [60]; (c) [12]; (d) [13]; (e) [64]; (f) [65]; (g) [39].
Remotesensing 12 02900 g003
Figure 4. MODIS aerosol optical thickness at 0.55 µm, representing global aerosol distribution on 12 June 2001. The two-dimensional color bar describes both the magnitude of optical thickness (along bottom axis) and the fraction of optical thickness contributed by smaller fine-mode particles (along vertical axis). Blue indicates low aerosol loading. Red indicates heavy loading of small particles such as pollution and smoke. The greener tones indicate a greater percentage of large particles such as desert dust and sea salt. The image was created from the MODIS daily 10 km resolution data after smoothing the raw data with Gaussian filters applied both in the temporal and spatial domains. Visualization produced by Reto Stockli of the NASA Earth Observatory.
Remotesensing 12 02900 g004
Figure 5. Original validation analysis for the Terra MODIS product. Top row, scatter plot of over-land retrieved MODIS aerosol optical depth (AOD) at 0.47 µm (left) and 0.66 µm (right) versus the same from collocated AERONET sun observations. The solid line denotes the regression and the dashed lines represent the at-launch expected error (±0.05 + 15% of AOD). Regression statistics are given. In total, 315 collocations from the global database are used in the plots. From [87]; adapted with permission from Wiley and Sons. Bottom row, scatter plot of over ocean retrieved MODIS AOD at 0.66 µm (left) and effective radius (right) versus the same from collocated AERONET sun observations (left) and AERONET sky radiance inversions (right). On the left, the bold solid line denotes the 1:1 line, the solid red line is the regression line, and the dashed lines denote the at-launch expected error (±0.03 + 5% of AOD). There are 64 collocations represented. On the right, the bold solid line denotes the 1:1 line, the thinner solid lines represent at-launch expected error for size parameters, and the dashed lines indicate ±0.10 µm which enclose 72% of the points. Only 25 collocations are plotted, as AOD at 0.66 µm is required to be greater than 0.15 to be included. From [88]; adapted with permission from Wiley and Sons.
Remotesensing 12 02900 g005
Figure 6. Validation of MODIS DT over-land (upper left) and over-ocean (upper right) product against AERONET version 3 level 2.0 AOD at 0.55 μ m and MODIS DT over ocean against MAN (lower left) for the entire data record. The solid lines are the linear fitting between the two datasets. The four boundary boxes represent 25% and 75% of the data in both x- and y-directions, the center line is the median, and the dot is the mean. The upper and lower whiskers represent 95% and 5% of MODIS values. Each box represents the statistics from the same number of collocations. The dashed lines are the expected error of ±0.05 + 15% of AOD for land and +0.04 + 10% of AOD and −0.02 − 10% of AOD for ocean. The red represents Terra, and the blue represents Aqua.
Remotesensing 12 02900 g006
Figure 7. Time series of validation metrics obtained by collocating MODIS DT 3 km AOD at 0.55 µm with all available AERONET Level 2 quality assured from the global database, each year. AERONET AOD was interpolated to 0.55 µm using [119]. Shown are median bias and mean bias against AERONET, percentage within expected error bars given as ±0.05 + 20% of AOD, and the number of collocations each year. AOD from Terra MODIS is in red, and that from Aqua MODIS is in blue. Data with only highest-quality MODIS retrievals were used.
Remotesensing 12 02900 g007
Figure 8. AERONET global distribution in 2002 (left) and 2015 (right). Yellow dots are stations that existed in 2002 on both maps. Red presents AERONET sites on the 2015 map that did not exist in 2002.
Remotesensing 12 02900 g008
Figure 9. Timeline of key activities and milestones during the first ten years of on orbit DT aerosol production (2000–2009). Yellow shading indicates forward processing of NASA data collections. Green shading—land algorithm development elements; red—validation development or milestones; gray—masking efforts; purple—mission level milestones. The salmon shading links two milestone uses of DT aerosol in assimilation systems. Years are divided into quarters. Black squares indicate important publications, including to the best of our knowledge the first publications to use the product in specific applications: (a) [84,87,88]; (b) [122]; (c) [123]; (d) [124]; (e) [125]; (f) [44]; (g) [16]; (h) [126]; (i) [127]; (j) [128,129,130]; (k) [18,19]; (l) [131]; (m) [132].
Remotesensing 12 02900 g009
Figure 10. Timeline of key activities and milestones during the second 10 years of on-orbit DT aerosol production (2010–2020). Yellow shading indicates forward processing of NASA data collections. Green shading—land algorithm development elements; blue—ocean elements; red—validation development or milestones; brown—efforts to adapt the DT element to new sensors. Years are divided into quarters. Black squares indicate important publications: (a) [15]; (b) [146]; (c) [20]; (d) [17]; (e) [147]; (f) [148]; (g) [22]; (h) [23]; (i) [21]; (j) [149]; (k) [24]; (l) [150,151].
Remotesensing 12 02900 g010
Figure 11. A two-week average (13–26 June 2020) of AOD at 0.55µm, Angstrom exponent (AE), and fine-mode fraction (FMF) from the Version C6.1 retrieval (upper panel) and the difference between the new retrieval products and the C6.1 products (lower panel). The new retrieval decreases the mean AOD by about 0.06 and retrieves coarser particles and more coarse-mode aerosol. The late June African dust storm across the Atlantic Ocean is the heaviest one in recent decades.
Remotesensing 12 02900 g011
Figure 12. Time series of globally averaged, area-weighted, and quality-flag-weighted DT MODIS AOD at 0.55 µm for land and ocean and each collection (C5.1, C6, and C6.1) separately for Terra, (upper left), and Aqua (center left), and the difference of Terra–Aqua, (lower left. Right): Trends in mean AOD, calculated as seasonal linear slope for every 1° latitude–longitude box using Collection 6.1. Only grid boxes where p ≤ 0.05 are shown by color contouring.
Remotesensing 12 02900 g012
Figure 13. Aerosol optical depth at 0.55 µm, retrieved using the Collection 6.1 aerosol algorithm with inputs from Advanced Baseline Imagers (ABIs) on GOES-E and GOES-W, Advanced Himawari Imager (AHI) on Himawari-8, MODIS on Terra and Aqua, and Visible Infrared Imaging Radiometer Suite (VIIRS) on the Suomi-National Polar-Orbiting Partnership, and the aggregated combination of the retrievals from all six sensors onto a common 0.1° by 0.1° spatial grid at 11:15 p.m. UTC ± 15 min on 3 December 2018.
Remotesensing 12 02900 g013
Table 1. Validation statistics of MODIS Terra and Aqua DT C6.1 against AERONET and Marine Aerosol Network (MAN) for 2000(2002 Aqua)–2019. %EE, percentage falling within expected error.
Median BiasRoot-Mean-Square ErrorCorrelation CoefficientsRegression SlopeRegression InterceptsTotal Number%EE
Ocean AERONETTer0.0290.0910.891.020.03567,74263.9
Aq0.0190.0970.870.930.03365,85871.1
Ocean MANTer0.0220.0880.920.960.03627,33175.2
Aq0.0130.0500.960.960.02125,68180.2
LandTer0.0160.1050.921.040.016238,37374.7
Aq-0.0010.1010.921.020.003193,62876.3

