

Abstract
Transboundary atmospheric pollution is a major concern throughout much of Southeast Asia (SEA), although most attention has, to date, focused on episodic haze events associated with biomass burning in the region. Here, we reconstruct long-term variations in transboundary inputs of chromium (Cr), an industrial pollutant, to Singapore over the period 1900–2017 by adopting a novel catchment-reservoir mass balance methodology that combines a national emissions inventory and a paleolimnological approach. Results show periods of low (before the 1950s) and relatively stable (the 1950s–1980s) levels of transboundary Cr deposition in Singapore followed by an unambiguous increase from ca. 1990 onwards, most likely linked to the onset of rapid industrialisation in neighbouring parts of Malaysia and Indonesia. Notably, from ca. 2000 onwards, fluxes of transboundary Cr deposition in Singapore further increased by 3% per year, almost doubling from 6 ± 3 tonne Cr yr−1 in 2000 to around 11 ± 3 tonne Cr yr−1 in 2017. This post-2000 rapid increase may reflect the effects of globalisation, pro-export driven economic growth policies and increasing capital inflows to the whole region, including from Singapore, all of which combined to drive industrialisation throughout much of SEA. The current trend of increasing transboundary pollution from anthropogenic activity highlights an urgent need for effective collaboration among countries in SEA in order to improve well-being and help guarantee sustainable development throughout the region.
Export citation and abstract BibTeX RIS

Original content from this work may be used under the terms of the Creative Commons Attribution 4.0 license. Any further distribution of this work must maintain attribution to the author(s) and the title of the work, journal citation and DOI.
1. Introduction
The atmospheric residence time of some pollutants, such as heavy metals, can range from days to weeks, enabling long-distance transportation that can result in deposition far from their sources [1] and transboundary atmospheric pollution (TAP) [2]. As a result of rapid and widespread industrialisation and urbanisation, TAP is now a global problem [3]. In Southeast Asia (SEA), TAP typically peaks during periodic smoke haze events associated with the burning of forests and peatlands [4, 5] and with substantially reduced visibility [6] and enhanced respiratory distress in affected populations across the region [7]. Public pressure on governments to address TAP has therefore been largely driven by, and skewed towards, these major haze pollution events [4, 8]. An example is the establishment of the legally-binding 'Agreement on Transboundary Haze Pollution' in 2002 among members of the Association of Southeast Asian Nations (ASEAN)5 to tackle biomass burning-related TAP [9]. By contrast, other non-biomass burning-related pollutants, such as those arising from industrial activities, maritime traffic and fossil fuel power stations, tend to receive relatively little attention [7, 10].
Unlike highly episodic haze events, air pollution from non-biomass burning sources tends to be sustained and can, therefore, pose a chronic risk to human health [11]. In SEA, where air pollution monitoring systems are not widely implemented and those that do exist are often poorly maintained [12], information on TAP is generally lacking. Consequently, no regional agreement exists to regulate TAP from, for example, fossil fuel combustion or heavy industries. This legislative gap reflects the neglect of the obvious risks to health of pollution from industrial and urban sources. For example, the estimated annual premature deaths in SEA from TAP linked to emissions from coal-fired power stations are more than twice those from TAP associated with major biomass (peatland and forest) fires in Indonesia from October to December in 2015 [13, 14]. This discrepancy highlights a major shortcoming in knowledge and underpins an inadequate response to TAP in all its forms. This inadequate response risks human health and well-being and undermines attempts by SEA countries to achieve the United Nations Sustainable Development Goals (UN SDGs). Attaining SDG 3.9, for example, requires substantial reductions in mortality rates linked to atmospheric pollution by 2030 [15].
Determining TAP is challenging, especially in urban areas where pollution originates from a mixture of sources; natural, anthropogenic, local and transboundary. Past studies of TAP in SEA tend to assume that the total measured pollution during haze events equates entirely to TAP [16–19]. This assumption neglects the possibility of local sources contributing to poor air quality and for the level of that contribution to vary over time [6]. Furthermore, past studies of TAP in SEA tend to rely on relatively short-term observations, often spanning less than a year [6, 10, 19]. Such short-term studies are unlikely to capture variations in TAP from non-biomass burning-related sources due, for example, to changes in the pace of industrialisation and urbanisation in the region and/or following the implementation of environmental regulations.
This paper quantifies past variations in the dry deposition of TAP-associated chromium (Cr) in Singapore, the most affluent ASEAN country in GDP per capita terms [20]. Cr, a heavy metal, is assumed to represent pollution from industrial and urban sources and is used in the current research as a proxy of non-biomass burning-related pollution [21]. A novel catchment-reservoir mass balance approach, combining field- and laboratory-based paleolimnological techniques and a document-based national emission inventory (NEI), was adopted to distinguish and quantify levels of dry Cr deposition in Singapore from transboundary sources between 1900 and 2017.
2. Materials and methods
2.1. Research site
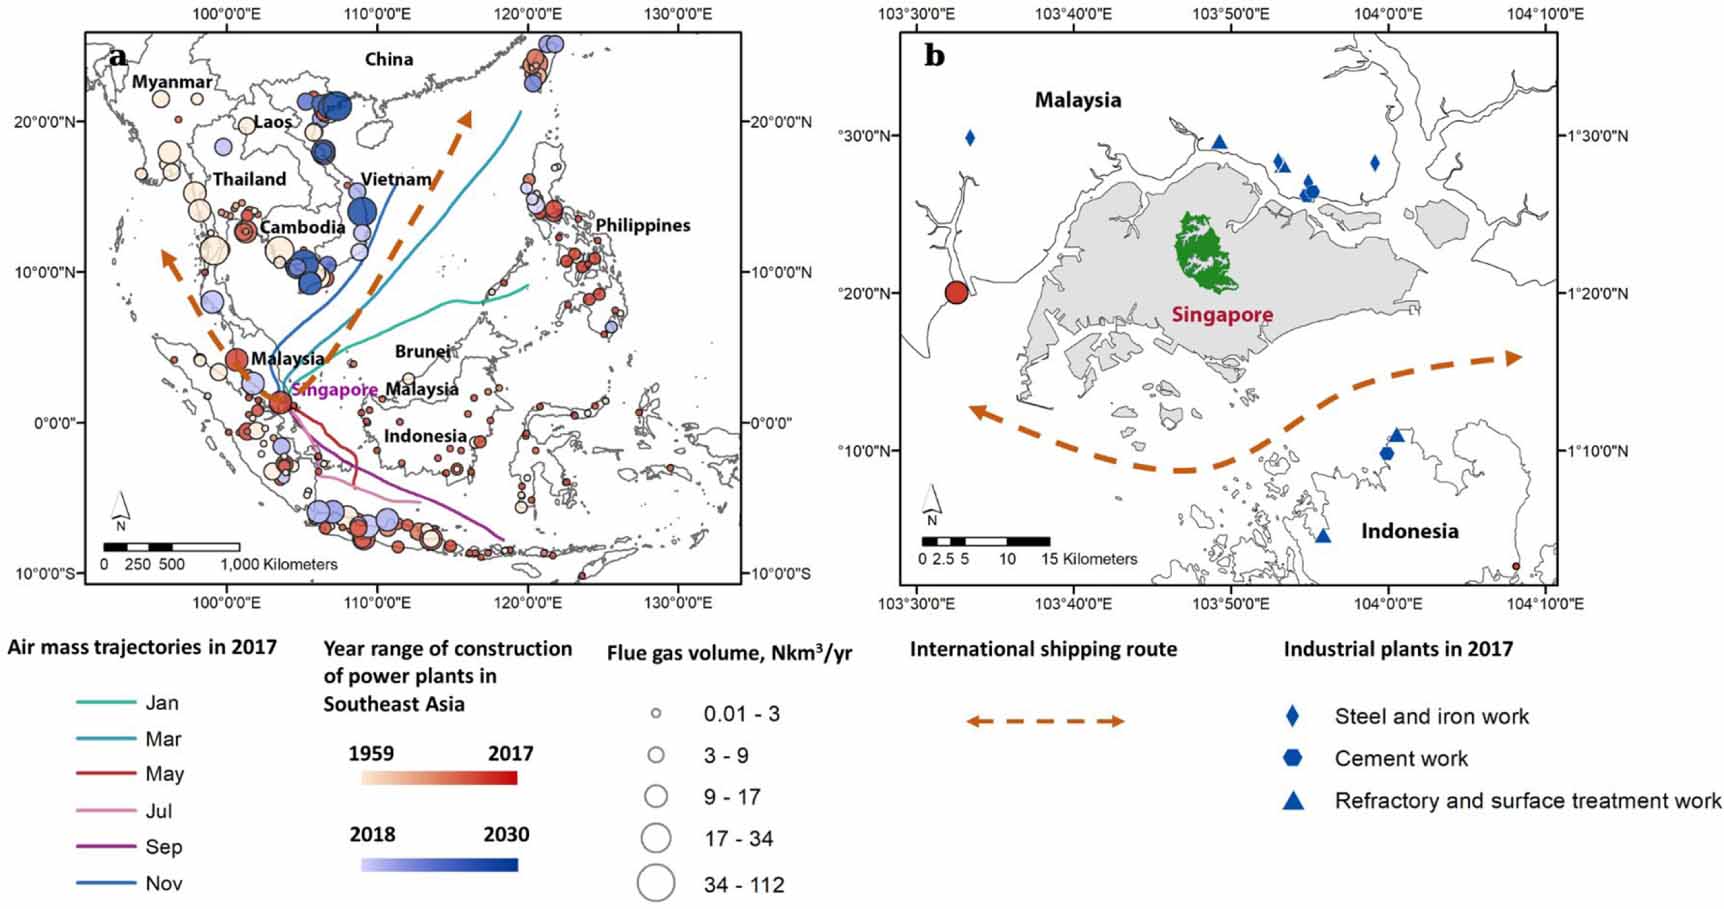
Singapore (ca. 1° N, 103° E) is a highly urbanized island state with a land area of 721 km2 (2018) that neighbours Indonesia and Malaysia and major international shipping routes (figure 1(a)). Singapore has a tropical climate, with abundant rainfall of 2166 mm yr−1 (1981–2010 average), and is influenced by Northeast and Southeast monsoonal airflows [22]. The wind speed in Singapore increases from an overall average of 2.5 m s−1 (1981–2010) to >10 m s−1 during monsoon periods [23]. Singapore underwent rapid industrialisation and urbanisation from the 1960s to the late 1980s but has since transitioned towards a more services-based economy [24, 25].
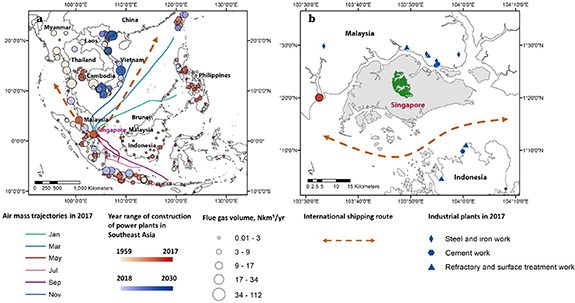
Figure 1. (a) Southeast Asia with locations of ten member states of the Association of Southeast Asian Nations shown. Impact range of monsoons are indicated by 72-hour air mass back trajectories in 2017, using Singapore as the destination with the computing height of 100 meters above ground level. Coal-fired power plants and the corresponding flue gas volumes, which are possible sources of transboundary Cr pollution, are indicated using data from Koplitz et al [13]. (b) Location of Singapore, the Central Catchment Natural Reserve (in green), and the targeted reservoir. Possible sources of Cr in Indonesia and Malaysia within a 30 km radius from Singapore are also indicated, including steel and iron works, cement works, refractory and surface treatment works, and coal-fired power plants. The major maritime international shipping routes, important sources of pollution emissions, are shown on both panels.
Download figure:
Standard image High-resolution imageIn the absence of natural lakes in Singapore, the country's oldest artificial reservoir [26] along with its catchment, a total of ca. 8 km2 and part of the largest nature reserve in Singapore (table 1, figure 1(b), supplementary material (SM) figure 1 (available online at https://stacks.iop.org/ERL/15/1040a5/mmedia)), were selected as the principal focus of study. The main sources of water to the reservoir are direct rainfall and runoff from the catchment [27]. Water levels have been kept stable over time by actively discharging and pumping water during wet and dry periods, respectively [27]. Annual water inputs via direct rainfall and runoff from the catchment (ca. 11 million m3) are much larger than the reservoir capacity (ca. 3 million m3) [28]. The water residence time of the reservoir, therefore, may not exceed one year. There is negligible groundwater exchange to the reservoir [29] as a large part of the reservoir and its catchment sits on top of the Bukit Timah Granite formation, which has very low permeability [30]. Although the reservoir and its catchment are well protected today [26], the site has suffered from disturbances in the past, notably during World War II (1942–1945) [31].
Table 1. Descriptive summary of the reservoir, catchment, and the five sediment cores (Core 1 to Core 5) used to determine annual Cr fluxes in sediments.
| Name | Location | Area | Water depth (m) | Core length (cm) | pHb | Temperatureb (°C) |
|---|---|---|---|---|---|---|
| Reservoir | Central Singapore | 779 700 m2 (except during extreme drought events) | Maximum depth ranges from 6.0 to 8.0 | |||
| Catchment | Southern part of Central Catchment Natural Reserve | 7 649 000 m2 | ||||
| Core 1 | Eastern part of the reservoir | Core 1 and Core 2 represent areas with depths of 6–8 m (25% of the total reservoir areaa) | 6.9 | 43 | 7.70 | 30.6 |
| Core 2 | Eastern part of the reservoir; near Core 1 and the dam of the reservoir | 7.4 | 31 | 7.46 | 31.1 | |
| Core 3 | Central part of the reservoir | Core 3 and Core 4 represent areas with depths of 4–6 m (30% of the total reservoir areaa) | 5.0 | 68 | 7.70 | 30.6 |
| Core 4 | Central part of the reservoir, near Core 2 | 5.4 | 26 | 7.10 | 31.3 | |
| Core 5 | Western part of the reservoir, near a golf course | Core 5 represents areas with depths of 1.5–4 m (28% of the total reservoir areaa) | 2.9 | 29 | 7.26 | 30.1 |
aNear-shore areas of the reservoir with depths <1.5 m were not included in this study due to a high possibility of disturbances from wind leading to resuspension, mixing, and re-deposition of sediments [32, 33]. Areas were estimated based on a bathymetric map using Autochart Pro software, see SM section 2.1. bMeasured in situ from the surface of the reservoir.
2.2. Environmental proxy
Several reasons underpin the choice of Cr as a proxy of non-biomass burning-related TAP. First, Cr has well-documented biological toxicity, with the World Health Organization setting benchmarks for acceptable environmental concentrations of it [34, 35]. Second, although Cr can be released through natural processes, such as volcanic eruptions and soil erosion [36], a significant portion of Cr in the atmosphere is from anthropogenic activities (a global average of 59% in 1983) [37], notably the combustion of fossil fuels and manufacturing of steel [21]. Third, Cr tends to attach to airborne fine particulates and has a 7–10 d atmospheric residence time that enables long-distance transportation [38, 39]. Cr thus has the potential to act as a TAP, particularly in the context of Singapore, the territory of which immediately adjoins rapidly industrialising and urbanising parts of neighbouring Malaysia and Indonesia. Fourth, Cr is assumed to represent a broad range of potential transboundary atmospheric pollutants. This assumption is based on empirical evidence from the same study site in Singapore, from which it is clear that Cr concentrations vary over time in concert with other potential transboundary atmospheric pollutants, including lead, cadmium, zinc, copper and mercury [25, 40].
2.3. Model development and application
A catchment-reservoir mass balance approach depicting the movement of Cr in a hydrological system and depositions of Cr in sediments [41] was adopted. Following existing studies [32, 33, 42], we defined a 'catchment-reservoir system' (the sampling site), and a 'Singapore system', comprising all terrestrial areas of Singapore and hereafter referred to simply as Singapore, to construct a Cr budget (figure 2). Within the catchment-reservoir system, Cr inputs (from dry deposition (ADP_RE), precipitation (WPR), catchment runoff (WRF), and pumped water (WPT)) were assumed to be equal to the sum of Cr storage (in sediment (S) and reservoir water (WRE)) and Cr outputs (through water overflow (WOF) and withdrawal (WWD)).

Figure 2. Mass balance of Cr for Singapore and the catchment-reservoir system. Numbers are Cr budgets in the Singapore system (red) and the catchment-reservoir system (purple) in 2017.  is the Cr input from transboundary atmospheric pollution.
  is the input of Cr from local emission sources.
  is the Cr input from natural sources.
  is the total received Cr in Singapore.
  is the Cr output from Singapore, including contributions from local, transboundary and natural sources.
  is the dry deposition of Cr from transboundary sources.
  is the dry deposition of Cr from natural sources.
  is the dry deposition of Cr from local sources.
  is the total dry deposition of Cr in Singapore.
  is the total dry deposition of Cr to the reservoir surface.
  is the Cr input to the reservoir through catchment runoff.
  is the Cr input to the reservoir surface through direct precipitation.
  is the Cr input to the reservoir through water pumping from adjacent rivers and reservoirs.
  is the total Cr input to the reservoir.
  is the Cr output through water overflow.
  is the Cr output through water withdrawal for domestic consumption.
  is the Cr storage in the reservoir water. S is the Cr storage in the reservoir sediments. Estimates in red are Cr fluxes in Singapore, and those in purple are Cr fluxes in the catchment-reservoir system.
Download figure:
Standard image High-resolution imageWithin Singapore, the total dry deposited Cr (ADP) was assumed to be equal to the sum of dry deposited Cr from anthropogenic transboundary sources (ADP_TAPin), anthropogenic local sources (ADP_LE), and natural sources (ADP_BG). Based on this framework, four steps were taken to determine the component of transboundary Cr pollution (SM section 1.1):
Step 1: Reconstruction of annual Cr fluxes in water (W) and sediments (S) in the catchment-reservoir system following approaches from Yang et al [43] and Sarkar et al [44]. The former was calculated for catchment runoff, precipitation, reservoir water, pumped water, withdrawal, and overflow (x) based on Cr concentrations in water (wc) and hydrological fluxes (Q) (equation 1, provided in full in SM equations 1 and 2). The latter was calculated for the whole reservoir from five sediment cores (j) using information including sediment Cr concentrations (sc), sedimentation rates ( ), sediment focusing factors (
 ), and represented reservoir areas (a) (equation 2, provided in full in SM equation 3).

Step 2: Reconstruction of the flux of total dry deposited Cr in Singapore (ADP, equation 3) from the total dry deposited Cr in the catchment-reservoir system (ADP_RE) through mass balance (equation 4) using data generated from Step 1. Calculations were based on the assumption that dry deposited Cr in the reservoir area ( ) is representative of that across Singapore (
 ) (SM equations 4 and 5).

Step 3: Reconstruction of the flux of dry deposition of Cr from local sources in Singapore (ADP_LE). Estimates were produced for three scenarios, which assume that the maximum annual contributions of local emissions to  from 1900 to 2017 are 75%, 50% and 25%, respectively, using 1972 as a reference year, when local emissions of Cr peaked [45] to determine the percentage of local Cr emissions that were deposited within Singapore (SM equations 6 and 7). Data on local Cr emissions in Singapore from 1900 to 2017 were compiled through a NEI analysis [45].
Step 4: Reconstruction of the flux of dry deposition of Cr from transboundary sources (ADP_TAPin) through mass balance using data generated in Step 2 and 3 for Singapore (equation 5; SM equation 8). We assumed ADP_BG equal to the mean value of ADP from 1900 to 1920 when ADP was in the lowest level.

2.4. Sample collection
Five sediment cores were collected from the reservoir in June 2017 using a UWITECTM gravity corer. The five cores were collected from the eastern (Core 1 and Core 2), central (Core 3 and Core 4), and western (Core 5) sections of the reservoir (table 1). All cores were subsampled at 1 cm vertical intervals upon collection. Following the United States Geological Survey water sampling protocol [46], water samples were collected from the reservoir (12 samples), main inflow streams (four samples), reservoir overflows (three samples) and rainwater (ten samples) from June to December 2017 (SM section 2.1, SM figure 1). It was not possible to sample the water that is occasionally pumped to the study site to adjust water levels in the reservoir because the inlet was inaccessible.
Historical economic, meteorological, and hydrological data were also collected from a variety of sources, including government statistical reports, third-party open databases, peer-reviewed publications, and local newspapers (SM section 2.2, SM figures 2 and 3).
2.5. Analytical procedures
Concentrations of Cr in sediment samples (mg Cr kg−1) and water samples (µg Cr l−1) were determined by inductively coupled plasma optical emission spectrometry and inductively coupled plasma mass spectrometry following protocols established by the United States Environmental Protection Agency [47, 48]. Triplicate measurements, replication tests and spike sample tests were also performed (SM section 2.3).
Chronological control was established for sedimentary evidence by the radiometric dating of sediment cores 1 and 3, based on activities of the isotopes 210Pb [25]. The ages of material in cores 2, 4, and 5 were estimated through a process of sequence slotting involving comparisons across all five cores based on up-core variations in the abundances of spheroidal carbonaceous particles [49], organic-content based on loss-on-ignition analysis, and concentrations of zinc (SM figure 4). Core sequence slotting was performed using CPLslot software V.2.4 [50]. Chronological control also yields information on sedimentation rates and sediment focusing, both of which are useful in determining sediment Cr fluxes (SM section 2.4).
Contemporary Cr concentrations of water samples were used in the estimation of historical Cr fluxes due to a lack of historical measurements. Additionally,  was not included in the calculation of Cr budget owing to a lack of complete time-series records. Errors induced by using static concentrations and excluding
  are discussed in SM section 4.1. Given that our calculation of Cr fluxes is based on a variety of data and associated expressions of error, the aggregated errors of Cr fluxes presented in this study only provide possible ranges of the mean fluxes without any further numerical estimation of probability.
3. Results and discussion
3.1. Cr fluxes in sediments (S) and water (W) (Step 1)
Estimates of S are relatively low for the period 1900 to ca. 1920 at around 4 ± 3 kg Cr yr−1. This period is also associated with the highest level of chronological uncertainty at ±11–17 years (figure 3(a), and SM sections 3.1–3.5, including SM figures 5–12 and SM tables 1–4). From the 1920s onwards, S increased and initially peaked at 10 ± 3 kg Cr yr−1 in 1970 ± 6 years, following which it declined to a low of 7 ± 1 kg Cr yr−1, a level similar to that of the 1950s, by the end of the 1990s. From ca. 2000 onwards, S increased again, peaking for a second time at 13 ± 2 kg Cr yr−1 in 2017 ± 2 years.

Figure 3. Temporal variations in the Cr budget for Singapore from 1900 to 2017. (a) Mean Cr fluxes in sediments and water budget components for the study reservoir. See SM sections 3.5 and 3.6 for details. (b) The flux of total dry deposition of Cr to Singapore, flux of dry deposition from natural sources, and flux of dry deposition from local sources under three scenarios which assume that the maximum contributions of local emissions (ADP_LE) to total dry deposition of Cr (ADP) are 75%, 50% and 25%. Grey areas represent the upper and lower error bounds aggregated from all the errors involved in the Cr budget calculations. Green areas represent the upper and lower error bounds of possible natural background deposition of Cr, determined using the upper and lower error bounds of the total dry deposition of Cr from 1900 to 1920, respectively. (c) The flux of dry deposition of Cr from transboundary sources. Grey areas represent the possible uncertainties involved in the whole mass balance-based calculation process for Singapore under Scenario 3, in which we defined the maximum annual contribution of ADP_LE to ADP to be 25%. The yellow line is the polynomial fit line. d) Contributions of dry deposition of Cr from natural sources, transboundary sources, and local sources under Scenario 3 to the total dry deposition of Cr in Singapore. Contributions were calculated using mean fluxes.
Download figure:
Standard image High-resolution imageEstimates of W generally remained stationary over time, albeit with some interannual fluctuations (figure 3(a), SM figure 13, and SM table 5). Results show that  had the highest Cr flux at 8 ± 2 kg Cr yr−1. By comparison, Cr fluxes of the other budget components, namely
  ,
,  ,
,  and
and  , ranged between 3 ± 1 kg Cr yr−1 and 5 ± 1 kg Cr yr−1. Estimates of W are associated with relatively small chronological errors as they were determined based on documentary sources of hydrological information that include clear calendar dates.
Measurements of Cr concentrations in reservoir water samples (mean 1 µg l−1, SM section 3.6) were all significantly below the safety benchmark adopted in Singapore and recommended by the World Health Organization (50 µg l−1) [34, 35]. Cr concentrations in the surface sediment samples (16–30 mg kg−1, SM section 3.1.2) were also below the heavy metal benchmarks adopted in Canada (37 mg kg−1) [54] and the United States (43.4 mg kg−1) [55].
3.2. Total dry deposition of Cr (ADP) (Step 2)
 was at its lowest for the entire record between 1900 and 1920 at 5 ± 2 tonne Cr yr−1 (figure 3(b)). This low-level was assumed to approximate to the natural background baseline and accords with a negligible intensity of Cr-emitting anthropogenic activities in both Singapore and SEA at the time; there was only one Cr emission source in Singapore before 1920, a privately-owned coal-fired power plant (capacity of 2 megawatts) [56] and there were no large-scale coal-fired power plants in SEA before 1960 [13]. From the 1920s onwards, ADP slowly increased until the early 1940s, when an abrupt increase in fluxes from 6 ± 3 tonne Cr yr−1 in 1942 ± 12 years to 10 ± 3 tonne Cr yr−1 in 1946 ± 12 years occurred. This major change may have been linked to disturbances associated with World War II from 1942 to 1945 when bombing and associated civil strife and disruptions to water supplies occurred in Singapore [27]. From the 1950s, ADP commenced a steady increase at an average rate of 2% per year, peaking at 12 ± 3 tonne Cr yr−1 in 1970 ± 6 years. An abrupt deviation in steadily increasing ADP occurred in the early 1960s possibly due to the effects of severe drought conditions that persisted in Singapore and neighbouring parts of the region from 1961 to 1963 [57] when annual precipitation and catchment runoff were ca. 20% lower than average [27] (SM figure 13). Following its ca. 1970 peak, ADP declined slightly to 10 ± 2 tonne Cr yr−1 in 2000 ± 2 years. Two obvious but short-lived declines in ADP occurred during the 1970s, which could reflect the effects of two droughts recorded in Singapore in 1971 and 1976 (SM section 2.2.2). Noted that the drought-induced drops in ADP might be overestimated based on equation (3), considering the reduced but unknown lake area over the duration of the drought. From ca. 2000 onward, ADP started to increase for a second time, peaking at 16 ± 3 tonne Cr yr−1 in 2017 ± 1 year.
3.3. Local sources of dry deposition of Cr (ADP_LE) (Step 3)
A thorough discussion of local Cr emissions is presented in Chen and Taylor [45]. Local Cr emissions are associated with limited chronological errors as they were determined based on dated annual statistical reports and newspaper articles. In brief, a NEI analysis of Cr in Singapore from 1900 to 2017 showed that local emissions were relatively low (<1 tonne Cr yr−1) from 1900 to the end of the 1950s. With the onset and rapidly increasing rate of industrialisation and urbanisation from the mid-1960s [24], local emissions increased sharply from 1 ± 0.3 tonne Cr yr−1 in the early 1960s to an estimated peak of 61 ± 20 tonne Cr in 1972, following which they gradually declined to pre mid-1960s levels by the end of the 1980s. The decline likely results from a combined effect of increasingly stringent atmospheric emission regulations, notably the Clean Air Act of 1971 and its amendments [58], and a shift away from pollutive manufacturing industries to high-profit, low-pollution financial and services industries in Singapore [59].
Based on local Cr emissions, levels of  from 1900 to 2017 were estimated under scenarios 1, 2, and 3 (figure 3(b)). Results show that
  peaked in 1972 at 8 ± 3 tonne Cr yr−1 (Scenario 1), 5 ± 2 tonne Cr yr−1 (Scenario 2) and 3 ± 1 tonne Cr yr−1 (Scenario 3), or ca.12%, 8% and 4% of total local emissions, respectively. These estimated deposition rates are deemed to be good approximations of actual rates because Cr emitted to the atmosphere can be easily and rapidly transported beyond the borders of Singapore owing to the country's relatively limited territorial extent, monsoonal airflows that prevail throughout much of the year, and the potentially long atmospheric residence time of Cr.
3.4. Dry deposition of Cr from transboundary sources (ADP_TAPin) (Step 4)
 was negligible prior to 1920, and largely (90–100%) originated from natural sources (figures 3(c) and (d)). From the 1920s onwards,
  slowly increased from 0 ± 3 tonne Cr yr−1 to 3 ± 3 tonne Cr yr−1 by the end of the 1930s. Given that the lower bounds of the aggregated errors intersect with zero, the possibility remains that Singapore received little or no TAP until the end of the 1930s. In the 1940s,
  fluctuated significantly, ranging from 1 ± 3 tonne Cr yr−1 to 5 ± 4 tonne Cr yr−1. This fluctuation could be attributed to disturbances associated with World War II and its immediate aftermath. Evidence of relatively low levels of Cr pollution from transboundary sources from the 1900s to 1940s accords with limited economic activity in neighbouring parts of SEA, as is evident in GDP per capita data [60]. In the 1950s,
  slightly increased from 3 ± 3 tonne Cr yr−1 to 5 ± 4 tonne Cr yr−1, with a potential overestimation of 6% of
  in the 1950s arising from the adoption of static Cr water concentrations and the exclusion of WPT (figure 4(a), SM section 4.1). This slow and small increase in TAP may reflect nascent economic development, post-World War II, in the form of the early stages of industrialisation and urbanisation in the region.
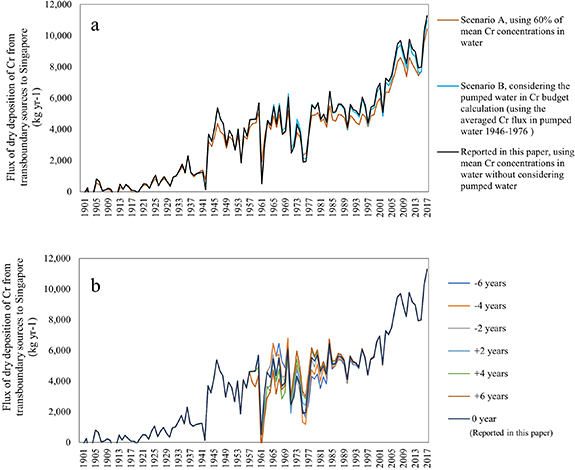
Figure 4. Error analyses. (a) Fluxes of dry deposition of Cr from transboundary sources to Singapore under two scenarios. Scenario A based on 60% of the mean Cr concentrations in water was selected in order to accommodate the possible range of errors induced by adopting static contemporary Cr concentrations in the estimation of historical dry Cr deposition. The figure of 60% is based on a study of Cr concentrations in rainwater in Singapore in 2000 (84 samples, mean 1.62 µg l−1, or 60% of the level in 2017) [51]. Scenario B that includes consideration of pumped water aims to accommodate the possible range of errors induced by excluding pumped water in the Cr budget calculation. (b) Possible range of dry deposition of Cr from transboundary sources under different scenarios with a chronological error of ± 6 years from the 1960s to the 1980s, when Cr deposition from local sources was prominent. See SM section 4.1 for details.
Download figure:
Standard image High-resolution imageScenario 3 appears to result in the most reliable estimate of  from the 1960s to the 1980s, which indicates a stable level of deposition of around 4 ± 3 tonne Cr yr−1. A series of three abrupt declines in
  occurred from the early 1960s to the mid-1970s, possibly associated with the aforementioned droughts in the region in 1961–1963, 1971, and 1976. By comparison, Scenarios 1 and 2 indicate significant declines in Cr depositions over the whole period. These declines seem highly improbable, however, judging by the generally low GDP per capita of the majority of countries in the region throughout this period (figure 5(a)) and a positive correlation between pollutant emissions, e.g. Cr and CO2, and early stages of economic development in ASEAN countries [45, 61]. Given that there is no evidence of climatic changes that could possibly alter the transportation process of Cr, scenarios 1 and 2 were rejected. Scenario 3 indicates that
  was relatively low but fluctuated widely prior to the late 1980s and was not unduly influenced by the choice of chronological errors arising from radiometric dating (figure 4(b)). The low level of
  presumably reflects comparatively attenuated levels of economic development in neighbouring parts of the region prior to the onset and the gathering pace of industrialisation in neighbouring parts of Malaysia and Indonesia in particular [62, 63]. By comparison, industrialisation commenced relatively early in Singapore (in the 1960s) characterised by export-oriented manufacturing [24]. Manufacturing output increased 68-fold in the three decades from 1960, peaking at ca. 25% of GDP by the end of the 1980s [59]. As a result,
  contributed substantially to
  from the 1960s to the 1980s, reaching a maximum of 25% in 1972 when local emissions peaked.
  declined rapidly after the promulgation of the Clean Air Act in 1971, returning to a pre-industrial level and accounting for less than 1% of
  by the end of the 1980s.
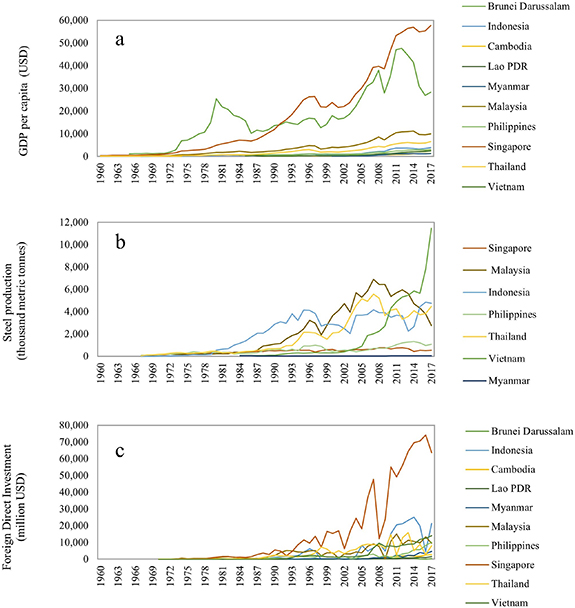
Figure 5. Key economic indicators for ten countries comprising the Association of Southeast Asian Nations (ASEAN). (a) Time-series of GDP per capita in the ten ASEAN nations from 1960 to 2017 [20]. (b) Time-series of steel production in seven ASEAN nations from 1967 to 2017 [52]. (c) Time-series of Foreign Direct Investment net inflows to the ASEAN nations from 1970 to 2017 [53].
Download figure:
Standard image High-resolution image
From ca. 1990 onwards,  slowly increased to 6 ± 3 tonne Cr yr−1 by the end of the 1990s. This increase coincided with the rapid development of export-oriented economies in many countries in SEA, including Singapore's immediate neighbours, Malaysia and Indonesia [64]. As a result, steel production [52] (figure 5(b)) and energy consumption increased two-fold in the 1990s [65]. Industrial development was more widespread in the region at the time, judging from the 44% increase of nitrogen oxide and 40% increase of sulfur dioxide emissions in SEA over the same decade [66, 67]. As opposed to the previously low and stable levels of deposition, this increasing trend since the 1990s provides unambiguous evidence of rising transboundary Cr pollution in Singapore.
 rose rapidly from ca. 2000 at an average rate of about 3% per year, doubling to 11 ± 3 tonne Cr yr−1, or 15 ± 4 kg km−2 yr−1, in 2017 ± 2 year, under all three scenarios. The estimate accords with the results of other studies in urban areas across the world, ranging from 10–63 kg km−2 yr−1 [68, 69] (SM section 4.2, SM table 6). The use of constant contemporary Cr water concentrations and the exclusion of WPT have limited impacts on both the estimates (average overestimation of 12%) and the overall increasing trend (figure 4(a)). The contribution of
  to
to  rose from ca. 50% in 2000 to ca. 70% in 2017, with natural sources accounting for the remainder as local emissions remained negligible. The rapid increase in
  from 2000 to 2017, in agreement with the increasing regional mean concentrations of ambient PM2.5 by 2.7% per year since 2000 [70], is amongst the highest in the world [71]. Simultaneously, Singapore experienced a decrease of 1% per year in mean visibility [72]. This decrease of visibility does not accord with the effective enforcement of stringent environmental regulations in Singapore [73], which has significantly alleviated local pollution, as evidenced by the low levels of local Cr emissions [45].
There are three possible reasons for the rapid increase in  after 2000. First, accelerating economic growth in the region (figure 5(a)), driven at least in part by a six-fold increase in foreign direct investment (figure 5(c)) [53]. These capital inflows were mainly oriented towards Cr-emitting industries, such as steel manufacturing (figure 5(b)), and energy production (figure 1(a)) in order to boost export-oriented industrialisation [74]. Second, the relocation and aggregation of industries in the context of free trade and globalisation. A possible case associated with this type of pollution is the Singapore-Malaysia-Indonesia Growth Triangle scheme, which involves locating labour-intensive and pollutive manufacturing factories in Indonesia and Malaysia, with cleaner high-tech and services industries based in Singapore [75]. Cr emissions generated from industrial centres located in neighbouring parts of Indonesia and Malaysia (figure 1(b)) are relatively easily transported to Singapore by the prevailing monsoon winds due to their close proximity [45]. Third, rising levels of maritime pollution. The port of Singapore ranks as the second largest in the world in terms of volume of container traffic [76]. The number of ships docking in Singapore in 2017 was 16 times the number recorded in 1985 [77, 78]. Ships emit substantial levels of pollution, including Cr [79–81], and are thus highly likely to have contributed to a rising trend of
  in Singapore over the past two decades.
4. Conclusion
Our study adopted a catchment-reservoir mass balance approach and reconstructed variations in transboundary sources of Cr in Singapore from 1900 to 2017. A doubling of dry deposition of Cr attests a substantial increase in transboundary pollution received in Singapore since the 2000s. Many ASEAN countries are currently undergoing rapid industrialisation, and the region is projected to become the world's fourth-largest economy by 2030 [82]. Economic development is, however, potentially associated with adverse environmental impacts that clearly go beyond those primarily associated with biomass burning. Our study provides strong evidence of an increasing trend of non-biomass burning-related TAP within SEA. If no effective measures are taken to regulate such pollution, SEA may become a major source of TAP to other parts of the world, including neighbouring East Asia, by 2030 [13], and could undermine attempts to achieve regional sustainable development and to meet the UN SDGs within the stated timeframes. There is an urgent need to reduce pollution generally in the region, including that from non-biomass burning-related sources. Based on experiences in other parts of the world, the most effective way of reducing emissions would be through regional collaboration and the implementation of agreed, region-wide regulations.
Acknowledgments
We thank Public Utilities Board, Singapore's National Water Agency, and National Park Board for granting us permission and providing access to the reservoir and catchment. We especially thank Elvagris Segovia for extensive assistance with lab work. We also thank Tay Hui Pin Shermaine, Heng Su Li, Alex Finnegan, and Wayne Bannister for their valuable suggestions and comments on earlier versions of this paper. We are indebted to Academic Research Fund Tier 1 (FY2017-FRC1-005) from the Ministry of Education (MoE), Singapore for financial support, and to the MoE, Singapore for a Ph.D. Research Scholarship to CQ. CG was partially supported by the National University of Singapore start-up grant (R-109-000-223-133). We also thank the two anonymous reviewers for their valuable suggestions to improve the paper.
Data availability statement
All data that support the findings of this study are included within the article (and any supplementary information files).
Conflict of interest
The authors declare that there is no potential and/or relevant competing financial or other interest.
Footnotes
- 5
A regional organisation established in 1967, comprising Brunei, Cambodia, Indonesia, Laos, Malaysia, Myanmar, the Philippines, Singapore, Thailand, and Vietnam by 2019. The organisation is aimed at building economic, political-security, and social-culture communities among the member states.