


ABSTRACT
Since the discovery of the unusual prototype SN 2002cx, the eponymous class of Type I (hydrogen-poor) supernovae with low ejecta speeds has grown to include approximately two dozen members identified from several heterogeneous surveys, in some cases ambiguously. Here we present the results of a systematic study of 1077 Type I supernovae discovered by the Palomar Transient Factory, leading to nine new members of this peculiar class. Moreover, we find there are two distinct subclasses based on their spectroscopic, photometric, and host galaxy properties: "SN 2002cx-like" supernovae tend to be in later-type or more irregular hosts, have more varied and generally dimmer luminosities, have longer rise times, and lack a Ti ii trough when compared to "SN 2002es-like" supernovae. None of our objects show helium, and we counter a previous claim of two such events. We also find that the occurrence rate of these transients relative to Type Ia supernovae is  (90% confidence), lower compared to earlier estimates. Combining our objects with the literature sample, we propose that these subclasses have two distinct physical origins.
Export citation and abstract BibTeX RIS
1. INTRODUCTION
Type Ia supernovae (SNe Ia) have long served as standardizable candles for precision cosmology (Riess et al. 1998; Schmidt et al. 1998; Perlmutter et al. 1999). With the advent of synoptic imaging, the numbers of rare and peculiar supernovae have grown. In particular, many have been found that do not obey the standardization procedure outlined in Phillips (1993), which relates peak luminosity to light curve shape. Here we focus on a class of Type I (hydrogen-poor) supernovae having the defining feature of unusually low ejecta speeds. This class is identified by similarities to the prototypical member, SN 2002cx (Li et al. 2003), and hence we refer to these objects as 02cx-like supernovae.
Perhaps the best studied among 02cx-likes is SN 2005hk (e.g., Chornock et al. 2006; Phillips et al. 2007; Sahu et al. 2008). Roughly two dozen other candidate members have been announced (e.g., Jha et al. 2006; Foley et al. 2013), though about half of these have sparse photometric and spectroscopic coverage. With increased numbers trends have begun to emerge, especially a preference for late-type host galaxies and lower peak luminosities relative to typical SNe Ia. The lowest peak luminosity and lowest speed in this class were observed in SN 2008ha (Foley et al. 2009, 2010). However, Valenti et al. (2009) and Moriya et al. (2010) claim it is a core-collapse event. McClelland et al. (2010) counter the core-collapse claim based on their discovery of SN 2007qd, which has properties intermediate to SNe 2002cx and 2008ha. Furthermore, the distinct forest of Co ii lines observed in the near infrared by Stritzinger et al. (2014) reinforces the spectroscopic similarity among SNe 2008ha, 2010ae, and 2005hk.
Recently the slow-speed and rapidly fading SN 2002es has been reported (Ganeshalingam et al. 2012). This object has ejecta speeds and a peak luminosity similar to SN 2002cx, and it replicates several of SN 2002cx's characteristic spectral features. However, it is notably different from SN 2002cx in its light curve shape, in particular having a much faster rise time. At the same time, its B-band light curve decays more slowly than would be expected for a normal SN Ia of the same luminosity. Furthermore, SN 2002es clearly shows a titanium trough in its spectra—a feature that is not found in SN 2002cx or other members of the developing class. As we discuss in this paper, SN 2002es can be taken as the prototype for an alternate channel leading to slow-speeds, Type I supernovae.
Throughout this work we will refer to objects as either 02cx-like or 02es-like to emphasize that the latter may not belong in the same Type Iax (i.e., 02cx-like) class defined in Foley et al. (2013). Furthermore, to emphasize that these objects may have origins different from normal Type Ia events, we will refer to generic hydrogen-poor supernovae as "Type I," reserving "Type Ia" for hydrogen-poor, thermonuclear events that are standardizable for cosmology.
The radial velocities of supernova ejecta are negative; they are blueshifted relative to the center. To avoid confusion with the use of the term "low-velocity"—whether it refers to a more negative or less negative velocity—we use the term "slow-speed" instead.
Here we present slow-speed supernovae discovered by the Palomar Transient Factory (PTF; Rau et al. 2009; Law et al. 2009). Searching through the database of 1077 Type I supernovae, we find six new 02cx-like and three new 02es-like transients with speeds less than about 7000 km s−1. We first detail how our final sample of 02cx- and 02es-like objects was chosen in Section 2. Section 3 contains the analysis of these objects' properties, divided into host properties (Section 3.1), photometry (Section 3.2), spectroscopy (Section 3.3), the interplay between photometry and spectroscopy (Section 3.4), and occurrence rates (Section 3.5). We follow up with a discussion of the implications of our analysis in Section 4 and present our conclusions in Section 5.
2. SAMPLE SELECTION
2.1. The PTF Sample
In order to identify slow-speed supernovae of interest, we thoroughly re-analyzed the spectra in the PTF database. We selected our sample of 02cx- and 02es-like spectra using template matching, after which we further examined the results using ejecta speeds.
First we selected a set of template spectra. We obtained publicly available spectra from the Weizmann Interactive Supernova Data Repository (WISeREP; see Yaron & Gal-Yam 2012): 13 of SN 2002cx (Li et al. 2003; Jha et al. 2006), 37 of SN 2005hk (Chornock et al. 2006; Phillips et al. 2007; Blondin et al. 2012), and 3 of SN 2008ha (Foley et al. 2009). The latter are used as representatives of the extreme slow-speed region of the supernova parameter space. Omitting them would risk missing any other such objects, since very low speeds tend to correspond to more lines being resolved, and such spectra may not match even SN 2002cx very well. Furthermore, we included 11 spectra of SN 2002es (M. Ganeshalingam 2012, private communication). The phases for our templates ranged from −8 days to +314 days.
For the PTF objects we considered all 1904 Type I spectra of 1077 distinct supernovae observed between 2009 March and 2012 May. Using the Superfit package (Howell et al. 2005), the spectra were compared to each of 296 supernova spectra in its standard library without any assumptions on phase. Because there is a degeneracy between redshift and ejecta speed, Superfit was allowed to choose the redshift that gave the best match in each comparison within ±0.02 of the PTF best estimate for the actual redshift, sampling in increments of 0.002. Allowing the redshift to vary avoids the situation wherein two otherwise similar spectra are deemed a poor match solely because of differing ejecta speeds. Superfit was also allowed to vary the assumed extinction A(V) between −3 mag and 3 mag, with R(V) fixed at 3.1. The other Superfit settings employed were a 20 Å rebinning of PTF spectra and five iterations of 3σ clipping on a pixel-by-pixel basis to avoid fitting noise. These parameters were found to result in a low false negative rate when tested with known 02cx-likes.
For each PTF supernova, Superfit's output is a rank-ordered list of matches to templates, using a figure of merit for goodness of fit. Any PTF supernova with a slow-speed template match among the top fifteen matches was selected for further visual inspection. In performing the visual analysis, four features were considered: the number of peaks between 6000 Å and 8000 Å, a particular peak at a rest wavelength of around 6200 Å, the resolution of the feature near 4700 Å into two peaks, and the presence of a Ti ii trough. See Figures 1 and 2 for montages of spectra illustrating these features. A summary of the appearance of these features in the final sample can be found in Table 1.
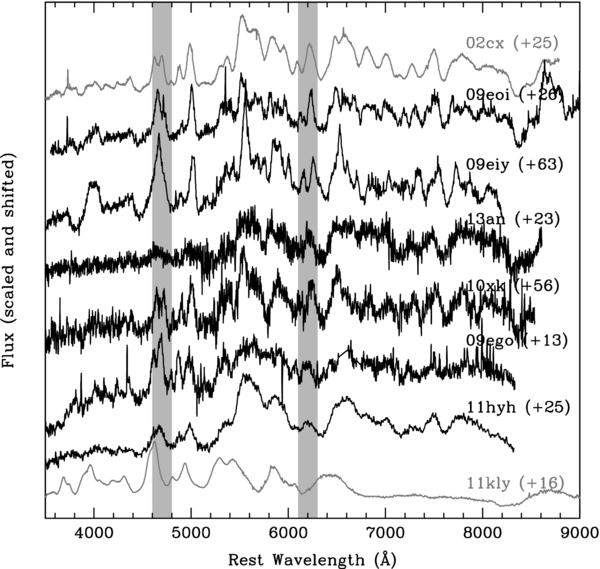
Figure 1. Montage of confirmed 02cx-like spectra. SN 2002cx is shown on top, with a typical SN Ia shown at the bottom. The gray bands highlight regions of particular interest. Details of observations can be found in Table 5.
Download figure:
Standard image High-resolution image
Figure 2. Montage of 02es-like spectra. SN 2002es is shown on top, with a typical SN Ia shown at the bottom. The gray band highlights the titanium trough. The PTF 10ujn spectrum has been binned for clarity. Details of observations can be found in Table 5.
Download figure:
Standard image High-resolution imageTable 1. Visual Vetting
| Name | Phase | No. Peaks | 4700 Å Resolved? | 6200 Å Feature? | Ti ii Trough? |
|---|---|---|---|---|---|
| (days) | (6000–8000 Å)a | ||||
| Templates | |||||
| SN 2002cx | +25 | 9 | Yes | Yes | No |
| SN 2002es | +13 | 12 | No | Yes | Yes |
| SN 2011fe | +16 | 2 | No | No | No |
| 02cx matches | |||||
| PTF 09ego | +13 | 6 + | Yes | Yes | No |
| PTF 09eiy | +55 | 5 + | No | Yes | No |
| PTF 09eoi | +43 | 12 | Yes | Yes | No |
| PTF 10xk | +51 | 12 | Yes | Yes | No |
| PTF 11hyh | +23 | 7 | No | Yes | No |
| iPTF 13an | +23 | 11 | Yes | Yes | No |
| 02es matches | |||||
| PTF 10bvr | +9 | 8 | Maybe | Maybe | Yes |
| PTF 10ujn | +119 | 9 + | No | Maybe | Maybe |
| PTF 10acdh | +42 | 7 | No | Maybe | Yes |
| False positives | |||||
| PTF 09aly | +6 | 4 | No | No | No |
| PTF 10pko | +8 | 14 | Yes | No | No |
| PTF 10vzj | +51 | 10 | Yes | No | No |
| PTF 10xfh | ⋅⋅⋅ | 10 | Maybe | Yes | Yes |
| PTF 10xfv | +17 | 13 | Maybe | No | No |
| PTF 11sd | +8 | 6 | No | No | No |
| PTF 11cfm | +24 | 8 + | Maybe | No | No |
| PTF 11pzq | +18 | 9 | No | No | No |
Note. aA "+" indicates the spectrum does not fill the entire range and so a more complete spectrum would likely have more points. The counting is performed using the spectra as shown in Figures 3 and 4.
Download table as: ASCIITypeset image
The reason we employ peak counting is that high speeds will tend to smooth spectra and eliminate features. Thus large numbers of peaks serve as a proxy for identifying low speeds. For this inspection we first pass the spectra through a 20 Å Gaussian smoothing filter. This eliminates the high-frequency noise and allows us to unambiguously count features independent of original resolution or signal-to-noise ratio. The smoothed spectra are shown in Figures 3 (02cx-likes) and 4 (02es-likes).
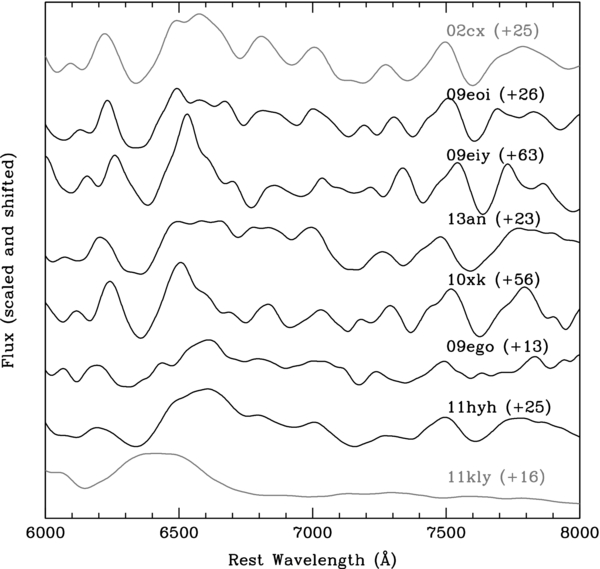
Figure 3. Montage of confirmed 02cx-like spectra, focusing on 6000–8000 Å and smoothed with a Gaussian filter of standard deviation 20 Å. SN 2002cx is shown on top, with a typical SN Ia shown at the bottom. Details of observations can be found in Table 5.
Download figure:
Standard image High-resolution image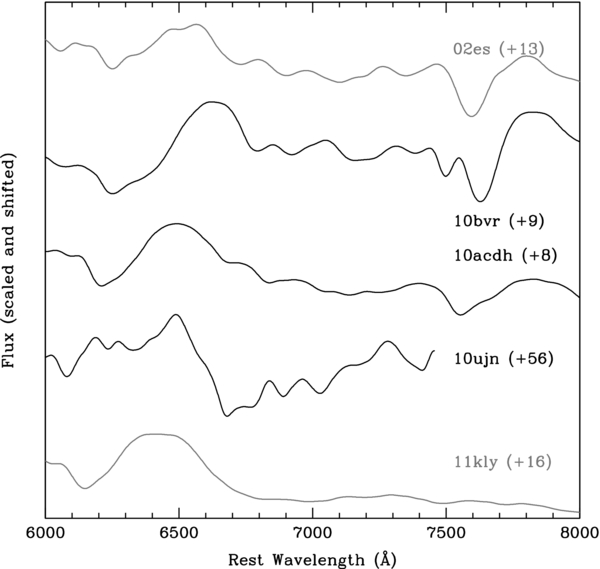
Figure 4. Same as Figure 3, but showing the matches to SN 2002es.
Download figure:
Standard image High-resolution imageThe nature of the 6200 Å feature is not a settled topic in the literature. It may very well be due to adjacent Fe ii absorption, as noted by Li et al. (2003) and Sahu et al. (2008) and modeled by Branch et al. (2004) and Foley et al. (2009). However, it has also been suggested that [Co iii] (Li et al. 2003) or O i (McClelland et al. 2010) could play a role.
As a result of visual inspection, there were several Superfit matches we decided were false positives. The targets PTF 11cfm and PTF 11pzq had spectra initially found to match SN 2002cx by Superfit. However, upon further inspection we concluded their spectra were too noisy to justify any certain placement. We note the lack of matching characteristics in Table 1. Furthermore, PTF 11cfm had an ejecta speed of around 10, 000 km s−1. Another preliminary match included PTF 10vzj, but it was rejected upon closer inspection. The last Superfit match that was rejected upon closer inspection is PTF 10xfh (the Type Ic nature of which is discussed in Y. Cao et al., in preparation).
The names and positions of the final sample are given in Table 2. There are nine matches in all, three of which match SN 2002es while the other six match only SN 2002cx. Overlays of spectra from these objects with matching templates can be found in Appendix C. For completeness, each of the nine rejected objects is also given an overlay, in Appendix D, showing the best match we could achieve to a template.
Table 2. PTF Sample Positions
| Name | R.A. | Decl. |
|---|---|---|
| (J2000) | (J2000) | |
| PTF 09ego |  |
+62°58'22 1 1 |
| PTF 09eiy |  |
−15°05'016 |
| PTF 09eoi |  |
+12°46'426 |
| PTF 10xk |  |
+30°13'387 |
| PTF 10bvr |  |
+39°09'204 |
| PTF 10ujn |  |
+72°20'135 |
| PTF 10acdh |  |
+09°39'313 |
| PTF 11hyh |  |
+14°35'000 |
| iPTF 13an |  |
+15°32'096 |
Download table as: ASCIITypeset image
Lest it be thought that the 02cx-likes and 02es-likes are entirely disparate, we note that all three of the SN 2002es matches found were also found to be reasonably good SN 2002cx matches. Indeed, even SN 2002es itself has spectra generally similar to SN 2002cx, resulting in its classification as 02cx-like by Ganeshalingam et al. (2012). At this stage in our analysis these two classes are distinguished only by the visual presence or absence of the Ti ii trough, with verification of the dichotomy left to the techniques discussed in Section 3.
2.2. The Slow-speed Sample in Context
We place our spectroscopically selected sample in context by constructing a histogram of speeds for all PTF SNe Ia as follows.
First, cuts are made in phase so as to exclude pre-maximum spectra or spectra more than 14 days post-maximum, as well as any spectra for which there is no reliable phase information. By only comparing spectra taken at similar epochs, we avoid the ambiguity that arises from otherwise normal supernovae being labeled "slow speed" due to only being observed long after maximum light. The remaining 837 spectra are deredshifted using the precise spectroscopic redshift of the host galaxy where available and the approximate supernova redshift otherwise.
Next, each spectrum is plotted and the Si ii λλ6348, 6373 absorption feature visually identified. The feature is immediately recognizable in 395 spectra (covering 365 unique objects); the other spectra are not considered further in this analysis. The minimum of the feature is compared to the weighted mean of the two rest wavelengths, 6355 Å, and the velocity calculated from this shift is taken to be the ejecta speed.
Figure 5 shows the distribution of speeds obtained this way for the PTF objects, with mean speeds used in cases where multiple spectra are available. The histogram also shades the sample ultimately selected for being 02es-like (red) or 02cx-like but not 02es-like (blue), following the procedure of Section 2.1. The speeds for these selected objects are obtained in a more precise, robust way, as described in Appendix A, comparing the 02cx-likes to the SN 2002cx +12 spectrum, and the 02es-likes to the SN 2002es +6 spectrum. As can be seen, our sample does indeed lie in the slow-speed part of the distribution. Thus there is agreement between the spectrum-matching selection described in the previous section and a simple analysis based solely on an inferred speed from a single feature.

Figure 5. Distribution of ejecta speeds in PTF data. Shown are SNe with phases ranging from maximum brightness to +14 days. The blue region denotes the 02cx-like objects, with the red section counting the 02es-likes. Speeds are averaged in the case of multiple spectra for the same object. Note that many of our 02cx-like and 02es-like spectra are excluded here in adherence to our strict phase cut. Some objects, such as PTF 10pko (4100 km s−1) and PTF 11sd (6800 km s−1), have low expansion speeds but are not 02cx-like or 02es-like, as discussed in Section 2.2.
Download figure:
Standard image High-resolution imageThere were five PTF objects whose Si ii speeds were found to be particularly low, but which were nonetheless excluded from our final sample on the basis of being overall poor matches to the templates (overlays shown in Appendix D). The spectrum of PTF 09aly has flat-bottomed profiles, making the speed obtained too untrustworthy to include in the distribution. Another two objects with low ejecta speeds are PTF 10pko and PTF 10xfv, though both suffer from large uncertainties in host redshift, meaning they could very well be normal SNe Ia scattered into the slow-speed bins by chance. PTF 10pko, moreover, does not show a very clear phase in the spectrum obtained; Superfit finds reasonable matches to templates spanning two weeks in phase. Both PTF 11sd and 09dav have low Si ii speeds, but neither shows any spectral similarities to SN 2002cx and company other than just low speeds. Separately we note that PTF 09dav is the slowest-speed member of a rare class of calcium-rich gap transients (Sullivan et al. 2011; Kasliwal et al. 2012). We choose not to include them because we have no a priori reason to believe all slow-speed objects, no matter how dissimilar their spectra, should be inseparably grouped together.
A detailed analysis of the Si ii, Ca ii, and C ii features in the SN Ia sample from PTF is presented in Maguire et al. (2014).
2.3. The Literature Sample
Recently, Foley et al. 2013 compiled an exhaustive literature sample of 25 supernovae from the past two decades that could potentially be 02cx-likes. Calling these Type Iax objects, they are defined by four criteria.
- 1."No evidence of hydrogen in any spectrum";
- 2.Photospheric speed at maximum light of no more than about 8000 km s−1;
- 3.Subluminous given its light curve shape, if the data is available; and
- 4.Spectral similarity to SN 2002cx.
We use similar criteria for classifying PTF objects as 02cx-like. One difference is that we do not make a luminosity cutoff. This relaxation diminishes the possibility of instituting a selection bias against more luminous yet kinematically and spectroscopically similar members of this class. The other difference lies in the fact that spectral similarity can be judged quantitatively in different ways; our use of Superfit and feature matching is discussed above.
Of the 25 supernovae identified in Foley et al. (2013), we find that the two helium-rich ones, SNe 2004cs and 2007J, are likely not 02cx-like but rather core-collapse Type IIb. As discussed in Appendix B, SN 2004cs shows Hα absorption and emission broader than galaxy lines. Furthermore, the unfiltered light curve of SN 2004cs is consistent with Type IIb supernovae (Arcavi et al. 2012). Similarly, SN 2007J shows Hα in absorption and is a good spectral match to the prototypical SN IIb 1993J. For more details, we refer reader to the Appendix B. Since the two helium-rich objects are fully consistent with hydrogen-rich core-collapse supernovae, we do not consider them to have implications for the physical origin of the 02cx-likes.
We do not contest the remaining 23 objects, including them where we can in tables and figures to help illustrate where our sample lies with respect to other 02cx-likes in the literature. In some cases data availability precludes us from analyzing these objects as thoroughly as our own sample.
3. ANALYSIS
3.1. Host Galaxies
The environment in which a class of supernovae is found can place strong constraints on theories about their progenitors. We present a collage of host galaxies in Figure 6 and summarize host galaxy properties in Table 3.
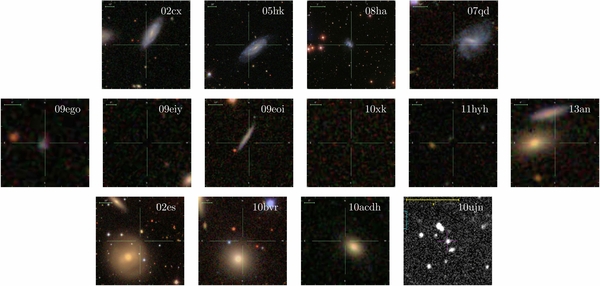
Figure 6. Images of hosts for 02cx-like and 02es-like objects. The top row shows four objects previously published in the literature. The second row shows the six 02cx-like objects in our sample. The bottom row shows the host for 02es itself (left-most), followed by hosts for our three 02es-like objects. All images are from SDSS except for the host of PTF 10ujn, where the PTF reference image is used. All SDSS images are scaled so as to be 44 kpc on a side at the host's distance, and the last image is 206 kpc on each side.
Download figure:
Standard image High-resolution imageTable 3. Host Properties
| Name | Host | za | μb | m(R) | M(R) | g − i | Typef |
|---|---|---|---|---|---|---|---|
| (mag)c | (mag)d | (mag)e | |||||
| Literature sample | |||||||
| SN 1991bj | IC 344 | 0.018146 | 34.26 |  |
 |
⋅⋅⋅ | Sb |
| SN 1999ax | SDSS J140358.27+155101.2 | 0.022986 | 35.07 |  |
 |
0.19 | ⋅⋅⋅ |
| SN 2002bp | UGC 6332 | 0.020770 | 34.88 |  |
 |
1.25 | Sa |
| SN 2002cx | CGCG 044-035 | 0.023963 | 35.18 |  |
 |
0.83 | Sb |
| SN 2003gq | NGC 7407 | 0.021448 | 34.72 | ⋅⋅⋅ | ⋅⋅⋅ | ⋅⋅⋅ | Sbc |
| SN 2004gw | PGC 16812 | 0.017018 | 34.28 | ⋅⋅⋅ | ⋅⋅⋅ | ⋅⋅⋅ | Sbc |
| SN 2005cc | NGC 5383 | 0.007572 | 32.89 |  |
 |
1.31 | Sb |
| SN 2005P | NGC 5468 | 0.009480 | 33.23 |  |
 |
⋅⋅⋅ | Scd |
| SN 2005hk | UGC 272 | 0.012993 | 33.53 |  |
 |
0.70 | Sd |
| SN 2006hn | UGC 6154 | 0.017199 | 34.34 | ⋅⋅⋅ | ⋅⋅⋅ | ⋅⋅⋅ | Sa |
| SN 2007ie | SDSS J221736.67+003647.7 |  |
38.15 |  |
 |
0.57 | ⋅⋅⋅ |
| SN 2007qd | SDSS J020932.72-005959.7 | 0.043146 | 36.35 |  |
 |
0.59 | Sc |
| SN 2008A | NGC 634 | 0.016428 | 34.12 | ⋅⋅⋅ | ⋅⋅⋅ | ⋅⋅⋅ | Sa |
| SN 2008ae | IC 577 |  |
35.66 |  |
 |
0.97 | Sc |
| SN 2008ge | NGC 1527 | 0.004043 | 31.12 |  |
 |
⋅⋅⋅ | S0 |
| SN 2008ha | UGC 12682 | 0.004647 | 30.83 |  |
 |
0.59 | Irr |
| SN 2009J | IC 2160 | 0.015809 | 33.81 |  |
 |
⋅⋅⋅ | Sbc |
| SN 2009ku | APMUKS(BJ) B032747.73-281526.1 |  |
37.76 | ⋅⋅⋅ | ⋅⋅⋅ | ⋅⋅⋅ | Sc |
| SN 2010ae | ESO 162-17 | 0.003662 | 30.58 |  |
 |
⋅⋅⋅ | Sb |
| SN 2010el | NGC 1566 | 0.005017 | 29.99 |  |
 |
⋅⋅⋅ | Sbc |
| SN 2011ay | NGC 2314 |  |
34.82 | ⋅⋅⋅ | ⋅⋅⋅ | ⋅⋅⋅ | S0a |
| SN 2011ce | NGC 6708 | 0.008603 | 32.76 |  |
 |
⋅⋅⋅ | Sb |
| SN 2012Z | NGC 1309 | 0.007125 | 32.07 |  |
 |
⋅⋅⋅ | Sbc |
| SN 2002es | UGC 2708 |  |
34.42 |  |
 |
1.58 | S0 |
| SN 2002cx matches | |||||||
| PTF 09ego | SDSS J172625.23+625821.4 |  |
38.40 |  |
 |
0.86 | ⋅⋅⋅ |
| PTF 09eiy | ⋅⋅⋅ |  |
37.14 |  |
 |
⋅⋅⋅ | ⋅⋅⋅ |
| PTF 09eoi | SDSS J232412.96+124646.6 |  |
36.30 |  |
 |
0.92 | ⋅⋅⋅ |
| PTF 10xk | ⋅⋅⋅ | (0.066) | 37.35 |  |
 |
⋅⋅⋅ | ⋅⋅⋅ |
| PTF 11hyh | SDSS J014550.57+143501.9 | (0.057) | 37.02 |  |
 |
0.90 | ⋅⋅⋅ |
| iPTF 13an | 2MASX J12141590+1532096 | 0.080315 | 37.70 |  |
 |
1.11 | ⋅⋅⋅ |
| SN 2002es matches | |||||||
| PTF 10bvr | CGCG 224-067g |  |
34.05 |  |
 |
1.26 | E |
| PTF 10ujn | ⋅⋅⋅ |  |
38.59 |  |
 |
⋅⋅⋅ | ⋅⋅⋅ |
| PTF 10acdh | 2MASX J09430730+0939285 | 0.059471 | 37.06 |  |
 |
1.34 | ⋅⋅⋅ |
| Other objects from literature | |||||||
| SN 1991T | NGC 4527 | 0.005791 | 32.35 |  |
 |
2.07 | Sb |
| SN 1991bg | M84 | 0.003392 | 31.17 |  |
 |
1.29 | E |
| SN 2009dc | UGC 10064 | 0.021391 | 34.83 |  |
 |
1.33 | S0 |
Notes.
aHeliocentric redshifts from the following sources: Catinella et al. 2005 (SN 1991bj), Haynes et al. 2011 (SN 1999ax), Tripp et al. 1998 (SN 2002bp), Falco et al. 1999 (SNe 2002cx and 2009dc), de Vaucouleurs et al. 1991 (SN 2003gq), Paturel et al. 2003 (SN 2004gw), Koribalski et al. 2004 (SNe 2005P, 2010el, and 2012Z), van Driel et al. 2001 (SN 2005cc), Barnes et al. 2001 (SNe 2005hk, 2009J, and 2010ae), Fisher et al. 1995 (SN 2006hn), Östman et al. 2011 (SN 2007ie), SDSS (SNe 2007qd and 2008ae, iPTF 13an, PTF 10acdh), Theureau et al. 1998 (SN 2008A), Ogando et al. 2008 (SN 2008ge), Lu et al. 1993 (SN 2008ha), Narayan et al. 2011 (SN 2009ku), Miller & Owen 2001 (SN 2011ay), Strauss et al. 1992 (SNe 2011ce and 1991T), Ganeshalingam et al. 2012 (SN 2002es), Cappellari et al. 2011 (SN 1991bg). Otherwise the values are from PTF spectra (multiple narrow lines for PTF 09ego and 09eoi, Na D for PTF 10bvr, Na D and Ca IR for PTF 10ujn) or fits to SN 2002cx spectra (PTF 09eiy, 10xk, 11hyh).
bDistance moduli taken to be as follows: the median redshift-independent value listed on NED, excluding any determinations made using the supernova in question (SNe 1991bj, 2002bp, 2003gq, 2005P, 2005cc, 2008A, 2008ge, 2008ha, 2009J, 2010ae, 2010el, 2011ce, 2012Z, 1991T, and 1991bg); calculated from the CMB-frame redshift as reported on NED (all other literature objects except SNe 2007ie and 2009ku); calculated from the heliocentric redshift (all remaining objects). Where necessary we assume H0 = 70.4 km s−1 Mpc−1, Ωm = 0.273, and  .
cFrom Jones et al. 2009 (SN 1991bj), Doyle et al. 2005 (SNe 2005P, 2009J, 2010ae, 2010el, and 2012Z), Lauberts & Valentijn 1989 (SNe 2008ge and 2011ce), the PTF reference image (PTF 09eiy, 10xk, 10ujn), or SDSS (all others).
dDefined as m(R) − μ.
eFrom SDSS.
fWhere listed, morphological types are given in the following sources: de Vaucouleurs et al. 1991 (SNe 2002bp, 2010ae, 2010el, 2011ay, 2011ce, and 2012Z), Narayan et al. 2011 (SN 2009ku), Ganeshalingam et al. 2012 (SN 2002es), NED (PTF 10bvr), Lira et al. 1998 (SN 1991T), Filippenko et al. 1992a (SN 1991bg), Silverman et al. 2011 (SN 2009dc), Foley et al. 2009 (all others).
gThis large elliptical galaxy is closest based on SDSS imaging and has a redshift of 0.03. However, here we employ a redshift of 0.015 based on narrow Na D found in the PTF spectrum of the transient.
.
cFrom Jones et al. 2009 (SN 1991bj), Doyle et al. 2005 (SNe 2005P, 2009J, 2010ae, 2010el, and 2012Z), Lauberts & Valentijn 1989 (SNe 2008ge and 2011ce), the PTF reference image (PTF 09eiy, 10xk, 10ujn), or SDSS (all others).
dDefined as m(R) − μ.
eFrom SDSS.
fWhere listed, morphological types are given in the following sources: de Vaucouleurs et al. 1991 (SNe 2002bp, 2010ae, 2010el, 2011ay, 2011ce, and 2012Z), Narayan et al. 2011 (SN 2009ku), Ganeshalingam et al. 2012 (SN 2002es), NED (PTF 10bvr), Lira et al. 1998 (SN 1991T), Filippenko et al. 1992a (SN 1991bg), Silverman et al. 2011 (SN 2009dc), Foley et al. 2009 (all others).
gThis large elliptical galaxy is closest based on SDSS imaging and has a redshift of 0.03. However, here we employ a redshift of 0.015 based on narrow Na D found in the PTF spectrum of the transient.
Download table as: ASCIITypeset image
Comparing the PTF sample of 02cx-likes (row 2, Figure 6) to a literature sample of 02cx-likes (row 1, Figure 6), we find that the host galaxies are relatively less luminous and more dwarf-like. At the same time the host galaxies of the 02es-likes (row 3, Figure 6) are relatively more luminous and redder than those of the 02cx-likes.
Quantitatively, the R-band luminosities for 02cx-like hosts in the literature range from −17 mag to −22 mag, while our sample ranges from being fainter than −14 mag up to −21 mag. On the other hand, the hosts of 02es-likes span a range of −19 mag to −22 mag. Moreover, the hosts of 02es-likes are redder than g − i of 1.2 mag, while the 02cx-likes' hosts are generally on the blue side of this boundary.
There are possible outliers to these overall trends. SN 2002bp, SN 2005cc, and iPTF 13an have the reddest hosts of the 02cx-likes; the others with measured g − i values are blueward of 1.0 mag. In the case of iPTF 13an we note that there are at least two other galaxies close by and at a similar redshift, and it is possible that this supernova in fact belongs to a slightly bluer galaxy. However, SN 2008ge was also reported in a galaxy without significant star formation (Foley et al. 2013), and the host of SN 2011ay is listed as having a type in between S0 and Sa. These five objects together indicate 02cx-likes might not be restricted to occur only in star-forming regions. The implications of this are discussed in Section 4.3.
Our data indicates a wide range of galaxy properties associated with 02cx-like supernovae, as well as a connection between 02es-like events and luminous galaxies with old stellar populations. To illustrate this graphically, we present a histogram of host properties in Figure 7. Because we only have a small sample to work with, we divide host galaxies into just three categories—red (g − i > 1), blue (g − i < 1), and indeterminate. Where there is no Sloan Digital Sky Survey (SDSS) color information we fall back on the morphological types listed in the last column of Table 3, with elliptical and S0 galaxies counting as red and spirals and irregulars counting as blue. In cases where no data is available we place the object in the "indeterminate" bin.
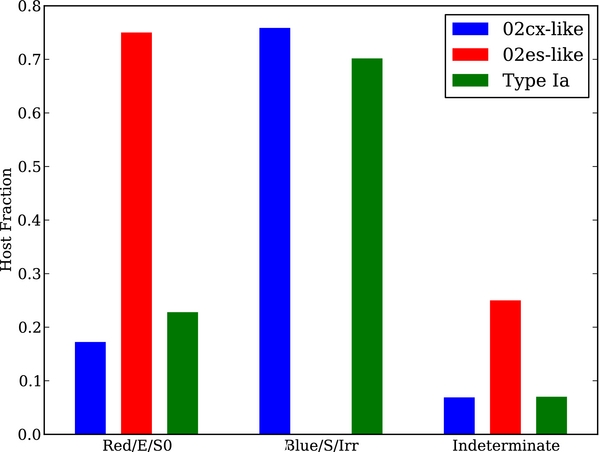
Figure 7. Distribution of host colors with morphological types used as a stand-in where necessary. The three distributions are calculated from 29 (SN 2002cx), 4 (SN 2002es), and 57 (Type Ia) objects, the latter of which are given in Gallagher et al. (2005). Note that we are limited by small-number statistics with our sample.
Download figure:
Standard image High-resolution imageFor comparison, we include in the histogram a sample of generic Type Ia hosts. The data for this population comes from Gallagher et al. (2005), where a set of 57 SNe Ia is studied. The distribution of hosts for 02cx-likes is biased toward star-forming galaxies, whereas 02es-likes tend to be located in early-type hosts. This is reminiscent of the observation that overluminous SNe Ia tend to be preferentially found in late-type hosts (Hamuy et al. 1996) when compared to subluminous SNe Ia preferentially found in early-type galaxies (Howell 2001).
3.2. Light Curves
Apparent brightnesses for the PTF targets were obtained in R-band using the 48 inch Samuel Oschin telescope. Image subtraction using the PTFIDE pipeline (Masci 2013) and reference images (Laher et al. 2014) was used to eliminate host light. Point-spread function (PSF) photometry was performed, calibrated relative to SDSS data (Ofek et al. 2012). The light curves are presented in Figures 8 (for the 02cx-likes) and 9 (for the 02es-likes). Photometric properties can be found in Table 4.
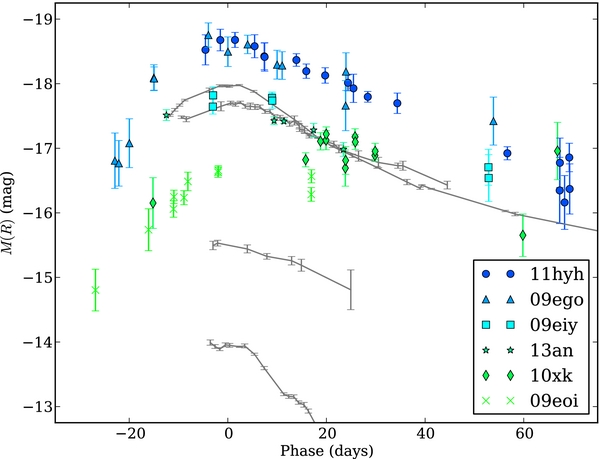
Figure 8. Light curves for the PTF sample. The gray curves show SNe 2005hk, 2002cx, 2007qd, and 2008ha from top to bottom, i.e., in order of decreasing peak luminosity.
Download figure:
Standard image High-resolution image
Figure 9. Light curves for the 02es-like objects in the PTF sample. The gray points are for SN 2002es itself. Note how close the peak magnitudes are to one another. In the case of PTF 10bvr, there is insufficient photometry to constrain the peak.
Download figure:
Standard image High-resolution imageTable 4. Light Curve Properties in R-band
| Name | Peak MJDa | Mpeak(R) | Rise Time | Δm15(R) |
|---|---|---|---|---|
| (mag)b | (days) | (mag) | ||
| Literature samplec | ||||
| SN 2002cx |  |
 |
⋅⋅⋅ | 0.52 |
| SN 2003gq |  |
 |
⋅⋅⋅ | 0.71 |
| SN 2005cc |  |
 |
⋅⋅⋅ | 0.63 |
| SN 2005hk |  |
 |
20 | 0.67 |
| SN 2007qd |  |
 |
⋅⋅⋅ | 0.28 |
| SN 2008A |  |
 |
18 | 0.60 |
| SN 2008ha |  |
 |
⋅⋅⋅ | 0.97 |
| SN 2009J |  |
 |
⋅⋅⋅ | 0.94 |
| SN 2009ku |  |
 |
⋅⋅⋅ | 0.32 |
| SN 2010ae |  |
 |
⋅⋅⋅ | 0.91 |
| SN 2002es |  |
 |
16 | 0.57 |
| SN 2002cx matches | ||||
| PTF 09ego | ≈55084.3 |  |
21 | 0.40 |
| PTF 09eiy |  |
<−18.0 | ⋅⋅⋅ | 0.38 |
| PTF 09eoi | ≈55071.3 |  |
23 | ⋅⋅⋅ |
| PTF 10xk | ≈55183.3 |  |
⋅⋅⋅ | ⋅⋅⋅ |
| PTF 11hyh |  |
 |
⋅⋅⋅ | 0.44 |
| iPTF 13an | ≈56318.0 | <−17.5 | ⋅⋅⋅ | ⋅⋅⋅ |
| SN 2002es matches | ||||
| PTF 10bvr |  |
<−16.1 | ⋅⋅⋅ | ⋅⋅⋅ |
| PTF 10ujn |  |
 |
17 | 0.63 |
| PTF 10acdh |  |
 |
14 | 0.70 |
| Other objects from literatured | ||||
| SN 1991T |  |
 |
16 | 0.60 |
| SN 1991bg |  |
 |
⋅⋅⋅ | 1.36 |
| SN 2009dc |  e e |
 |
23 | 0.15 |
Notes. aModified Julian Date, MJD = JD − 2, 400, 000. bUses distance moduli as reported in Table 3. cDerived from data from the following sources: Ganeshalingam et al. 2010 (SN 2005cc), Sahu et al. 2008 (SN 2005hk), McClelland et al. 2010 (SN 2007qd), Hicken et al. 2012 (SN 2008A), Foley et al. 2009 (SN 2008ha), Narayan et al. 2011 (SN 2009ku), Stritzinger et al. 2014 (SN 2010ae), Ganeshalingam et al. 2012 (SN 2002es), Foley et al. 2013 (all others). dDerived from data from the following sources: Lira et al. 1998 (SN 1991T), Filippenko et al. 1992a (SN 1991bg), Silverman et al. 2011 (SN 2009dc). eAssuming earliest observation corresponds to peak brightness. Peak in B-band.
Download table as: ASCIITypeset image
For hosts without redshift-independent distances, distance moduli were calculated from host redshifts assuming a flat cosmology with parameters H0 = 70.4 km s−1 Mpc−1, Ωm = 0.273, and  , as given in Jarosik et al. (2011). Applying these to get absolute luminosities, with no corrections made for extinction, one can immediately see that the 02cx-likes, luminosities span a wide range, from dimmer than −14 mag to −19 mag. On the other hand, the well-determined peak luminosities of the 02es-likes are confined to the small range of −17.9 mag to −18.1 mag, toward the bright end of the 02cx-like range.
Some members of the sample were seen early enough to record the rise in the light curve. For simplicity, we fit the pre-maximum datapoints to a parabola. A visual inspection is used to determine which datapoints to use in the fit, but beyond this there is no prior placed on the location of the peak. Here we define the rise time as the time between maximum brightness and when the fit is at 1.5 mag below maximum, and these are the values given in the fourth column of Table 4.23 We observe a trend of 02cx-like rise times being longer than those of the 02es-likes.
For most of our sample we are able to measure decline rates. This is simply taken to be the slope of a linear fit to the post-maximum data, where we exclude observations from very late times where the slope of the curve is likely to have changed. The 02cx-likes are seen to have a spread in decline rates, from 0.3 mag to 1.0 mag over the first 15 days after maximum. Again the spread in properties for the 02es-likes is smaller, lying between 0.57 mag and 0.70 mag over 15 days.
With multiple properties measured, we can begin to plot the locations of our sample in various slices of parameter space. One set of parameters of particular interest is that of decline rate Δm15 and absolute luminosity M. These are the very parameters employed in the Phillips relation (Phillips 1993) that has proven key to cosmology. This plot is shown in Figure 10. For the 02cx-likes, one can see both the offset from typical SNe Ia and the overall diversity of the class reflected in this diagram. The 02es-like objects are also offset in the same way but do not display as much diversity. There is no simple correlation between these two properties in R-band (see McClelland et al. 2010).

Figure 10. Relation between peak luminosity and decline rate in R-band (see Table 4). Blue circles indicate 02cx-like data, red triangles are for 02es-like objects, and green squares denote other supernovae discussed in the text. Open symbols denote some doubt regarding the host redshift. The gray band shows the Phillips relation in R-band with parameters obtained from Table 3 of Prieto et al. (2006), extrapolated to Δm15 = 0.5 and truncated at Δm15 = 1.3. In particular, this region shades a 2σ scatter about the best-fit line.
Download figure:
Standard image High-resolution imageFor aiding comparison, key members of several other proposed sub-classes of supernovae are also plotted. SNe 1991T and 1991bg are prototypical overluminous and underluminous examples, respectively. The former has approximately the same decline rate as our sample, the latter has a similar luminosity, but neither is a particularly good match in this parameter space. We also include a point for SN 2009dc, a so-called super-Chandrasekhar Type Ia whose spectrum at one month past maximum is similar to that of SN 2002cx (Silverman et al. 2011). Its location in Figure 10 suggests that it could be at the more luminous, slower-declining end of a loose distribution.
We pause to note that most of PTF's photometry is done in R-band, while decline rates and peak luminosities for normal SNe Ia are often reported in V- and B-bands. We do not have reliable bolometric corrections for the full sample to work in other bands. We caution that working in R-band may cause well known bright events such as SN 2009dc to appear somewhat less luminous. Given that SN 2005hk, for example, was redder post-B-maximum than representative normal and overluminous SNe Ia (see Figure 5 in Sahu et al. 2008), it may be that our sample would appear even less luminous next to other Type Ia events if bolometric luminosities or luminosities in bluer bands were used.
One of our 02cx-likes, PTF 09eiy, has some photometric coverage outside R-band via the Palomar 60 inch telescope (P60) as shown in Figure 11. One of the 02es-likes, PTF 10acdh, has more complete P60 coverage in three bands, as shown in Figure 12. In particular we note there is a secondary maximum in i-band.
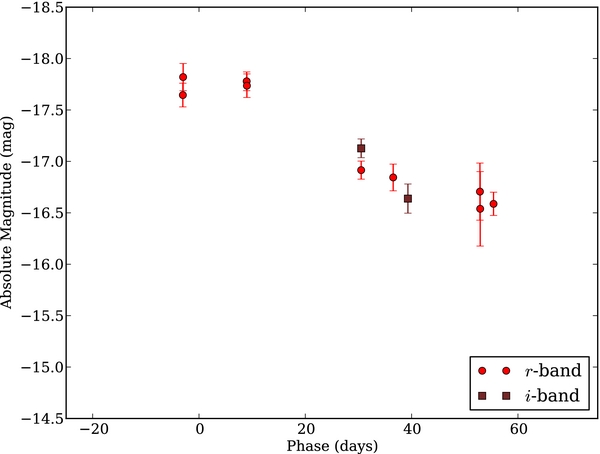
Figure 11. Light curves for PTF 09eiy in two bands.
Download figure:
Standard image High-resolution image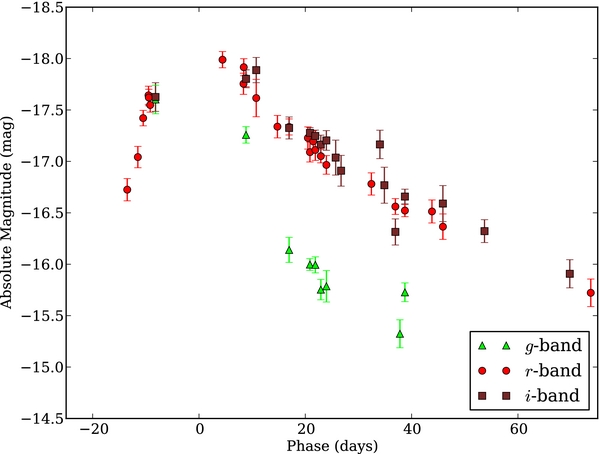
Figure 12. Light curves for PTF 10acdh in three bands.
Download figure:
Standard image High-resolution image3.3. Spectra
We now consider the spectra for these objects. The log of all PTF spectral observations is given in Table 5.
Table 5. Observations of Spectra
| Name | Date | MJD | Phasea | Telescope | Instrument | Wavelength Range |
|---|---|---|---|---|---|---|
| (UT) | (days) | (Å) | ||||
| 2009 Sep 23 | 55097.9 |  |
Keck 1 | LRIS | 3800–9200 | |
| PTF 09ego | ||||||
| 2010 May 15 | 55332 | +225 | Keck 1 | LRIS | 3400–8800 | |
| 2009 Sep 23 | 55097.9 |  |
Keck 1 | LRIS | 3500–9700 | |
| 2009 Oct 12 | 55117 |  |
WHT | ISIS | 3800–7600 | |
| PTF 09eiy | 2009 Nov 11 | 55147.0 |  |
Keck 1 | LRIS | 3700–8700 |
| 2009 Dec 19 | 55184.8 | +100 | Keck 1 | LRIS | 3800–8800 | |
| 2010 Jan 9 | 55205.8 | +121 | Keck 1 | LRIS | 3900–8000 | |
| 2009 Sep 23 | 55098.0 |  |
Keck 1 | LRIS | 3700–9600 | |
| 2009 Oct 11 | 55116 |  |
WHT | ISIS | 3800–7800 | |
| PTF 09eoi | 2009 Oct 16 | 55120.7 |  |
Keck 1 | LRIS | 3500–8400 |
| 2009 Nov 11 | 55146.8 |  |
Keck 1 | LRIS | 3700–8900 | |
| 2009 Dec 19 | 55184.7 | +109 | Keck 1 | LRIS | 4000–8000 | |
| 2010 Feb 11 | 55238.8 |  |
Keck 1 | LRIS | 3500–9100 | |
| PTF 10xk | ||||||
| 2010 Mar 7 | 55262.8 |  |
Keck 1 | LRIS | 3500–7200 | |
| PTF 10bvr | 2010 Mar 7 | 55263.1 |  |
Keck 1 | LRIS | 3500–9000 |
| PTF 10ujn | 2010 Nov 7 | 55508.1 |  |
Keck 1 | LRIS | 3900–8300 |
| 2010 Dec 13 | 55544 |  |
P200 | DBSP | 3800–8000 | |
| PTF 10acdh | ||||||
| 2010 Dec 30 | 55561 |  |
Keck 1 | LRIS | 3500–9500 | |
| PTF 11hyh | 2011 Aug 6 | 55780.0 |  |
P200 | DBSP | 3600–8800 |
| 2013 Feb 18 | 56341.9 |  |
P200 | DBSP | 3100–9300 | |
| iPTF 13anb | ||||||
| 2013 Jun 6 | 56450 | +123 | Keck 2 | DEIMOS | 4500–8900 |
Notes. aTime since R-band maximum; adjusted for host redshift except in the cases of PTF 09eiy, 10xk, and 11hyh. bPhases given are lower bounds, as observations began after maximum.
Download table as: ASCIITypeset image
One spectrum for each object is shown in either Figure 1 (02cx-likes) or Figure 2 (02es-likes). These are arranged in order of increasing absolute magnitude from top to bottom, and the features of interest discussed in Section 2 are highlighted.
In addition to their lack of hydrogen, none of our sample show any clear signs of helium. This is in agreement with the spectral modeling done in Branch et al. (2004), where no helium was needed to match the important features. It is also in accord with the lack of helium in the entire Type Iax sample in Foley et al. (2013) save for SNe 2004cs and 2007J, which we believe do not belong in the same class (see Appendix B).
The most notable difference between the 02cx-likes and 02es-likes is the appearance of the Ti ii trough between about 4100 and 4400 Å only in the latter. This feature is simply not present in any of the 02cx-likes, indicating a difference between the two classes in temperature or possibly composition despite ejecta velocity similarities. The same Ti ii feature distinguishes faint SN 1991bg-like from brighter SN 1991T-like SNe Ia. This analogy is discussed further in Section 4.1.
For each PTF spectrum in our sample (as well as some other spectra from the literature), we measure the speeds relative to each of six templates (three SN 2002cx spectra, a SN 2005hk spectrum, a SN 2008ha spectrum, and a SN 2002es spectrum) using the method described in Appendix A. The resulting offsets are compiled in Table 6.
Table 6. Relative Speeds Compared to Templates
| Object | Phase (days)a | Speed (km s−1) Relative to | |||||
|---|---|---|---|---|---|---|---|
| SN 2002cx +12 | SN 2002cx +25 | SN 2002cx +56 | SN 2005hk +54 | SN 2008ha +11 | SN 2002es +6 | ||
| (7000 km s−1) | (5000 km s−1) | (2000 km s−1) | (6000 km s−1) | ||||
| Templates | |||||||
 |
 |
 |
 |
 |
 |
 |
|
| SN 2002cx |  |
 |
 |
 |
 |
 |
−1901 |
 |
 |
 |
 |
 |
 |
−2239 | |
 |
 |
 |
 |
 |
 |
 |
|
| SN 2005hk | |||||||
 |
 |
 |
 |
 |
 |
−2888 | |
 |
 |
 |
 |
 |
 |
−3467 | |
| SN 2008ha |  |
 |
 |
 |
 |
 |
−3304 |
 |
 |
 |
 |
 |
 |
−3974 | |
 |
 |
 |
 |
 |
 |
 |
|
| SN 2002es | |||||||
 |
 |
 |
 |
 |
 |
 |
|
| 02cx-likesb | |||||||
 |
 |
 |
 |
 |
 |
+1034 | |
| SN 2003gq |  |
 |
 |
 |
 |
 |
 |
 |
 |
 |
 |
 |
⋅⋅⋅ | −2797 | |
 |
 |
 |
 |
 |
 |
 |
|
| SN 2005cc | |||||||
 |
 |
 |
 |
 |
 |
−1254 | |
 |
 |
 |
 |
 |
 |
−2806 | |
| SN 2007qd | |||||||
 |
 |
 |
 |
 |
 |
−3370 | |
 |
 |
 |
 |
 |
 |
+1250 | |
| SN 2008A | |||||||
 |
 |
 |
 |
 |
 |
 |
|
 |
 |
 |
 |
 |
 |
−1025 | |
| PTF 09ego | |||||||
 |
 |
 |
 |
 |
 |
 |
|
 |
 |
 |
 |
 |
 |
+1380 | |
 |
 |
 |
 |
 |
 |
−1594 | |
| PTF 09eiyd |  |
 |
 |
 |
 |
 |
−2712 |
 |
 |
 |
 |
 |
 |
−3895 | |
 |
 |
 |
 |
 |
 |
−3671 | |
 |
 |
 |
 |
 |
 |
−2375 | |
 |
 |
 |
 |
 |
 |
−3043 | |
| PTF 09eoi |  |
 |
 |
 |
 |
 |
−2824 |
 |
 |
 |
 |
 |
 |
−3163 | |
 |
 |
 |
 |
 |
 |
 |
|
 |
 |
 |
 |
 |
 |
−2312 | |
| PTF 10xkd | |||||||
 |
 |
 |
 |
 |
 |
−1185 | |
| PTF 11hyhd |  |
 |
 |
 |
 |
 |
−1590 |
 e e |
 |
 |
 |
 |
 |
−1539 | |
| iPTF 13an | |||||||
 e e |
 |
 |
 |
 |
 |
−2625 | |
| 02es-likes | |||||||
| PTF 10bvr |  |
 |
 |
 |
 |
 |
−1952 |
| PTF 10ujn |  |
 |
 |
 |
 |
 |
 |
 |
 |
 |
 |
+10353 | +10503 | +2334 | |
| PTF 10acdh | |||||||
 |
 |
 |
 |
 |
 |
 |
|
| Other objects from literaturec | |||||||
 |
 |
 |
 |
 |
 |
+4330 | |
| SN 1991T | |||||||
 |
 |
 |
 |
 |
 |
+2569 | |
 |
+10947 |  |
 |
+12978 | +14192 | +2990 | |
| SN 1991bg | |||||||
 |
 |
 |
 |
 |
 |
+2441 | |
 |
 |
 |
 |
 |
 |
+2389 | |
 |
 |
 |
 |
 |
 |
 |
|
 |
 |
 |
 |
 |
⋅⋅⋅ |  |
|
 |
 |
 |
 |
 |
⋅⋅⋅ |  |
|
 |
 |
 |
 |
 |
 |
 |
|
 |
 |
 |
 |
 |
 |
 |
|
| SN 2009dc |  |
 |
 |
 |
 |
 |
 |
 |
 |
 |
 |
 |
 |
 |
|
 |
 |
 |
 |
 |
 |
 |
|
 |
 |
 |
 |
 |
 |
−1636 | |
 |
 |
 |
 |
 |
 |
−2024 | |
 |
 |
 |
 |
 |
 |
+3910 | |
| SN 2011fe | |||||||
 |
 |
 |
 |
 |
 |
+2520 | |
 |
 |
 |
 |
 |
 |
 |
|
Notes. aTime since R-band maximum; adjusted for host redshift except in the cases of PTF 09eiy, 10xk, and 11hyh. bSpectra obtained from the following sources: Blondin et al. 2012 (SNe 2003gq, 2005cc, 2008A); Jha et al. 2006 (SN 2003gq); C. McClelland 2012, private communication (SN 2007qd). cSpectra obtained from the following sources: Filippenko et al. 1992b; Gómez & López 1998 (SN 1991T); Gómez et al. 1996; Turatto et al. 1996 (SN 1991bg); Silverman et al. 2011; Taubenberger et al. 2011 (SN 2009dc). dShift depends on chosen value for redshift. eAssuming first observation corresponds to peak luminosity.
Four of the templates have absolute speeds reported from spectral modeling (Branch et al. 2004; Ganeshalingam et al. 2012), enabling us to convert offsets to absolute speeds in these cases. The absolute speed so obtained will vary depending on the template used. This reflects the fact that the cross-correlation method employed takes into account the entire spectrum, including more lines than just that of Si ii. These variations are self-consistent in the sense that, e.g., the change from the first column of offsets to the second is always roughly +1000 km s−1.
From Table 6 one can see that 02es-likes have a range of ejecta speeds (post-maximum) spanning 4000–7000 km s−1. As has been the case with other properties, the 02cx-likes have a broader range, running from 3000 km s−1 to just under 10, 000 km s−1.
The speeds decrease over the several weeks following maximum light as expected, but the amount of deceleration varies considerably among the 02cx-likes. Two of our 02cx-like supernovae, PTF 09eiy and PTF 09eoi, had spectra taken at many different phases. Figures 13 and 14 show their spectral evolution. The former shows rather clear signs of decreasing speeds, as might be expected from the drop in measured speed from roughly 9600 km s−1 at +14 days to 3900 km s−1 at +121 days. The features become narrower and more of them are resolved as time passes. In particular, the characteristic 6200 Å feature grows more distinctive with time. PTF 09eoi, on the other hand, starts with a low speed, even by SN 2002cx standards, and this shows relatively little evolution over a period of approximately 80 days, going from 5400 km s−1 at +31 days to 4700 km s−1 at +114 days.

Figure 13. Spectral evolution of PTF 09eiy. Phases labeled are days after peak R-band brightness, as defined in Table 4. Details of observations can be found in Table 5.
Download figure:
Standard image High-resolution image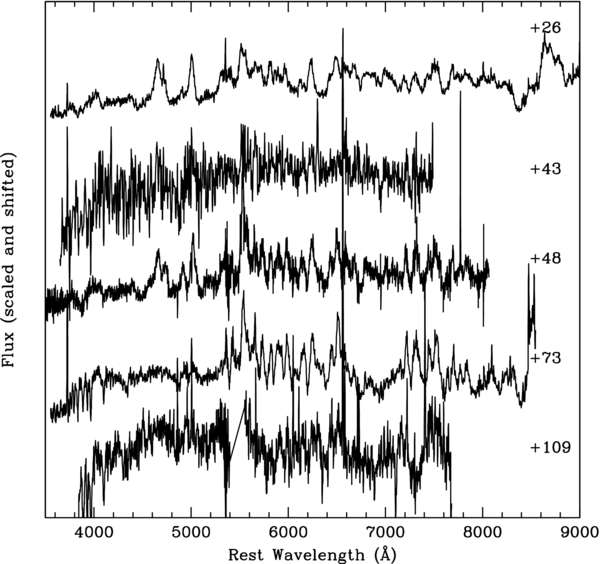
Figure 14. Spectral evolution of PTF 09eoi. Phases labeled are days after peak R-band brightness, as defined in Table 4. Details of observations can be found in Table 5.
Download figure:
Standard image High-resolution imageWe can also consider the late-phase spectra in their own right. Figure 15 shows five spectra for phases later than +100 days obtained for four of the 02cx-like objects in our sample. As was observed by Jha et al. (2006) for the case of SN 2002cx, these objects have many narrow lines indicative of low expansion speeds.
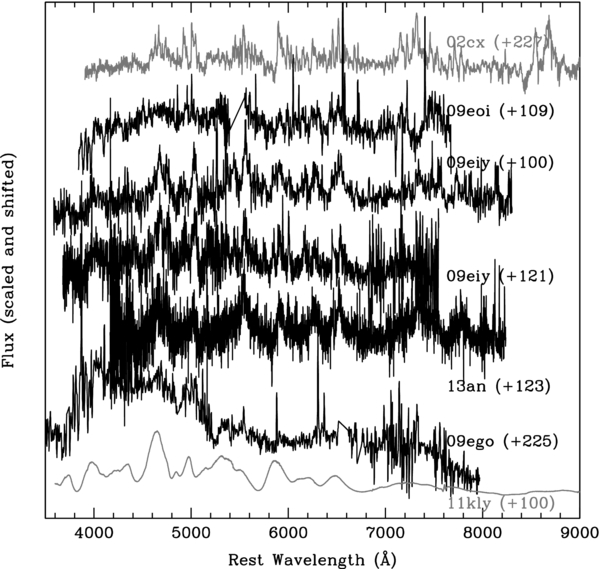
Figure 15. Montage of late-time spectra. SN 2002cx (Jha et al. 2006) is shown on top, with a typical SN Ia shown at the bottom. Details of observations can be found in Table 5.
Download figure:
Standard image High-resolution image3.4. Combining Photometry and Spectroscopy
When photometric and spectroscopic data is taken together, Arnett's Law (Arnett 1982) can be used to estimate the mass of the ejecta. In particular, the analysis given in Pinto & Eastman (2000) shows (via their Equations (4), (17), and (43)) that a plot of magnitude as a function of time is expected to be a parabola near the peak, with
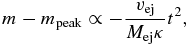
where time is measured from the peak and κ is an effective opacity.
Taking normal SN Ia values to be Mej = 1.4 M☉, vej = 104 km s−1, κ = 0.13 cm2 g−1 (as in Pinto & Eastman 2000), and trise = 18 days (as in Ganeshalingam et al. 2012, whose alternate definition of rise time agrees with ours in the case of SN 2002cx), we can construct curves of constant mass in the vej − trise plane for any assumed opacity, as is done in Figure 16. Also plotted are points for members of our sample for which rise times could be computed. These rise times are defined in Section 3.2 and reported in Table 4. For the ejecta speeds, we use the earliest post-maximum speed for the event given in Table 6, where for these purposes we use the comparisons to the SN 2002cx +12 spectrum for the 02cx-likes, while we use the comparisons to the SN 2002es +6 spectrum for the 02es-likes.

Figure 16. Visualization of Arnett's Law. The symbol scheme is the same as in Figure 10. Lines of constant ejecta mass are calculated for two different values of effective opacity. The rise time for SN 2009dc is taken from Silverman et al. (2011); all others are calculated as described in the text.
Download figure:
Standard image High-resolution imageFrom the figure one can see that the 02cx-likes and 02es-likes must have different ejecta masses and/or opacities. Moreover, even without calculating absolute masses one can see that the 02cx-likes have a broader range of ejecta masses and/or opacities compared to the 02es-likes. In fact, the three 02es-likes fall extremely close to the same contour of constant ejecta mass for any fixed opacity. Using the calculated masses for a fixed opacity, a Kolmogorov-Smirnov test gives a two-tailed probability of populations as separated as ours being drawn from the same distribution of 2%.
The ejecta masses for various 02cx-likes were plotted by Narayan et al. (2011, their Figure 3) and Foley et al. (2013, their Figure 21). In those cases the decline rate was used as a proxy for rise time. Foley et al. (2013) in particular note that there seems to be a clustering around 0.5 M☉ when using their method, which relies on Δm15(V). Our method yields such low masses only for large assumed opacities, as shown in Figure 16. It is also possible that the discrepancy comes from using two different parts of the light curve (late pre-maximum data versus early post-maximum data) to infer the underlying rise time. We note that even with an apparent clustering, the 02cx-likes span a broader range of estimated ejecta masses than 91T-like, 91bg-like, .Ia, calcium-rich, or super-Chandrasekhar supernovae, as shown in Figure 15 of McCully et al. (2014).
Figure 17 shows the relation between peak luminosity24 and the time evolution of ejecta speed. One can see that our sample is slow speed in nature even at early phases. Some of the 02cx-likes, such as SN 2003gq (Foley et al. 2013) and PTF 09eiy, show a dramatic change in speed over the course of several months. Others such as PTF 09ego and PTF 09eoi slow down little over this timeframe. It should be noted here that in some cases but not all, e.g., PTF 09eoi but not PTF 09eiy, the speed relative to a fixed template increases slightly in the latest phases (see Table 6). As a result, speeds that are only measured infrequently can mask significant evolution.
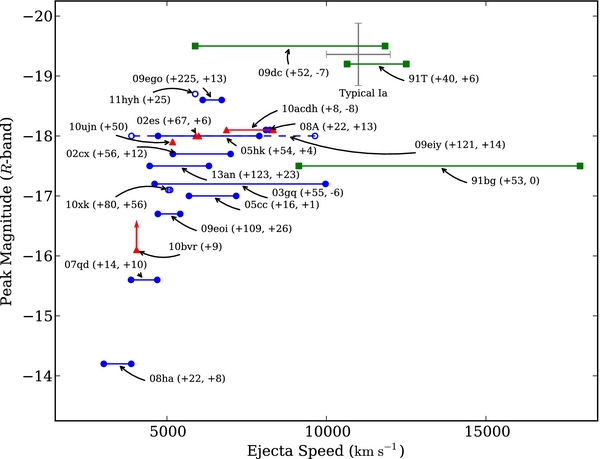
Figure 17. Relation between peak luminosity in R band (see Table 4) and ejecta speed (see Table 6). The symbol scheme is the same as in Figure 10. Typical SNe Ia have speeds of 10, 000–12, 000 km s−1. The typical peak magnitudes are obtained by projecting the relation in Figure 10.
Download figure:
Standard image High-resolution imageThe peak luminosities are seen to be as diverse as the ejecta velocities; most but not all of the sample luminosities lie below those of typical SNe Ia. Both the 02cx-likes and 02es-likes follow a loose trend of more luminous events having generally faster ejecta.
3.5. Rates
Our data also lends itself to calculating relative rates of slow-speed supernovae compared to the normal Type Ia population. Excluding iPTF 13an, which was detected in a different data-taking period than the rest of the sample, we have eight objects at redshifts z < 0.12 (Table 3). The PTF database contains 678 SNe Ia within that redshift limit. As the somewhat underluminous nature of these classes means we may miss a greater fraction of them than we do for typical SNe Ia in a volume-limited survey, the rate should be greater than about 8/678 ≈ 1%. On the other hand, PTF can reliably detect transients at 20.5 mag relative magnitude, and so in order to be complete down to an absolute luminosity of −17 mag (−14 mag) we place an upper limit to the distance modulus of μ = 37.5 mag (μ = 34.5 mag), corresponding to a redshift of z = 0.070 (z = 0.018). (Here we are assuming negligible extinction.) We detect 6 (1) slow-speed supernovae compared to 300 (18) SNe Ia at z < 0.070 (z < 0.018). We therefore estimate the rate of slow-speed events relative to the Type Ia population to be 6/300 = 2.0% if their luminosities are brighter than −17 mag and 1/18 = 5.6% if their luminosities are brighter than −14 mag.
We can take this analysis a step further and give confidence intervals for the rate. Given a total rate r, the probability of finding k objects of interest out of N is given by the binomial distribution
Assuming a uniform prior on [0, 1], the probability of the total rate being less than some value r0 given an observed fraction k/N is
The probability that the relative rate r is less than r0 given Nss slow-speed objects and NIa normal Type Ia objects is
Consider the dimmer cutoff, in which we have NIa = 18 and Nss = 1. As  , our rates are significantly lower than the central value of
  reported in Foley et al. (2013). Even using the lower end of their interval, 31% – 13% = 18%, our data predicts the actual rate to be lower with
  confidence. Note that Foley et al. obtain their rates using correction factors as large as two, working under the assumption that 02cx-likes are missed more frequently than normal Type Ia events even after limiting the survey volume. Given the homogeneous nature of our survey and data analysis, we do not need to employ such corrections. As
  and
and  , we report a 90% confidence interval for the rate of
  . This is consistent with the volume-limited value of 5% quoted in Li et al. (2011).
4. DISCUSSION
4.1. A Summary of the Slow-speed Sample
Combining the PTF slow-speed sample with the published literature sample, there is an overall dichotomy of properties, with two distinct channels environmentally, photometrically, and spectroscopically (see Table 7). Both channels are explosions with slow-speed ejecta that are similar to those of the Type Ia variety (as determined from the features in their hydrogen-poor spectra) with certain additional spectral similarities not found in all SNe Ia. However, there are remarkable differences. SN 2002cx and its closest relatives span a wider range of peak luminosities; have a broader range of ejecta masses and/or opacities; and often appear in late-type hosts, including dwarfs. On the other hand, SN 2002es and related transients display a narrower range of higher peak luminosities; have very similar ejecta masses and opacities; and exclusively reside in luminous, early-type hosts with minimal star formation.
Table 7. Properties of SN 2002cx and SN 2002es Families
| Property | 02cx-like | 02es-like |
|---|---|---|
| Host type | Generally Late | Early |
| Host g–i color (mag) | 0.59–1.47 | 1.26–1.58 |
| Host luminosity (R-band, mag) | −14 to −21 | −19 to −22 |
| Peak luminosity (R-band, mag) | −13 to −19 | −18 |
| Rise time (days) | 18–23 | 14–17 |
| Decline rate (Δm15, mag) | 0.3–1.0 | 0.6–0.7 |
| Ti ii trough? | No | Yes |
| Ejecta speed (km s−1)a | 4000–9000 | 4000–7000 |
Note. aAt approximately 10 days post-maximum.
Download table as: ASCIITypeset image
Furthermore, despite the otherwise similar spectra, the presence or absence of the Ti ii trough is a clear and simple way to discriminate between these two cases. As mentioned in Section 3.3, Ti ii is seen in the underluminous SN 1991bg but not in the overluminous SN 1991T, suggesting an analogy between the 02cx-like/02es-like and 91T-like/91bg-like dichotomies. In fact both 91bg-likes and 02es-likes have older hosts and faster photometric evolution than their counterparts that do not show the Ti ii trough. Additionally the range in peak luminosities is small for both 91bg-likes and 02es-likes.
Reviewing the evidence, both classes share similarities with canonical Type Ia explosions. Contrary to Foley et al. (2013) we believe SNe 2004cs and 2007J are not related to either class. The distinguishing feature of both our classes is low ejecta speeds, i.e., low kinetic energy per unit ejecta mass. Arnett's Law, if physically applicable and barring an extreme difference in effective opacity, indicates that 02es-likes have lower masses (see Figure 16), meaning these objects overall have weaker, less energetic explosions. Both classes have somewhat lower peak luminosities relative to typical SNe Ia, and hence have less radioactive material. They both have a rate that is an order of magnitude lower than SNe Ia. Finally, the older environments of the 02es-likes suggest a longer delay time compared to the 02cx-likes.
4.2. Review of Models for SN 2002cx
With these properties in mind, we proceed to discuss the relevant models that have been proposed. When Li et al. (2003) announced the discovery of SN 2002cx, three models were initially put forth as candidates for explaining this event.
The first idea was a variation on the traditional picture of SNe Ia: A single white dwarf begins to explode as a deflagration and does not immediately transition to a detonation. These models could explain the underluminous, slow-speed nature of SN 2002cx, but they were not fully accepted due to the chemical compositions they predicted. More recent work by Phillips et al. (2007) and Jordan et al. (2012), however, has shown that pure deflagrations—as opposed to deflagrations that belatedly transition to detonations—are better candidates for explaining SN 2002cx, with off-center deflagrations leading to appropriate compositions and kinematics. On the other hand, some of these models—e.g., all failed-detonation models in Jordan et al. (2012)—cannot explain large ejecta masses, as they leave behind a bound remnant.
The second idea considered by Li et al. is that of two white dwarfs merging—the double-degenerate scenario. Work done by Nomoto et al. (1995) had indicated that the disruption and subsequent accretion of a carbon–oxygen white dwarf onto an oxygen–neon–magnesium white dwarf could result in an underluminous explosion. Attempts were made to explain the low-luminosity supernova SN 1991bg with these models, but they were at the time dismissed in the context of SN 2002cx due to the high expansion speeds they predicted.
The third type of model discussed in Li et al. is that of a low-mass white dwarf being detonated by the ignition of an outer shell of helium. While some of these edge-lit models showed promise with regard to the compositions they predicted, they did not generally capture the light curve shape, expansion velocity, or luminosity of SN 2002cx. Helium shell detonation has more recently been considered in connection with so-called .Ia models, as discussed in Bildsten et al. (2007). These particular models have the benefit of producing underluminous, Type I explosions. However, .Ia explosions are predicted to have ejecta speeds upward of 10, 000 km s−1 (Fink et al. 2007; Shen et al. 2010). Moreover, they evolve more rapidly than our observed supernovae, and in fact their rise times are too fast even for SN 2002es (Ganeshalingam et al. 2012). Foley et al. (2009) also find .Ia models unsatisfactory for explaining 02cx-likes.
Foley et al. (2013) have advocated for a scenario in which accretion from a nondegenerate helium star triggers a deflagration for explaining 02cx-likes, including two supernovae we do not consider to be a part of this class (see Section 2.3 and Appendix B). We note again that with these objects (which also showed signs of hydrogen) excluded, there is no helium signature in our sample. That said, it is possible for helium to be involved without leaving a spectral signature, especially given the high temperatures required for it to be ionized.
We also mention two models not discussed in the original SN 2002cx paper. One recently proposed idea for SN 2002cx events is that of a white dwarf merging with a neutron star or black hole (Fernández & Metzger 2014). Here the white dwarf is spread into an accretion disk vulnerable to detonation waves propagating through it. Of particular interest is the low expansion speed predicted by such a model, due to the gravity of the compact accreting object. Furthermore, the amount of 56Ni produced is predicted to be less than for a typical Type Ia, leading to low luminosities. In this preliminary stage, however, the model does not yet make specific spectral predictions, and so we cannot yet determine if the spectral features found in 02cx- and 02es-like objects can be obtained from these.
Finally, Valenti et al. (2009) raise the possibility that SN 2008ha is in fact a core-collapse supernova in disguise. They note that the core collapse of a hydrogen-deficient star could reproduce the low-luminosity, slow-speed nature of SN 2008ha. Fryer et al. (2009) and Moriya et al. (2010) agree, claiming to have a model wherein a large amount of material falls back onto the remnant. One may be tempted to declare SN 2008ha, whose Type Ia status has the most doubt, to be entirely unrelated to SN 2002cx and the other members of the family. However, as Table 4 and Figure 10 show, the gap between SNe 2002cx and 2008ha is partially bridged by SNe 2007qd and 2009J and to a lesser extent SN 2005cc and PTF 09eoi. Moreover, SN 2010ae is even fainter than SN 2008ha, as noted by Stritzinger et al. (2014).
This overview of models for SN 2002cx is meant only to illustrate what theories have been put forth and we caution that the existing literature has analyzed some of them to a greater extent than others.
4.3. Two Channels for Two Subclasses
Despite the kinematic and certain spectroscopic similarities between 02cx-likes and 02es-likes, there are enough distinctions to make finding a single, satisfactory model difficult. Considering the observed dichotomy between the two subclasses, we suggest that one should look for two distinct theoretical explanations in order to best fit the two sets of observations.
White dwarf deflagration models are currently favored in the literature for explaining 02cx-likes. We speculate that some deflagration models may explain the relatively weaker (subluminous and low-energy) 02es-like explosions better than they explain the 02cx-likes.
Recently, Kromer et al. (2013) undertook 3D deflagration simulations of white dwarfs in an attempt to explain 02cx-likes. They found low-speed and low-luminosity explosions with a small amount of 56Ni (some of which falls back onto a bound remnant). They predict spectra with weak Si ii absorption and prominent iron-group elements at all epochs. All four properties are consistent with both 02cx-likes and 02es-likes. However, their modeling does not extend far enough to encompass the extremely low 56Ni levels in SN 2008ha. Their rise times are also much shorter than those observed in 02cx-likes.
These latter two shortcomings for explaining 02cx-likes are in fact advantages when it comes to explaining 02es-likes, which have a narrower range of luminosities and shorter rise times. The archetypal model used in that study, N5def, results in 0.372 M☉ of ejecta (see Figure 16), 0.158 M☉ of which is 56Ni, and a rise time of 11.2 days.
Further modeling will be needed to secure what is now just speculation based on observations of 02es-likes. For example, Kromer et al. note their model naturally leads to high ionization states not unlike found in SN 1991T, so it can only work if adjustments allow for lower temperatures. One key feature any successful model will have to explain is the low scatter in the photometric properties and the preference for older host galaxies seen in this class.
If both 02es-likes and 02cx-likes are deflagrations, then some parameter, e.g., temperature or host environment, must result in distinguishable explosions. Alternatively, 02cx-likes may come from a different channel.
Here we reconsider the double degenerate models for the 02cx-likes. Pakmor et al. (2010) simulate the merger of equal-mass carbon–oxygen white dwarfs and apply this to SN 1991bg. They find low speeds, large amounts of partially burnt material (up to 1.8 M☉), and luminosities between −17 mag and −18 mag in R-band. We note that all three features are consistent with both SN 1991bg and the 02cx-likes.
However, the low decline rates found by Pakmor et al. are more consistent with 02cx-likes than SN 1991bg. It is also easier to explain the observed photometric diversity of 02cx-likes in this model—neither white dwarf need be up against the Chandrasekhar limit at the time of merger, so one would expect to see explosions of a range of white dwarf masses. Note that subject to opacity considerations, our inferred mass for PTF 09ego (see Figure 16) may require the merger of two relatively massive white dwarfs in this scenario.
As Pakmor et al. point out, unless the initial separation is large and/or there is only one common envelope phase, the merger may happen in a relatively short time, while there is still a high rate of star formation in the galaxy. At the same time, some fraction of the appropriate progenitor binaries may have large enough initial separations that by the time the merger does happen, star formation has turned off in the host.
If the apparently old environments of SNe 2002bp, 2005cc, and 2008ge and iPTF 13an are exceptions, however, then the evidence points to young environments rather than a range. This, combined with the fact that there are known core-collapse events with extremely low ejecta speeds (Appendix B), suggests we cannot rule out core-collapse scenarios for 02cx-likes (e.g., fallback; Moriya et al. 2010).
More modeling with 02cx-likes in mind must be done to vet these possibilities. In particular, any successful model must satisfactorily explain the remarkable diversity of this class's properties, as well as the observed host galaxy distribution.
5. CONCLUSION
Using the wealth of data obtained over several years of PTF surveys, we were able to identify nine new slow-speed, Type I supernovae. Six of these are spectroscopic matches to the much-discussed SN 2002cx, while the other three bear striking similarity to SN 2002es. Combining our sample with those already reported in the literature (which we number at 23 02cx-likes, plus SN 2002es), we see a clear dichotomy of properties emerge: The 02cx-likes come from more varied hosts (that are often star-forming), can be quite underluminous, and have hotter ejecta, while the 02es-likes are found in elliptical hosts, are only slightly underluminous, have cooler ejecta, and also have remarkably fast rise times. It is important to note that our selection and classification is based on generic spectral matching; the persistence of the dichotomy through the photometric and host analyses lends further support to the idea that there are indeed two distinct subclasses. Though constituting only  of Type I supernovae (given the luminosity cut described in Section 3.5), we now have enough examples of these slow-speed transients to classify and understand them.
Prior attempts at explaining these slow-speed phenomena have fallen notably short of capturing all members. We posit that modeling can be done in a consistent way, but not if one is trying to describe physically distinct scenarios with the same models. The 02cx-likes and the 02es-likes are dissimilar enough to warrant two different progenitor scenarios, and neither class should be confused with hydrogen- or helium-rich transients. Finding a model for 02cx-likes remains difficult, but we speculate that the merger of two carbon–oxygen white dwarfs should at least be considered further now that we have a more coherent picture of this class. More convincingly, there are white dwarf deflagration models that fit observations of 02es-likes. These two channels lead to explosions that are similar to but distinguishable from typical SNe Ia.
We are grateful to M. H. van Kerkwijk and J. M. Silverman for valuable discussions. We thank the referee for useful comments that improved this manuscript, as well as R. J. Foley for a close reading and detailed feedback. We also thank I. Arcavi, C. Badenes, V. Bhalerao, K. Clubb, A. Cucchiara, A. De Cia, O. Fox, A. Horesh, D. Levitan, K. Mooley, D. Perley, S. Tang, S. Tendulkar, P. Vreeswijk, and D. Xu for their contributions to PTF, especially with observations and data reduction.
C. J. W. began this research as part of the summer student exchange program between Princeton and Carnegie. M. M. K. acknowledges generous support from the Hubble Fellowship and Carnegie-Princeton Fellowship. A. G.-Y. acknowledges support by the EU/FP7 via ERC grant 307260; ISF, Minerva, and Weizmann-UK grants; as well as the "Quantum Universe" I-Core Program of the Planning and Budgeting Committee and the Israel Science Foundation and the Kimmel Award. A. L. P. is supported through NSF grants AST-1205732, PHY-1068881, and PHY-1151197, as well as the Sherman Fairchild Foundation. E. O. O. is incumbent on the Arye Dissentshik career development chair and is grateful for support by grants from the Willner Family Leadership Institute, Ilan Gluzman (Secaucus, NJ), the Israeli Ministry of Science, the Israel Science Foundation, Minerva, Weizmann-UK, and the I-CORE Program of the Planning and Budgeting Committee and the Israel Science Foundation.
This research made use of the Sloan Digital Sky Survey (SDSS), the NASA/IPAC Extragalactic Database (NED), WISeREP, SIMBAD, and VizieR. The PTF spectra for the slow-speed sample will be made available on WISeREP.
Facilities. PO:1.2 m - Palomar Observatory's 1.2 meter Samuel Oschin Telescope, PO:1.5 m - Palomar Observatory's 1.5 meter Telescope, Keck:I (LRIS) - KECK I Telescope, Hale (DBSP) - Palomar Observatory's 5.1m Hale Telescope, ING:Herschel (ISIS) - Isaac Newton Group's William Herschel Telescope, Keck:II (DEIMOS) - KECK II Telescope, Magellan:Baade (IMACS) - Magellan I Walter Baade Telescope
APPENDIX A: OBTAINING ROBUST VELOCITIES VIA CROSS-CORRELATION
Here we describe our method for measuring precise relative velocities between an input spectrum and a template. This method is robust against weak Si ii lines being difficult to discern among many slow-speed features. Each input is compared to the appropriate template using the IRAF routine fxcor. The theory behind the routine is given in Tonry & Davis (1979), and we summarize the idea of the procedure and our usage of it here.
First, all spectra are deredshifted according to their hosts' cataloged redshifts (as listed below in Table 3). They are then rebinned to a rest frame resolution of 1 Å, which is in all cases finer than the raw data. Spectra are continuum subtracted with a cubic spline averaged over five points, rejecting data points at the 2σ level. Five iterations are performed with a one-pixel grow radius.
Next, the spectra are limited to the wavelength range of 4000–7000 Å. This was chosen as the maximal range covered by all object and template data. For both the object and the template, this windowed spectrum is Fourier transformed with periodic boundary conditions, apodizing 20% of the window with a cosine bell on either end to prevent discontinuity artifacts stemming from the enforced periodicity. The spectra are then filtered by multiplying these transforms by a ramp function. The ramp rises from zero to unity between wavenumbers 10 and 15, filtering out very low frequency variations. It descends back to zero over the wavenumber range 1067–1600, excluding any signal with a frequency more than about half the highest achievable spatial frequency given the resolution.
As described in Tonry & Davis (1979), one takes the product of the Fourier transforms and fits a symmetric function—in our case a Gaussian—to the largest peak in this correlation function; the center corresponds to the relative velocity. In practice we identify the peak of interest as the largest one with a reasonable shift—i.e., the ejecta speed must be positive and is almost certainly less than 20, 000 km s−1—and fit this peak to a Gaussian as follows. The peak is defined as the contiguous set of points with values at least half that of the largest value in the peak. Each datapoint, corresponding to a single wavenumber, is weighted by a symmetric triangle function that vanishes at the outermost points and reaches its maximum of unity at the center. A least-squares fit is then performed, with the model being a Gaussian with no offset. The shifts of the peaks directly translate into relative ejecta speeds, and these are tabulated in Table 6. More information could in theory be ascertained from the shape of the peak, but for our purposes here we only use the relative velocity thus obtained.
This method has the advantage of taking all lines into account. Furthermore, the weighting of the lines in contributing to the final velocity scales quadratically in the amplitude of the line. As discussed in Tonry & Davis (1979), this is a desired feature.
APPENDIX B: THE TYPE IIb NATURE OF SNe 2004cs AND 2007J
SN 2004cs was discovered by LOSS (Li et al. 2004) and classified as a Type IIb supernova by Rajala et al. (2005) based on a Keck/LRIS spectrum now available on WISeREP. This spectrum showed strong He i features, as well as the Hα line. Recently, Foley et al. (2013) reanalyzed the spectrum, claiming the Hα feature consists only of host galaxy emission that is furthermore blueshifted compared to nearby lines. They associate this object with the class of 02cx-likes via comparison with SN 2007J. This association is then used to bolster the claim, originally based only on SN 2007J, that some members of this class show helium signatures and that therefore the class as a whole must come from progenitor systems that contain an abundant source of helium (e.g., accreting binary systems with helium star donors).
Due to the importance of this issue, we reexamine these two objects here. The spectrum of SN 2004cs is shown in Figure 18. In addition to prominent He i absorption lines, the object displays the Hα line, both in emission (broader than galaxy lines) and absorption. This line is blueshifted with respect to the host lines and is thus unaffected by possible host galaxy contamination.
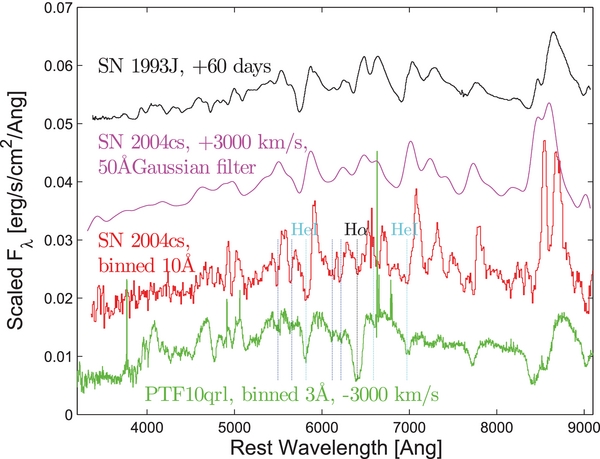
Figure 18. Comparison of spectra of SN 2004cs (red) and PTF 10qrl (green, a slow-speed SN IIb) showing excellent alignment of features. Absorption lines of hydrogen (Hα, black) and He i (5876 Å and 7065 Å, cyan) are clearly identified, and additional nearby features (blue) also perfectly align. A broadened and blueshifted version of the SN 2004cs spectrum (magenta) also displays a strong similarity to a spectrum of the prototypical Type IIb SN 1993J (black).
Download figure:
Standard image High-resolution imageIn order to clarify line identification, we went through the PTF database and located the two Type IIb supernovae with the lowest expansion speeds. One of those, PTF 10qrl, has a spectrum similar to that of SN 2004cs, though its expansion speeds are not as low. PTF 10qrl has a very strong and obvious Hα line, as well as higher order Balmer lines (Hβ and Hγ) and He i lines, so its Type IIb classification is not in question. This spectrum is also plotted in Figure 18, after being redshifted by 3000 km s−1. As can be seen, the spectra are quite similar, with most features aligning very well. The expansion speed is indeed somewhat higher for hydrogen than for He i, but this is a known feature of SNe IIb (e.g., Arcavi et al. 2011) reflecting the fact that the thin hydrogen layer lies above the deeper helium-rich layers, and the velocity difference seen in PTF 10qrl is the same as that seen in SN 2004cs.
To further illuminate this issue, we recall the process through which the class of 02cx-likes was associated with SNe Ia: spectral comparison of artificially broadened and blueshifted slow-speed spectra with those of normal events (e.g., in Figure 1 of Foley et al. 2013). We repeat this process for SN 2004cs, convolving the spectrum with a 50 Å Gaussian filter and blueshifting the result by 3000 km s−1. Figure 18 compares the result with a spectrum of the prototypical Type IIb SN 1993J (Barbon et al. 1995, available on WISeREP), and the similarity is striking throughout the entire visible wavelength range, including the clear alignment of the Hα absorption features.
Regarding the light curve of SN 2004cs, Figure 16 of Foley et al. (2013) shows this object being something of an outlier in terms of a width-luminosity relation in the V-band that may exist for the 02cx-likes. We therefore investigate whether the photometry for this object can shed light on its nature. Arcavi et al. (2012) show that SNe IIb have a very tight range of decline rates in the R-band. In Figure 19 we overlay the light curve of SN 2004cs (Foley et al. 2013, we follow the common practice of assuming unfiltered KAIT datapoints trace the R-band luminosity) on the Arcavi et al. (2012) SN IIb template, finding good agreement.
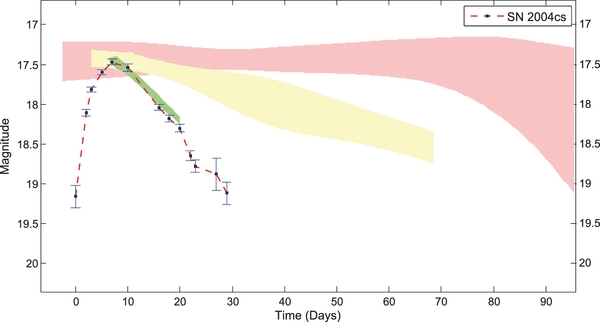
Figure 19. Unfiltered photometry of SN 2004cs (Foley et al. 2013) fitting the R-band SN IIb template (green shade) from Arcavi et al. (2012). The yellow band indicates Type IIL SNe II, while the pink represents Type IIP.
Download figure:
Standard image High-resolution imageWe conclude that SN 2004cs is indeed a Type IIb supernova, as it was originally classified by Rajala et al. (2005). The spectrum provides strong support for this classification, including robust evidence for hydrogen. The photometry provides further support, showing this object to be consistent with SNe IIb rather than 02cx-like SNe Ia.
Motivated by our study of SN 2004cs, we now turn to SN 2007J, the similarity to which led Foley et al. (2013) to classify the former as an 02cx-like. In Figure 20 we compare the spectrum of SN 2007J to the Type IIb SN 1993J. The spectra are indeed quite similar. In particular, an absorption line coincident with Hα can be seen in the SN 2007J spectrum. The expansion speed derived from this feature assuming it is Hα is 9000 km s−1, which is greater than the He i speed (6500 km s−1), as we have already noted is commonly seen in SNe IIb. One may argue that there is no corresponding Hβ feature in the SN 2007J spectrum, but this has also been seen in some SNe IIb (e.g., SN 2008ax, see Pastorello et al. 2008, Figure 5) and probably suggests that the amount of hydrogen is lower in this object than in SN 1993J.
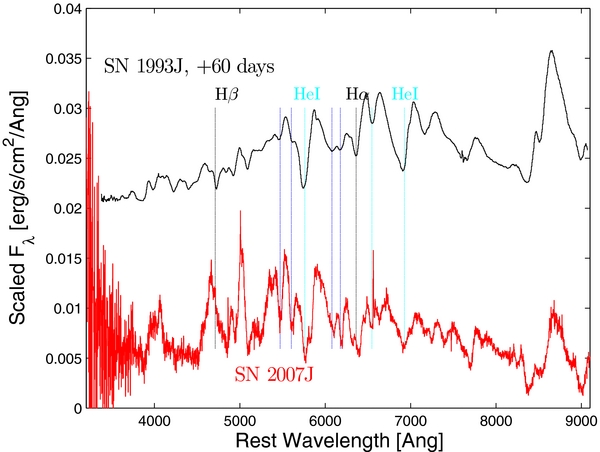
Figure 20. Comparison of the spectrum of SN 2007J (red) with that of SN 1993J (black). The Hα (black) and He i (5876 Å and 7065 Å, cyan) lines are clearly identified, and additional nearby features (blue) align as well. Hβ is not detected in SN 2007J, perhaps indicating a thinner hydrogen envelope.
Download figure:
Standard image High-resolution imageFrom this analysis we conclude that SN 2007J could also be a Type IIb supernova, rather than an 02cx-like Type Ia. We therefore view the claim of a helium connection to the 02cx-class—a connection based only on SN 2004cs and SN 2007J—as questionable. The helium in these two objects should not be taken as a constraint on the progenitor systems of 02cx-like transients.
APPENDIX C: INDIVIDUAL SPECTRA
Here we present overlays showing the matches between our PTF spectra and SN 2002cx or SN 2002es, as is appropriate. We show a single phase for each PTF object, and the template against which we choose to match it is chosen based on the phase of our spectrum. The 02cx-likes are shown in Figures 21–26, and the 02es-likes are shown in Figures 27–29.
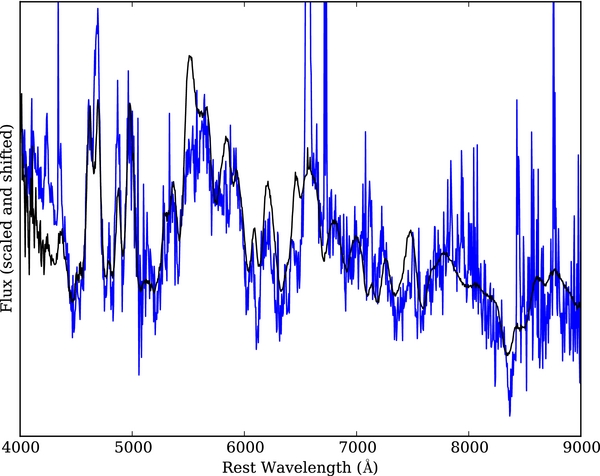
Figure 21. Comparison between PTF 09ego (blue, +13 days) and SN 2002cx (black, +20 days). The former has had galaxy light subtracted via Superfit.
Download figure:
Standard image High-resolution image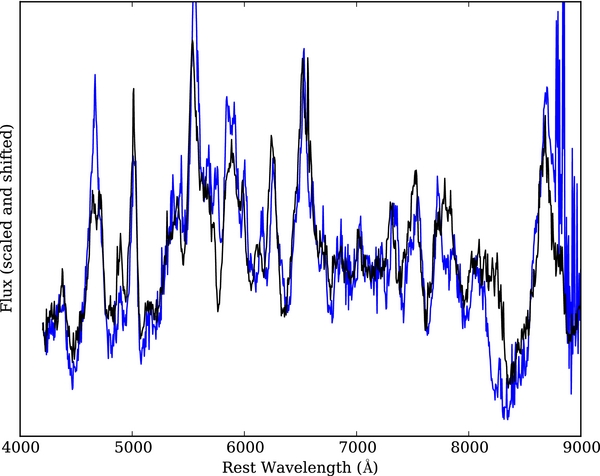
Figure 22. Comparison between PTF 09eiy (blue, +55 days) and SN 2002cx (black, +56 days). The former has had galaxy light subtracted via Superfit, and the fiducial redshift of 0.06 was used to align spectra.
Download figure:
Standard image High-resolution image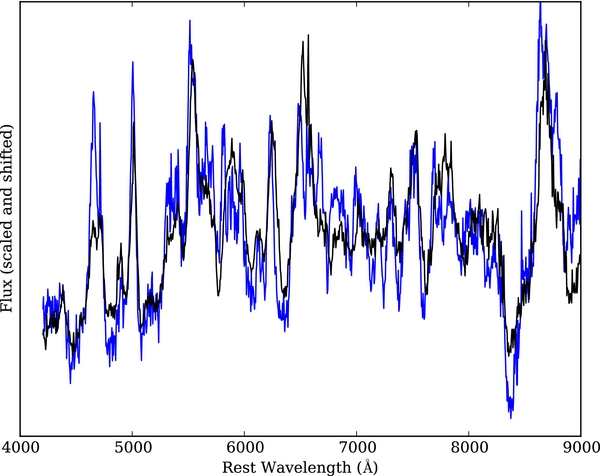
Figure 23. Comparison between PTF 09eoi (blue, +26 days) and SN 2002cx (black, +56 days). The former has had galaxy light subtracted via Superfit.
Download figure:
Standard image High-resolution image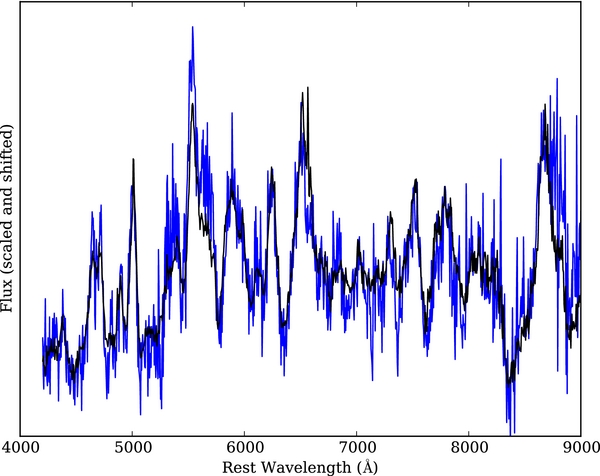
Figure 24. Comparison between PTF 10xk (blue, +56 days) and SN 2002cx (black, +56 days). The former has had galaxy light subtracted via Superfit, and the fiducial redshift of 0.066 was used to align spectra.
Download figure:
Standard image High-resolution image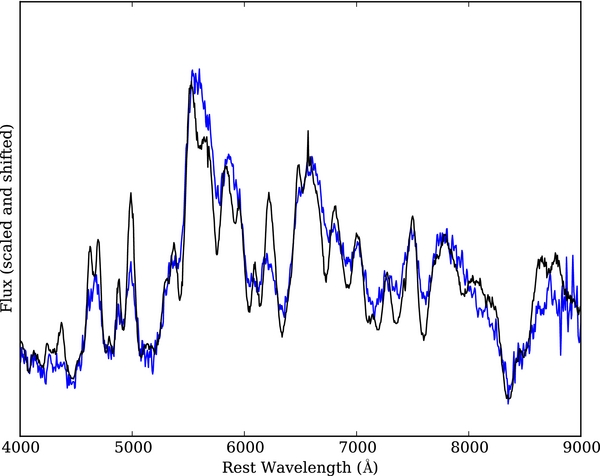
Figure 25. Comparison between PTF 11hyh (blue, +25 days) and SN 2002cx (black, +25 days). The former has had galaxy light subtracted via Superfit, and the fiducial redshift of 0.057 was used to align spectra.
Download figure:
Standard image High-resolution image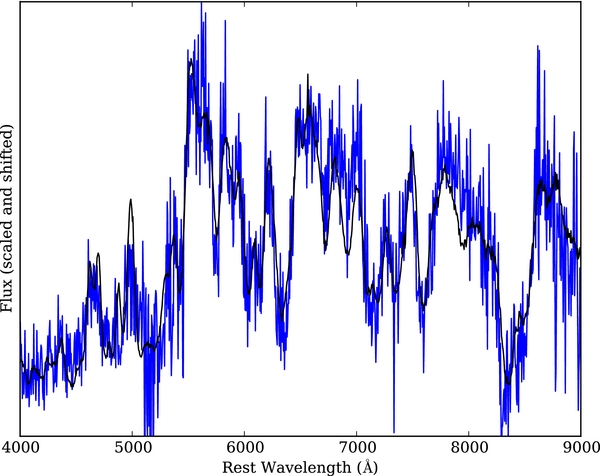
Figure 26. Comparison between iPTF 13an (blue, at least +23 days) and SN 2002cx (black, +25 days). The former has had galaxy light subtracted via Superfit.
Download figure:
Standard image High-resolution image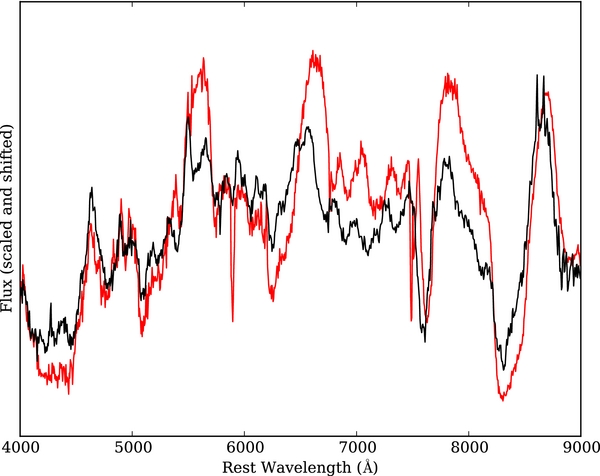
Figure 27. Comparison between PTF 10bvr (red, +9 days) and SN 2002es (black, +13 days). The former has had galaxy light subtracted via Superfit.
Download figure:
Standard image High-resolution image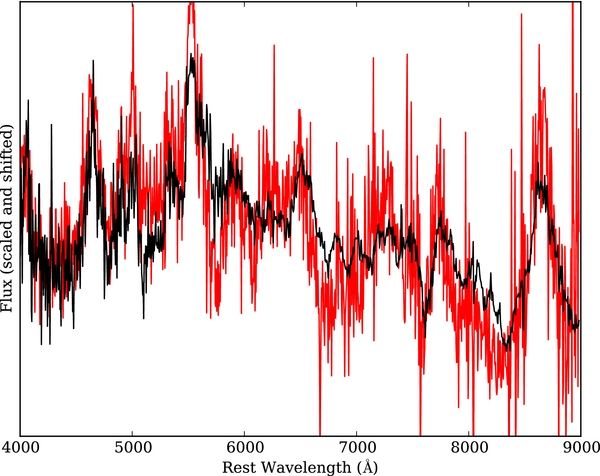
Figure 28. Comparison between PTF 10ujn (red, +56 days) and SN 2002es (black, +30 days). The former has had galaxy light subtracted via Superfit.
Download figure:
Standard image High-resolution image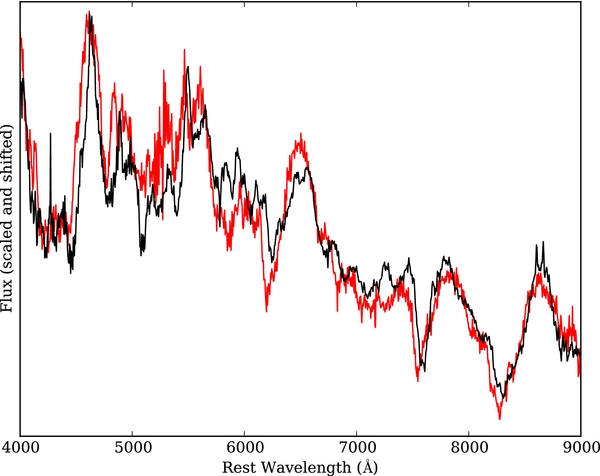
Figure 29. Comparison between PTF 10acdh (red, +8 days) and SN 2002es (black, +13 days). The former has had galaxy light subtracted via Superfit.
Download figure:
Standard image High-resolution imageAPPENDIX D: SPECTRA OF OBJECTS DETERMINED TO NOT MATCH
Here we present overlays for the nine rejected objects discussed in Section 2.1. The first four objects—PTF 10vzj, 10xfh, 11cfm, and 11pzq, Figures 30–33—were automatically flagged by Superfit but did not pass further scrutiny. The other five, shown in Figures 34–38, are examples of slow-speed supernovae that are poor spectral matches to SN 2002cx, SN 2002es, or other related objects. Each overlay shows the best match we could get to an 02cx-like or SN 2002es template of interest.

Figure 30. Comparison between PTF 10vzj (green, +51 days) and SN 2002cx (black, +56 days). The former has had galaxy light subtracted via Superfit.
Download figure:
Standard image High-resolution image
Figure 31. Comparison between PTF 10xfh (green, unknown phase, spectrum taken 2010 October 8) and SN 2002cx (black, +56 days). The former has had galaxy light subtracted via Superfit.
Download figure:
Standard image High-resolution image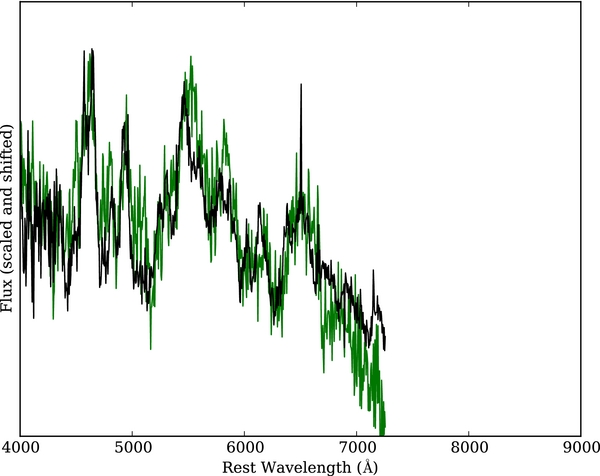
Figure 32. Comparison between PTF 11cfm (green, +24 days) and SN 2002cx (black, +15 days). The former has had galaxy light subtracted via Superfit.
Download figure:
Standard image High-resolution image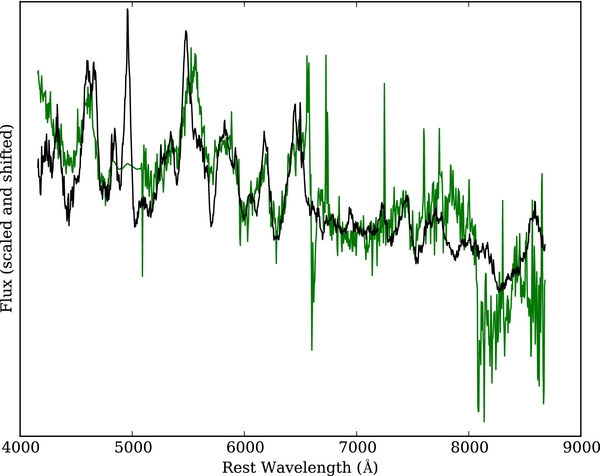
Figure 33. Comparison between PTF 11pzq (green, +18 days) and SN 2002cx (black, +56 days). The former has had galaxy light subtracted via Superfit.
Download figure:
Standard image High-resolution image
Figure 34. Comparison between PTF 09aly (green, +6 days) and SN 2005hk (black, +15 days). The former has had galaxy light subtracted via Superfit.
Download figure:
Standard image High-resolution image
Figure 35. Comparison between PTF 09dav (green, +12 days) and SN 2002es (black, +37 days). The former has had galaxy light subtracted via Superfit.
Download figure:
Standard image High-resolution image
Figure 36. Comparison between PTF 10pko (green, +8 days) and SN 2002es (black, +3 days). The former has had galaxy light subtracted via Superfit.
Download figure:
Standard image High-resolution image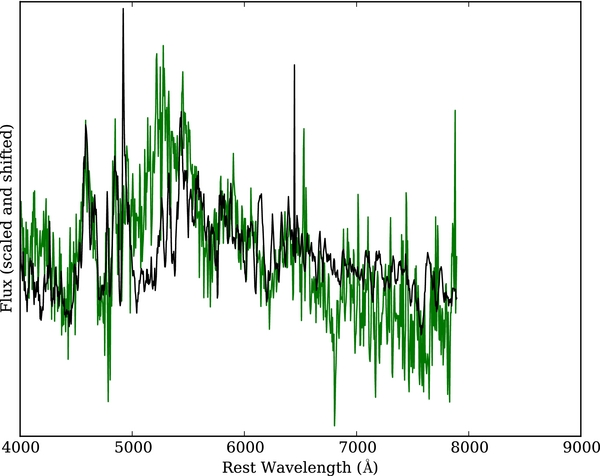
Figure 37. Comparison between PTF 10xfv (green, +17 days) and SN 2008ha (black, +11 days). The former has had galaxy light subtracted via Superfit.
Download figure:
Standard image High-resolution image
Figure 38. Comparison between PTF 11sd (green, +8 days) and SN 2008ha (black, +8 days). The former has had galaxy light subtracted via Superfit.
Download figure:
Standard image High-resolution image
Footnotes
- 23
Note that the value of 16 days obtained for 02es agrees with the estimate of 16 ± 3 days obtained in Ganeshalingam et al. (2012) using other means.
- 24
Few supernovae have enough spectra to construct a well-sampled, time-dependent curve in velocity–magnitude space.