
Abstract
Considering the importance of biosynthesized silver nanoparticles (AgNPs) using plant phytochemicals, the aim of this work was to evaluate the effect of pH in the formulation of AgNPs, bioreduced with thyme essential oil. Biosynthesized AgNPs were prepared under different pH (7, 8, 9 and 10), and the physicochemical stability was evaluated during 90 days at 6 °C and 25 °C. Using GC/MS technique, 17 different compounds were observed in the thyme essential oil; however, borneol and α-terpineol were the majoritarian compounds, probably responsible to the formation of AgNPs. UV–vis spectroscopy with absorbance between 415 and 440 nm and Transmission Electron Microscopy (TEM) confirmed the synthesis of nanoparticles, with diameters of 40 nm and spherical shapes to pH 7, 8 and 9. Through DLS approach, was observed that the average particle diameter was around 90 nm for all pH tested. AgNPs presented homogeneous size distribution, and zeta potential values very close to the theoretical stability range. Moreover, biosynthesized AgNPs presented high antibacterial activity against Escherichia coli and Staphylococcus aureus. Through x-ray Photoelectron Spectroscopic (XPS) analysis was possible confirm the presence of crystalline silver nanoparticles. Thus, silver nanoparticles eco-friendly prepared using thyme essential oil can be considered as an alternative way to produce this nanomaterial with great stability and high antibacterial activity.
Export citation and abstract BibTeX RIS

Original content from this work may be used under the terms of the Creative Commons Attribution 4.0 licence. Any further distribution of this work must maintain attribution to the author(s) and the title of the work, journal citation and DOI.
1. Introduction
Many techniques are widely used to synthesize the silver nanoparticles, among them, the physical ('bottom up') and chemical ('top down') methods [1]. However, the physical and chemicals methods results in toxic and non-ecological components to produce nanoparticles, which limit the use of these materials in many industrial areas, such as clinical, pharmaceutical and food [2, 3]. A solution to this problem is the use of new methods to produce innovative materials, minimizing the impact of toxic components in the environment and in the human health [4]. In this way, new mechanisms to produce silver nanoparticles are gaining prominence in the scientific field, as the use of natural phytochemicals to produce silver nanoparticles [5, 6]. Nanotechnology green-materials for the industry enhances the chemical stability of the compounds, control the results of release and improve as properties of the final product [7].
Thyme (Thymus vulgaris) is an aromatic plant belonging to the family Lamiaceae, whose properties are well studied for their antifungal and antioxidant properties, due the presence of phytochemicals in the essential oil [8–11]. The use of extracts of leaves, flowers and essential oils can act as chemical agents of metallic salts and stabilizers of the system due to its components as amino acids, flavonoids, phenolic compounds, terpenoids, among others. Related to the production of nanoparticles using plant phytochemicals, the plant extract mixed up with a solution of metal salt and the reaction carry out completely in a few minutes [12]. However, the contact time, concentration of metal salt, pH, and temperature can effect on the properties of nanoparticles, and these parameters in the syntheses of silver nanoparticles have not been completed investigated. In this way, considering the importance of green synthesis of nanoparticles using plant phytochemicals, and the different effect in the synthesis, the aim of this work was to evaluate the stability of pH in the formulation of silver nanoparticles, bioreduced with essential oil of thyme.
2. Materials and methods
2.1. Essential oil extraction and characterization
Thyme leaves were obtained at Agricultural Research and Rural Extension of Santa Catarina (EPAGRI) (Itajaí City, Santa Catarina State, Brazil), and the essential oil was extracted by steam distillation, during a period of five hours. The yield of thyme essential oil was around 2%. The chemical characterization of the thyme essential oil was realized by Gas Chromatography coupled with Mass Spectrometry detector (GC/MS) (Shimadzu, model GC/MS QP 2010). The chromatography conditions of GC/MS were based on de Melo et al [13], with modifications. Was used a Capillary column ZB-5MS, 30 m × 0.25 mm × 0.25 μm film, a injector in temperature of 250 °C, helium gas flow of 1 ml min−1. The chromatographic furnace was optimized with initial temperature of 60 °C for 4 min until reaching 210 °C, remaining for 6 min, totaling 35 min in the total chromatographic run. The essential oil was diluted 200 times in hexane for further CG/MS injection. The quantification of each component was determined by the normalization of the peak area in the total ion chromatogram, and the retention indices were calculated according to Van den Doll and Kratz [14], using n-alkanes standard (C7–C30) at the same chromatographic conditions described above. The GC/MS identification was based on the comparison of mass spectra with NIST-05 data libraries, as well as the comparison of calculated retention indices with those found in the literature (Web NIST, GMD).
2.2. Green synthesis of silver nanoparticles
Green synthesis of silver nanoparticles was performed according to Maciel et al [15] with modifications. Silver nitrate solution (AgNO3 3 × 10⁻⁴ mol l−1) was prepared under different pH (7, 8, 9 and 10), adjusted with NaOH 0.1 mol l−1. After this, AgNO3 solutions were heated under magnetic stirring until 100 °C. 2 ml of an acetone solution containing thyme essential oil (1:170, v/v) was slowly added to the AgNO3 solutions. The mixture was maintained under stirring for 30 min. The color changed from incolor to brownish, indicating the synthesis of AgNPs. Samples were coded as: AgNPs pH 7; AgNPs pH 8; AgNPs pH 9; and AgNPs pH 10.
2.3. Characterization of AgNPs
2.3.1. UV–vis spectroscopy
UV–vis spectroscopy analysis was adopted to verify the systhesis of AgNPs under different pH, in a Hitachi U-1800 spectrophotometer (Tokyo, Japan), used in a scanning mode in a wavelength range from 300 to 800 nm. Moreover, the nanoparticles solutions were analyzed to obtain the Surface Plasmon Resonance (SPR) band, which indicates the formation of silver nanoparticles, according to equation (1) [16, 17].

where: Ψ represents the formation of AgNPs; Absmax is the maximum absorbance obtained; λmax is the wavelength at maximum absorption; and FWHH is the full width at half-height.
2.3.2. Physicochemical stability of the AgNPs
The physicochemical stability of the AgNPs was evaluated simulating room temperature (25 °C) and refrigerating temperature (6 °C). Samples were stored in 30 ml amber bottles and the analysis of particle size, polydispersity index and zeta potential were evaluated for 90 days (1, 30, 60 and 90 days). Using Nano-ZS90 zeta-plus in 173° (Malvern Instruments Ltd, Malvern, UK), sample of AgNPs were measured by Dynamic Light Scattering (DLS) technique. Each sample was analyzed in triplicate to obtain the average particle size (Z-ave, nm), polydispersity index (PI) and zeta-potential (ζ, mV).
2.3.3. AgNPs morphology
Nanoparticles morphology was evaluated by Transmition Electron Microscopy (TEM) (JEOL, model JEM-1011, Tokyo, Japan) operating at 70 kV. Solutions with nanoparticles (5 μl) were placed on carbon-coated copper grids (200 mesh). Grids were observed under the microscope after having been dried at room temperature.
2.3.4. Antibacterial activity using broth microdilution assay
Biosynthesized AgNPs in different pH were initially diluted in deionized water, and adding to the Miller Hinton broth in equal proportions for all dilutions (10 μl of sample and 90 μl of medium). AgNPs were diluted in sterile ultrapure water (MiliQ®) to the concentrations of 40, 60, 80 and 100 μl mL–1. In each well were added 100 μl of nanoparticles dilution and 5 μl of bacteria (107) obtaining a final bacterial concentration of 105 CFU ml−1. The inoculated dilution plates were incubated at 35 °C for 16–20 h to Escherichia coli and Staphylococcus aureus; and in case of Bacillus cereus the time necessary to complete was 24 h. Bacterial growth in the wells was observed after incubation by turbidity. The presence of turbidity indicated bacterial growth and non-turbidity indicated growth inhibition at the concentration tested. All the measurements were compared to growth control wells without nanoparticles, and the results were expressed as Minimum Inhibitory Concentration (MIC, μg ml–1).
2.3.5. X-ray photoelectron spectroscopic (XPS) of AgNPs
X-ray Photoelectron Spectroscopic analyzes for AgNPs was conducted using a Specs Phoibos150 HSA3500 hemispheric spectrometer. Firstly, the suspension of nanoparticles synthesized at pH 9 was dried under vacuum and then analyzed. The areas of the curves were determined using a Gaussian function.
2.4. Statistical analysis
All the results obtained were submitted to analysis of variance (one-way ANOVA) and Tukey's test (p < 0.05), using Statistica software (version 10.0, StatSoft Inc., Tulsa, OK, EUA).
3. Results and discussion
3.1. Essential oil characterization
The characterization of essential oils by GC/MS is showed in table 1. 17 different compounds were observed in thyme essential oil, and 12 compounds (91.21%) were identified. The majority compounds identified were borneol (33.71%) and α-terpineol (31.86%). Other minorities' compounds were identified, as α-pinene (3.06%), camphene (5.46%), carvacrol (4.61%), and caryophyllene (3.40%). Satyal et al [18] studied the essential oil of thyme of different places, and revealing at least 20 different types of monoterpenoids on essential oil composition. In general, the essential oil composition presents a great variation between the places of collection: in France, the composition was dominated by linalool (76.15%), linalyl acetate (14.26%), β-caryophyllene (2.27%), camphor (1.79%), and camphene (1.17%). In Jablanicki, Serbia, the essential oil was rich in geraniol (59.75%), geranyl acetate (16.72%), linalool (7.15%), β-caryophyllene (3.6 7%) and geranyl propionate (1.26%). The essential oil from Serbia presented cis-sabinene hydrate (30.77%), trans-sabinene hydrate (4.98%), terpinene-4-ol (9.50%), linalool (7.89%), γ-terpinene (4.58%), and myrcene (4.09%) [18].
Table 1. Chemical characterization of thyme essential oil by GC/MS.
| Compounds | Chemical structure | RIc | RIl | % |
|---|---|---|---|---|
| α-pinene |

|
935 | 933 | 3.06 |
| camphene |

|
952 | 953 | 5.46 |
| p-cymene |

|
1027 | 1028 | 0.85 |
| limonene |

|
1032 | 1032 | 0.57 |
| linalool |

|
1102 | 1101 | 2.45 |
| borneol |

|
1176 | 1175 | 33.71 |
| terpinen-4-ol |

|
1184 | 1184 | 2.12 |
| α-terpineol |

|
1199 | 1198 | 31.86 |
| bornyl acetate |

|
1289 | 1289 | 2.50 |
| thymol |

|
1292 | 1292 | 0.62 |
| carvacrol |

|
1300 | 1300 | 4.61 |
| caryophyllene |

|
1428 | 1430 | 3.40 |
| Total identified | — | — | — | 91.21 |
| Total unidentified | — | — | — | 8.79 |
RIc = Retention index of calculated, RIl = Retention index of literature, % = percentage of compounds in the essential oil.
3.2. UV–vis spectroscopy
UV–vis spectroscopy is the method widely used to the characterization of silver nanoparticles, and through this analysis is possible to confirm the synthesis of nanoparticles, with the correlation between the peak observed at a given wavelength and the average nanoparticle diameter (table 2). In addition, through the width of the SPR bands, it is possible to verify the dispersion of nanoparticles [19]. Through SPR bands, was possible to confirm that nanoparticles were formed at the different pH (figure 1). The wavelength peaks were between 415 and 440 nm, characterizing particles with average diameter between 35 and 80 nm, as described by Solomon et al [19]. Moreover, the size distributions of the nanoparticles were studied as a function of different pH and its formation was confirmed with the yellow/brownish color. Evaluation the figure 1 was possible to observe an increase in particle formation with pH increasing, and the highest particle formation intensity was at pH 10.
Table 2. Size correlation of silver nanoparticles and its respective wavenumber by UV–vis spectroscopy.
| Particle size (nm) | Wavenumber (nm) |
|---|---|
| 5–10 | 380–390 |
| 10–14 | 395–405 |
| 35–50 | 420–435 |
| 60–80 | 438–450 |

Figure 1. SPR bands obtained to AgNPs biosynthesized with thyme essential oil.
Download figure:
Standard image High-resolution image3.3. Physicochemical stability of the AgNPs
The physicochemical stability of the biosynthesized AgNPs were analyzed at 25 °C simulating room temperature and 6 °C simulating refrigeration temperature, during 90 days of storage, and zeta potential, polydispersity index and particle size was evaluated, as shown in table 3.
Table 3. Physicochemical stability of AgNPs biosynthesized with thyme essential oil in pH 7, 8, 9 and 10, during 90 days of storage room (25 °C) and refrigerate (6 °C) temperature.
| Samples | Storage time | Temperature | Zeta potential (ζ, mV) | Polydispersity Index (PI) | Particle size (Z-ave, nm) |
|---|---|---|---|---|---|
| 1 day | — | 30.13 ± 2.95a | 0.33 ± 0.06a | 75.97 ± 2.14ab | |
| 30 days | 6 °C | 29.57 ± 1.65a | 0.24 ± 0.03a | 76.16 ± 1.20ab | |
| 25 °C | 32.03 ± 4.19a | 0.25 ± 0.02a | 73.50 ± 3.73a | ||
| AgNPs pH 7 | 60 days | 6 °C | 24.47 ± 4.97a | 0.23 ± 0.02a | 80.55 ± 6.06ab |
| 25 °C | 24.33 ± 5.35a | 0.23 ± 0.04a | 78.97 ± 2.75ab | ||
| 90 days | 6 °C | 27.30 ± 5.55a | 0.34 ± 0.09a | 84.52 ± 4.50b | |
| 25 °C | 29.4 ± 1.75a | 0.26 ± 0.03a | 79.74 ± 0.93ab | ||
| 1 day | — | 30.53 ± 1.91a | 0.30 ± 0.08a | 76.36 ± 2.59a | |
| 30 days | 6 °C | 32.33 ± 1.97a | 0.22 ± 0.02a | 77.38 ± 4.96a | |
| 25 °C | 34.17 ± 2.65a | 0.23 ± 0.01a | 78.62 ± 6.02a | ||
| AgNPs pH 8 | 60 days | 6 °C | 32.07 ± 0.75a | 0.21 ± 0.02a | 83.86 ± 5.36a |
| 25 °C | 33.97 ± 3.79a | 0.22 ± 0.04a | 80.90 ± 5.06a | ||
| 90 days | 6 °C | 29.40 ± 3.73a | 0.29 ± 0.12a | 83.69 ± 4.75a | |
| 25 °C | 30.13 ± 1.53a | 0.22 ± 0.02a | 83.81 ± 5.58a | ||
| 1 day | — | 34.63 ± 1.18a | 0.23 ± 0.05a | 85.35 ± 3.06a | |
| 30 days | 6 °C | 34.20 ± 1.23a | 0.21 ± 0.03a | 81.97 ± 6.88a | |
| 25 °C | 34.30 ± 1.15a | 0.22 ± 0.0.2a | 84.32 ± 6.54a | ||
| AgNPs pH 9 | 60 days | 6 °C | 33.83 ± 2.14a | 0.20 ± 0.01a | 85.74 ± 6.16a |
| 25 °C | 30.37 ± 1.68a | 0.18 ± 0.03a | 86.32 ± 1.75a | ||
| 90 days | 6 °C | 32.77 ± 0.75a | 0.21 ± 0.02a | 86.38 ± 6.26a | |
| 25 °C | 31.97 ± 3.42a | 0.21 ± 0.03a | 90.98 ± 1.13a | ||
| 1 day | — | 36.56 ± 0.65a | 0.23 ± 0.01a | 82.33 ± 4.07a | |
| 30 days | 6 °C | 35.07 ± 2.02a | 0.22 ± 0.02a | 81.90 ± 4.70a | |
| 25 °C | 37.80 ± 2.45a | 0.22 ± 0.01a | 84.58 ± 3.44a | ||
| AgNPs pH 10 | 60 days | 6 °C | 35.30 ± 0.30a | 0.23 ± 0.02a | 84.54 ± 4.10a |
| 25 °C | 35.6 ± 1.77a | 0.19 ± 0.03a | 85.06 ± 2.80a | ||
| 90 days | 6 °C | 34.57 ± 2.81a | 0.23 ± 0.02a | 86.97 ± 2.35a | |
| 25 °C | 33.20 ± 1.91a | 0.23 ± 0.01a | 85.80 ± 3.71a |
Results are expressed as means ± standard deviations (n = 3). Different letters in the same column demonstrate a statistically difference by Tukey's test (p < 0.05).
Zeta potential is an indicative of colloidal suspension stability, controlling the behavior of nanoparticles mainly during the storage period, indication changes in the surface and repulsive force that exists between particles [20]. Zeta potential greater than ± 30 mV demonstrates that the colloidal suspensions are stable due to repulsion between particles, preventing the aggregation [20, 21]. In the current study, the presence of essential oil on the AgNPs surfaces act as a steric stabilizer, preventing the nanoparticles agglomeration. Evaluating the data obtained (table 3), there was no significative difference (p > 0.05) during the 90 days of storage under the temperatures studied, and the zeta potential values were very close to the theoretical stability range (30 mV), indicating that particles were stable throughout the storage period.
The polydispersity index (PI) is a parameter used to verify the homogeneity in the particle size distribution, and PI values lower than 0.3 guarantees the stability of colloidal dispersion, without the formation of agglomerates or precipitates [15]. The PI values obtained indicated that all silver nanoparticles in different pH presents a homogeneous size distribution in the solutions, and did not present significant difference (p > 0.05) during the temperature and storage period evaluated. Moreover, during the storage period it is possible an increase of the particle size, affecting their stability, and evaluating the particle diameter it is possible to evaluate the tendency of aggregation [22]. The results obtained by the average particle diameter (table 3) demonstrate the efficiency of the method used due to the small diameter observed (less than 90 nm) remaining constant during the 90 days of storage at room (25 °C) and refrigerate (6 °C) temperature. Nanoparticles at pH 7 showed significant differences (p < 0.05) in the average diameter during the storage period for the two temperatures studied, indicating a possible aggregation of the particles.
Silver nanoparticles synthesized with thyme essential oil showed a great stability evaluating the particle size, polydispersity index and zeta potential. There was generally no significant difference during the 90 days of storage, and there was no significant difference between room (25 °C) and refrigerate (6 °C) temperature.
3.4. Nanoparticles morphology
Figure 2 presents the AgNPs morphology, obtained by Transmission Electron Microscopy (TEM). It was possible to observe particles with predominance of spherical shapes in AgNP pH 7, AgNP pH 8 and AgNP pH 9, however AgNP pH 10 presented rod-shaped particles. The difference in the shape at pH 10 may be one of the reasons for the larger SPR band observed for this sample at figure 1. Moreover, it was possible to observe an organic layer between the particles, which is attributed to the presence of thyme essential oil on the surface of AgNPs. This layer is responsible for stabilization, preventing the agglomeration and precipitation [23].
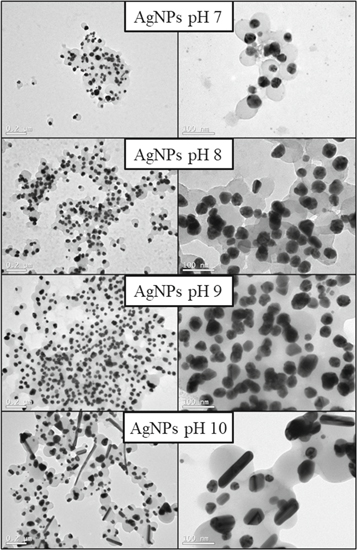
Figure 2. Nanoparticles morphology obtained by Transmission Electron Microscopy (TEM).
Download figure:
Standard image High-resolution imageMoreover, the nanoparticles diameter was analyzed using Quantikov Image Analyzer and Image J software. The particle size increased with increasing the solution pH, and the nanoparticles at pH 7 presented the smallest average size observed, and at pH 10 the largest average size (table 4). Through the values obtained by DLS, it was observed that the average particle diameter was around 90 nm for all pH tested (table 3), however, the results obtained by Quantikov Image Analyzer was lower (table 4). This fact can be explained because the measurement of the hydrodynamic radius by DLS technique does not correspond to the actual particle size, but rather to the effective diameter along with the organic layer that coats the particles. Thus, the results obtained by TEM can be considered more accurate than those obtained by DLS [23].
Table 4. Particle size obtained by Quantikov Image Analyzer of AgNPs biosynthesized with thyme essential oil.
| Sample | Average particle size (nm) |
|---|---|
| AgNPs pH 7 | 26.96 ± 8.11b |
| AgNPs pH 8 | 41.83 ± 6.21ª |
| AgNPs pH 9 | 47.80 ± 10.97ª |
| AgNPs pH 10 | 54.46 ± 13.97ª |
Results are expressed as means ± standard deviations (n = 3). Different letters in the same column demonstrate a statistically difference by Tukey's test (p < 0.05).
3.5. Antibacterial activity of the biosynthesized AgNPs
The antibacterial activity of nanoparticles was evaluated by broth microdilution assays to determine the Minimum Inhibitory Concentration (MIC) (table 5). AgNP pH 7, demonstrated high antibacterial activity against Escherichia coli, a gram negative bacterium with a thin layer of peptidoglycan, requiring a minimum concentration of 60 μg mL–1 of nanoparticles for microbial inhibition when compared with AgNP pH 8 and AgNP 9 (80 μg ml–1). At pH 10 there was no inhibition, reinforcing the relationship of greater effectiveness in antibacterial activity with smaller particle size. In addition, the predominance of spherical shapes at pH 7, 8 and 9 was a predominant factor to the antibacterial activity; and at pH 10 (predominance of rod shapes) was unable to inhibit microbial growth. For Staphylococcus aureus the MIC was 40 μg mL–1, showing higher antibacterial activity, indicating an inhibitory potential at low concentrations, even for bacteria with thick peptidoglycan layer, as is the case of gram-positive. In this case, the ratio format and size was not equivalent to the results obtained for Escherichia coli and there was inhibition even at pH 10. Moreover, evaluating the data for Bacillus cereus, there was no inhibition at any of the tested concentrations, which is probably attributed to the higher resistance of the microorganism due to spore formation, hindering the action of nanoparticles.
Table 5. Minimum Inhibitory Concentration (MIC, μg ml–1) of AgNPs biosynthesized with thyme essential oil in pH 7, 8, 9 and 10, against Escherichia coli, Staphylococcus aureus and Bacillus cereus.
| Bacterium | AgNPs pH 7 | AgNPs pH 8 | AgNPs pH 9 | AgNPs pH 10 |
|---|---|---|---|---|
| Escherichia coli | 60 | 80 | 80 | — |
| Staphylococcus aureus | 40 | 40 | 40 | 40 |
| Bacillus cereus | — | — | — | — |
3.6. XPS of the biosynthesized AgNPs
The XPS analysis allowed a deeper insight into the surface composition of the AgNPs biosynthesized at pH 9 (figure 3). Bioactive molecules in the thyme essential oil, presented good reducing capacity, and at the time that they come in contact with Ag+ ions (from AgNO3), transfer its π electrons and display Ag+ to Ag0. This reaction will be explained in the Topic 3.7. The most prominent signal in the XPS spectrum is Ag 3 s which consists of two components, with binding energies of 368.12 eV and 374.18 eV corresponding respectively to Ag0 3d5/2 and 3d3/2 orbits (metallic silver) [24]. The deconvolution of the Ag (3d) doublet revealed asymmetric peak shape. The energies at 370.5 and 376.1 eV are observed at the highest binding energy side of each component of the rotating orbit of the Ag 3d metal. The binding energy at 370.5 eV have line designation 3d5/2 and 376.1 eV 3d3/2 attributed to Ag+ [25]. The deconvolution revealed the presence of metallic silver in greater proportion, in a ratio of about 3/1 of Ag0/Ag+, and the presence of Ag+ can be attributed to a small proportion of oxide on the nanoparticle surface.

Figure 3. XPS spectrum of AgNP biosynthesized with thyme essential oil at pH 9.
Download figure:
Standard image High-resolution image3.7. Chemical mechanism of biosynthesized AgNPs
Biosynthesized silver nanoparticles can be explained according to the mechanism proposed (figure 4). The first step of the reaction is the chemical balance of sodium hydroxide (NaOH  Na+ + OH–) and silver nitrate (AgNO3
  Ag+ + NO3–). Moreover, we presented in table 1 that borneol was the compound with high concentration in the essential oil of thyme, with 33.71%, and the chemical mechanism was created based on this compound. Thus, the reduction reaction Ag+ → Ag0 occurs simultaneous to the donation of a proton (H+) from borneol; and the sodium (Na+) stabilize the borneol negatively charged by electrostatics. In general, the reaction presents equilibrium in the electrons donation, due to the excess of essential oil. Silver-zero (Ag0) is not considered a nanoparticle, however, a sequence of Ag0 agglomeration, called as nucleation (I) and (II) form a nanoparticle. This nanoparticle may be stabilized by its crystalline structure and by the presence of essential oil in the solution of AgNPs after the synthesis.

Figure 4. Chemical mechanism to the biosynthesized synthesis of silver nanoparticles using borneol as the reducing agent.
Download figure:
Standard image High-resolution image
4. Conclusion
In the current study silver nanoparticles were biosynthesized by an eco-friendly method, using essential oil of thyme. In general, the biosynthesis of silver nanoparticles in pH 7 until 10 is attributed to the presence of 17 different compounds in the essential oil, mainly borneol and α-terpineol. Through SPR bands, was possible to confirm that nanoparticles were formed at the different pH. The stability of silver nanoparticles was confirmed by particle size, polydispersity index and zeta potential, during 90 days of storage on 6 and 25 °C. AgNPs presented homogeneous size distribution, and zeta potential values very close to the theoretical stability range. X-ray Photoelectron Spectroscopic analysis was possible confirm the presence of crystalline silver nanoparticles. Moreover, nanoparticles presented spherical shapes with high antibacterial activity against Escherichia coli and Staphylococcus aureus, suggesting an application as an antibacterial agent.
Acknowledgments
Authors acknowledge to CAPES (Coordenação de Aperfeiçoamento de Pessoal de Nivel Superior), CNPQ (Conselho Nacional de Desenvolvimento Cientifico e Tecnológico), FAPESC (Fundação de Apoio a Pesquisa e Inovação do Estado de Santa Catarina), LCME/UFSC (Laboratório Central de Microscopia Eletrônica—Universidade Federal de Santa Catarina) and EPAGRI/SC (Empresa de Pesquisa Agropecuária e Extensão Rural de Santa Catarina).