

Abstract
We studied exchange bias and exchange spring effects in magnetic bilayer thin films of Fe and CrN grown by molecular beam epitaxy. First, the relationships between exchange bias, coercivity, and blocking temperature and the Fe and CrN layers thicknesses are studied. Second, the exchange spring effect is observed and studied in all samples. The exchange spring breaks free at critical applied field strengths while creating planar domain walls at lower applied fields. First-principles calculations are performed to understand the magnetic interactions between the Fe and CrN layers at their interfaces. The calculations are key to understanding the experimental observations.
Export citation and abstract BibTeX RIS
1. Introduction
Since the discovery of exchange bias in 1957 in ferromagnet(FM)/antiferromagnet(AFM) bilayer particles [1], a series of extensive studies in many systems have been carried out in order to understand its basic mechanism. Despite lacking a complete understanding [2], exchange biasing has found its place in spintronics applications [3, 4], and new advances are still being made today. For example, recently, Zilske and co-workers reported the discovery of giant perpendicular exchange bias fields in FeCoB/manganese nitride (MnN) bilayer systems in which the exchange field can be as high as 3600 Oe with a coercive field of 350 Oe at room temperature [5]. Such exciting developments stimulate further investigations looking into the properties of ferromagnetic/antiferromagnetic nitride bilayer systems.
Exchange biasing occurs when a sample containing a shared interface between AFM and FM materials is cooled through TB (TB is the blocking temperature, which is typically less than the Néel temperature ( ) of the AFM) under an applied magnetic field (H). It shifts the center of the magnetization (M) versus applied magnetic field (H) loop along the field axis by HE (exchange bias field), and along the magnetization axis by VMS (vertical magnetization shift).
Another related interfacial phenomenon is the exchange spring effect, which is rarely seen in a FM/AFM systems [6] although it is commonly observed in bilayer and multilayer soft-FM/hard-FM systems [7–9] and soft-FM/hard-ferrimagnet systems [10]. The idea is that at the interface between AFM and FM materials, their spins are coupled. Magnetization of the sub-lattice of the AFM is pinned along its easy axis, and it shows little or no response to an externally applied magnetic field depending on the field strength and direction. Whereas, the magnetic moments of the FM layer do respond to the applied magnetic field. When a magnetic field applied in-plane (but not along the easy axis) rotates the magnetization direction of the FM layer away from the easy axis, due to interfacial coupling, the spins of the FM layer force the spins of the coupled AFM layer to also rotate toward the applied field direction, resulting in the creation of a planar domain wall [6, 10].
Although exchange bias and exchange spring behaviors have been investigated for many different AFM/FM systems, much less is known about these phenomena in the case where transition metal nitrides are used. Yet, transition metal nitrides are important technological candidates for spintronic, nanoelectronic, and optoelectronic applications. For example, Fe4N shows a lot of promise as a potential candidate for use in magnetic tunnel junctions [11, 12]. It produces large inverse current-induced magnetization switching [11] and large inverse tunneling magnetoresistance [12]. We recently investigated structural and magnetic phase transitions in MBE-grown CrN thin films and determined that CrN thin films go through a magnetic transition from paramagnetic at room temperature to antiferromagnetic at low temperatures with a sharp, first-order phase transition and a Néel temperature of (270  2) K or (280
  2) K (for two different CrN films) [13]. The strongly magnetic properties of various transition metal nitrides have great potential for FM/AFM bilayer systems composed of TM nitride layers. Such systems could offer many technological advantages, including strong magnetic anisotropy, high temperature stability, corrosion resistance, and many more.
In this paper, we present our experimental results for exchange bias and exchange spring effects in Fe/CrN bilayer thin films. We report the effects of the AFM and FM layer thicknesses on the exchange bias field (Heb, blocking temperature (TB), and coercivity (HC) of the films. We examine the temperature dependence of the exchange spring effect. In addition to the experimental data, we also report spin-polarized first-principles calculations for different models consisting of Fe/CrN and relate the results back to the experiments in order to infer the mechanism behind these effects in this Fe/CrN system.
2. Methods
All bilayer thin films are prepared in a custom designed ultra-high vacuum molecular beam epitaxy (MBE) facility equipped with reflection high energy electron diffraction (RHEED), custom designed effusion cells, rf-nitrogen plasma source, and quartz crystal thickness monitor [14]. The Fe/CrN bilayer films are grown on extensively cleaned MgO (0 0 1) substrates. A non-magnetic Ga layer is used as a capping layer to prevent oxidation of the Fe layer. The substrates are first solvent cleaned ex situ with acetone followed by isopropyl-alcohol, and further cleaned in situ by heating up to 1000  C while exposing to nitrogen plasma flux until streaky RHEED patterns are obtained.
The Ga, Fe, and Cr fluxes are measured using a quartz crystal thickness monitor, and the N flux is known by growing GaN (0 0 0  ) near the crossover point from Ga-rich to N-rich growth conditions in our previous experiments [15]. Ga, Fe, and Cr fluxes are obtained from thoroughly degassed effusion cells, and nitrogen flux is supplied by an rf-plasma generator. CrN layers are grown under nitrogen rich conditions at 650
  30 °C without buffer layers. We tried to prevent Cr–Fe and Fe–Ga alloys at the interfaces by growing Fe and Ga layers at room temperature (RT). The entire film growth is monitored by RHEED.
Magnetic characterizations are carried out using a LakeShore Cryotronics model 7400 vibrating sample magnetometer (VSM). The system can measure magnetic moments of 1.0 nA m2, and accuracy in the magnetic field is 0.01 mT. Hysteresis loops for the films are recorded in fields ranging from −40 to +40 mT, and temperatures ranging from 77 to 300 K with an averaging time of 18 s per point. We repeated the same experiments for fields along both [1 0 0]MgO and [1 1 0]MgO and analyzed the data for each direction separately.
We employed spin-polarized first-principles total-energy calculations to investigate the Fe incorporation in the CrN (0 0 1) surface, and the magnetic coupling between the CrN and Fe layers at the CrN/Fe interface. Calculations also account for the periodic density functional theory as implemented in the PWscf code of the quantum espresso package [16]. The ion-electron interactions are treated according to the pseudopotential method with Vanderbilt ultrasoft pseudopotentials [17]. Exchange-correlation energy is modeled with the local density approximation in the Perdew–Zunger (PZ) correction functional [18] plus Hubbard Correction (LDA + U) [19] with U =4 eV employing the simplified version of Cococcioni [20]. Electron states are expanded in plane waves with a cutt-off energy of 30 Ry. We apply the supercell method to deal with the surface. This is composed of a slab with eight atomic layers and a vacuum gap of width greater than 15  .
.
The Brillouin zone integration has been done using a Methfessel–Paxton [21] smearing of 0.01 Ry and special k-points grid of 10  10
10  1 [22]. We used the surface formation energy (SFE) formalism following Guerrero-Sanchez et al's methodology [23] for finding the most stable structures. In order to apply the SFE formalism, we consider thermodynamic equilibrium between the surface and the bulk. This implies that:

with  and
and  where
where  is the chemical potential of the ith chemical species and
  is the heat of formation of bulk CrN. Then, we can write the SFE as:

where Eslab is the total energy of the system and ni is the number of atoms of the ith species.
We plot the SFE as a function of the chemical potential from N-rich conditions  and
and  to Cr-rich conditions
  and
and  . According to the formalism, the most stable models exhibits the lowest energy values.
We modeled bulk Cr employing the AFM BCC structure and bulk Fe with the FM BCC structure. The isolated N2 molecule is simulated in a cube of 20  . The value obtained for the heat of formation is 1.43 eV, in good agreement with the experimental value of 1.24 eV [24].
3. Results and discussion
Structural analysis of CrN and Fe layers are carried out using RHEED and x-ray diffraction (XRD). Shown in figure 1(a) is a characteristic RHEED pattern of CrN (0 0 1) surface taken along [1 1 0]CrN. The pattern is recorded after cooling down a 37 nm thick CrN sample from growth temperature to RT, where seven primary streaks are visible in the zeroth-order Laue ring; two side streaks are less bright as compared to the five central streaks. The streaky pattern is indicative of a good quality sample. The RHEED pattern related to the Fe layer is shown in figure 1(b), which is recorded after a 53 nm Fe layer is deposited on the CrN layer at RT. The pattern is spotty with some faint rings, which represents rough epitaxial growth with a fraction of polycrystallinity. Using the average streak spacing, the in-plane lattice constants of the 53 nm Fe and 37 nm CrN (sample S75) are found to be 2.89  and 4.15
  , respectively; these values are in good agreement with known lattice parameters for Fe (2.87
  [25]) and CrN (4.16
  [26]). The primitive lattice vector of CrN is 2.93
  , which is 2.1% larger than the lattice constant of the BCC unit cell of Fe, which is 2.87
  . The RHEED patterns reveal that the epitaxial relationship between Fe, CrN, and MgO is [1 0 0]Fe
  [1 1 0]CrN
  [1 1 0]MgO.

Figure 1. (a) Streaky RT RHEED pattern for 37 nm thick CrN layer, along [1 1 0]CrN; (b) spotty RT RHEED pattern with faint rings, after deposition of 53 nm Fe layer, along [1 1 0]CrN; (c) XRD pattern showing 002 peaks of MgO, CrN, and Fe (inset shows a zoomed-in view of the 002 peak of CrN).
Download figure:
Standard image High-resolution imageAn XRD spectrum of a Fe/CrN/MgO(0 0 1) film is shown in figure 1(c), where only 002 peaks of MgO, CrN, and Fe can be seen in a range of 10°–90°. A zoomed-in view of the 002 peak of CrN is shown in the inset. Absence of other peaks indicates that the growth is predominantly epitaxial. The measured out-of-plane lattice constants of MgO, CrN, and Fe are 4.212, 4.150, and 2.841  , respectively, which are consistent with the reported values, 4.21
  , [27] 4.16
  , [26], and 2.87
  , [25] respectively.
We choose different Fe and CrN layer thicknesses to examine the effect of the layer thickness on HE, TB, exchange spring effect, and HC. The layer thicknesses and lattice constants are given in the table 1; the layer thickness is measured by x-ray reflectivity (XRR) and the lattice constant by XRD. The XRR experiment was carried out at the National Center for Neutron Research at NIST using a Bruker D8 x-ray diffractometer6, and the Refl1D software [28] was used to fit the data. Based on XRR calibration of flux rates using S75, the growth rates and layer thicknesses were determined for the other samples (S73 and S74).
Table 1. Sample layer thicknesses for Ga, Fe, and CrN layers and their respective, measured out-of-plane lattice constants for the three Ga/Fe/CrN samples in this study.
| Sample |  (nm) (nm) |
 (nm) (nm) |
 (nm) (nm) |
 ( ( ) ) |
 ( ( ) ) |
|---|---|---|---|---|---|
| S73 | 151  2 2 |
53  2 2 |
3  2 2 |
4.150  0.002 0.002 |
2.835  0.008 0.008 |
| S74 | 151  2 2 |
106  2 2 |
3  2 2 |
4.148  0.002 0.002 |
2.844  0.008 0.008 |
| S75 | 37  2 2 |
53  2 2 |
3  2 2 |
4.150  0.002 0.002 |
2.841  0.008 0.008 |
Samples S73 and S74 share the same CrN layer thickness, while the Fe layer in S73 is half as thick as the Fe layer in S74. On the other hand, S75 has the same Fe layer thickness as S73, but about  thinner CrN layer. The Ga capping layer is 3 nm thick in all samples. The lattice constants are all very close to each other, and often fall within one sigma; therefore, the quality of the samples should be consistent.
For exchange bias studies, the films are first field cooled under 1.5 T applied in-plane field along [1 0 0]MgO from RT to 77  2 K, and the data is then acquired under a field ranging from −40 to +40 mT. This procedure is also repeated for [1 1 0]MgO. The sample is found biased in both azimuthal directions. Hysteresis loops for S75 recorded along [1 0 0]MgO at 300 K and at 79 K are shown in figure 2. The loop recorded at 300 K is symmetrical about origin O, whereas the loop recorded at 79 K is symmetrical about origin O
 which is negatively shifted along the field
  -axis by 0.73 mT and negatively along the magnetization
  -axis by 6.7%. Exchange bias only at low temperature as seen in figure 2 is consistent with our previous finding of CrN being antiferromagnetic only below a Néel temperature of 280 K [13, 29].
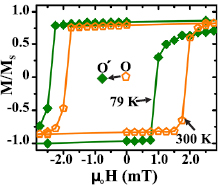
Figure 2. VSM measured magnetic hysteresis loops for sample S75 recorded along [1 0 0]MgO at 300 K and at 79 K. Origins of the two loops labeled as O (300 K) and O (79 K).
Download figure:
Standard image High-resolution imageShown in figure 3(a) is a plot of HE recorded along [1 0 0]MgO as a function of sample temperature. For every data point, the sample is first cooled down from RT to a targeted temperature under 1.5 T applied magnetic field. Then a hysteresis loop is recorded, after which the sample is warmed up to RT. The observed exchange bias for S73 and S75 is similar and is larger than that of S74, which could be due to the Fe layer because the Fe layer thicknesses for S73 and S75 are the same and are half as thick as for S74. It is reasonable for exchange bias to be suppressed for thicker FM layers because it is an interfacial phenomenon. The exchange bias field HE is saturated for S73 from 150 K to 250 K and sharply drops at 272  2 K, only about 8 K smaller than the CrN
  . Similarly, HE for S75 is stable from 79 to 150 K and shows a sharp drop at 187
  2 K, 93 K smaller than the CrN
  . There is a small bump in S74 data at 230
  2 K. The CrN layer thickness for S73 and S74 is
  larger than for S75. These results suggest that a thinner CrN layer yields a smaller blocking temperature.
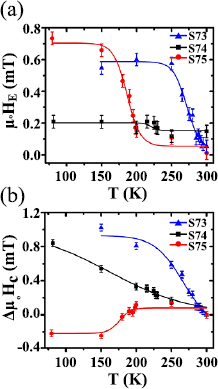
Figure 3. (a) HE as a function of temperature for samples S73, S74 and S75. The blocking temperature for each sample is marked; (b) HC as a function of temperature for samples S73, S74 and S75. The HE and HC data shown here is for magnetic field along [1 0 0]MgO.
Download figure:
Standard image High-resolution imageThe change in coercivity 
![$H_{C} = [H_{C}(T)-H_{C}(300~{\rm K})]$](https://content.cld.iop.org/journals/0022-3727/53/12/125001/revision2/dab6147ieqn066.gif) versus T for the three samples is presented in figure 3(b). In S73,
versus T for the three samples is presented in figure 3(b). In S73,  HC gradually decreases from 1.02 mT to 0.59 mT (42% loss) as the sample warms up from 150 K to 250 K followed by a sharp drop at TB and reaches to 0.10 mT (90% loss) at 285 K. The
  HC in S74 decreases linearly from 0.84 mT at 81 K to 0 mT at 300 K. Whereas
  HC in S75 is quite interesting and can be explained by dividing the curve into four sections. In the first section from 79 K to 150 K, the
  HC gradually decreases from −0.22 to −0.25 mT. While in the second section from 150 K to 200 K, it steadily increases from −0.25 to 0.11 mT. Then in the third section, it attains its highest value of 0.14 mT at 250 K, and in the fourth section it drops to 0 mT at 300 K. A peak in HC has also been observed in other systems experimentally [30, 31] as well as theoretically [32] and can be observed when TB is approached from below, which is believed to be due to a rapid loss in the long range spin correlation in the AFM layer at TB, and the magnetization reversal of the FM can then realign more spins in the AFM layer [33].
A hysteresis loop acquired for S75 along [1 0 0]MgO at 250 K is shown in figure 4(a). This loop is identified to be related to the exchange spring effect. Loops consisting of three sub-loops are observed in all of our films only when the M − H data is acquired along [1 0 0]MgO. Data of the field sweep from +H to −H, and from −H to +H, is represented by open circles, and open squares, respectively. In one cycle, the two magnetization curves cross each other at magnetic fields N1 and N2, thus forming three sub-loops: one vertical loop (VL) and two horizontal loops (HL1 & HL2). The vertical loop is related to energy stored in the system while the horizontal loops represent energy loss in the system. When the sample temperature rises, the area of the two loops HL1 and HL2 increase, and the cross over points N1 and N2 shift to smaller values.
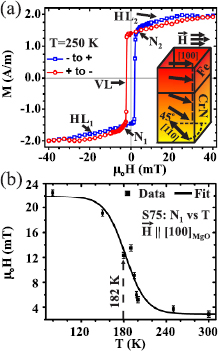
Figure 4. (a) Magnetic hysteresis showing the exchange spring effect, in which three subloops (VL, HL1, and HL2) are identified. Inset shows the formation of a planar domain wall at the Fe/CrN interface; (b) N1 versus T for sample S75 showing the exchange spring transition point Tes at 182  6 K.
6 K.
Download figure:
Standard image High-resolution imageA plot of N1 versus T is shown in figure 4(b), which is fit using a Boltzmann model as  , where A1, A2, and
  are constants. We see that N1 goes through a sharp transition at Tes = 182
  6 K, consistent with the blocking temperature of S75. The matching of Tes with TB shows that the exchange spring forms at the Fe/CrN interface (and not at the Fe/Ga interface).
One can also notice that the magnetization curve represented by the open squares initially increases from 1.60 A m−1 at 5.0 mT to 1.98 A m−1 at 25 mT followed by a drop to 1.90 A m−1 at 35 mT, and similar behavior can be seen in the negative magnetic field side in the curve represented by the open circles. The easy axes of magnetization of Fe (not shown) and CrN are parallel to [1 1 0]MgO [13]. The magnetic field applied along [1 0 0]MgO rotates the spins of the Fe layer gradually towards [1 0 0]MgO, and due to the interfacial coupling, the Fe spins force the coupled spins of CrN to rotate, which creates a planar domain wall schematically depicted in the inset of figure 4(a). These observations are consistent with the reports of exchange spring formation in Co/NiO bilayer thin films [6]. The interfacial coupling between Fe and CrN cannot hold the strain produced by the applied magnetic field, and at 25 mT the interfacial coupling breaks free, allowing the interfacial spins to relax back, thus resulting in a drop in the magnetization.
To understand the magnetic coupling between Fe and CrN layers at their mutual interface, we performed first-principles total-energy calculations with LDA + U (U =4 eV) for a few CrN (0 0 1) and Fe incorporated CrN (0 0 1) surface models. We considered several mixtures of Cr and Fe at the surface, taking into account different magnetic configurations. However, in figure 5(a) we show the SFE for only the six most stable models in a range of chemical potential from N-rich (−1.43 eV) to Cr-rich (+1.43 eV) conditions. Nomenclature of these models is such that model A represents the ideal CrN (0 0 1) surface, while model B has 100% nitrogen vacancies in the 2nd layer. Models A1 and A11 represent 50% and 100% Cr substitution by Fe in the top layer of model A, respectively. Similarly, models B2 and B22 represent 50% and 100% Cr substitution by Fe in the 2nd layer of model B, respectively.

Figure 5. (a) Surface formation energies versus chemical potential are given for the 6 most stable CrN and Fe/CrN models investigated in this study; (b) two CrN models (A and B) and two Fe/CrN models (A11 and B22) are depicted. For both A11 and B22, an in-plane-ferromagnetic-ordered Fe layer is antiferromagnetically out-of-plane-coupled to the adjacent, in-plane-ferromagnetic-ordered CrN layers.
Download figure:
Standard image High-resolution image
For the cases without Fe, calculations show that an ideal CrN (0 0 1) surface (model A) is stable at N-rich and intermediate conditions in a range of chemical potential from −1.43 eV to +1.13 eV. For Cr-rich conditions in a range of chemical potential from +1.13 eV to +1.43 eV, the surface with 100% N vacancies in the 2nd layer (model B) is stable. Among the Fe incorporated models, model A11 is the energetically the most favorable under N-rich conditions (from −1.43 eV to −0.6 eV), whereas model B22 is the most favorable under intermediate and Cr-rich conditions (−0.6 eV to +1.43 eV).
The four most energetically stable models (the 2 without Fe and the 2 with Fe) are shown in figure 5(b). A monolayer of Fe on top of model A or model B is unstable as compared to Fe incorporation into the 1st layer (A11 model) or into the 2nd layer (B22 model). In addition, a magnetized Fe layer has two interesting effects on the magnetic ordering of the neighboring CrN layers: first, it breaks the CrN AFM symmetry by switching the magnetic ordering of the adjacent CrN layers from antiferromagnetic to ferromagnetic; and second, it results in the adjacent Fe and CrN layers being antiferromagnetically coupled.
Based on these theoretical results, we can understand how the Fe layer can be magnetically coupled to the CrN layer in Fe/CrN bi-layer systems, resulting in both exchange bias and exchange spring behavior. Especially, the conversion of the magnetic symmetry of the interfacial CrN layers from antiferromagnetic (in-plane) to ferromagnetic (in-plane), and their antiferromagnetic layer-wise out-of-plane coupling to the Fe layer, can certainly explain how the Fe layer can be exchange biased (pinned) to the CrN layer. These results also explain how the observed magnetocrystalline anisotropy (both Cr and Fe spins' easy axis aligned along [1 1 0]CrN), plus the interfacial coupling, can result in the observed in-plane exchange spring effect.
4. Conclusion
In conclusion, exchange bias and exchange spring effects are found in MBE grown Fe/CrN bilayers for both [1 0 0]MgO and [1 1 0]MgO azimuths. The magnitude of the exchange bias field HE is observed to depend on the Fe layer thickness, with larger HE's for smaller Fe layer thicknesses, whereas the blocking temperature TB is found to depend on the CrN layer thickness, with larger TB's for larger CrN layer thicknesses. Interestingly, the coercive field HC is found to scale with the CrN:Fe layer thickness ratio. For the exchange spring effect, this is only observed while applying fields along the [1 0 0]MgO direction. We expect that significantly smaller Fe layer thicknesses than those reported here could result in significantly larger HE's.
Theoretical calculations show that it is energetically favorable for Fe to substitute for Cr in either the first or second CrN layer, to induce in-plane ferromagnetism within the adjacent CrN (0 0 1) layers, and to create an out-of-plane antiferromagnetic coupling between Fe and CrN layers. Undoubtedly the interfacial magnetism plays an important role in the exchange bias and exchange spring effects seen in these Fe/CrN bilayers. This system can be further studied using polarized neutron reflectivity and x-ray magnetic circular dichroism to further explore the interfacial magnetism in Fe/CrN bilayers.
Acknowledgments
Research supported by the US Department of Energy, Office of Basic Energy Sciences, Division of Materials Sciences and Engineering, under Award # DE-FG02-06ER46317 (SP-STM studies of magnetic and spintronic nitride systems) and Award # DE-SC0001304 (vibrating sample magnetometry measurements). N T thanks DGAPA-UNAM project IN101019 and Conacyt grant A1-S-9070 for partial financial support. Calculations were performed in the DGCTIC-UNAM Supercomputing Center, project LANCAD-UNAM-DGTIC-051. Additional support provided by the Condensed Matter and Surface Sciences Program at Ohio University. The authors would like to acknowledge Dr Julie Borchers, research scientist at the National Institute of Standards and Technology, for help in acquiring XRR data and help in data fitting. The authors would also like to acknowledge Dr Martin E Kordesch for coating MgO(0 0 1) substrates with Ti, and Lianshui Zhao and James C Gallagher for help in VSM experiments.
Footnotes
- 6
Certain commercial equipment, instruments, or materials (or suppliers, or software, ⋯) are identified in this paper to foster understanding. Such identification does not imply recommendation or endorsement by the National Institute of Standards and Technology, nor does it imply that the materials or equipment identified are necessarily the best available for the purpose.