


ABSTRACT
"Extreme ultraviolet (EUV) waves" are large-scale wavelike transients often associated with coronal mass ejections (CMEs). In this Letter, we present a possible detection of a fast-mode EUV wave associated with a mini-CME observed by the Solar Dynamics Observatory. On 2010 December 1, a small-scale EUV wave erupted near the disk center associated with a mini-CME, which showed all the low corona manifestations of a typical CME. The CME was triggered by the eruption of a mini-filament, with a typical length of about 30''. Although the eruption was tiny, the wave had the appearance of an almost semicircular front and propagated at a uniform velocity of 220–250 km s−1 with very little angular dependence. The CME lateral expansion was asymmetric with an inclination toward north, and the southern footprints of the CME loops hardly shifted. The lateral expansion resulted in deep long-duration dimmings, showing the CME extent. Comparing the onset and the initial speed of the CME, the wave was likely triggered by the rapid expansion of the CME loops. Our analysis confirms that the small-scale EUV wave is a true wave, interpreted as a fast-mode wave.
Export citation and abstract BibTeX RIS
1. INTRODUCTION
Expanding annular, large-scale, diffuse extreme ultraviolet (EUV) waves were discovered by the EUV Imaging Telescope (EIT) on board the Solar and Heliospheric Observatory (SOHO) spacecraft, thus they are originally named "EIT waves" (e.g., Moses et al. 1997; Thompson et al. 1998). EUV waves normally emanate from flaring and eruptive active regions and subsequently propagate over significant distances until they become too faint to be detected. In their statistical studies, Biesecker et al. (2002) confirmed that EUV waves were strongly associated with coronal mass ejections (CMEs) and weakly correlated with flares.
Though hundreds of EUV waves were researched with various observations over the past solar cycle, their nature is still strongly debated. EUV waves have been initially interpreted as coronal fast-mode magnetohydrodynamic (MHD) waves triggered by associated CMEs or flares (e.g., Thompson et al. 1999; Wang et al. 2000; Wu et al. 2001; Ofman & Thompson 2002; Long et al. 2008; Gopalswamy et al. 2009; Veronig et al. 2010). The model was originally considered by Uchida (1968), who suggested that chromospheric Moreton waves (Moreton 1960) were the counterparts of fast-mode coronal waves. However, a variety of morphologic and dynamic characteristics of EUV waves led to the model being questioned and alternative models put forward. For example, the EUV wave velocities in some events exceeded the coronal fast-mode speed, but in others they were lower than 100 km s−1 (Wills-Davey et al. 2007; Podladchikova et al. 2010; Warmuth 2010). The major alternative models claim that EUV waves are not waves at all, but rather signatures of large-scale coronal restructuring due to the expanding CMEs, referred as pseudo-waves. One proposition for pseudo-waves is the disk projection of large-scale current shells enveloping the eruptive flux rope of associated CMEs (Delannée et al. 2008). Another suggestion is successive reconnections between expanding CMEs and the favorably oriented surrounding magnetic field (Attrill et al. 2007). Moreover, Chen et al. (2002, 2005) developed the field-line stretching model. Recently, hybrid models were proposed that included both wave and pseudo-wave scenarios (Zhukov & Auchère 2004; Cohen et al. 2009; Liu et al. 2010; Cooper et al. 2011). In addition, EUV waves are also regarded as slow-mode or soliton-like waves (Wills-Davey et al. 2007; Wang et al. 2009). For details of observations and models, please refer to recent reviews (Wills-Davey & Attrill 2009; Gallagher & Long 2010; Warmuth 2010).
For understanding the nature of EUV waves, it is key to get important information on coronal conditions or the initiation and early expansion of the CME, which is limited by EIT's low-cadence and single viewpoint. The limitations were partially overcome with the Extreme Ultraviolet Imager (EUVI; Howard et al. 2008) instruments on board the twin spacecraft of the Solar-Terrestrial Relations Observatory (STEREO; Kaiser et al. 2008), in particular due to their high-cadence, high-sensitivity, and distinct vantage points. With EUVI data, some EUV wave studies supplied strong evidence for a wave model (e.g., Long et al. 2008; Veronig et al. 2008, 2010; Patsourakos & Vourlidas 2009; Gopalswamy et al. 2009). Benefiting from high-resolution observations, small-scale EUV waves can be detected, accompanied by small-scale filament eruptions, EUV dimmings, and CMEs, similar to large-scale waves. The small-scale EUV waves have been studied only in a few cases (Innes et al. 2009; Podladchikova et al. 2010).
We now have a good opportunity to study the physical origin of EUV waves in detail with the high-cadence and sensitivity observations from the Atmospheric Imaging Assembly (AIA) on the Solar Dynamics Observatory (SDO). In this Letter, taking advantage of AIA data combined with EUVI data, we concentrate on a small-scale EUV wave triggered by the eruption of a mini-filament on 2010 December 1.
2. OBSERVATIONS AND DATA ANALYSIS
The EUV wave occurred on the quiet Sun at about 02:54 UT and its eruption center was at about x = 0'', y = 100''. The wave was associated with a mini-filament eruption and a mini-CME, but no recorded GOES flares.
We mainly use the observations from AIA, which has 10 EUV and UV wavelengths, covering a wide range of temperatures. The cadence is up to 12 s, and the pixel resolution is 0 6. The wave is visible in all AIA EUV channels except 304 Å, and strongest in 193 Å. Hence we focus on 193 Å and use a few images from the others. In order to analyze the dynamics of the wave, a time-slice approach is employed, following Liu et al. (2010). The eruption center (x = 0'', y = 100'') is identified as the new "north pole," and a radius of 250'' is chosen. To reduce the artifacts and correctly show the details of the wave, only base difference images are used (Attrill 2010).
In addition, magnetograms from the Helioseismic and Magnetic Imager (HMI), another instrument on the SDO, are chosen to check the magnetic field configuration of the eruption region. The observations from the EUVI Ahead (-A) are utilized to study the evolution of the associated CME in the low corona. To check the filament morphology before its eruption, we use full-disk Hα filtergrams from the Solar Magnetic Activity Research Telescope (SMART; UeNo et al. 2004) at the Hida Observatory of Kyoto University in Japan.
3. RESULTS
3.1. Eruptive Filament and Expanding Loops
The general appearance of the eruption region before the wave event is shown in Figure 1. In HMI magnetograms, a bipole region appeared in the eruption site (panel (a)). Correspondingly, a clear 304 Å filament channel (panel (b)) and a faint Hα filament (panel (c)) could be seen dividing the opposite polarities of the bipole. The filament had a length of about 30'', thus it could be regarded as a mini-filament (Wang et al. 2000; Ren et al. 2008). At about 02:51 UT, the filament was darker and fatter, and its eastern portion had disappeared (panel (d)), which indicated filament activation. Incidentally, the formation and eruption of the filament were intimately associated with the flux emergence and cancelation in the bipole. This issue is not emphasized in this Letter and will be presented in the future.
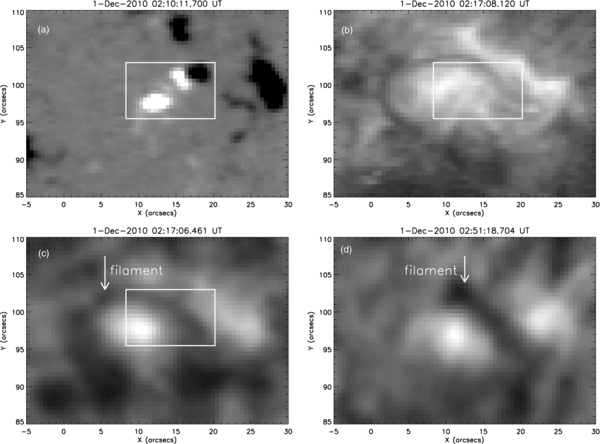
Figure 1. General overview of the eruption region in the HMI magnetogram (a), AIA 304 Å (b), and SMART Hα filtergrams ((c)–(d)) before the wave occurrence. The rectangles denote the bipole region and the arrows indicate the filament.
Download figure:
Standard image High-resolution imageThe eruption was observed at the limb both in the perspectives of the STEREO-A and Behind (-B), but the coronagraphs on the STEREO did not detect any CME during the event, similar to the event presented in Chen & Wu (2011). The reasons for this may be the small scale of the event and the small angular extension of the CME; thus the CME may have been too weak to be captured by coronagraphs. Figure 2 displays the ascent of the eruptive filament in 304 Å and the expansion of the loops in 171 Å. At 02:56:15 UT, the eruptive filament first appeared in the field of view of EUVI-A (panel (a1)). After achieving a maximal altitude (panel (a2)), the filament became fainter and nearly disappeared (panel (a3)). The eruptive filament was jet-like and could be interpreted as the blowout jet defined in Moore et al. (2010). In 171 Å, the loops were very bright at 02:56 UT, especially the loop top. As loops expanded outward, they became fainter and thinner, and were hardly seen except the southern footprints by 03:06 UT. In panel (b2), comparing with the upper panels, the eruptive filament was located in the dimming region (indicated by the thin arrow), and not in the bright structure above, likely due to its cooler temperature. To sum up, it was likely that the eruptive filament and the expanding loops represented the structures of a mini-CME (Innes et al. 2010). The eruptive filament was its core, the loops were part of its front, and the region between them corresponded to its dark cavity. The mini-CME showed all the low corona manifestations of a typical CME, though it did not result in a proper white light CME. It was intriguing that the southern footprints remained nearly fixed (implied by the thick arrows), when the loops expanded northwards, followed by the dimmings (the thin arrow in panel (b3)). It was credible that the CME lateral expansion was asymmetric, inclined toward the north.

Figure 2. Base difference images in 304 Å (a) and 171 Å (b) of EUVI-A, showing the loop expansion and the filament eruption. The thick arrows in (b) point to the southern end of the loops, which were nearly fixed. The thin arrow in (b2) implies the filament, and that in (b3) indicates the dimmings, as a result of the CME lateral expansion.
Download figure:
Standard image High-resolution image3.2. Small-scale EUV Wave
The filament eruption was closely associated with the EUV wave seen by AIA on the disk. The wave was small scale and only lasted for about 17 minutes, from 02:54 to 03:10 UT. However, it propagated up to a distance of 180 Mm at a mean velocity of about 230 km s−1, with a nearly semicircular front (see the animation associated with Figure 3 in the online version of the journal). Figure 3 displays the evolution of the wave by base difference images in 171 and 193 Å, with the subtracted base images at 02:40:01 and 02:40:08 UT, respectively. At 02:52:20 UT, the wave did not occur, but there appeared some flaring ribbons in the core region, which was consistent with the filament activation originally (Figure 1(d)). At 02:53:20 UT, a series of post-eruption arcades straddled the EUV filament channel (the arrow in panel (a2)), as a result of the filament eruption. About 1 minute later, the wave began to expand from the flaring region and propagated quickly outward. It suggested that the filament eruption is intimately associated with the wave occurrence. The wave dominated in the northeast, but was weak in other directions. As the wave propagated, the associated phenomena, the dimmings and brightenings, were clearly seen both in 171 and 193 Å. Different types of the dimmings were observed. One type was the core dimmings, which represented the feet of the eruptive filament (arrows in panel (a3); Webb et al. 2000; Jiang et al. 2007). Another type was the stationary diffuse dimmings (the thin black arrow in panel (a5)), more obvious in 171 Å (panel b2). The diffuse dimmings were also asymmetric with an inclination toward the northeast, consistent with the CME lateral expansion. In addition, there were elongated dimmings indicated by the arrow in panel (a6), which likely traced the magnetic field lines (Delannée 2000; Zhukov & Auchère 2004). Before the formation of the elongated dimmings, there were some brightenings on its periphery (white arrows in panel (a4)). It was noteworthy that the southern footprints of the loops hardly shifted during the event (the black arrow in panel (a4)), which was in accordance with the situation of the southern footprints of CME loops presented in Figure 2. The dimmings here were arc-like and barely spread out (the thin white arrow in panel (a5)). It was reasonable that the loop expansion in the directions was stopped by the strong magnetic field. In addition, some brightenings were detected to the southwest of the fixed loop footprints (the thick arrow in panel (a5)), and the close-up is shown in panel (a7). It is probable that, although the CME loops did not expand in the direction, the wave kept propagating and triggered the brightenings, which represented a local energy release (Wills-Davey & Attrill 2009; Terradas & Ofman 2004).

Figure 3. Sequential base difference images in 193 Å ((a1)–(a7)) and 171 Å ((b1)–(b2)) displaying the evolution of the wave. The white box in (a7) highlights the brightenings in (a5). The sectors in (a1), S1–S4, are used to obtain the time-slice images in Figure 4.(An animation of this figure is available in the online journal.)
Download figure:
Standard image High-resolution imageTo best track the wave fronts, we employ the time-slice approach along some sectors (S1–S4) with a length of 182 Mm (250''). The angles of S1–S4 are 21°, 60°, 73°, and 100°, respectively, counted anticlockwise from the north (dashed lines in panel (a1)). S1 and S3 are especially chosen such that they passed through the brightenings in panels (a4) and (a5).
Figure 4 displays the propagation of the wave in S1–S4. In 193 Å (panels (a)–(d)), the wave onset was at about 02:54 UT, and the fronts appeared as bright oblique stripes. The velocities were in the range of 220–250 km s−1, implying a little angular dependence. In S1, the wave was clear in the early stage, but became faint later. At a distance of about 60 Mm, some brightenings appeared. In S2 and S3, there were deep long-duration dimmings indicated by the black arrows, consistent with the stationary diffuse dimmings in panel (a5) of Figure 3. The dimmings represented the material evacuation, resulting from the CME expansion and not the wave propagation. Beyond the dimmings, the wave was evident (white arrows) and freely propagated up to a distance of 180 Mm. It was believable that the EUV wave was a true wave rather than CME structures. In addition, the wave front in S2 revealed a decelerating nature consistent with freely propagating fast-mode waves (Veronig et al. 2008, 2010; Long et al. 2008), but the signatures were too weak to obtain the speed in the deceleration phase. The wave was very obvious in S4, due to the weak influence of the CME. We also examined the evolution of the wave along S2 in 211 and 171 Å (panels (e)–(f)). In 211 Å, the wave velocity was about 230 km s−1, which was in the range of that in 193 Å. In 171 Å, the front was hardly seen and replaced by the emission reduction, which suggested that the cooler material in 171 Å was probably heated to a higher temperature (Liu et al. 2010). The long-duration dimmings in the three wavelengths, in which the images were normalized to a same value, were similar in area, location, and duration. They were remarkable for their different intensities. The dimmings in 193 Å were stronger than that in 211 Å but weaker than that in 171 Å, also shown in Figure 3. The long-duration dimmings at different temperatures must have resulted from the material evacuation. As for the different intensities of the dimmings, the factors may include either the amount of evacuated material or the material heating, similar to the wave front in 171 Å.

Figure 4. Base difference time-slice images obtained from the sectors S1–S4 in 193 Å ((a)–(d)), 211 Å (e), and 171 Å (f). Wave signatures are indicated by the white arrows, with the linear fitted velocities attached above.
Download figure:
Standard image High-resolution image4. DISCUSSION AND CONCLUSIONS
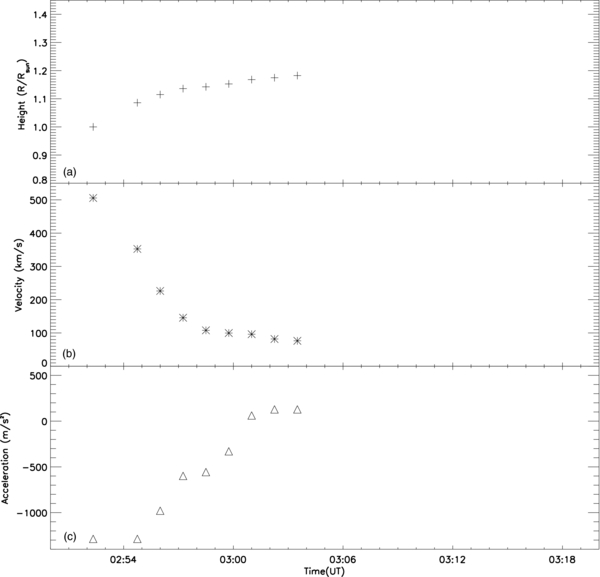
To understand the EUV wave nature, we investigated the kinematic evolution of the mini-CME in Figure 5. The heights were derived from a sequence of the EUVI-A 171 Å images, except the first point. Assuming that the CME was launched when the filament disappeared, at around 02:52:20 UT, the starting point was located at the solar surface. Based on the heights, we derived the velocity and acceleration profiles using the Lagrangian interpolation of three neighboring points (Zheng et al. 2011). The velocity decreased from about 505 km s−1 to 100 km s−1 in 7 minutes, and nearly maintained the low speed to propagate. The propagation speed was lower than half of the EUV wave speed, which suggested that the wave differed from the CME body. The acceleration increased from −1287 m s−2 to 128 m s−2. At about 02:52:50 UT, the velocity was maximum and had begun to decrease, which hinted that the CME had an impulsive expansion in the initiation phase. Although the value was hypothetical, it was convincing that the initial speed of the CME must exceed the wave speed. Because the wave onset was at about 02:54 UT, it was likely triggered by the rapid expansion of the CME loops (Kienreich et al. 2009; Patsourakos et al. 2009).
Figure 5. Kinematic plots of the CME: (a) height–time, (b) velocity–time, and (c) acceleration–time.
Download figure:
Standard image High-resolution image
In addition, we checked the reliability of the low velocities of the EUV wave. The characteristic velocity of the fast-mode wave is calculated by  , where cs is the sound speed and
  is the Alfvén speed. B is the radial component of the coronal magnetic field near the eruption region, which can be extrapolated from the Potential Field Source-Surface model (Schrijver & De Rosa 2003) with SOHO/Michelson Doppler Imager magnetogram (Scherrer et al. 1995). For this case, the distribution of B at a height of 0.06 R☉ is chosen, and the mean value of B = 0.5 G is taken. Assuming the electron number density of 108 cm−3 and a typical coronal sound speed of 180 km s−1, the fast-mode wave speed is about 210 km s−1. The EUV wave speed in this case was reliable and consistent with that of the fast-mode wave.
The exact nature of EUV waves has been intensely debated for long. The main reason was the lack of high-resolution comprehensive observations of the early evolution of the wave and of the associated CME. In addition, EUV waves are often simultaneously coupled with CMEs. If the speed of a CME approaches that of the associated EUV wave, the wave signatures would likely merge into the associated phenomena of the CME. When the CME propagates much slower than the EUV wave, the wave signatures would show well. Thus high-cadence and sensitivity observations are necessary to discover the nature of the EUV wave. Since STEREO was launched, the high-quality observations have provided enough evidence to distinguish EUV waves from the associated CMEs. Veronig et al. (2008) analyzed an EUV wave event with an associated flare, an erupting filament, and two CMEs. They showed that the kinematics of the EUV wave were quite different from that of the CME leading edge; the wave front significantly decelerated and was slower than both CMEs. Patsourakos & Vourlidas (2009) studied first quadrature observations of an EUV wave and the associated CME. They successfully separated the wave signatures from the CME structures and confirmed that the true nature of the wave was a fast-mode MHD wave. Recently, Veronig et al. (2010) determined that a dome-shaped EUV wave was not the CME body.
The SDO supplies the high-cadence and sensitivity observations very suitable for probing the nature of EUV waves and the relation between waves and CMEs. In the present event, the main results are as follows. (1) The wave fronts propagated at constant velocities with very little directional dependence, which was consistent with a fast-mode MHD wave. The velocities were of 220–250 km s−1, roughly in the order of the average surface-projected expansion speeds for fast-mode waves (Wang 2000). (2) Comparing with the onset and the initial speed of the CME, the wave was likely triggered by the rapid expansion of the mini-CME loops. After the impulsive phase, the CME propagated with a constant speed, lower than half of the EUV wave velocity. (3) The extent of the EUV wave was much larger than that of the long-duration dimmings, which was an indicator of the CME body. All the results provide evidence that the EUV wave was a true wave rather than CME structures.
Since their discovery, most of EUV waves have been large-scale and very evident. To study the small-scale and faint EUV waves, high-cadence and sensitivity observations are required. The small-scale EUV waves were unusual and were studied only in a few events observed by EUVI (Innes et al. 2009; Podladchikova et al. 2010), but those waves were not in the form of fast-mode waves. Benefiting from the high-quality observations of SDO, we present a possible small-scale wave associated with a mini-CME which possess most of the characteristics of the large-scale ones. The wave signatures were separated from the CME beyond doubt, which favored the fast-mode interpretation. However, the low speed and weak intensity of the wave make its nature uncertain and leave other possibilities open. More examples of small-scale waves will be helpful in understanding their nature and relation with large-scale ones. The nature of EUV waves remains subtle; further observations and theoretical work will be essential.
The authors thank the referee for constructive comments and P. F. Chen for guidance. The authors thank the SDO team and STEREO/EUVI consortium for providing the excellent data. We are grateful to the observing staff at SMART for making the good observations. This work is supported by the 973 Program (2011CB811403) and by the Natural Science Foundation of China under grants 10973038 and 11173058.