


ABSTRACT
NGC 2770 has been the host of three supernovae (SNe) of Type Ib during the last ten years, SN 1999eh, SN 2007uy, and SN 2008D. SN 2008D attracted special attention due to the serendipitous discovery of an associated X-ray transient. In this paper, we study the properties of NGC 2770 and specifically the three SN sites to investigate whether this galaxy is in any way peculiar to cause a high frequency of SNe Ib. We model the global spectral energy distribution of the galaxy from broadband data and derive a star formation and SN rate comparable to the values of the Milky Way. We further study the galaxy using longslit spectroscopy covering the major axis and the three SN sites. From the spectroscopic study we find subsolar metallicities for the SN sites, a high extinction and a moderate star formation rate. In a high-resolution spectrum, we also detect diffuse interstellar bands in the line of sight toward SN 2008D. A comparison of NGC 2770 to the global properties of a galaxy sample with high SN occurrence (⩾ 3 SN in the last 100 years) suggests that NGC 2770 is not particularly destined to produce such an enhancement of observed SNe. Its properties are also very different from gamma-ray burst host galaxies. Statistical considerations on SN Ib detection rates give a probability of ∼1.5% to find a galaxy with three Ib SNe detected in ten years. The high number of rare Ib SNe in this galaxy is therefore likely to be a coincidence rather than special properties of the galaxy itself. NGC 2770 has a small irregular companion, NGC 2770B, which is highly star-forming, has a very low mass and one of the lowest metallicities detected in the nearby universe as derived from longslit spectroscopy. In the most metal poor part, we even detect Wolf–Rayet (WR) features, which is at odds with most current models of WR stars which require high metallicities.
Export citation and abstract BibTeX RIS
1. INTRODUCTION
Massive stars end their lives in various ways, as governed by their mass, composition, angular momentum and whether or not they are interacting with a companion star (e.g., Heger et al. 2002). The most massive stars loose their outer layers through winds whose strength strongly depend on the metallicity of the star (e.g., Crowther et al. 2002, and references therein). These stripped stars explode as supernovae (SNe) Type Ib (SN Ib) if they have lost their hydrogen envelope or as SNe Type Ic (SN Ic) if they have also lost their He envelope. If the star is also rapidly rotating, it is believed that the star might even produce a gamma-ray burst (GRB; MacFadyen & Woosley 1999; Woosley & Heger 2006). SNe Ib/c are much rarer than SNe II, which are produced by stars with masses of 8–40 M☉, whereas SNe Ib/cs are assumed to require zero-age main-sequence (ZAMS) masses of ≳ 35 M☉ for nonrotating stars (Woosley et al. 2002). An alternative theory suggests that Type Ib/c SNe occur in close binary systems with lower masses for both stars after mass transfer of the outer envelope between the stars which can happen by various scenarios (e.g., Pols & Nomoto 1997). GRBs are even less common than SNe Ic, which is in line with the general picture that GRB progenitors require some special conditions to produce a GRB.
Only for SNe II has it been possible to identify the progenitor star, which turned out to be yellow, red or blue giants with masses of around 8–20 M☉, e.g., SN 1987A (Gilmozzi et al. 1987), SN 2002ov (Li et al. 2007), SN 2004A (Hendry et al. 2006), and SN 2006gl (Gal-Yam et al. 2007). Furthermore, several detections have been made using preexplosion imaging from the Hubble Space Telescope (HST) archive (e.g., Smartt et al. 2003). SNe Ib/c have so far evaded an identification with a progenitor star (Maund et al. 2005; Crockett et al. 2007, 2008). This is also the case for GRBs which most often occur at distances that do not even allow us to resolve their host galaxies.
When the progenitor cannot be directly identified, studying the environment can provide important information about what kind of star exploded. Spatially resolved photometric studies of the sites of different types of SNe show that SNe Type II trace the light of their host galaxies while GRBs are more concentrated toward bright regions (Fruchter et al. 2006) and that SNe Type Ib, Ic and GRBs appear to be differently distributed within their hosts (Kelly et al. 2008). Spectroscopic investigations show that the broadlined SNe Ic which are not connected to GRBs are found at sites with higher metallicities than those that are connected to GRBs (Modjaz et al. 2008a). A spatially resolved study of the host of one long-duration GRB which was not connected to an SN also showed a low metallicity in comparison to the rest of the host galaxy (Thöne et al. 2008).
Long-duration GRBs have been found to be associated with broadlined SNe Ic. There are four spectroscopically confirmed cases so far, namely GRB 980425 (Galama et al. 1998), GRB 030329 (Hjorth et al. 2003; Matheson et al. 2003; Stanek et al. 2003), GRB 031203 (Cobb et al. 2004; Thomsen et al. 2004; Malesani et al. 2004; Gal-Yam et al. 2004), and GRB 060218 (Pian et al. 2006; Sollerman et al. 2006; Modjaz et al. 2006; Mirabal et al. 2006). For all other nearby long GRBs up to 2006 where a SN could have been observed, additional light from the SN component was found in the late time light curves (e.g., Zeh et al. 2004). GRBs therefore offer a unique opportunity to observe an SN from the very onset of the explosion, as indicated by the prompt emission from the GRB. The connection between GRBs and broadlined SNe Ic, however, had to be revised in 2006 when two long-duration GRBs were found not to show any sign of an associated SN (Fynbo et al. 2006; Gehrels et al. 2006; Della Valle et al. 2006; Gal-Yam et al. 2006; Ofek et al. 2007).
One important SN that recently caught the attention of the community is SN 2008D which was associated with an X-ray transient (XT) 080109 (Soderberg et al. 2008). This SN was serendipitously detected while the XRT instrument onboard the Swift satellite (Gehrels et al. 2004) observed another supernova, SN 2007uy, in the same galaxy. Whether this prompt XT originated from a weak GRB-like event or if it was due to the shock breakout from the star is still under debate (Soderberg et al. 2008; Modjaz et al. 2008b; Malesani et al. 2008; Xu et al. 2008). The X-ray emission, however, is clearly associated with the onset of the explosion, and consequently SN 2008D was one of the earliest observed SNe. The SN spectrum evolved from a smooth spectrum with small undulations characteristic of a high-velocity ejecta into a typical SN Ib (Soderberg et al. 2008; Modjaz et al. 2008b; Malesani et al. 2008). Also the host galaxy of this SN, NGC 2770, has attracted some attention as it produced three SNe within the last nine years, SNe 1999eh, 2007uy and 2008D. Intriguingly, all three were stripped envelope core-collapse SNe Ib.
In this paper, we present a study on the local properties at the SN sites as well as of other regions in NGC 2770 with longslit spectroscopy and compare the host itself with a sample of other SN-producing galaxies. We want to investigate if the occurrence of three recent SNe Ib can be explained by some physical properties of the host galaxy. In Section 2 we present the observations and data reduction of the spectra, Section 3 studies the global properties of NGC 2770 and properties derived from modeling the spectral energy distribution (SED). In Section 4 we analyze the different regions in the host in terms of metallicity, extinction, and star formation rate (SFR). Section 5 compares NGC 2770 to a sample of other nearby galaxies with several recent SNe and discuss the probability to find three SNe Ib in a galaxy within nine years. Finally, Section 6 investigates the properties of the companion galaxy NGC 2770B. Throughout the paper we use a cosmology with H0 = 70 km s−1 Mpc−1, ΩΛ = 0.7, and Ωm = 0.3. At z = 0.007 this corresponds to 0.13 kpc per arcsecond and we use a distance of 27 Mpc to NGC 2700.
2. OBSERVATIONS
We carried out optical spectroscopy using the FORS2 spectrograph at the Very Large Telescope (VLT) on 2008 January 11.31. A 1 0 wide slit together with the 300V grism provided a resolution of 11 Å. The slit covered the site of SN 2008D as well as some outer parts of the galaxy. We obtained further spectra with ALFOSC at the Nordic Optical Telescope (NOT) on January 13, 15, and on February 3 using grism 4. These observations were also part of the observations reported in Malesani et al. (2008). While Malesani et al. (2008) used these data to study the SN itself, we instead concentrate on the host galaxy. The three NOT spectra were obtained at three different slit positions (see also Figure 4). The first included the positions of SNe 2008D and 2007uy which were also detected in the spectrum. The second one was placed along the major axis of the galaxy and the last one included the positions of SNe 2008D and 1999eh, where the latter one had already faded. On January 15.21, we also obtained one 600s spectrum of the nearby galaxy NGC 2770B with ALFOSC (Fynbo et al. 2008). Reduction and flux calibration of the spectra were done using standard tasks in IRAF. For the flux calibration we used the standard stars HD 19445, BD+75325 and BD+332642 for the ALFOSC spectra and GD 108 for the FORS2 spectrum. From the longslit spectra we then extracted traces of equal sizes at the positions of the SNe and other H ii regions in the galaxy (see Section 4)
Furthermore, we obtained high-resolution echelle spectra of SN 2008D with the Ultraviolet-Visual Echelle Spectrograph (UVES; Dekker et al. 2000) at the VLT on Jan. 18, 2008. We used the DIC1 (390+564) setting together with a 10 wide slit. This set-up covers a wavelength range from 3300 to 6650Å at a resolution of 6–8 km s−1. The UVES data have been reduced and extracted using the ESO CPL pipeline5 and flux-calibrated with the master response curves provided by ESO6.
We also obtained imaging data with FORS1 at the VLT on March 16 using an Hα filter shifted to z = 0.007 with a central wavelength of 6604 Å and a width of 64 Å as well as an offband filter for which we used the Hα filter at z = 0 with λcenter= 6563 Å and Δλ= 61 Å. In order to flux calibrate the Hα image we determined the flux within the Hα line from one of the traces extracted from the FORS spectra. We compared this flux with the counts within several rectangular apertures of the same size as for the extraction of the spectrum (1 × 3 arcsec) at the same positions along the slit by accounting for the different continuum levels from the galaxy and the varying strength of the [N ii] line which is included in the Hα narrowband filter.
For a log of the observations see Table 1. Figure 1 shows a color composite of I-band observations taken with FORS1 (Malesani et al. 2008) and the Hα and Hα offband images used in this paper.

Figure 1. Image of NGC 2770 from I (red color), Hα (blue) and Hα offband (green) filters. The field of view is about 2' × 2 5 or 15.6 kpc × 29.5 kpc in physical dimensions. Blue indicates Hα emission which nicely show the SF regions in the spiral arms of the galaxy. The positions of the three SNe are shown of which two are still visible in the image.
Download figure:
Standard image High-resolution imageTable 1. Observation Log
| Date (UT) | Telescope/Instr. | Grism/Filter | λ, λc/Δλ (Å) | Exptime (s) |
|---|---|---|---|---|
| Jan 11.31 | VLT/FORS2 | grism 300V | 3000–9600 | 600 |
| Jan 13.07 | NOT/ALFOSC | grism 4 | 2950–9050 | 3600 |
| Jan 15.21 | NOT/ALFOSC | grism 4 | 2950–9050 | 600 |
| Jan 15.95 | NOT/ALFOSC | grism 4 | 2950–9050 | 3600 |
| Jan 18.22 | VLT/UVES | DIC1 | 3300–6650 | 3600 |
| Feb 03.15 | NOT/ALFOSC | grism 4 | 2950–9050 | 1800 |
| Mar 16.11 | VLT/FORS1 | Hα z = 0.007 | 6604/64 | 120 |
| Mar 16.11 | VLT/FORS1 | Hα z = 0 | 6563/61 | 120 |
Note. Log of the spectroscopic and narrowband imaging observations.
Download table as: ASCIITypeset image
3. GLOBAL PROPERTIES OF NGC 2770 AND SED MODELING
Extensive data are available in the literature on the emission of NGC 2770 at various wavelengths. We performed photometry on the archival GALEX (Martin et al. 2003, 2005) UV images and Sloan Digital Sky Survey (SDSS) ugriz images. Furthermore, we obtained the infrared and radio fluxes from Cutri et al. (2003), Moshir et al. (1990), Dressel & Condon (1978), and Condon et al. (1998) reported in the NASA Extragalactic Database (NED). These data (see Table 2) were used to fit the broadband SED with templates from the GRASIL code (Silva et al. 1998).
Table 2. Fluxes from the Literature Taken for the SED Fitting
| Filter | Wavelength (μm) | Flux (Jy) |
|---|---|---|
| FUV | 0.1520 | 2900 ± 300×10−6 |
| NUV | 0.229 | 4900 ± 500×10−6 |
| u | 0.358 | 15.1 ± 0.6×10⁻³ |
| g | 0.485 | 42.9 ± 1.6×10⁻³ |
| r | 0.627 | 54.9 ± 2.0×10⁻³ |
| i | 0.769 | 67.9 ± 2.4×10⁻³ |
| z | 0.921 | 85.5 ± 3.8×10⁻³ |
| J | 1.25 | 98.9 ± 2.02×10⁻³ |
| H | 1.64 | 122 ± 4×10⁻³ |
| K | 2.17 | 98.8 ± 3.43×10⁻³ |
| IRAS | 12.0 | < 3×10⁻¹ |
| IRAS | 25.0 | 19.5 ± 2.89×10⁻² |
| IRAS | 59.9 | 15.8 ± 1.27×10⁻¹ |
| IRAS | 99.8 | 53.0 ± 4.77×10⁻¹ |
| 13 cm | 1.26 × 10⁵ | 12.0 ± 3.0×10⁻³ |
| 21 cm | 2.14 × 10⁵ | 17.8 ± 1.8×10⁻³ |
Download table as: ASCIITypeset image
In the GRASIL code each SED template is calculated by the following procedure: at the first stage an initial gas reservoir, infalling gas rate, and star formation (SF) history are assumed and then at a given time the emission of the resulting stellar population is summed up. Finally, the total galaxy spectrum is calculated by means of a two-dimensional radiative transfer method, applied to photons reprocessed by dust. After we found the best-fitting template we derived several galaxy properties from the SED (as in Michałowski et al. 2008a). SFR, SN rate (SNR), stellar, dust, gas, and total baryonic masses are given as output from GRASIL for the best-fitting template. The infrared luminosity was obtained by integrating the SED over the range of 8–1000 μm. The average extinction (outside of molecular clouds) was calculated as AV = 2.5log (Vobs/Vem), where Vobs is observed V-band starlight and Vem is starlight extinguished by molecular clouds only; see Silva et al. (1998). This parameter describes the extinction averaged throughout the galaxy as opposed to the line-of-sight extinction derived from optical GRB afterglows. RV was calculated comparing the extinction in the V and B bands: RV = AV/E(B − V).
The SED of NGC 2770 is well represented by an average model composed of the spiral Sc (NGC 6946) and Sb galaxies, taken from Silva et al. (1998). From the SED fit (see Figure 2) we derive an SFR of ∼1.1M☉ yr−1 and a stellar mass of 2.1× 10¹⁰ M☉ (see Michałowski et al. 2008a, for details on how these are derived from the SEDs). The resulting specific star formation rate (SSFR) is 0.05 Gyr−1. The SFRs derived from different methods (radio, IR, UV, SED modeling) differ by about a factor of 2. This is not surprising since the UV SFR estimate is affected by extinction and the different methods trace different parts of SF in the galaxy. Still, the values indicate that the SFR is not particularly high in NGC 2770. The SFR in radio is directly connected to the SNR as the nonthermal radio flux is produced by relativistic electrons accelerated in the SN shocks. Also the SNR both from radio data and the SED modeling is therefore rather low with 0.01–0.02 SNe yr−1 which is comparable to the SNR of the Milky Way (MW). In addition to the SED fit, we also searched the literature for global measurements and properties of NGC 2770. Those, together with the SED outputs, are presented in Table 3.

Figure 2. Modeling of the broadband SED of NGC 2770 from UV to radio wavelength using archival data compiled from the NASA Extragalactic Database (NED) and publicly available optical and ultraviolet data from the SDSS and GALEX archives. Error bars are mostly smaller than the symbols. The solid line shows the best-fit model from the GRASIL code (Silva et al. 1998), which is the average of Sb and Sc templates (based on NGC 6946).
Download figure:
Standard image High-resolution imageTable 3. Global Properties of NGC 2770
| Property | Value | Notes | Reference |
|---|---|---|---|
| SFR (SED) | 1.1 M☉ yr−1 | SED | This work |
| SFR (radio) | 1.2 M☉ yr−1 | using Bell (2003); Michałowski et al. (2009, Equation (1)) | This work |
| LIR | 1.4×10¹⁰ L☉ | This work | |
| SFR (IR) | 1.22 M☉ yr−1 | using Kennicutt (1992, Equation (4)) | This work |
| SFR (UV) | 0.50 M☉ yr−1 | using Kennicutt (1992, Equation (1)) | This work |
| Mgas | 1.9×10⁹ M☉ | SED | This work |
| Mstar | 2.1×10¹⁰ M☉ | SED | This work |
| Mtot | 2.6×10¹⁰ M☉ | SED | This work |
| Mdust | 1.9×10⁷ M☉ | SED | This work |
| SNR | 0.02 SN yr−1 | SED | This work |
| SNR | 0.01 SN yr−1 | radio data, using Condon (Equation (18) in 1992) | This work |
| vmaxrot | 152 km s−1 | 21cm emission | (Rhee & Albada 1996) |
N |
1.6×10²⁰ atom cm−2 | (Staveley-Smith & Davies 1988) | |
M |
7×10⁹ M☉ | (Broeils & Rhee 1997) | |
| Mtot | 1.1×10¹¹ M☉ | including DM; from vrot | (Broeils & Rhee 1997) |
Notes. For the values derived from the SED fitting, the uncertainties are less than a factor of ∼2 (Michałowski et al. 2008a, including systematic errors).
Download table as: ASCIITypeset image
We then compare the global properties of NGC 2770 to those of other galaxies, which did not necessarily host several SNe, by using a sample of more than 100 nearby spiral galaxies from Broeils & Rhee (1997) which also includes NGC 2770. This sample is based on two H i surveys of spiral and irregular galaxies with the Westerbork Synthesis Radio Telescope. We then determine the median and mean values of a number of properties and compare them with the values derived for NGC 2770. Except for a larger H i mass, NGC 2770 has average properties within this sample. The rather high gas mass and H i surface density indicate that there is a lot of material present to produce stars which could eventually lead to an increase in SF and therefore in the SNR. However, the current and past SFRs as derived from different datasets (see also Section 4.3) are not at all exceptionally high.
Soderberg et al. (2008) suggested that the companion galaxy NGC 2770B could be interacting with NGC 2770 which could explain an enhancement in SF. No obvious perturbations are, however, visible in the optical images of NGC 2770. It would be interesting to investigate possible perturbations in the H i velocity field, but the available data from VLA do not provide a good enough resolution. Wainwright et al. (2007) conclude from HST imaging of GRB host galaxies that about 30%–50% show evidence for interaction. However, the host of GRB 980425/SN 1998bw was found to be an isolated galaxy (Foley et al. 2006) and the SF history is consistent with a constant SFR over a few Gyrs (Sollerman et al. 2005), as also confirmed by radio data and detailed SED modeling of the galaxy (Michałowski et al. 2009).
4. SPATIALLY RESOLVED OPTICAL SPECTROSCOPY OF NGC 2770
From the four two-dimensional longslit spectra, we extracted traces at all positions along the slit that showed emission in Hα. We chose equally large extraction windows in all the spectra with a width of 3 arcsec, corresponding to 0.43 kpc. The spectra were then extracted using the strong and well defined SN traces as templates. For the slit containing SNe 2008D and 2007uy we took the SN trace closest to the region we wanted to extract. The relative distortions along the spatial axis are however only within one to two pixels and even for spectra with only one template trace, we are confident that we extracted the same region along the entire dispersion axis. We note here that the FORS spectrograph has an atmospheric dispersion corrector while ALFOSC has none. This implies that the ALFOSC slit do not necessarily trace the same physical region in the blue and in the red part of the spectra. However, the air mass at the time of the observations was very low and the expected refraction should be negligible.
For the wavelength calibration, we extracted several traces from the arc spectrum with the SN trace as a template and shifted to different positions along the spatial axis. In each of these traces we identified the arc lines and wavelength calibrated the different parts along the slit with the nearest arc spectrum trace. Fortunately, the distortion of the arclines along the entire chip is also within a few pixels. The maximum deviation between the arclines at the extracted trace and the position taken for the arcspectrum should be less than 1 pixel which corresponds to an accuracy of 0.3 Å comparable to the accuracy from the wavelength calibration itself. Finally, we flux calibrated the individual spectra using the corresponding standard stars observed at the same night and the same setting. We note that the flux of an extraction window is different from the one of a point source as the point-spread functions from the neighboring pixels in the spatial direction extend into the extracted part.
We then fitted the emission lines present in the spectra with Gaussians and measured the fluxes and, where possible, the equivalent widths (EW) of the Hα line. For the SN regions, the latter is prevented by the contamination from the SN continuum. In a few cases, deblending the [N ii] and Hα lines in the ALFOSC spectra proved to be difficult at this low resolution. In some regions, it seems that the part covered by the slit actually contains two kinematically different regions as the Hα lines shows a double peak which then blends with the bluer component of the corresponding [N ii] double peak. This is not surprising since we observe NGC 2770 at a small inclination. Regions with heavily blended lines were discarded from the analysis. The properties in the different regions derived from the emission line analysis as present in the next sections are listed in Table 4 and plotted in Figure 3.
Figure 3. Cut through the Hα line and the properties at the different H ii regions (see Figure 4 for the slitpositions on the galaxy). We plot two calibrations for the metallicity (errors are 0.2 dex for both methods), the extinction E(B − V) in [mag] and the Hα EW in [Å]. The four panels are: upper left: ALFOSC slitposition covering the major axis of the galaxy (slit1), upper right: the slit going through the sites of SN 2008D and SN 2007uy (slit2), lower left: position including SN 2008D and 1999eh (slit3) and lower right: the FORS slitposition (slit4). For the slit along the major axis, spatial position = 0 kpc indicates the center of the galaxy, for the other positions, for the other slits, 0 arcsec was chosen randomly.
Download figure:
Standard image High-resolution imageTable 4. Resolved Properties of NGC 2770
| 12+log(O/H) | |||||
|---|---|---|---|---|---|
| Position (arcsec) | O3N2 | N2 | E(B − V) (mag) | Hα EW (Å) | ΣSFR (10−3M☉/yr/kpc2) |
| 74.86 | 8.3 | 8.2 | 0.01 | 122.1 | 5.2 |
| 69.73 | 8.5 | 8.3 | 0.44 | 34.70 | 4.9 |
| 67.45 (08D) | 8.4 | 8.3 | ... | ... | 2.7 |
| 61.37 | ... | 8.4 | ... | 25.04 | 2.1 |
| 57.38 | 8.7 | 8.3 | 0.89 | 34.32 | 5.1 |
| 53.77 | 8.4 | 8.4 | 2.22 | 35.75 | 5.3 |
| 51.11 | 8.2 | 8.3 | 4.20 | 35.09 | 4.9 |
| 40.28 | 8.5 | 8.6 | 3.12 | 14.21 | 3.1 |
| 37.81 | 8.5 | 8.4 | 2.00 | 28.19 | 6.7 |
| 31.35 | ... | 8.6 | ... | 17.55 | 3.6 |
| 0.0 | 8.7 | 8.5 | 3.74 | 38.85 | 38.2 |
| –20.90 | ... | 8.6 | 1.12 | 40.08 | 4.0 |
| –31.92 | 8.7 | 8.4 | 1.90 | 83.27 | 14.7 |
| –39.71 | 8.6 | 8.4 | 1.62 | 102.9 | 15.6 |
| –48.83 | 8.6 | 8.4 | 0.82 | 122.1 | 18.2 |
| –55.86 | 8.4 | 8.4 | 0.93 | 51.63 | 10.2 |
| –51.37 | 8.4 | 8.3 | 1.72 | 52.52 | 5.8 |
| 64.60 | 8.3 | 8.2 | 0.82 | 229.8 | 15.8 |
| 59.66 | 8.3 | 8.2 | 1.64 | 50.07 | 4.9 |
| 57.38 (08D) | 8.4 | 8.3 | ... | ... | 3.9 |
| 47.12 | 8.4 | 8.4 | 1.27 | 77.29 | 9.7 |
| 40.28 | ... | 8.2 | ... | 24.31 | 3.1 |
| 25.46 | ... | 8.3 | ... | 27.85 | 4.9 |
| 19.76 | ... | 8.3 | ... | 21.16 | 4.4 |
| 14.06 | ... | 8.3 | ... | 31.13 | 8.0 |
| 12.16 | ... | 8.2 | ... | 20.14 | 4.5 |
| 5.70 | ... | 8.8 | ... | 9.743 | 3.7 |
| 0.38 | 8.6 | 8.7 | 2.91 | 17.89 | 7.3 |
| –1.90 | ... | 8.4 | 2.88 | 32.19 | 12.0 |
| –12.54 | ... | 8.4 | ... | 14.37 | 3.9 |
| –19.76 | ... | 8.7 | ... | 15.95 | 2.8 |
| –32.30 | 8.6 | 8.6 | 1.41 | 35.29 | 10.9 |
| –34.77(07uy) | ... | 8.5 | ... | ... | 8.1 |
| –37.62 | 8.5 | 8.4 | 1.37 | 76.20 | 15.1 |
| –51.68 | ... | 8.5 | 2.23 | 221.6 | 3.6 |
| –78.66 | ... | 8.5 | ... | 72.64 | 3.5 |
| 37.81 (08D) | ... | 8.3 | ... | ... | 10.7 |
| 22.04 | 8.5 | 8.4 | 1.41 | 30.53 | 10.2 |
| 3.23 | ... | 8.5 | 2.25 | 22.36 | 9.8 |
| –1.52 | 8.5 | 8.4 | 2.00 | 69.33 | 32.9 |
| –26.79 | ... | 8.5 | ... | 71.93 | 11.1 |
| –31.16 (99eh) | 8.5 | 8.4 | 0.72 | 61.23 | 11.8 |
| –35.34 | 8.4 | 8.4 | 2.04 | 74.66 | 11.2 |
| 34.50 | 8.4 | 8.4 | 0.59 | 119.9 | 2.8 |
| 30.00 | 8.5 | 8.5 | 1.12 | 44.25 | 1.2 |
| 27.25 (08D) | 8.6 | 8.5 | 0.95 | 5.014 | 1.1 |
| 17.00 | 8.4 | 8.4 | 1.88 | 91.78 | 4.1 |
| 0.500 | 8.6 | 8.5 | 2.10 | 41.34 | 1.4 |
| –10.50 | 8.6 | 8.6 | 2.34 | 38.31 | 1.1 |
| –27.50 | 8.5 | 8.4 | 0.64 | 117.2 | 3.7 |
| –40.00 | 8.4 | 8.5 | 0.87 | 19.61 | 0.3 |
| –45.00 | 8.3 | 8.3 | 1.86 | 14.56 | 0.2 |
Notes. Measurements from the optical spectra, from top to bottom: slit through the major axis (slit1), slit through SN 2007uy and SN 2008D (slit2), slit through SN 2008D and SN 1999eh (slit3), and FORS spectra through SN 2008D (slit4). Metallicities and SFRs were calculated from the fluxes not corrected for the extinction. The error in the metallicities are around 0.2 dex. 1 kpc corresponds to 7.7 arcsec.
Download table as: ASCIITypeset image
4.1. Metallicity
For the different regions along the slits we estimated the metallicity using the N2 parameter. This is the ratio between [N ii]/Hα and is calibrated as 12+log(O/H) = 9.37 + 2.03×N2 + 1.26×N22 + 0.32×N23 (Pettini & Pagel 2004). In the regions with significant detection of [O iii], we also use the O3N2 parameter, O3N2 = log[(O iii λ 5007/Hβ)/(N ii/Hα)], to derive metallicities with 12+log(O/H) = 8.73 – 0.32 × O3N2 (Pettini & Pagel 2004).
The O3N2 parameter has been calibrated against oxygen abundances derived directly by determining the electron temperature Te from the temperature sensitive [O iii] λ 4363 line (e.g., Izotov et al. 2006). The O3N2 parameter is also considered as the most reliable method by Kewley & Dopita (2002), if the spectra could be corrected for dust extinction. However, for low metallicities, the [O iii] λ 5007 line becomes very weak. We were not able to use it for deriving metallicities everywhere, since in some parts of the spectra it was only detected with very low significance. For consistency, we therefore use the N2 estimate throughout this article. The N2 parameter does, however, saturate at about solar metallicity and even turns around at higher metallicities (about twice solar). This is not a problem in our data as we do not have regions where the O3N2 parameter gives supersolar metallicities while the N2 metallicity gives a subsolar value.
We find that the N2 and the O3N2 methods give rather consistent results at the sites where both are determined. The error of the O3N2 parameter is about 0.2 dex in the ALFOSC spectra and 0.10–0.15 in the FORS slit. The metallicities from the O3N2 and N2 parameters have systematic errors of 0.14/0.25 dex for O3N2 and 0.18/0.38 for N2 (1/2σ errors) derived by comparison between these methods and direct measurements of the electron temperature (Pettini & Pagel 2004). We therefore estimate the total error of each metallicity value to be 0.2 dex for both O3N2 and N2. In Figure 3 we plot the results from both methods where available. Figure 4 visualizes the two-dimensional distribution of the N2 metallicities in the different parts of the galaxy as probed by the four slits.
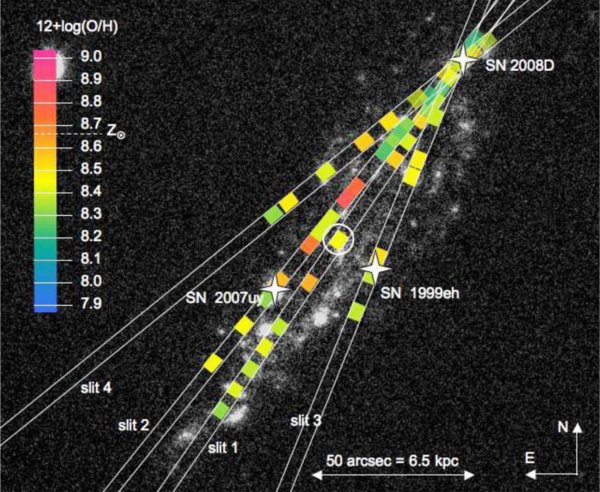
Figure 4. Metallicities in NGC 2770 along the four slitpositions as described in Figure 3 including the three SN sites derived from the [N ii]/Hα ratio. The image of the galaxy was taken with the Hα filter in order to highlight the star-forming regions. The circle indicates the center of the galaxy.
Download figure:
Standard image High-resolution imageThe metallicity at the SN sites derived from N2 are 12+ log(O/H) ∼ 8.4, 8.5, and 8.4 for SNe 2008D, 2007uy, and 1999eh respectively, which corresponds to 0.55–0.70 Z☉ (when using 8.66 for the Sun; Asplund et al. 2004). The metallicities derived at the position of SN 2008D differ between the ALFOSC and the FORS slits, but still agree within the errors. We therefore adopt an average metallicity of 8.4 for SN 2008D. The other regions in the outer spiral arms on both sides of the galaxy give similar values for the metallicity for different slits. The nucleus and the central regions have solar or supersolar metallicity. From this we derive a metallicity gradient of −0.06 dex per kpc. The average metallicity computed from the values along the major axis of the galaxy is 8.4.
It is interesting to note that the metallicities at the SN Ib sites in NGC 2770 lie in the lower range of values found for broadline SNe Ic not connected to GRBs (Modjaz et al. 2008a). They are also slightly higher than the metallicity of the H ii region which hosted SN 1998bw, a broadlined SN Ic connected to GRB 980425, as determined from IFU observations of the host (Christensen et al. 2008). Also the site of the SN-less GRB 060505 (Thöne et al. 2008) had a lower metallicity as the SN Ib sites in NGC 2770. It seems that GRB related SNe have a rather low metallicity while SNe Ib have about half solar to solar metallicities, whereas (broadline) SNe Ic require solar to slightly above solar metallicities. This result seems consistent with the suggestion that in nonrotating stars, the mass loss scales with the metallicity (e.g., Crowther et al. 2002) and SN Ic progenitors are likely experiencing larger mass loss than SNe Ib. Fast rotating stars, however, as required by the collapsar model (MacFadyen & Woosley 1999), should preferentially have low metallicities and less mass loss in order to keep the high angular momentum, which is required to produce a GRB.
4.2. Extinction
The extinction throughout the galaxy is estimated from the Balmer decrement. Since Hγ is not detected, we can only use the Hα/Hβ ratio (Osterbrock 1989). The derived extinction is generally high with values for E(B − V) between 0.4 and 3.7 mag with most of the regions having E(B − V) ∼ 1 mag. The extinction at the SN sites is considerable with E(B − V) = 0.9 mag for SN 2008D, 1.4 mag for SN 2007uy and 0.7 mag for SN 1999eh. Malesani et al. (2008) get a value of E(B − V) = 0.8 mag from fitting the SED of SN 2008D, while (Modjaz et al. 2008b) adopt 0.6 ± 0.1 mag from the SN 2008D broadband fit. The Galactic extinction toward NGC 2770 is negligible with E(B − V)= 0.02 mag (Schlegel et al. 1998).
Further evidence for dust extinction along the line of sight toward SN 2008D comes from the detection of NaD absorption in the UVES high-resolution spectra. We use the FITLYMAN program in MIDAS (Fontana & Ballester 1995) to fit different components to the Na i D1 and D2 as well as the Ca ii H & K lines and to determine column densities. The absorption lines are best fitted with two narrow components with a velocity separation of around 20 km s−1 (see Figure 5). The EWs and column densities of the two components for the different transitions and elements are listed in Table 5. Comparing the position of the absorption with the emission lines, which are likely to originate in the SF regions where SN 2008D resides, we find that the redder component is coincident with the position of the emission lines whereas the other component is slightly blueshifted. This indicates that the absorbing material is most likely in front of the H ii region of the SN. The emission lines themselves have a width of around 30 km s−1 which is most likely due to the turbulence in the SF region.
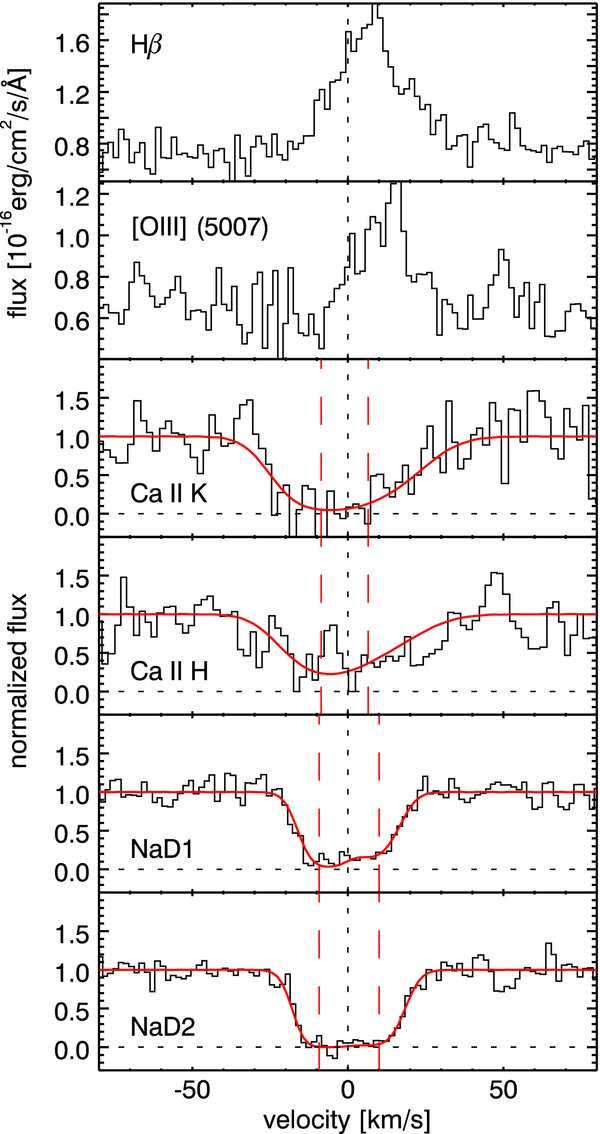
Figure 5. Fits to the Calcium and Sodium absorption lines in the UVES spectra and comparison to Hβ and [O iii] emission lines. The dashed horizontal lines indicate the continuum level. Zero velocity corresponds to the center of the galaxy for which we adopt z = 0.007 as determined from the ALFOSC spectra.
Download figure:
Standard image High-resolution imageTable 5. EWs and Column Densities from the UVES Spectra
| line id | λrest (Å) | λobs (Å) | EW (Å) | b (km s−1) | log N (cm−2) |
|---|---|---|---|---|---|
| Ca ii K | 3933.66 | 3961.00 | 0.55 ± 0.03 | 14.1 ± 7.1 | 12.92 ± 0.07 |
| 3961.20 | 18.3 ± 2.4 | 12.78 ± 0.07 | |||
| Ca ii H | 3968.47 | 3996.05 | 0.42 ± 0.03 | 14.1 ± 7.1 | 12.92 ± 0.07 |
| 3996.25 | 18.3 ± 2.4 | 12.78 ± 0.07 | |||
| Na i D2 | 5889.95 | 5930.92 | 0.33 ± 0.02 | 7.3 ± 0.3 | 12.96 ± 0.05 |
| 5931.21 | 0.38 ± 0.02 | 8.1 ± 0.3 | 12.71 ± 0.02 | ||
| Na i D1 | 5895.92 | 5936.94 | 0.26 ± 0.02 | 7.3 ± 0.3 | 12.96 ± 0.05 |
| 5937.23 | 0.36 ± 0.02 | 8.1 ± 0.3 | 12.71 ± 0.02 | ||
| DIB | 5796.99 | 5837.4 | 0.090 ± 0.02 | ... | ... |
| DIB | 6283.85 | 6328.0 | 0.850 ± 0.05 | ... | ... |
Notes. EW measurements, b parameters, and column densities (where applicable) of interstellar absorption lines in NGC 2770 along the line of sight to SN 2008D, all wavelengths are in air. The turbulent b parameter is very small and was fixed to 1 km s−1. EWs are given for both components in the Ca ii and Na i absorption systems. Galactic rest DIB wavelengths are from Galazutdinov et al. (2000)
Download table as: ASCIITypeset image
For unsaturated and mildly saturated lines, there is a direct relation between the strength of the Na D absorption and the extinction (Munari & Zwitter 1997) which have been calibrated toward stars in the LMC. Taking the EW for the two components together, we get an extinction of E(B − V)=1.1 mag. However, systems with such high EWs are usually consisting of several components. It is therefore more appropriate to add the extinction of the resolved subcomponents which are on the linear part of the EW–E(B − V) relation. The two components then give E(B − V)1 = 0.14 and E(B − V)2= 0.18 mag and E(B − V)tot = 0.32 mag. This is in fact only a lower limit as the two Na D components are saturated. Furthermore, there is also a high NH column derived from the X-ray spectra (Soderberg et al. 2008) of NH = (7 ± 1)×1021 cm−2, assuming Galactic abundances. The corresponding gas-to-dust ratio of 2.8 × 1021 cm−2mag−1 is low (close to the Galactic ratio NH = 1.7 × 1021 cm−2mag−1) compared to the ratios observed in GRB host galaxies that are typically an order of magnitude higher, suggesting that NGC 2770 is dust rich compared to those hosts.
We also detect diffuse interstellar bands (DIBs) at λλ 5837.4 Å and 6328.0 Å (corresponding to λ 5797 and λ 6283 Å rest frame) in the UVES spectra (see Figure 6) which indicates the presence of dust at the site of SN 2008D. We fit the observed spectra (rebinned to 0.09Å) with template DIB profiles keeping the width of the feature fixed but leave the continuum, the central wavelength and the depth scaling as free parameters. Doppler broadening due to the different velocity components as fitted from the NaD and Ca ii absorption in the UVES spectra is negligible for the broad λ 6283 DIBs (FWHM ∼100 km s−1). For the narrow λ 5797 DIB (FWHM ∼ 40 km s−1) we assume that DIBs are present in similar abundance in both cloud components, taking into account the two components increases the derived λ 5797 DIB strength by about 10%–15%. DIBs are speculated to be produced by large carbon molecules, possibly related to the polycyclic aromatic hydrocarbons (PAHs) that produce strong fluorescence lines in the mid-infrared. They have never been detected in the afterglow spectra of GRBs suggesting a harder radiation field and younger stars in those galaxies compared to NGC 2770. Their detection also argues against a GRB-like event causing the X-ray emission from XT 080109 as its strong radiation would have likely sublimated the DIB carriers.

Figure 6. Fits to the DIBs detected in the UVES spectra of SN 2008D. Zero velocity corresponds to the center of the galaxy.
Download figure:
Standard image High-resolution image4.3. Star Formation Rates and Ages of the Stellar Population
The local as well as the global SFR in NGC 2770 was determined by using the Hα flux and the conversion by Kennicutt (1992). The SFRs at the four different slit positions are given in Table 4 as the SF density ΣSFR = SFR kpc−2. We did the same for a range of regions within NGC 2770 by using the image taken with the Hα filter with the continuum subtracted using the offband filter as described in Section 2. Note that the fluxes derived from the Hα image were calibrated from the spectra, not from a photometric standard, therefore aperture and dispersion effects might play a role. The SFR at the sites of SNe 2008D and 1999eh are comparable but not especially high. SN 2007uy lies a few arcsec from two sites with higher SF. The local ΣSFR elsewhere in NGC 2770 varies from 2 × 10⁻³ to 4 × 10⁻¹ M☉ yr−1 kpc−2. The total SFR from the Hα image taking an elliptic aperture to include the entire galaxy yields a flux of 6.1×10⁻¹² erg cm−2 s−1 or a SFR of 0.42 M☉ yr−1, not corrected for the extinction in the host. This is consistent with other measurements from the UV. The SFR derived from IR and radio fluxes is slightly higher, which indicates that there is not a high level of dust-obscured SF. However, if we assume and average extinction of E(B − V)=1 mag, the SFR from Hα would exceed the IR/radio SFR.
The Hα EW is further correlated with the age of the underlying population at least in the first 106–107yr (see, e.g., Zackrisson et al. 2001). Table 4 also lists the Hα EW at the different parts within the four slits. We cannot determine the EW at the sites of SN 2008D and SN 2007uy as the continuum is strongly affected by the presence of the SNe and we can only measure the EW of the nearby sites. We find that the stellar populations close to the SN sites are not among the youngest ones. This is a bit surprising since the progenitors of SNe Ib are expected to be stars with masses > 30–40 M☉ whose lifetimes are < 6–7 Myr corresponding to a Hα EW of > 100 Å (see, e.g., Sollerman et al. 2005). There seems to be a strong gradient (see Figure 3) in NGC 2770 toward high EWs in the outskirts of the galaxy whereas the center has rather low EWs corresponding to an older population. However, the EWs near all three SN sites are not particularly high which does not suggest particularly young populations. It has also been suggested that SNe Ib/c do not necessarily come from very massive stars but the envelope might have been removed by a close companion star. This subsequently does not require an extremely young stellar population for the origin of the SN. While this is an unlikely scenario for the sites of most long GRB hosts where large EWs could be determined, in this case, it might be an alternative explanation due to the unexpectedly low Hα EW.
5. NGC 2770 IN THE CONTEXT OF OTHER GRB AND SN HOSTS
5.1. Other Galaxies with a High SN Rate
A number of galaxies had more than one SN detected in the optical wavelength range. The record until today is for NGC 6946 with nine SNe detected, and where all SNe that could be classified were of Type II. NGC 5236 (M 83) had six SNe and there are three galaxies with five SNe (NGC 4303 (M61), NGC 4321 (M100), and NGC 2276 (Arp 25)). Furthermore, there are nine galaxies with four SNe detected and 26 with three SNe of which one is NGC 2770 (complete up to 2008 May 30). We compiled this information from the CfA database including only galaxies with a catalogue name. We also include in our sample of frequent SN galaxies four galaxies that had two stripped-envelope SNe (to date NGC 2770 is the only one with three). This sample is clearly biased but may still be useful for the comparison between frequent SN galaxies.
One important bias in SN detections is the inclination of the galaxy observed as noted by several authors (e.g., Cappellaro et al. 1999). In our sample, the average number of SNe detected per galaxy drops toward higher inclinations; however, the distribution peaks around 30° inclination, most likely due to the low number of systems with lower inclinations. All of the galaxies with five and more SNe detected are seen nearly face-on. If we would have seen them edge-on, parts of the SNe might have been missed due to dust extinction or superposition with the bright central regions. Both issues are currently being addressed with SN searches in the IR (e.g., Mattila et al. 2007; Maiolino et al. 2002; Mannucci et al. 2003) and continuous monitoring of galaxies to perform image subtraction or observations in the radio (e.g., Cram et al. 1998)
In Table 6 we list the SFRs, SNRs, and specific SFRs weighted by the mass represented by the K-band luminosity for this sample. The radio SFRs are derived from Yun & Carilli (2002, Equation (15)), the UV SFRs from Kennicutt (1992). For most galaxies, there is a good agreement between the UV and radio SFR except for NGC 2276 and NGC 3670. Usually, radio SFRs are higher than UV SFRs as the UV is affected by extinction in the host galaxy, which plays a larger role in edge on galaxies. In our sample, we do not to account for the extinction correction and this was not done either for the GRB sample we use for comparison in Section 8. The SNRs were calculated from the nonthermal radio flux according to Condon (1992, Equation (18)) which are based on the assumption that the radio flux comes from synchrotron radiation from electrons accelerated in the SN remnants.
Table 6. Galaxies with Frequent SN Occurrence
| Galaxy | incl. (deg) | SNe | SN types | Gal. type | SFR (rad.) (M☉yr−1) | SFR (UV) (M☉yr−1) | SNR (yr−1) | Mstellar (M☉) | SSFR (Gyr−1) |
|---|---|---|---|---|---|---|---|---|---|
| MW | ... | 4 | ... | SBc | 1 | 1 | 0.01 | 5 × 10¹⁰ | 0.02 |
| NGC 6946 | 29 | 9 | II (6) | .SXT6. |
3.13 | 3.14 | 0.07 | 2.7 × 10¹⁰ | 0.12 |
| NGC 5236 (M83) | 21 | 6 | Ia (1), Ib (1) | .SXS5. |
7.00 | 0.28 | 0.17 | 6.5 × 10¹⁰ | 0.11 |
| NGC 4303 (M61) | 25 | 5 | II (4) | .SXT4.. | 11.1 | 10.1 | 0.27 | 7.8 × 10¹⁰ | 0.14 |
| NGC 4321 (M100) | 36 | 5 | Ia (4), II (1) | .SXS4.. | 6.66 | 4.57 | 0.16 | 9.9 × 10¹⁰ | 0.07 |
| NGC 2276 (Arp25) | 21 | 5 | II (2) | .SXT5. |
17.6 | ... | 0.42 | 2.4 × 10¹⁰ | 0.74 |
| NGC 1316 (FornaxA) | 56 | 4 | Ia (3) | PLXS0Pa | ... | 1.76 | ... | 3.2 × 10¹⁰ | 15.9 |
| NGC 4038 | 65 | 4 | Ia (1), Ib/c (1) | .SBS9P. b, d | 16.0 | ... | 0.39 | ... | |
| NGC 3367 | 13 | 4 | Ia, Ib/c, II | .SBT5..a | 11.3 | ... | 0.27 | 5.1 × 10¹⁰ | 0.22 |
| NGC 6754 | 60 | 4 | II (1), Ia (1) | .SBT3.. | 2.55 | ... | 0.06 | 5.3 × 10¹¹ | 0.05 |
| NGC 5468 | 24 | 4 | II (1), Ia (2) | .SXT6.. | ... | ... | ... | ... | ... |
| NGC 4725 | 49 | 4 | uncl. | .SXR2P. | 0.39 | 1.48 | 0.01 | 8.6 × 10¹¹ | 0.005 |
| NGC 3184 | 15 | 4 | uncl. | .SXT6.. | 0.28 | ... | 0.01 | 7.9 × 10¹¹ | 0.04 |
| NGC 2841 | 65 | 4 | Ia-p (2) | .SAR3*.a | <0.3 | 0.29 | <0.01 | 2.7 × 10¹¹ | 0.01 |
| NGC 3690 | 40 | 4 | Ib (2), II (2) | .IB9P..b, e | 67.1 | 0.68 | 1.59 | 7.3 × 10¹¹ | 0.92 |
| NGC 521 | ... | 3 | II(1) | .SBR4.. | 0.82 | ... | 0.02 | 1.6 × 10¹¹ | 0.006 |
| NGC 664 | ... | 3 | II(3) | .S..3*. | 3.78 | ... | 0.09 | 3.9 × 10¹⁰ | 0.09 |
| NGC 735 | ... | 3 | II(1),Ic(1) | .S..3 | 0.83 | ... | 0.02 | 3.0 × 10¹¹ | 0.03 |
| NGC 1058 | 21 | 3 | Ib/c(1), II(1) | .SAT5.. | 0.02 | ... | 0.0004 | 1.1 × 10⁹ | 0.02 |
| NGC 1084 | 56 | 3 | II(2) | .SAS5.. | 8.11 | ... | 0.19 | 2.3 × 10¹⁰ | 0.35 |
| NGC 1097 | 47 | 3 | II(3) | .SBS3..f | 7.18 | 0.17 | 0.17 | 8.9 × 10¹⁰ | 0.08 |
| NGC 1365 | 58 | 3 | II(2) | .SBS3.. | 15.2 | ... | 0.36 | 1.3 × 10¹¹ | 0.12 |
| NGC 1448 | 79 | 3 | Ia(1), II(2) | .SA.6*/ | 1.39 | ... | 0.03 | 2.1 × 10¹⁰ | 0.07 |
| NGC 1559 | 56 | 3 | II(2), Ia(1) | .SBS6.. | 8.05 | ... | 0.19 | 1.8 × 10¹⁰ | 0.44 |
| UGC 1993 | ... | 3 | Ia, II | .S..3.. | ... | ... | ... | ... | ... |
| NGC 2207 | 54 | 3 | Ib(1), Ib/c(1) | .SXT4P.b | 29.7 | ... | 0.71 | 7.0 × 10¹⁰ | 0.43 |
| NGC 2770 | 72 | 3 | Ib(3) | .SAS5*. | 0.59 | 0.64 | 0.01 | 9.8 × 10⁹ | 0.06 |
| NGC 3147 | 31 | 3 | Ia, Ib | .SAT4..f | 7.39 | ... | 0.18 | 1.5 × 10¹¹ | 0.05 |
| NGC 3627 (M66) | 67 | 3 | Ia, II(2) | .SXS3..a, f | 2.44 | 1.11 | 0.06 | 4.1 × 10¹⁰ | 0.06 |
| NGC 3631 | 28 | 3 | II (1) | .SAS5.. | 1.15 | ... | 0.03 | 1.5 × 10¹⁰ | 0.08 |
| NGC 3938 | 14 | 3 | Ic,II | .SAS5.. | 0.43 | 0.82 | 0.01 | 8.6 × 10⁹ | 0.05 |
| NGC 3947 | 31 | 3 | Ia(1), IIn(1) | RSBT3.. | 2.07 | ... | 0.05 | 5.6 × 10¹⁰ | 0.04 |
| NGC 4157 | 90 | 3 | II, uncl.(2) | .SXS3 | 1.16 | ... | 0.03 | 1.2 × 10¹⁰ | 0.09 |
| NGC 4254 (M99) | ... | 3 | II(1) | .SAS5.. | 25.1 | 12.3 | 0.59 | 1.7 × 10¹⁰ | 0.15 |
| NGC 4374 (M84) | ... | 3 | Ia(2) | .E.1... a, c, f | ... | 0.06 | ... | 6.3 × 10¹⁰ | 1.10 |
| NGC 4527 | 71 | 3 | Ia(1) | .SXS4..a | 5.82 | ... | 0.4 | 8.8 × 10¹⁰ | 0.07 |
| NGC 4939 | ... | 3 | II(1) | .SAS4..f | 4.79 | ... | 0.12 | 7.2 × 10¹⁰ | 0.07 |
| NGC 5033 | 70 | 3 | II(2) | .SAS5..f | 2.78 | 0.39 | 0.07 | 2.2 × 10¹⁰ | 0.13 |
| NGC 5253 | 90 | 3 | I(1) | .I..9P*d | 0.15 | 0.08 | 0.004 | 1.5 × 10⁹ | 0.10 |
| NGC 5457 (M101) | 7 | 3 | II(1) | .SXT6.. | 0.44 | 0.27 | 0.01 | 6.3 × 10⁹ | 0.07 |
| NGC 5668 | 22 | 3 | Ia, II | .SAS7.. | 0.60 | ... | 0.02 | 9.0 × 10⁸ | 0.67 |
| NGC 3810 | ... | 2 | Ib(1), Ic (1) | .SAT5.. | 1.25 | ... | 0.03 | 1.1 × 10¹⁰ | 0.11 |
| NGC 7714 | 42 | 2 | Ib/c(2) | .SBS3*Pa, d, e | 1.25 | 0.90 | 0.03 | 1.7 × 10¹⁰ | 0.07 |
| NGC 4568 | 65 | 2 | Ib(1), Ic (1) | (SAbc)b | 6.39 | 1.13 | 0.15 | 8.8 × 10¹⁰ | 0.07 |
| NGC 3464 | 50 | 2 | Ib(1), Ic(1) | .SBT5.. | ... | ... | ... | ... | ... |
Notes. Complete sample of all galaxies with ⩾ three SNe and five galaxies with two stripped envelope SNe, compiled from the CfA SN database. The classifications are adopted from RC3 g, for those galaxies without RC3 classifications, we use the classification from NED. The adopted T value is the number in the classification code for spirals, the only elliptical galaxy, NGC 1316 has T = −2. Radio data, UV flux, and K-band luminosity are taken from NED where available. SNRs are derived from radio data according to Condon (1992, Equation (18)), SFRs are from Yun & Carilli (2002, Equation (15)) for radio and Kennicutt (1992) for UV SFRs. aLow ionization nuclear emission line region (LINER). bInteracting galaxy. cLow excitation radio galaxy (LERG). dstarburst. eWR galaxy. fSeyfert galaxy. gColumn 1: R = outer ring; P = pseudo outer ring; C = compact; D = dwarf; Column 2: E, S, I, P: elliptical, spiral, irregular, peculiar; Column 3: X = transition between A (no bar) and B (barred galaxy). "+": transition between elliptical and lenticular galaxies (E/S0); Column 4: T = transition between s (no inner ring) and r (strong inner ring), number = ellipticity for an elliptical galaxy: 0 = round, 6, 7 = edge-on; 0 = I0 galaxies; Column 5: lenticulars: -, 0, or + (lenticular stages), spirals: Hubble stage: 0 for 0/a, 1 for a,... 9 for m, for Magellanic irregulars, always 9; Column 6: uncertainty (* or), P (minor peculiarity), or / = sp (spindle; an edgewise galaxy); Column 7: same as Column 6, if needed.
Download table as: ASCIITypeset image
It may appear surprising that the galaxies with the highest number of observed SNe do not necessarily have the highest (expected) SNRs as derived from radio data. However, most galaxies with four or more SN detected have an expected SNR between 1 and 4 in 10 yr. This is consistent with the number of actually detected SNe considering the small numbers and that SN observations in most of these galaxies have only been possible for the last few tens of years. NGC 2770 has an SSFR and SNR among the lowest in our sample and does not reflect the detected SNR which could, however, be a statistical fluctuation (see Section 5.3).
A significant fraction of the galaxies with frequent SN Ib/c occurrence are classified as starbursts, irregular or interacting with a neighboring galaxy whereas most of the galaxies with predominantly SNe II are more "ordinary" spirals. Single-star evolution models suggest that SNe Ib/c progenitors are more massive than those of SNe II and should therefore come from a younger population. Interaction between galaxies is considered as one of the possible triggers for SF which would explain the connection between young galaxies and a more frequent occurrence of SNe Ib/c. However, if one considers binary systems as progenitors for SNe Ib/c, this connection between a very young stellar population and the site/host galaxies of SNe Ib/c would not be equally strong.
In order to quantify this observation, we correlate the fraction of SNe of a given type for a certain type of galaxy as displayed in Figure 7. For the galaxy classification we adopted the values from de Vaucouleurs et al. (1991) which attributes values from – 6 to 11 with –6 to 0 for elliptical galaxies, 1–9 spirals of increasing Hubble type, and 10, 11 for irregular galaxies. SNe Ibc seem to be more frequently detected in later type spirals compared to SNe Type II, whereas SN Ia are rather evenly distributed over all galaxy types. van den Bergh et al. (2005) investigated the complete sample of SNe detected with the LOSS SN search and their hosts up to 2005 and do not find a significant difference between the Hubble Type of SNe Type Ib/c and SNeType II. For our sample, we do only consider frequent SN hosts which introduces some bias in the sample. The top panel in Figure 7, however, shows that, at least in our sample, there is a tendency of a higher fraction of SNe Ib/c over SNe II for spirals of later Hubble type.
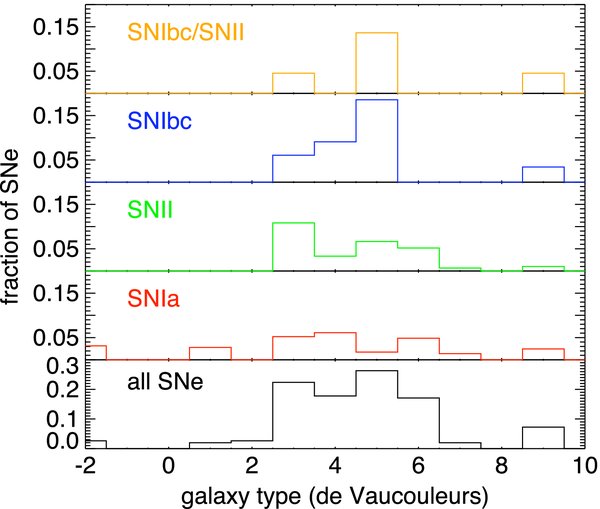
Figure 7. Fraction of detected SNe sorted according to the de Vaucouleurs classification (de Vaucouleurs et al. 1991) of their host galaxies. SNe Ib/c seem to be slightly more concentrated toward later type spirals whereas SNe II seem to prefer earlier type spirals which are also expected to have an older stellar population. Larger samples as in van den Bergh et al. (2005) do not find a difference in the distribution of SN Type II and Type Ibc over galaxy type. In general, most SNe are detected in spiral galaxies.
Download figure:
Standard image High-resolution imageConsidering our limited sample, it seems that a specific galaxy produces predominantly a certain type of SN. In order to investigate this notion, we calculated the fraction of galaxies that only had one SN type detected from our sample of 44 frequent SN galaxies. 29 of those had SNe II out of which 51% had only SNe II, 13 had SNe Ib/c with 46% only having SNe Ib/c and 17 with SNe Ia of which only 29% had uniquely SNe Ia. In these numbers, we only include the classified SNe. It seems that indeed, galaxies with SNe II and Ib/c often only have one type of SN whereas this is less pronounced for SNe Ia. This result suggests that the SF history in those galaxies is rather uniform in the sense that SF has a common onset in time and first produces mainly SNe Ibc expected to come from the most massive stars, whereas later on, when the dominant population has become older, mainly SNe II are produced. SNe Ia can occur in almost any type of galaxy due to their large range of delay times. However, this only refers to the global SF history of a galaxy, local exceptions of SF regions with massive stars being formed might also occur. We caution that this result is based on relatively low statistics and only closer investigation of the SF history of those galaxies can give a final answer to this suggestion.
5.2. Comparison to other GRB and SN Hosts
We now compare our sample of frequent SN galaxies to the hosts of long GRBs that are known to be connected to broadlined SNe Ic. For the GRB hosts, we take the sample from Castro Cerón et al. (2008) which lists the UV SFRs derived from the relations of Kennicutt (1992) as well as the stellar masses derived from the rest-frame K-band luminosity. GRB hosts have generally lower masses (log Mstellar,SN=10.71 M☉, log Mstellar,GRB=10.36 M☉) and higher SFRs (SFRGRB= 2.9 M☉ yr−1, SFRSN= 2.0 M☉ yr−1) than the frequent SN hosts from our sample. This leads to a higher SSFR for GRB hosts (0.075 and 0.32 Gyr−1 for SN and GRB hosts, respectively) even though the two samples overlap partially. The SSFRs and masses are presented in Figure 8. We note that the masses derived in Castro Cerón et al. (2008) are about two times higher than the masses in the sample Savaglio et al. (2008) which partially overlap with the sample of Castro Cerón et al. (2008). This difference is partly explained by the use of different assumptions for the ratio Mstellar/LK in both works. NGC 2770 has a SSFR close to the average in the frequent SN host sample, but a somewhat lower mass, but the SSFR lies clearly in the lower end of the distribution of long GRB hosts.
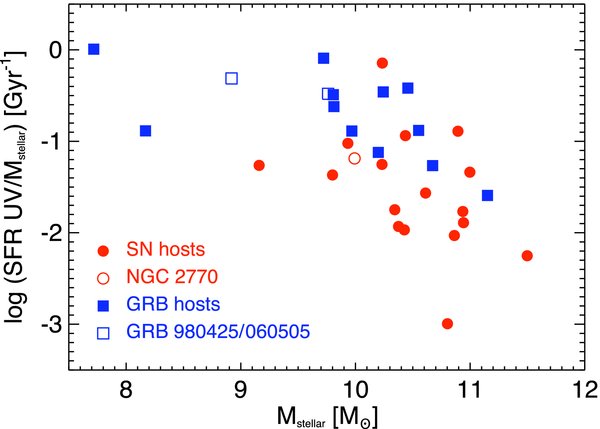
Figure 8. Specific SFR from the UV versus stellar mass derived from the K-band luminosity for GRB hosts (blue squares) and the sample of frequent SN galaxies (red dots) presented in Table 6. The GRB hosts specifically mentioned in Section 5.2 and NGC 2770 are plotted as empty symbols.
Download figure:
Standard image High-resolution imageThe hosts of broadlined SNe Ic from the sample of Modjaz et al. (2008a) have SFRs comparable to those of GRB hosts, but most likely smaller SSFRs due to their higher masses. As mentioned above, hosts of broadlined SNe Ic have higher metallicities than nearby GRB hosts which always have subsolar metallicities, some of them even down to 1/10 solar (for a complete sample see Savaglio et al. 2008, and references therein). Modjaz et al. (2008a) also note that the properties of the hosts of broadlined SNe Ic are consistent with those of normal nearby star-forming spiral galaxies.
Some nearby GRB hosts are also different from the usual picture of low mass, high SF GRB hosts. The host of GRB 980425, connected to SN 1998bw (broadlined SN Ic) is a spiral galaxy with not particularly high SF in most parts of the galaxy, 1/3 of the global SF derived from this galaxy comes from a very luminous Wolf–Rayet (WR) region close to the GRB site (Sollerman et al. 2005; Christensen et al. 2008; Michałowski et al. 2009). The host of GRB 060505, a long GRB without SN, is a spiral galaxy and displays relatively high SF and a low metallicity at the site of the GRB (Thöne et al. 2008), but not in the galaxy in general, even though the SF is still higher than in NGC 2770. It is still an open question whether GRB hosts are a special population of star-forming galaxies or following the general trend of other galaxies with redshift.
5.3. SN Detection Rates and the Probability of Finding Three SNe in NGC 2770 in Ten Years
NGC 2770 apparently has a high observed SN Ib rate with three explosions within ten years. Indeed, although 39 more galaxies are known to have had three or more SNe, no other galaxy has had more than two Ib/c SNe. Is this unexpected?
To date, no independent measurement of the SNR of SNe Ib exists. In most cases (e.g., Dahlen et al. 2004; Cappellaro et al. 2005) rates in the literature are given for all core collapse supernovae (CC SNe) together. Such results are, however, dominated by SNe II, which are the most frequent SNe. Some papers list at least SNe Ib/c and SNe II separately (e.g., Cappellaro et al. 1999; Mannucci et al. 2007).
The rate measurements are either volumetric in case of higher-z SN surveys (e.g., Dahlen et al. 2004; Neill et al. 2006), or galaxy monitoring type searches, i.e., searches that look repetitively with a given cadence at a sample of galaxies. This kind of search usually has a number of biases, such as the frequency of observations, the limiting magnitudes achieved, the techniques used for detection or the galaxy inclination, and are restricted to lower or intermediate redshift (Cappellaro et al. 1999; Botticella et al. 2008).
Unlike SNe Ia, where an accurate and complete volumetric SNR at low redshift has been measured (Dilday et al. 2008), the most recent results for CC-SNe is still from Cappellaro et al. (1999). Making estimates to correct for a number of biases, (Cappellaro et al. 1997) combine the results of five different SN searches (including pre-CCD data) and obtain a rate of 0.08 ± 0.04 × (Ho/75)2 SNu for SNe Ib/c (1 SNu = 1 SN per 100 yr per 1010LB☉). This rate increases to 0.14 ± 0.07 × (Ho/75)2 if one only takes Sbc-Sd type galaxies. For NGC 2770, we find a B-band luminosity from NED of 1.1 × 10¹⁰LB☉. Assuming a Poissonian distribution for SN events, the probability of NGC 2770 to have three SNe Ib/c in a decade is then 6.1 × 10⁻⁷. The probability of getting three SN Ib events is even smaller.
We cross-check our expected number of SN events in NGC 2770 with Mannucci et al. (2007), who normalized the SNR to the K-band luminosity (SNuK) by using the same sample of SN host galaxies as Cappellaro et al. (1999). The K-band luminosity is a better indicator of the stellar mass than the B-band luminosity which traces mostly the young star population. With a K-band magnitude of 9.57 for NGC 2770 and by comparing with their predicted rates for Sbc galaxies (Mannucci et al. 2007, Table 2) we calculate a probability of 1.5 × 10⁻⁶ for NGC 2770 to have 3 SN Ib/c events within a decade. The two probabilities derived differ by a factor of about 2. However, the chance probability for the observed SNR at NGC 2770 is overall very small. In addition, the B−K color of NGC 2770 is 3.20, a value that does not indicate an extreme CC SN production (Mannucci et al. 2007). We note that the values derived here are only the probability to detect a SN from statistical considerations and the luminosity of the galaxy and do not necessarily correlate with the expected SNR from radio observations.
However, we also have to account for the number of observed galaxies to derive a number for the probability to find one such galaxy which produced three SNe Ib. SNe have been discovered in ∼3500 local galaxies but the total number of monitored galaxies is difficult to estimate, due also to the lack of information and uncertainties in individual amateur efforts. The results from Cappellaro et al. (1999) and Mannucci et al. (2007) are based on samples of 9346 and 8450 galaxies, respectively. The LOSS search (Fillipenko et al. 2001), which is the most successful and systematic search in low-z, monitors around 5000 local galaxies. If we now assume ∼10, 000 monitored galaxies, the chance of observing this high SNR in any galaxy becomes 0.6%–1.5% which is still a fairly low probability but given the uncertainties it could be consistent with a chance coincidence. This would also support the conclusions derived in Sections 3 and 5.1 that NGC 2770 has no extraordinary global properties.
As a curiosity we add here that the same method of calculating probabilities, can to some extent explain the observed SNRs in the top SN producing galaxies (those with more than five observed SNe) with probabilities in the range 10−3–10−1, except the top SN producing galaxy, NGC 6946, which has a SED very similar to NGC 2770 (chance probability lower than 10−4).
6. NGC 2770B
We also obtained spectra of the neighboring galaxy, NGC 2770B, which has the same redshift as NGC 2770 (Fynbo et al. 2008) and can therefore be considered as a companion of NGC 2770. The galaxy consists of two "blobs" and we divide the two-dimensional spectrum in three parts of which two are part of the first "blob" but show a small spatial separation in the emission lines in the two-dimensional spectrum. Both regions shows very strong emission lines which points to a very young population undergoing heavy SF. In Table 7 we list the emission lines detected as well as their fluxes.
Table 7. Line Fluxes in NGC 2770B
| Line | Region 1 | Region 2 flux (10−15erg cm−2 s−1) | Region 3 |
|---|---|---|---|
| [O ii] λ 3729 | 13.8 | 7.07 | 5.95 |
| [Ne iii] λ 3869 | 15.5 | 2.43 | 1.71 |
H |
6.47 | ... | ... |
| Ca ii λ 3969 | 9.69 | 0.73 | 1.06 |
| Hδ | 7.34 | 1.16 | 1.17 |
| Hγ | 14.3 | 1.46 | 1.74 |
| [O iii] λ 4363 | 3.23 | ... | 0.28 |
| HeI λ 4472 | 1.02 | ... | ... |
| Hβ | 29.6 | 4.37 | 4.04 |
| EW[Å] | 615 | 44.4 | 119 |
| WR λ 4696 | 8.05 | ... | ... |
| [O iii] λ 4960 | 71.1 | 8.88 | 7.81 |
| [O iii] λ 5008 | 194 | 25.8 | 23.4 |
| He i λ 5876 | 3.11 | 0.13 | 0.49 |
| [S iii] λ 6313 | 0.84 | 0.23 | ... |
| Hα | 71.3 | 14.1 | 12.6 |
| EW[Å] | 2200 | 295 | 709 |
| [N ii] λ 6585 | 0.51 | 0.04 | 0.14 |
| [S ii] λ 6718 | 0.97 | 0.54 | 0.30 |
| [S ii] λ 6732 | 2.60 | 0.19 | 0.89 |
| Ne ii λ 7024 | 1.14 | 0.68 | 0.45 |
| He ii λ 7065 | 0.63 | ... | ... |
| [Ar ii] λ 7135 | 1.76 | 0.33 | 0.29 |
| [O ii] λ 7330 | 1.81 | ... | ... |
| 12+log(O/H) | 7.2 | 7.3 | 7.3 |
| E(B − V) | 0 | 0 | 0 |
| ΣSFR (SFR arcsec−2) | 0.025 | 0.0049 | 0.0043 |
Notes. Fluxes and properties for three regions in NGC 2770B. The metallicity has been derived from the R23 parameter, the extinction from the Balmer line decrement, the SFR from Hα and is listed as SFR/arcsec2.
Download table as: ASCIITypeset image
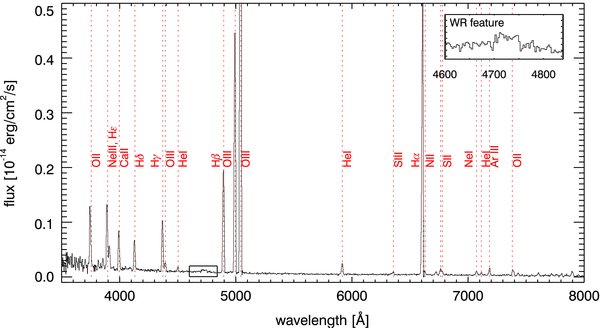
We detect a large range of emission lines not detected in the spectra of NGC 2770 including [Ne iii], Hδ, Ca ii, Na i, [O iii] λ 4363, He i, He ii, [S iii], and [Ar iii] where the western "blob" of the galaxy shows most emission lines. [Ne iii] λ 3869 is exceptionally strong, especially in the western blob which indicates a large number of young stars. The spectrum resembles very much the nebular spectrum of young H ii regions such as the Orion nebula in the MW. In this region, we also detect a clear WR feature at 4686 Å (rest frame) with a FWHM of 77 Å. In Figure 9, we show the spectrum of region one which has the strongest emission lines with an inset showing an enlargement of the WR feature.
Figure 9. Spectrum of the region 1 in NGC 2770B which has the strongest emission lines. The emission lines of [O iii] and Hα have been cut in order to enlarge the scale to show the weaker emission lines.
Download figure:
Standard image High-resolution image
The extinction as derived from the Balmer decrement using both Hα/Hβ as well as Hβ/Hγ is consistent with zero. In order to determine the metallicity for NGC 2770B we cannot use any of the measurements which require [N ii] that is only barely detected. This might be both an effect of the low metallicitiy and probably also a high temperature in the H ii regions. Instead, we use the R23 parameter (Kewley & Dopita 2002) based on the line fluxes of Hα, Hβ, [O iii] and [O ii] which are all detected with high S/N in contrast to the spectra of NGC 2770. The metallicities we derive are among the lowest detected for nearby galaxies with 1/30 to 1/25 solar.
In two of the three spectra extracted from NGC 2770B, we also detected the [O iii] λ 4363 line which allows us to determine the electron temperature. From the electron temperature, it is possible to derive directly the abundances of O+/H and O++/H by using the method described by Izotov et al. (2006, Equations (1), (2), (4), and (5)) and assuming that Te(O ii)=−0.577+Te(O iii)[2.065–0.498Te(O iii)] which Izotov et al. (2006) suggests for low metallicities (Equation (14)). We then get values of Te(O ii) = 1.4 × 10⁴ K for region 1 and Te(O ii) = 1.2 × 10⁴ K for region 3 which gives metallicities of 12+log(O/H) = 7.1 and 7.6 respectively. The value for region 1 agrees very well with the one derived from R23 whereas the value for region 3 from the Te method is higher. We note, however, that the [O iii] λ 4363 line in region 3 was not detected with high significance.
The SFR in the eastern blob is comparable to the SFR in the nucleus of NGC 2770, however in the western part it is about an order of magnitude higher than in any region in NGC 2770. The very high EW of the Hα line also indicate a dominant stellar population of only a few Myr. We also calculate the global SFR from collapsing the entire spectrum of NGC 2770B and obtain a SFR of 0.11 M☉ yr−1. We obtained images from the 2MASS catalogue in Ks band and determined a magnitude of Ks = 15.3 mag for NGC 2770B. Assuming a mass-to-light ratio of 0.4, the median value adopted by Castro Cerón et al. (2008) for GRB host galaxies, and taking Equation (1) from Castro Cerón et al. (2008), we determine a mass of only log M* = 7.65 M☉. Together with the SFR derived from Hα, this gives a very high specific SFR of 0.39 Gyr−1.
NGC 2770B is a rather unusual galaxy compared to its massive neighbor NGC 2770. The fact that no SN has been detected (yet) in this galaxy is likely only due to its very low total mass so is the expected observed SNR. It is also one of the most metal poor galaxies ever detected (see, e.g., Izotov et al. 2006) which further indicates a very young stellar population. What triggered this high SFR in NGC 2770B remains unclear. It is also interesting that the most metal poor region has a clear detection of a WR feature. WR stars do only occur in a very narrow time window after the onset of a starburst between 2 and 5 × 10⁶ yr and are therefore a good tracer of the SF history. Models for WR stars predict a strong metallicity dependence on the wind which produces these features (e.g., Vink et al. 2001). However, there are a number of low and very low metallicity galaxies with detected WR features (e.g., Izw 18, SBS-0335) which have challenged this model (e.g., Brinchmann et al. 2008). Possible explanations are that there are actually more WR stars produced than predicted from the models or that WR stars which are rapidly rotating can form at much lower metallicities. One suggestion has been that LBV stars can loose their envelope by mass losses through massive eruptions rather than by stellar winds, which would be independent of metallicity (Smith & Owocki 2006). Rapidly rotating WR stars have also been suggested as progenitor for GRBs. Overall, NGC 2770B seems to be a exceptional galaxy that is potentially interesting for future studies.
7. CONCLUSIONS
We have investigated the properties of the three SN sites in NGC 2770, the host of three SNe Ib, and the other regions in the host along 4 longslit positions. Previous observations in all wavelengths from UV to radio allow us to fit the SED of NGC 2770 and derive a range of global properties from it. We then set NGC 2770 in context to a sample of galaxies with frequent SN occurrence (three or more SNe detected) and also compute the probability to detect three SNe Ib in a galaxy within only ten years as it was the case for NGC 2770. From those analyses, we conclude the following.
- 1.NGC 2770 has global properties similar to the MW, even though it has a higher number of SNe observed. Its SFR and SNR are around the average of other nearby spiral galaxies and our sample of frequent SN galaxies.
- 2.The only outstanding property of NGC 2770 is its high H i mass which indicates a large reservoir for forming stars.
- 3.The metallicities at the SN sites in NGC 2770 are around 0.5 solar which is slightly higher than the values observed for nearby GRB sites, but in the lower range of those measured for broadline SN Ic sites not connected to GRBs.
- 4.The SFR and Hα EW are surprisingly not very high at the three SN sites, which might be a support for binary evolution models as SN Ib/c progenitors.
- 5.Almost half of the galaxies with SNe II and Ib/c only have one type of SN which is likely connected to the age of the dominant stellar population. Galaxies producing SNe Ib/cs have a higher deVaucouleurs number than those producing SN II.
- 6.SN and GRB hosts seem to be somewhat different in terms of SFRs and masses.
- 7.The probability to detect three SNe Ib in a galaxy within ten years is 0.6%–1.5% assuming 10,000 monitored galaxies.
It therefore seems to be likely that observing three SNe Ib in NGC 2770 was only a chance coincidence. NGC 2770 is by no means a special galaxy that would be predestined to produce only stripped-envelope SNe. In fact, its properties are not typical for galaxies with (frequent) SN Ib/c occurrence. However, it might also imply that the local properties at the SN sites are more important, at least in some galaxies, to produce a certain type of SN than its global properties.
C.T. and P.M.V. thank Cédric Ledoux for the reduction of the UVES spectra.
The Dark Cosmology Centre is funded by the Danish National Research Foundation. We thank the staff and the NOT and the VLT to perform the observations. PMV acknowledges the support of the EU under a Marie Curie Intra-European Fellowship, contract MEIF-CT-2006-041363. In this work we made use of the NASA Extragalactic Database (NED). The NED is operated by the Jet Propulsion Laboratory, California Institute of Technology, under contract with the National Aeronautics and Space Administration. J.S. is a Royal Swedish Academy of Sciences Research Fellow supported by a grant from the Knut and Alice Wallenberg Foundation.
Footnotes
- *
Based on observations with the Nordic Optical Telescope, ESO proposal 080.D-0526, the GALEX and NED databases.
- 5
- 6