


ABSTRACT
A candidate ≲3 MJup extrasolar planet was recently imaged by Kalas et al. using Hubble Space Telescope/Advanced Camera for Surveys and Keck II at 12 7 (96 AU) separation from the nearby (d = 7.7 pc) young (∼200 Myr) A2V star Fomalhaut. Here, we report results from M-band (4.8 μm) imaging of Fomalhaut on 2006 December 5 using the Clio IR imager on the 6.5 m MMT with the adaptive secondary mirror. Our images are sensitive to giant planets at orbital radii comparable to the outer solar system (∼10–40 AU). Comparing our 5σ M-band photometric limits to theoretical evolutionary tracks for substellar objects, our results rule out the existence of planets with masses >2 MJup from ∼13 to 40 AU and objects >13 MJup from ∼8 to 40 AU.
Export citation and abstract BibTeX RIS
1. INTRODUCTION
Approximately 300 extrasolar planets have been discovered, predominantly through Doppler spectroscopy, transits, and microlensing (e.g., Marcy et al. 2005; Charbonneau et al. 2007; Gaudi 2008). Substellar objects with inferred masses below the deuterium-burning limit (∼13 MJup) have been imaged as members of young clusters (e.g., Zapatero Osorio et al. 2000; Luhman et al. 2005), at wide separation (>tens AU) orbiting other young brown dwarfs (e.g., Chauvin et al. 2004; Luhman et al. 2006), and a young ∼1 M☉ star (Lafrenière et al. 2008). Although the deuterium-burning limit has acted as a de facto boundary between "planets" and "brown dwarfs," these objects do not have birth certificates, and their means of conception is a matter of conjecture. Given our knowledge regarding parameters of protoplanetary disks, it is not clear that any of the imaged companions with masses of <13 MJup could have formed in situ. Exotic scenarios for formation at smaller radii and subsequent planet–planet scattering have been proposed (e.g., Ford & Rasio 2008; Mamajek & Meyer 2007).
Recently, two studies (Kalas et al. 2008; Marois et al. 2008) announced the discovery of what appear to represent the first unequivocal cases of exoplanets being directly imaged and resolved around nearby stars. Marois et al. (2008) imaged three large gas giants in orbit around the young A-type debris disk star HR 8799. Kalas et al. (2008) detect a companion ≲3 MJup situated 127 (96 AU) away from the bright A3V star Fomalhaut (α PsA; V = 1.2 mag). Fomalhaut is a target in our MMT/AO survey for substellar companions around nearby intermediate mass stars and we report results of our recent observations here.
Fomalhaut is a well-studied, nearby (7.7 pc; Perryman & ESA 1997), young (∼200 ± 100 Myr; Barrado y Navascues 1998) main-sequence ∼1.95 M☉ star with a debris disk system. The debris disk system is remarkable for having been resolved in the submillimeter with JCMT (Holland et al. 2003), far-infrared (far-IR) with Spitzer (Stapelfeldt et al. 2004), and optical with Hubble Space Telescope (HST; Kalas et al. 2005). The HST/Advanced Camera for Surveys (ACS) coronagraph images suggest that the cold dust belt is ∼25 AU wide, with a sharp inner edge ∼133 AU from Fomalhaut. From the eccentricity and sharpness of the inner edge of the debris disk, Quillen (2006) predicted the existence of a ∼0.05–0.3 MJup planet with semimajor axis a = 119 AU and eccentricity of ∼0.1. The planet imaged by Kalas et al. (2008) has a stellocentric separation of 119 AU and inferred semimajor axis of ≈115 AU, in remarkable agreement with Quillen's prediction. The mass predicted by Quillen is lower than the upper limits derived by Kalas et al. (2008, ∼1.7–3.5 MJup), however, they emphasize that their 0.6 μm flux may be contaminated by an extensive circumplanetary disk.
Young giant planets are predicted to be hot (for MJup > 3, Teff >300 K for ages <500 Myr (Baraffe et al. 2003)), and theoretical spectral energy distributions (SEDs) predict a strong peak around ∼5 μm (e.g., Burrows et al. 1997). While direct imaging surveys for substellar companions to nearby stars have concentrated on near-IR bands (e.g., H and K), the models predict that L and M-band fluxes for planets should be much brighter than at J, H, and K. For example, a 10 MJup object with age 0.5 Gyr has predicted colors of J − M≃ 4, H − M≃ 4, and L − M≃ 1 (Baraffe et al. 2003). Motivated by these predictions, we initiated surveys of nearby (d< 25 pc) stars of various types to search for substellar companions at wide separations (greater than 10 AU) using the Clio IR camera on the 6.5 m MMT telescope with the adaptive secondary mirror (Lloyd-Hart 2000; Wildi et al. 2003; Brusa et al. 2004). Here, we report observations with MMT/AO and the Clio IR camera sensitive to giant planets at a wide range of orbital radii interior to the companion reported by Kalas et al. (2008).
2. OBSERVATIONS
Fomalhaut was imaged 2006 December 5 (02:06 UT) using the Clio 3–5 μm imager in conjunction with the adaptive secondary mirror on the 6.5 m MMTO telescope. The MMT Adaptive Optics system uses a deformable secondary mirror to provide atmospheric correction at a rate of 550 Hz, with 56 modes of equivalent Zernike correction being applied. The AO system and telescope are optimized for sensitivity in the thermal IR (Lloyd-Hart 2000), with an undersized secondary mirror (effective D = 6.35 m) delivering an f/15 beam to the science focus. The Clio detector is a high well depth Indigo InSb detector with 320 × 256 pixels and 30 μm size pixels (Hinz et al. 2006). Images were taken with a Barr Associates M-band filter with half power wavelength range of 4.47–5.06 μm with central peak wavelength of 4.77 μm.5 The field of view at M band is 156 × 124 on the Clio array. The star was nodded 55 along the long axis of the detector after five images were taken. Each of the 375 images consists of 50 co-added exposures of 209.1 ms length, for a total co-added duration of 3920 s. Exposure times were calculated so as to keep the sky flux counts just below the nonlinearity limit for the detector (around 40,000 ADU). Short exposures, typically of 64.1 ms were taken after the sequence of deep exposures so as to provide photometric check. To avoid variations in the pattern of illumination on the Clio detector, the instrument is fixed in orientation with respect to the telescope, resulting in total field rotation of 21° for our Fomalhaut data. Conditions were photometric, and the native seeing throughout the Fomalhaut imaging was ∼05–07 (as seen with the video rate optical acquisition camera) at an air mass of 2.1–2.8.
The pixel scale was determined from images of the A-type binary Castor on UT 2006 December 7 (orbit from Worley & Douglass 1996). The observed separation at M band was 90.93 ± 0.06 pixels, and the orbit predicted an angular separation of 4445, leading to a pixel scale of 48.88 ± 0.03 mas pixel−1.
3. ANALYSIS
The Clio images were reduced using a suite of custom C routines (Heinze 2007) that match temporally adjacent (or nearly adjacent) beam pair observations for background subtraction, then rotate and co-add the background-subtracted images into final images. Postage stamp images of all of the individual observations were inspected, and a small number of observations could have been rejected for poor image quality (i.e., during periods of poor seeing, or if the AO system loop was lost, or both) but we found that all 375 images were of good quality, and so none were rejected. Several methods of image combination are run as separate trials to determine the one with the most robust sensitivity, and are discussed in (Heinze 2007).
A separate data pipeline, using a combination of IRAF6 scripts and Perl Data Language7 code, provides an additional check to the custom C routines, and includes additional processing that uses roll subtraction techniques (Schneider & Silverstone 2003; Marois et al. 2006).
3.1. Astrometry of Fomalhaut
The science images are taken in bursts of five exposures at each beam switch location, during which time the AO system remains locked on Fomalhaut. The AO loop is then opened and the Clio camera repointed to the other beam switch position. The exposure times of these images are chosen to optimize detection of any putative planets, resulting in saturation of the Airy disk. The length of these exposures is 10.4 s.
To calculate the location of Fomalhaut, each science image is convolved with a circular aperture of diameter 9 pixels, and a two-dimensional paraboloid function is fit to the 3× 3 pixels, centered on the highest intensity pixel in the resultant convoluted image, to give the x and y centroids (xc, yc). To investigate whether these circularly convolved centroids provide a consistent measure of the star's location, we examined the centroid positions for each series of five sequential science images (xc1, yc1), ..., (xc5, yc5). The mean of these five centroids is calculated to give  along with their standard deviations, σ(xc), σ(yc). We also calculate the standard deviation σ(rc) of radial displacements (rc1), ..., (rc5) from the mean radial position
  . There are 75 sets of five exposures of Fomalhaut, shown as the solid line histograms of σ(xc), σ(yc), and σ(rc) in Figure 1.

Figure 1. Determining the astrometric accuracy of the observations of Fomalhaut. Five sequential science exposures are taken at each beam switch position. The mean and standard deviation are calculated for the centroid of the stellar image. Two methods for determining the star's location are compared—the first method uses a circular aperture smoothed image (solid lines), the second method uses a cross-correlation technique using a torus-shaped mask with the FWHM and radius of the third Airy ring (dotted lines). The vertical lines mark the mean value of these distributions. The lower right panel plots the difference of the centroid locations by the two different methods.
Download figure:
Standard image High-resolution imageThe X centroids show a standard deviation of 0.12 pixels, corresponding to a centering precision of 5.7 mas, whilst the Y-axis centroids show a smaller centering precision of 0.056 pixels (2.8 mas). The mean standard deviation of the radial component is 0.051 pixels, demonstrating that the AO system holds the location of Fomalhaut to about 1/20th of a pixel on the detector. To confirm that the centroids calculated from the circular aperture smoothed images are not dominated by systematic errors, we calculated centroids with an additional method.
The size of the secondary obscuration in the telescope pupil supresses flux in the second Airy ring, whilst enhancing it in the third Airy ring of the telescope's point-spread function (PSF). With the high Strehl ratio (typically 85%) attained at M band, the third Airy ring presents itself as a stable, unsaturated feature present in all the science images, which can act as an astrometric reference for the star. We perform centroiding of the third Airy ring using a cross-correlation technique. We generate a reference image with similar properties (FWHM and radius) of the measured Clio PSF third Airy ring. This model is cross-correlated with each science exposure, then a two-dimensional paraboloid is fitted to the brightest feature in the resultant image to obtain the centroids (xa, ya). The resultant distributions of the standard deviations are shown as dotted line histograms in Figure 1.
The histograms show that both the circular aperture convolution technique and the third Airy ring cross-correlation technique produce very similar centering precisions in both axes, typically within 10% of each other. The lower right panel of Figure 1 shows the differences in measured centroids between the two methods for all 375 science exposures. The mean of these residuals is marked by the location of the larger dot, and an ellipse whose major and minor axes represent the standard deviation of these residuals.
The X-axis of the array is parallel to the elevation axis of the MMTO telescope. The atmospheric dispersion expected at 2.1 air masses over the Clio M bandpass is influenced by the presence of water vapor and CO2 molecules and requires a detailed calculation (Mathar 2004), but we make a crude lower estimate of 14 mas using Cox (2000), which broadens the 192 mas FWHM PSF by 7% along the elevation axis, which is not significant enough to explain our observed elevation dispersion. We attribute this elevation broadening to the lack of an atmospheric dispersion corrector in the visible path of our wave front sensor, effectively producing a lower gain for the AO loop in the elevation axis.
We conclude that the unsaturated third Airy ring provides astrometry consistent with that obtained from circular aperture smoothed images of the saturated Airy cores. Furthermore, the astrometry is stable to within 1/20th of a pixel (2.4 mas) in the absence of chromatic effects. A more detailed discussion of the potential for high astrometric precision with adaptive optics is presented in Cameron et al. (2009).
3.2. Image Reduction
We use the method of Angular Differential Imaging (ADI; Marois et al. 2006) to calibrate out the presence of residual speckles in the instrument path. The data sets were split according to their beam switch and a master PSF for each beam position created. Any faint companions at constant position angle will be removed in the median combining to form the master PSF. This PSF is then subtracted off all the individual frames. The frames are then rotated so that north is up and east to the left, and then combined using a variety of sigma clipping rejection algorithms to produce the final sensitivity image. At small separations (less than 20), the images are contrast limited and not sky background limited, a result of the time varying nature of the aberrations in the telescope optics (Schneider & Silverstone 2003).
3.3. Photometry of Fomalhaut
Although Fomalhaut is a IR photometric standard (van der Bliek et al. 1996), the core of the star's PSF in our shortest exposure (64.1 ms) appears to be saturated. For this reason, the photometric calibration was tied to three other A-type stars observed that night: β UMa, ι UMa, and ζ Lep. The stars do not have published ground-based M-band photometry, but they do have published ground-based fluxes in the 1–8 μm range (Gezari et al. 1999) as well as predicted fluxes for the MSX mission at neighboring wavelengths (Egan & Price 1996). Based on the Gezari et al. (1999) and Egan & Price (1996) fluxes, we interpolate the following M-band magnitudes for our calibrator stars: m[4.8] = 2.34 mag (β UMa), 2.63 (ι UMa), and 3.27 (ζ Lep). Conservative photometric uncertainties are ±0.03 mag dispersion.
These three stars were observed at air masses from 1.05 to 1.45, allowing extrapolation of photometry to the air mass range (2.1–2.5) of the Fomalhaut observations. A second check of the photometry was performed by estimating Fomalhaut's flux using the unsaturated first Airy ring in the AO corrected images. These flux estimates agree with the air mass extrapolation to 10%, confirming the stability of the observing conditions during the whole night.
Our final co-added intensity image is shown in Figure 2. The residuals from the ADI PSF subtraction of the star are present as a speckle pattern surrounding the middle of the image. The red ellipse marks the location of the dust belt as imaged by Kalas et al. (2005). The location of the exoplanet Fomalhaut b is marked at the upper right of the image, out of the field of view of the combined Clio observations. The combination of beam switched images requires the masking of the negative beam switch, which when combined with the field rotation leads to the two triangular areas of no sky coverage within the larger image. For our field rotation of 21°, the median combining procedure removes any companions closer than 1.05 arcseconds (Marois et al. 2006). We mark this inner limit with a black circle centered on Fomalhaut in Figure 2.

Figure 2. Clio 5 μm image of Fomalhaut and environs. The location of Fomalhaut b (Kalas et al. 2008) is marked at the upper right, just off the field of view of the observations. The red ellipse marks the location of the dust belt at 140 AU (Kalas et al. 2005). The yellow ellipses represent distances of 20 AU and 40 AU from the central star. The image is scaled linearly. No significant point sources are detected in the image.
Download figure:
Standard image High-resolution image3.4. Sensitivity Estimation
In exoplanet imaging, there are several ways to express the expected point-source sensitivity at a given location in the final image. In this paper, we quantify this as the faintest source detectable at the 5σ level above the local background noise (Oppenheimer et al. 2003; Hinkley et al. 2007). We construct a sensitivity map from the 375 individual ADI-reduced science images. First, we combine the images to form both the mean intensity image and an image representing the standard deviation at each pixel location in the mean intensity image, using a sigma clipping routine to reject anomalous and outlier pixels from the final combination. In addition to the mean intensity and standard deviation images, an image representing the number of frames used to generate the first two images (a good pixel image) is also produced.
We estimate the mean flux of Fomalhaut in a 5 × 5 pixel (1.25λ/D) box, and then generate the sensitivity map by estimating the mean flux required for a 5σ detection at each point in the intensity image. The 5σ limit is calculated using the mean background noise within a 5 × 5 pixel box in the standard deviation image divided by the square root of the number of good frames at that pixel.
Assuming that the inclination of the dust belt is similar to the inclination of the orbital plane of any other planets in the Fomalhaut system, we can deproject our images to give a "face on" view of the whole system. Figure 3 is a deprojected and expanded view of Figure 2, showing contours of 5σ point-source sensitivity limits, using M-band fluxes from the COND models (Baraffe et al. 2003) to convert to planet masses for objects with temperatures <1800 K. Sensitivity curves for regions close to Fomalhaut are shown as azimuthally averaged plot in Figure 4. Although blind sensitivity tests have shown 50% completeness at 5σ observations (Heinze 2007), we keep our point-source sensitivities to be consistent with the limits quoted by other planet surveys.
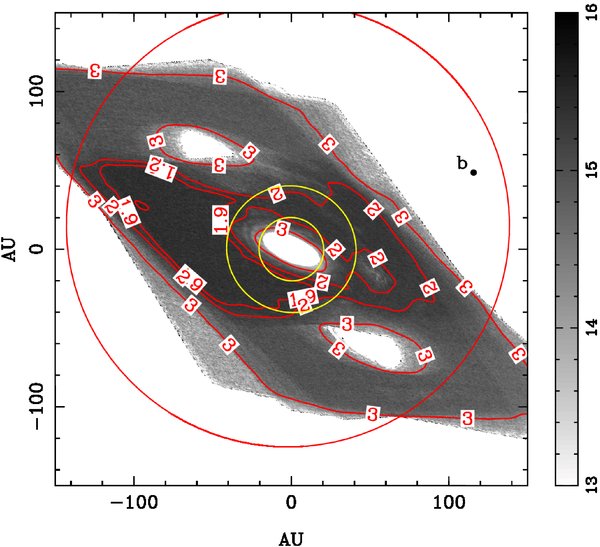
Figure 3. Deprojected sensitivity map of the Clio observations of Fomalhaut, showing 5σ sensitivity contours in Jupiter masses. The red circle marks the location of the dust belt, and the two yellow circles mark 20 and 40 AU, respectively. For small areas, we reach down to a 5σ detection limit of 1.85 MJup. The underlying image shows the 5σ sensitivity image in M-band magnitudes, as marked on the scale bar.
Download figure:
Standard image High-resolution image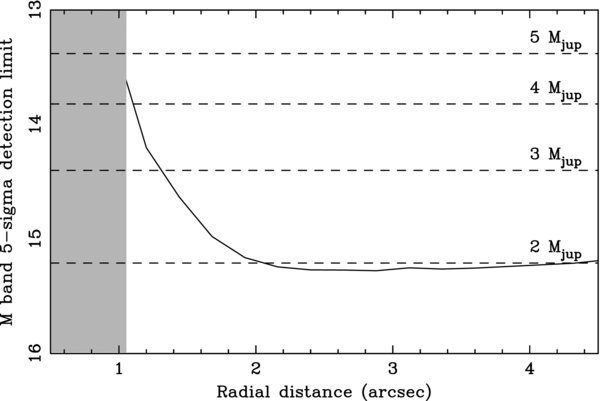
Figure 4. Azimuthally averaged contrast curve for the observations of Fomalhaut. The 5σ point-source M-band magnitude detection limit is calculated from the 375 individual Clio images. Mass limits for COND models are shown by the horizontal dashed lines.
Download figure:
Standard image High-resolution image
4. DISCUSSION
It is unclear whether there is any connection between the presence of gas giant planets and debris disks (Moro-Martín et al. 2007). Apai et al. (2008) searched within cold debris disks studied with Spitzer and found no evidence for large gas giant planets at large radii. With the discovery of a gas giant planet near the inner edge of its outer debris belt, the question arises: does Fomalhaut have giant planets at smaller radii? Current analysis of the debris system suggests inner (R < 20 AU) and outer (R >100 AU) planetesimal belts responsible for the bulk of the mid-IR and far-IR/submillimeter emission, respectively (Greaves et al. 1998; Stapelfeldt et al. 2004; Kalas et al. 2005). However, there is plenty of room for additional gas/ice giant planets in the system. Our upper limits rule out masses greater than 2 MJup between ∼13 and 40 AU. Models of dynamic scattering (Chatterjee et al. 2008; Scharf & Menou 2009) suggest that gas giants could end up at large separations due to planet–planet scattering. In this scenario, the largest planets in the system tend to stay put and smaller planets end up in large, eccentric orbits. Our results suggest this may not be an explanation for the location of Fomalhaut b.
One alternative is that giant planets have less 5 μm fluxes than theory suggests, either due to the presence of opacity in the upper atmosphere masking the underlying, hotter regions beneath (Orton et al. 1998) or because of nonequilibrium chemistry in the planet's atmosphere (Hubeny & Burrows 2007). In this early era of direct imaging, the question remains open as to which models explain the observed fluxes of giant exoplanets (Marois et al. 2008).
Barnes & Greenberg (2007) have explored the hypothesis that most planetary systems are "packed" in the sense that any orbit dynamically stable on timescales of order the age of the system or longer are inhabited. This implies that the planet formation process is very efficient indeed and is consistent with numerical integration of the orbits in our own solar system (Laskar 1996). This hypothesis found recent confirmation in the discovery of HD 74156 d (Bean et al. 2008) of the mass and orbit predicted. If Fomalhaut has a multiplanet system spaced like the solar system (or HR 8799 giant planets spaced logarithmically, spaced by ∼0.25 ± 0.05 dex in a), one would naively predict interior planets at radii ∼65, ∼35, and ∼20 AU. Spitzer detected evidence of a warm inner disk at <20 AU (Stapelfeldt et al. 2004). It is tempting to speculate that Fomalhaut's inner disk is likewise being perturbed by another planet. If Fomalhaut indeed has a packed system of planets between its inner (less than 20 AU) and outer (greater than 133 AU) debris belts, our M-band results suggest that planets in the ∼13–40 AU range are less than <2 MJup in mass. Chiang et al. (2009) suggest that Fomalhaut exhibits an "anomalous" acceleration in the Hipparcos astrometry (Perryman & ESA 1997; van Leeuwen 2007), consistent with a ∼30 MJup brown dwarf at r∼ 5 AU. Our observations also rule out the existence of brown dwarfs (greater than 13 MJup) at separations of ∼8–40 AU. Additional observations are planned to detect the thermal emission from Fomalhaut b in order to further explore its properties.
We thank the referees for their detailed comments that made a significant contribution to this paper. We thank the CfA TAC for allocating the MMT time that made these observations possible. We thank the MMT staff, especially John McAfee, Alejandra Milone, Mike Alegria, and Tim Pickering. We also thank Vidhya Vaitheeswaran and Thomas Stalcup for their support of the MMT/AO system. Clio is supported by grant NNG 04-GN39G from the NASA Terrestrial Planet Finder Foundation Science Program. M.A.K. is supported by grant NNG 06-GE26G from the NASA Terrestrial Planet Finder Foundation Science Program. E.E.M. was supported by a Clay Postdoctoral Fellowship during this observing program. M.R.M. acknowledges support through LAPLACE from the NASA Astrobiology Institute. M.A.K. thanks Andrew Skemer for discussions on atmospheric dispersion at thermal infrared wavelengths.
Footnotes
- *
Observations reported here were obtained at the MMT Observatory, a joint facility of the University of Arizona and the Smithsonian Institution.
- 5
Current information on the Clio camera and MMT adaptive secondary are available at the wiki website http://mmtao.org/wiki/doku.php?id=mmtao:clio
- 6
IRAF is distributed by the National Optical Astronomy Observatory, which is operated by the Association of Universities for Research in Astronomy, Inc., under cooperative agreement with the National Science Foundation.
- 7