


ABSTRACT
The recent detection by the Fermi γ-ray space telescope of high-energy γ-rays from the radio galaxy NGC 1275 makes the observation of the very high energy (VHE: E>100 GeV) part of its broadband spectrum particularly interesting, especially for the understanding of active galactic nuclei with misaligned multi-structured jets. The radio galaxy NGC 1275 was recently observed by VERITAS at energies above 100 GeV for about 8 hr. No VHE γ-ray emission was detected by VERITAS from NGC 1275. A 99% confidence level upper limit of 2.1% of the Crab Nebula flux level is obtained at the decorrelation energy of approximately 340 GeV, corresponding to 19% of the power-law extrapolation of the Fermi Large Area Telescope result.
Export citation and abstract BibTeX RIS
1. INTRODUCTION
The search for γ-rays from radio galaxies is important for the understanding of the dynamics and structure of jets in active galactic nuclei (AGNs). Radio galaxies are the only non-blazar extragalactic objects detected in the very high energy (VHE) range so far. Even though radio galaxies contain jets and are considered AGNs, their jet is not oriented toward the observer and therefore the radiation produced by the jet is not Doppler-boosted toward higher energies and luminosities, making them more challenging to detect in the VHE (E>100 GeV) regime. The discovery of VHE γ-rays from the radio galaxy M 87 by the HEGRA collaboration (Götting et al. 2003), detected later by VERITAS (Acciari et al. 2008a), and from NGC 5128 (Centaurus A) by the H.E.S.S. collaboration (Aharonian 2009) has shown that non-blazar AGNs can produce very energetic photons from nonthermal processes.
Radio galaxies are classified into two main families based on the morphology of their radio emission (Fanaroff & Riley 1974), whether it is core dominated (FR I) or lobe dominated (FR II). The differences between these two families can be found in the radio energetics and in the discrete spectral properties (Zirbel & Baum 1995). The large number of features that FR I radio galaxies share with BL Lac type blazars suggests a possible unification between the two sub-classes of AGNs, in which FR I radio galaxies are BL Lac objects observed at larger jet viewing angles (Urry & Padovani 1995).
Evidence for synchrotron emission in radio to X-ray energies from both the extended structures and the core is well explained by relativistic particles moving in a beamed relativistic jet (Ghisellini et al. 1993). A commonly considered mechanism for HE–VHE (HE: high energy, 100 MeV <E< 100 GeV) radiation is the synchrotron-self-Compton (SSC) process (Jones et al. 1974), where the optical and UV synchrotron photons are up-scattered by the same relativistic electrons in the jet. Predictions concerning the inverse Compton (IC) component have long been established for the γ-ray emission (Bloom & Marscher 1996) and frequency-dependent variability (Ghisellini et al. 1989). Besides leptonic scenarios, several models also consider a hadronic origin for nonthermal emission in jets. Accelerated protons can initiate electromagnetic cascades or photomeson processes (Mannheim 1993), or directly emit synchrotron radiation (Aharonian 2002; Reimer et al. 2004) and produce γ-rays through collisions with ambient gas (Beall & Bednarek 1999; Pohl & Schlickeiser 2000).
Modeling the blazar jet emission with a homogeneous SSC mechanism may imply particularly high Lorentz factors, Γ ≳ 50, with consequent high Doppler factors and small beaming angles θ ≃ 1° (Krawczynski et al. 2002). Such a small beaming angle is in conflict with the unification scheme according to which FR I radio galaxies and BL Lac objects are the same kind of object observed at different viewing angles. Moreover, these high values for the Doppler factor are in disagreement with the small apparent velocities observed in the sub-parsec region of the TeV BL Lac objects Mrk 421 and Mrk 501 (Marscher 1999). These considerations suggest a more complicated geometry; for example, a decelerating flow in the jet with a consequent gradient in the Lorentz factor of the accelerated particles and a smaller average Γ (Georganopoulos & Kazanas 2003). As a result of this gradient, the fast upstream particles interact with the downstream seed photons with an amplified energy density, because of the Doppler boost due to the relative Lorentz factor Γrel. The IC process then requires less extreme values for the Lorentz factor and allows larger values for the beaming angle. In a similar way, a jet spine-sheath structure consisting of a faster internal spine surrounded by a slower layer has also been suggested for the broadband nonthermal emission of VHE BL Lac objects (Ghisellini et al. 2005). This model is supported by radio maps which show a limb-brightened morphology (Giroletti et al. 2004) and may explain the HE–VHE emission observed in radio galaxies at larger angles (θlayer = 1/Γlayer ∼ 20°). Observation of the VHE component from radio galaxies is therefore significant for the multi-structured jet modeling, as it can be related to the external lower structure of the jet itself.
NGC 1275 (Perseus A, 3C 84) is a radio galaxy located in the center of the Perseus cluster and is one of the most unusual early-type galaxies in the nearby universe (z = 0.018). Its radio emission is core dominated, but it also has strong emission lines. In addition, the emission line system shows a double structure, corresponding to both a high-velocity and a low-velocity system. The puzzling nature of NGC 1275 makes it difficult to definitively classify it in a standard AGN sub-class. Its spectral energy distribution (SED) extends from radio to HE γ-rays. A source coincident with NGC 1275 at high confidence was recently detected in HE γ-rays by the Fermi γ-ray space telescope (Abdo et al. 2009a). The time-average spectrum observed between 2008 August and 2008 December is described by a power law in the energy range from 100 MeV to 25 GeV:
A radio luminosity similar to the typical values (Lr = 1042 (erg s−1)) of the BL Lac objects in the Large Area Telescope (LAT) bright AGN sample has also been reported (Abdo et al. 2009b), but no VHE detection above 100 GeV has been reported so far.
The broadband SED of NGC 1275 shows similarities with low-frequency-peaked BL Lac (LBL) objects. VHE γ-ray emission from LBLs is already established, namely from BL Lac (Albert et al. 2007) and from the two intermediate-frequency-peaked BL Lac (IBL) 3C 66A (Acciari et al. 2009) and W Comae (Acciari et al. 2008b). NGC 1275 is thus a potential VHE source.
2. VERITAS OBSERVATION
The VERITAS detector is an array of four 12 m diameter imaging atmospheric-Cherenkov telescopes located in southern Arizona (Weekes et al. 2002). Designed to detect emission from astrophysical objects in the energy range from 100 GeV to greater than 30 TeV, VERITAS has an energy resolution of ∼15% and an angular resolution (68% containment) of ∼0 1 per event at 1 TeV. A source with a flux of 1% of the Crab Nebula flux is detected in less than 50 hr of observations, while a 5% Crab Nebula flux source is detected in 2.5 hr. The field of view of the VERITAS telescopes is 35. For more details on the VERITAS instrument and the imaging atmospheric-Cherenkov technique, see Holder et al. (2008).
The Fermi γ-ray space telescope reported to its multi-wavelength partners the detection of NGC 1275 and a measurement of a hard γ-ray spectrum in the HE range in the autumn of 2008. VERITAS observed the core region of NGC 1275 for about 11 hr between 2009 January 15 and 2009 February 26. Data taken with poor weather conditions or technical problems are excluded, resulting in 7.8 hr of live time. The average zenith angle of the VERITAS observation is 30°. All data were taken in "wobble" mode (Fomin et al. 1994) where the telescopes are pointed away from the source by 05 north/south/east/west to allow for simultaneous background estimation using events from the same field of view.
3. ANALYSIS METHODS
Prior to event selection and background subtraction, all shower images are calibrated and cleaned as described in Cogan (2006) and Daniel et al. (2007). Several noise-reducing event-selection cuts are made at this point, including rejecting those events where only the two closest-spaced telescopes participated in the trigger. Following the calibration and cleaning of the data, the events are parameterized using a moment analysis (Hillas 1985). From this moment analysis, scaled parameters are calculated and used for the selection of the γ-ray-like events (Aharonian et al. 1997; Krawczynski et al. 2006). The event selection cuts are optimized a priori on a weak Crab-like source (photon index α = 2.5 and 3% Crab Nebula flux level). These selection criteria are termed the "standard cuts." As the VHE spectrum of NGC 1275 is unknown, the possibility that it could be considerably softer (photon index α>4) due to internal (slower bulk motion) or external (dust absorption) factors has been considered. A set of modified "soft cuts" are also applied by increasing the θ2 cut (the square of the angular distance of the nominal position of NGC 1275 from the reconstructed air shower direction) and decreasing the size cut (the minimum number of photoelectrons required in an image). Table 1 shows the set of cuts used in this work. Unless stated otherwise, the "standard cuts" are used to generate the results presented in this Letter.
Table 1. Selection Cuts Applied to the VERITAS Data for NGC 1275 and the Analysis Results
| Cuts | θ2 | Size | Eth | Edecorr | Nex | Nσ | 99% CL Upper Limit | ||
|---|---|---|---|---|---|---|---|---|---|
| (deg2) | (DC) | (GeV) | (GeV) | (cm−2 TeV−1 s−1) | (C.U.) | (cm−2 s−1) | |||
| Soft | <0.040 | >200 | 126 | 235 | 10.4 | 0.7 | 3.19 × 10⁻¹¹ | 0.028 | 1.27 × 10⁻¹¹ |
| Std. | <0.017 | >400 | 188 | 338 | −13.0 | −0.3 | 9.43 × 10⁻¹² | 0.021 | 5.11 × 10⁻¹² |
Notes. For each of the two sets of cuts, the nine columns show: the θ2 cut, the size cut in digital counts (1 DC ≃ 4.5 photoelectrons), the analysis energy threshold, the decorrelation energy, the total number of excess events, the corresponding significance according to Formula 17 in Li & Ma (1983), the differential upper limit at the decorrelation energy, the same upper limit in Crab Nebula units, the integral upper limit above the analysis energy threshold. A total of nine and five background regions have been used for the standard and soft cuts analysis, respectively. A power-law photon index of −2.5 has been assumed in the flux upper limit calculation. It is important to note that the upper limits for the standard and soft cuts are highly correlated.
Download table as: ASCIITypeset image
The reflected-region model (Berge et al. 2007) is used for background subtraction. The total number of events in the on-source region is then compared to the total number of events in the more numerous off-source regions, scaled by the ratio of the solid angles, to produce a final excess.
4. FERMI OBSERVATION
The published result from Fermi observation does not overlap with the VERITAS observation campaign. Additional data taken during the period from 2009 January 15 to 2009 February 26 have been therefore used in this work. A zenith angle cut at 105° has been applied to eliminate photons from the Earth limb.
The analysis follows the same procedure described in detail in Abdo et al. (2009a). A lower energy cut of 200 MeV has been applied to avoid strong systematic uncertainties of the lowest energy events. Science Tools version v9r15p2 and Instrumental Response Functions (IRFs) P6_V3_Diffuse (a model of the spatial distribution of photon events calibrated pre-launch) were used throughout this Letter. The Fermi-LAT data reveal a signal in the energy range between 200 MeV and 6.4 GeV of 14.0σ significance at the source location.
5. RESULT AND DISCUSSION
No significant excess is detected by VERITAS in the NGC 1275 data sample. Figure 1 shows the θ2 plot resulting from the standard cuts analysis. A 99% confidence level upper limit is calculated for both sets of cuts using the method described by Rolke et al. (2005) and assuming a Gaussian background. The results are reported in Table 1 where the differential flux upper limit at the decorrelation energy is shown. We define decorrelation energy as the energy that minimizes the dependence of the differential upper limit on the assumed photon index. Three different photon indices are considered, and three "upper limit functions" are hence calculated. The central value of the interval where they intersect is taken as decorrelation energy as shown in Figure 2. An integral flux upper limit above the analysis energy threshold (the energy corresponding to the maximum of the product function of the observed spectrum with the collection area, 188 GeV for standard cuts) is also shown. The soft-cuts analysis has the effect to lower the analysis energy threshold but also to increase the amount of residual background events. Since the decorrelation energy is above the standard-cuts analysis energy threshold in both analyses (see Table 1), we discuss hereafter only the result from the standard-cuts analysis as it provides a stronger background reduction.

Figure 1. θ2 plot for VERITAS observation of NGC 1275. The points with error bars represent the ON-source data sample, and the filled area is the background.
Download figure:
Standard image High-resolution image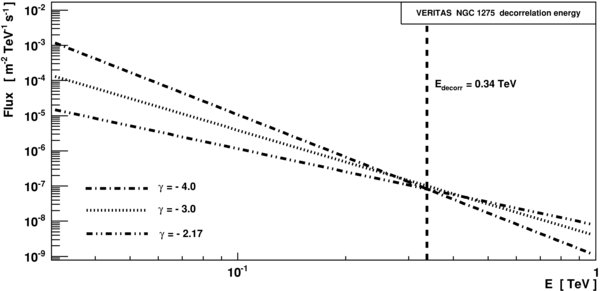
Figure 2. Decorrelation energy for the standard-cuts analysis on VERITAS data. Three different photon indices, −2.17, −3.0, and −4.0, are assumed for the power law used to calculate the flux upper limit. The central value of the interval where the three normalized power laws intersect is taken as decorrelation energy. The dependence of the differential flux upper limit on the assumed photon index is strongly reduced at the decorrelation energy. Assuming a photon index of −2.5, the effect of the photon index change within the values here considered at the decorrelation energy is about 15%.
Download figure:
Standard image High-resolution imageThe energy-binned analysis of the Fermi data taken over the VERITAS observation campaign shows a spectrum that can be fitted with the following power law from 200 MeV to 6.4 GeV:
There are some differences from the spectrum presented in Abdo et al. (2009a) and summarized in formula (1). The photon index is compatible within the error but the integral flux between 200 MeV and 6.4 GeV is a factor of 1.37 lower, F09int = (6.7 ± 0.88) × 10−8 cm−2 s−1, compatible with the 2008 integral flux within 2.8 standard deviations (F08int = (9.19 ± 0.50) × 10−8 cm−2 s−1). The lower flux confirms the hint of decreasing trend of the flux that was discussed in Abdo et al. (2009a), although the difference is statistically weak. In addition, the 2009 spectrum does not extend beyond ∼6 GeV, because of the overall lower flux and the limited observation time that both reduce the statistical significance of the events at higher energy.
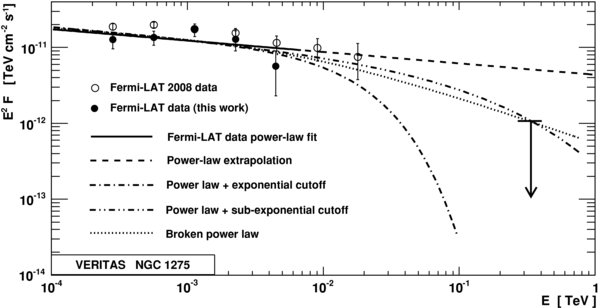
Figure 3 shows the VERITAS differential flux upper limit, calculated at the decorrelation energy of the standard-cuts analysis, together with the Fermi spectra. The lower statistical significance of the overall signal in the Fermi data simultaneously with the VERITAS observation, compared to the measurement in Abdo et al. (2009a), is visible in the larger error bars of the spectral points. The VERITAS upper limit is a factor of 5 below the extrapolation of the power-law fit between 200 MeV and 6.4 GeV of the Fermi data taken during the VERITAS observation campaign. Considering the proximity of the NGC 1275 galaxy (z = 0.018), negligible absorption by the interaction of VHE γ-rays on the extragalactic background light (EBL) is expected. Given 3 degrees of freedom for the data sample, the VERITAS upper limit implies a power-law fit with a normalized χ2/3 value of 2.97, corresponding to a probability of P(χ2) = 0.03. The large value of the χ2 probability is given by the large error bars of the spectral points due to the relatively short observation time and to the lower flux than the measurement in Abdo et al. (2009a), that both reduce the overall statistics of events especially at higher energy. Since the photon index does not change significantly and the extrapolated flux is still larger than the VERITAS flux upper limit, the same statistical test has been done on the spectrum in Abdo et al. (2009a) after applying a scaling factor of 1.35 to the spectrum itself. The result gives a normalized χ2/5 value of 4.57 with a probability P(χ2) = 3.6 × 10⁻⁴. We conclude that the upper limit is incompatible with an extrapolation of the power law from the Fermi data.
Figure 3. NGC 1275 spectrum and the VERITAS upper limit on the differential flux at the decorrelation energy 338 GeV (standard cuts). The solid circles with error bars are the measurement by the Fermi γ-ray space telescope during the VERITAS observation campaign. Empty circles with error bars are the measurement presented in Abdo et al. (2009a) from the energy-binned analysis. The solid line is the power-law fit to the Fermi data. The dashed line is the extrapolation of the power law. The dotted-dashed line is the fit of a power law with an exponential cutoff at 18 GeV. The double-dotted dashed line is the fit of a power law with a sub-exponential cutoff at 120 GeV, and the dotted line is the smooth broken power-law fit of a break energy at 16 GeV. All fits are done on the Fermi data analyzed in this work (solid circles).
Download figure:
Standard image High-resolution image
A deviation from the pure power-law spectrum is suggested. The Fermi data analyzed in this work are fitted using a power law with the addition of an exponential cutoff, imposing the constraint given by the upper limit. The VHE result is compatible with this function if the cutoff energy is Ecut ≈ 18 GeV. A normalized χ2/3 = 1.44 value is obtained for the fit. A power law with such an exponential cutoff in the IC component may arise from an electron energy distribution that follows a power law with a rather sharp cutoff.
Alternatively, if the energy distribution of the accelerated electrons in the jet follows a power law with an exponential cutoff in the form

where p is the electron spectral index, γ is the particle Lorentz factor, and γc is the Lorentz factor at the cutoff energy, the emitted synchrotron radiation flux and IC component, as a function of energy ϕ(E), would have a sub-exponential cutoff in the form

This sub-exponential cutoff is a reasonable approximation if the IC scattering proceeds in the Thomson regime. Fitting the Fermi-LAT data and including the VERITAS upper limit gives a cutoff energy Ecut ≈ 120 GeV and χ2/3 = 1.56. Probabilities of the χ2 quantile with 5 degrees of freedom are 0.23 and 0.20 for the exponential and sub-exponential cutoff result, respectively. The fit with a sub-exponential cutoff gives a smaller normalized χ2 value than the fit with the sub-exponential cutoff, but the difference is not significant. Both assumptions are therefore compatible with Fermi-LAT and VERITAS measurements.
Another possibility is that the measured power law steepens to a softer spectral index. This behavior arises if the accelerated electrons below a certain energy escape from their environment faster than the typical synchrotron radiation time. Assuming an electron injection in the jet following a power law Q(γ) ∝ γ−p and a constant and energy-independent leakage of particles per unit time, the stationary electron energy distribution may be approximated with the form

where γb is the energy at which the energy loss due to the leakage is equal to the synchrotron radiating energy loss. The IC component of the SED would assume the following form:

where νb is the break frequency in the IC component. For ν ≪ νb, Equation (6) asymptotically follows the power law ν(1−p)/2, and for ν ≫ νb the asymptotic limit becomes ν−p/2. Equation (6) thus represents a smooth transition from a power-law regime below the break frequency νb to a steeper power-law regime above the break frequency. In this scenario, the upper limit obtained by the VERITAS measurement implies a break energy Eb ≈ 16 GeV. The normalized χ2 obtained from the fit with function (6) is χ2/3 = 1.41. The probability of the χ2 quantile with 3 degrees of freedom is 0.24, similar to the probabilities obtained in the exponential- and sub-exponential-cutoff scenarios here considered.
It must be noticed that the result on the cutoff or break energy does not change significantly in the soft-cuts analysis since the corresponding upper limit is slightly less constraining due to the weaker background reduction.
6. CONCLUSIONS
VERITAS observed the radio galaxy NGC 1275 (Perseus A) for a total of 7.8 hr good-quality live time between 2009 January and 2009 February. The observation did not result in a detection, despite the strong flux and hard spectrum recently reported by Fermi up to 25 GeV during the 2008 campaign and despite the similar flux during the VERITAS observation campaign. Upper limits at 99% confidence level are calculated using two analyses optimized for Crab-like and softer spectra, respectively. In both cases, the flux upper limit is incompatible with an extrapolation of the power law measured by Fermi. Excluding absorption by the EBL, due to the proximity of the galaxy, the non-detection by VERITAS might be due to an intrinsic variability of the core. However, the Fermi-LAT data during the VERITAS observation campaign show a dim in flux by a factor 1.37 at the level of 2.8σ and no significant change in the photon index, compared to the 2008 data. A simple variability of the flux is, therefore, not sufficient to explain the non-detection by VERITAS. The possibility of intrinsic spectral curvature at VHE thus offers a viable explanation of the data, but such a spectral variation must generate a strong drop of the flux at an energy not much above the highest energy measured by Fermi-LAT. The upper limit in this work suggests an exponential cutoff in the Fermi spectrum at an energy E ≈ 18 GeV, or E ≈ 120 GeV in the case of a sub-exponential cutoff. In either case, the cutoff is likely above the maximum energy measured by Fermi and both assumptions are compatible with the Fermi and VERITAS measurements. The possibility that the source spectrum is a broken power law is also considered and is compatible with the data with a break energy of about 16 GeV.
This research was supported by grants from the U.S. Department of Energy, the U.S. National Science Foundation and the Smithsonian Institution, by NSERC in Canada, by the Science Foundation Ireland, and by STFC in the UK.
Facilities: FLWO (VERITAS)