


ABSTRACT
We present 2603 spectra of 462 nearby Type Ia supernovae (SNe Ia), including 2065 previously unpublished spectra, obtained during 1993–2008 through the Center for Astrophysics Supernova Program. There are on average eight spectra for each of the 313 SNe Ia with at least two spectra. Most of the spectra were obtained with the FAST spectrograph at the Fred Lawrence Whipple Observatory 1.5 m telescope and reduced in a consistent manner, making this data set well suited for studies of SN Ia spectroscopic diversity. Using additional data from the literature, we study the spectroscopic and photometric properties of SNe Ia as a function of spectroscopic class using the classification schemes of Branch et al. and Wang et al. The width–luminosity relation appears to be steeper for SNe Ia with broader lines, although the result is not statistically significant with the present sample. Based on the evolution of the characteristic Si ii λ6355 line, we propose improved methods for measuring velocity gradients, revealing a larger range than previously suspected, from ∼0 to ∼400  considering the instantaneous velocity decline rate at maximum light. We find a weaker and less significant correlation between Si ii velocity and intrinsic B − V color at maximum light than reported by Foley et al., owing to a more comprehensive treatment of uncertainties and host galaxy dust. We study the extent of nuclear burning and the presence of unburnt carbon in the outermost layers of the ejecta and report new detections of C ii λ6580 in 23 early-time SN Ia spectra. The frequency of C ii detections is not higher in SNe Ia with bluer colors or narrower light curves, in conflict with the recent results of Thomas et al. Based on nebular spectra of 27 SNe Ia, we find no relation between the FWHM of the iron emission feature at ∼4700 Å and Δm15(B) after removing the two low-luminosity SN 1986G and SN 1991bg, suggesting that the peak luminosity is not strongly dependent on the kinetic energy of the explosion for most SNe Ia. Finally, we confirm the correlation of velocity shifts in some nebular lines with the intrinsic B − V color of SNe Ia at maximum light, although several outliers suggest a possible non-monotonic behavior for the largest blueshifts.
Export citation and abstract BibTeX RIS
1. INTRODUCTION
Type Ia supernovae (SNe Ia) have received much attention due to their use as distance indicators on cosmological scales and the subsequent discovery of cosmic acceleration (Riess et al. 1998; Perlmutter et al. 1999). Their astrophysical nature, however, remains perplexing to this day. The standard model of SNe Ia involves the thermonuclear disruption of a carbon–oxygen (C/O) white dwarf (WD) star (Hoyle & Fowler 1960; this has been confirmed by recent observations of the nearby Type Ia SN 2011fe in M101; Nugent et al. 2011; Bloom et al. 2012) as it approaches the Chandrasekhar mass (MCh ≈ 1.4 M☉). To do so the WD either accretes material from a non-degenerate binary companion (the "single-degenerate" scenario) or merges with another WD star (the "double-degenerate" scenario; Iben & Tutukov 1984; Webbink 1984). Both scenarios constitute plausible progenitor channels, and can accommodate variations in the total mass of the binary system (i.e., sub- and super-MCh; see Howell 2011 for a recent review).
The favored explosion mechanism involves the transition from a turbulent subsonic burning front propagating via thermal conductivity (known as a deflagration, e.g., Nomoto et al. 1984) to a supersonic detonation propagating via a strong shock (Khokhlov 1991). The deflagration phase synthesizes iron-peak elements, of which 56Ni is needed to power the light curve through the 56Ni→56Co→56Fe decay chain. It also pre-expands the WD so that the subsequent detonation burns the leftover C/O fuel at lower densities and synthesizes sufficient amounts of intermediate-mass elements (IMEs; e.g., Si, S, Ca) at high expansion velocities, which are needed to reproduce observed spectra (e.g., Branch et al. 1982). Recent multi-dimensional simulations highlight the importance of hydrodynamical instabilities during the deflagration phase (e.g., Gamezo et al. 2005; Röpke & Niemeyer 2007) and provide a physical basis for the deflagration-to-detonation transition (DDT; e.g., Woosley et al. 2009), although this DDT is artificially triggered based on pre-defined criteria (see, e.g., Kasen et al. 2009; but see Poludnenko et al. 2011 for three-dimensional simulations of spontaneous DDTs in unconfined media).
Since the first spectrophotometric measurements of an SN Ia (SN 1972E; Kirshner et al. 1973), detailed observational studies of individual objects have revealed a wide range of photometric and spectroscopic properties, including luminous 1991T/1999aa-like events (e.g., Filippenko et al. 1992b; Garavini et al. 2004), faint 1991bg-like SNe (e.g., Filippenko et al. 1992a; Leibundgut et al. 1993; Garnavich et al. 2004; Taubenberger et al. 2008), peculiar 2002cx-like events (e.g., Li et al. 2003; Phillips et al. 2007), and high-luminosity SNe Ia speculated to originate from super-Chandrasekhar-mass progenitors (e.g., Howell et al. 2006; Scalzo et al. 2010). This observed diversity contrasts with the apparent homogeneity of the SN Ia class, the majority of which seems to obey an empirical relation between the peak luminosity and the width of the light curve (the so-called width–luminosity relation or WLR; Pskovskii 1977; Phillips 1993), which is needed to normalize SN Ia luminosities for precise distance measurements. Several large sets of optical SN Ia light curves have already been published (Hamuy et al. 1996; Riess et al. 1999; Jha et al. 2006; Hicken et al. 2009; Contreras et al. 2010; Ganeshalingam et al. 2010; Stritzinger et al. 2011), but until the recent publication of 432 spectra of 32 SNe Ia by Matheson et al. (2008), there had been no large homogeneous spectroscopic data sets of nearby SNe Ia available.
The SN group at the Harvard–Smithsonian Center for Astrophysics (CfA) initiated an ambitious observational program in 1993 (PI: R. P. Kirshner) using the telescopes at the Fred Lawrence Whipple Observatory (FLWO) on Mount Hopkins, Arizona. The aims of the CfA SN Program are to obtain well-sampled light curves and multi-epoch spectroscopy of nearby (z < 0.015) SNe of all types, to study their astrophysical nature, and to provide a homogeneous low-redshift sample for cosmological analyses using SNe Ia. We follow SNe announced in IAU circulars,12 discovered for the most part by the Lick Observatory Supernova Search (LOSS) using the robotic Katzman Automatic Imaging Telescope (KAIT; Filippenko et al. 2001) and by dedicated amateur astronomers. In return we provide spectroscopic classifications for a large fraction of SN discoveries: During 1997–2007, we classified over 40% of all nearby SNe visible from Mount Hopkins and announced our results in 499 IAU circulars. These prompt classifications are important to the community and serve as the basis for triggers of other SN follow-up programs (e.g., by the Swift SN group; Milne et al. 2010).
We were not able to follow up all SNe announced in circulars, and so had to prioritize our follow-up strategy. We assigned the highest priority to (1) SNe Ia discovered before maximum light (we sometimes relaxed this requirement to follow up peculiar objects), (2) bright Type Ib/c SNe, to study both individual objects (e.g., SN 2006aj, Modjaz et al. 2006; SN 2008D, Modjaz et al. 2009) and the connection of broad-line SNe Ic with gamma-ray bursts (e.g., Modjaz et al. 2008), and (3) bright Type IIP SNe discovered within ∼2 weeks from explosion for distance determinations via a variant of the Expanding Photosphere Method (Kirshner & Kwan 1974; e.g., Dessart et al. 2008).
We have already published several large collections of optical SN Ia light curves obtained with the FLWO 1.2 m telescope (CfA1: 22 BVRI light curves, Riess et al. 1999; CfA2: 44 UBVRI light curves, Jha et al. 2006; CfA3: 185 UBVRr'Ii' light curves, Hicken et al. 2009), as well as a sample of 21 near-infrared (NIR; JHKs) light curves obtained with the robotic PAIRITEL 1.3 m telescope (Wood-Vasey et al. 2008). Spectra of individual SNe Ia have been published in several papers (SN 1998aq, Branch et al. 2003; SN 1998bu, Jha et al. 1999b; SN 1999by, Garnavich et al. 2004; SN 2001ay, Krisciunas et al. 2011; SN 2001eh and SN 2001ep, Sauer et al. 2008; SN 2002cx, Li et al. 2003; SN 2005cf, Wang et al. 2009b; SN 2006bt, Foley et al. 2010; SN 2006gz, Hicken et al. 2007), including the large sample of 432 spectra of 32 SNe Ia (including SN 1998aq and SN 1998bu) published by Matheson et al. (2008). A study of the use of spectroscopic indicators in determining distances to SNe Ia in the Hubble flow was published by Blondin et al. (2011b), based on 47 spectra of 26 SNe Ia (including 15 spectra of nine SNe Ia from the Matheson et al. 2008 sample).
Here, we present the second large release of SN Ia spectra from the CfA SN Program taken between 1993 October and 2008 August. This sample consists of 2603 spectra of 462 SNe Ia, of which 2065 spectra of 406 SNe Ia are published here for the first time. It includes new reductions of spectra taken during 1994–1997 of SNe Ia that were part of the CfA1 light-curve sample. Unlike Matheson et al. (2008), we include spectra of all SNe Ia13 taken during this 15 year period, regardless of sampling and whether or not a well-calibrated light curve was available. The main reason for doing so is that a large fraction of the 149 SNe Ia for which we only have a single spectrum were classified by us, and we wish their spectra to be publicly available. Another reason is that other groups might have well-sampled light curves of objects for which we were unable to determine a time of maximum light, adding value to the "phaseless"14 spectra presented here.
The resulting sample spans a large range of SN Ia properties and is ideal for studies of spectroscopic diversity, which is the aim of this paper. In Section 2, we present the spectroscopic observations and data reduction techniques. Section 3 comments on the general properties of the CfA sample of 462 SNe Ia. In Section 4, we present the spectroscopic classification schemes of Branch et al. (2006) and Wang et al. (2009a), and study the properties of SNe Ia in these different subclasses. Section 5 focuses on the characteristic Si ii λ6355 line of SNe Ia, studying its velocity evolution and relation to intrinsic color. In Section 6, we analyze the extent of nuclear burning and the presence of high-velocity features (HVFs) and unburnt carbon in early-time spectra. Section 7 examines the relation between the FWHM of nebular iron lines and luminosity, and between nebular line shifts and intrinsic properties of SNe Ia at maximum light. Conclusions follow in Section 8.
All 2603 spectra presented in this paper will be made publicly available through the CfA Supernova Archive.15
2. OBSERVATIONS AND DATA REDUCTION
In this section, we summarize our observational strategy and data reduction methods. These are essentially identical to the ones presented by Matheson et al. (2008), but we highlight a few differences and provide additional information when needed.
2.1. Observations
As with the sample of 432 spectra published by Matheson et al. (2008), the majority of spectra presented here (2447 out of 2603 spectra or ∼94%) were obtained with the FAST spectrograph (Fabricant et al. 1998) mounted on the Tillinghast 1.5 m telescope at FLWO. The FAST spectrograph has been operational since 1994 January and the first SN Ia spectrum was one of SN 1994D taken on 1994 March 10 (all dates are given in UT). The observations were carried out in queue-scheduled mode, for the most part by two professional observers (P. Berlind and M. L. Calkins, who observed ∼72% of the FAST spectra presented here), as well as by CfA personnel. A total of 79 individual observers contributed to the FAST SN Ia sample presented here. During 1997–2008, typically 2–3 spectra were taken each night FAST was scheduled on the FLWO 1.5 m, namely, ∼20 nights per month, excluding August which corresponds to the annual shutdown at FLWO during the monsoon season. During 1994–1996, typically a single spectrum was taken in any given night. Observational details of the spectra are given in Table A1.
The usual setup for observations with FAST consisted of a ruled grating with 300 lines per mm and a 3'' slit, yielding a typical FWHM resolution of 6–7 Å over a wavelength range of ∼3700 to ∼7500 Å. From 2004 September onward (starting with observations of SN 2004dt), we changed the standard setup, extending it down to ∼3500 Å to cover the entire Ca ii H&K absorption profile. For a few SNe Ia (SN 1996ai, SN 1999by, SN 1999dq, SN 2001eh, SN 2001ep, and SN 2002bo) we requested additional observations with a different grating tilt to extend the wavelength range beyond 9000 Å. Other programs in the FAST queue would sometimes request different instrument setups, either with narrower slits (1 5 and 2'') or with a higher-resolution grating (cf. spectra of SN 1995ac, SN 1998aq, SN 1998bu, SN 1999by, and SN 1999cl). For most of the observations obtained during 1994–1998, the slit was oriented at a position angle of 90°. From late 1998 onward, the slit was generally positioned at the parallactic angle (unless the object was at airmass ≲ 1.1) so as to minimize the effects of atmospheric dispersion (Filippenko 1982). Table A1 gives the slit position angle for each spectrum as well as the absolute difference, |ΔΦ|, with the actual parallactic angle.
Additional spectra were obtained during classically scheduled nights at the MMT Observatory 6.5 m telescope with the Blue Channel (131 spectra) and Red Channel (3 spectra) spectrographs (Schmidt et al. 1989). A number of different spectrograph settings were used, yielding FWHM resolutions ranging between ∼3 and ∼13 Å, with a wavelength range typically extending below 3500 Å and beyond 8000 Å. A few spectra were taken with two settings of the Blue Channel spectrograph with non-overlapping wavelength ranges. This only concerns the five MMT spectra taken on 1994 June 12 (SN 1994D, SN 1994M, SN 1994Q, SN 1994S, and SN 1994T), all of which have ∼400 Å wide gaps (∼6150–6550 Å) between the two portions of the spectra. These spectra have been clearly marked in Table A1.
Last, a few spectra were obtained with the Magellan 6.5 m Clay (+LDSS-2/LDSS-3; 21 spectra) and Baade (+IMACS; one spectrum of SN 2003kf) telescopes. The FWHM resolution varies between ∼9 and ∼18 Å for LDSS-2, 9–12 Å for LDSS-3, and 5–6 Å for IMACS. The spectra taken with the Magellan 6.5 m telescopes typically do not reach bluer wavelengths than the FAST spectra, but they generally extend beyond 9000 Å.
2.2. Data Reduction
The data reduction methods are the same as those presented by Matheson et al. (2008), and we refer the reader to that paper for complementary information. The FAST data were all reduced in the same consistent manner. This also applies to FAST data from 1994–1997 that were entirely re-reduced for the purposes of this paper (this enabled the recovery of two spectra of SN 1997do and SN 1997dt accidently omitted from the data set published by Matheson et al. 2008). The resulting FAST sample of 2447 spectra makes this by far the largest homogeneous SN Ia spectroscopic data set to date.
We used standard routines in IRAF16 to correct the CCD frames for overscan. The bias frames are sufficiently uniform so that we do not subtract them to avoid introducing additional noise. We did not correct for dark current as it is typically negligible with FAST. As noted by Matheson et al. (2008), however, a few spectra are affected by dark-current problems after UV flashing, resulting in a small emission feature at ∼7100 Å (observed) and increased noise in the red portion of the spectrum. For a handful of spectra taken in 1998 (SN 1998cs, SN 1998de, SN 1998ec, and SN 1998eg), the signal-to-noise ratio (S/N) degradation is large enough that we have simply trimmed off affected portions of the spectra (these have been clearly marked in Table A1). The CCD frames are then flat-fielded using a combined normalized flat-field image. One-dimensional spectra are then optimally extracted using the algorithm of Horne (1986) as implemented in the IRAF apall package. These spectra are then wavelength calibrated using HeNeAr lamps taken immediately after (occasionally before) each exposure. The same procedure was applied to spectra taken with the MMT and Magellan 6.5 m telescopes, although we subtracted a combined bias frame before the flat-fielding stage. Subsequent reduction steps described below are common to all telescope/instrument combinations.
We use our own set of routines in IDL to flux calibrate the extracted one-dimensional wavelength-calibrated spectra. Aside from the actual flux calibration, these routines also apply small adjustments to the wavelength calibration based on night-sky lines in the SN frames, and apply a heliocentric correction. The spectrophotometric standard stars observed on the same night (see Table A1) are also used to remove telluric absorption features from the spectra (see, e.g., Wade & Horne 1988; Matheson et al. 2000). We did not re-reduce the 37 MMT spectra from 1993 to 1997 that were flux calibrated using standard procedures in IRAF.
Approximately 50% of the spectra listed in Table A1 were cross-calibrated with two spectrophotometric standard stars of different colors to overcome the impact of second-order light contamination. Prior to the FAST refurbishment in 2003 August, the spectrograph blocked blue light such that the FAST spectra until SN 2003gq do not suffer from this effect (FAST spectra taken between 1997 September and 2003 July were usually calibrated with a single standard star). Starting in 2003 September, two standard stars were systematically used for the flux calibration. Our new reductions of the 1994–1997 data also uses two standard stars for consistency with the 2003–2008 data set, although the impact on the resulting flux calibration is minor.
Figure 1 illustrates our flux calibration technique with two standard stars on the FAST spectrum of SN 2008bf at 1 day past B-band maximum. On the same night as a given SN observation, we observed a relatively blue standard star (here Feige 34, sdO spectral type; top panel) and a relatively red standard star (here HD 84937, sdF spectral type; middle panel). The blue standard yields a more accurate flux calibration in the blue due to a greater number of counts and the absence of a Balmer jump, which complicates the calibration around 4000 Å, while the red standard yields a better calibration in the red where it does not suffer as much from second-order contamination. One clearly sees that the blue standard Feige 34 is poorly calibrated by the red standard blueward of ∼4000 Å (top panel; red line), while applying the blue standard to calibrate the red standard HD 84937 results in a flux deficit redward of ∼6000 Å (middle panel; blue line). The SN spectrum is calibrated using both standard stars (bottom panel), and the two resulting spectra are combined in a ∼100 Å wide region around ∼4500 Å (i.e., slightly redward of the Balmer jump). Blueward (redward) of this region, the spectrum calibrated using the blue (red) standard is used. The impact on the final spectrum (bottom panel; black line) may not seem spectacular, but we clearly recover flux in the Ca ii H&K absorption region and redward of the Si ii λ6355 line.

Figure 1. Illustration of our flux-calibration procedure with one "blue" (Feige 34; top panel) and one "red" (HD 84937; middle panel) spectroscopic standard star, applied to the FAST spectrum of SN 2008bf at one day past B-band maximum (bottom panel). In all three panels, the blue (red) spectrum corresponds to a flux calibration using the blue (red) standard star. The gray shaded area highlights the wavelength interval used to combine the blue- and red-calibrated spectra of SN 2008bf. Blueward (redward) of this interval, the blue-(red-) calibrated spectrum is used to generate the final spectrum (black line). Both standard stars are also used to generate normalized telluric absorption spectra (black line in top and middle panels) which serve to remove these features (here the atmospheric B band) in the final SN spectrum (see inset in bottom panel; black line).
Download figure:
Standard image High-resolution imageWe also illustrate the removal of atmospheric absorption features, here the O2 B band around 6880 Å. Each standard star is used to derive a normalized telluric spectrum (top and middle panels; black line), which is then divided out from the SN spectrum after appropriate scaling (ratio of airmasses raised to some power α ≈ 0.6; see Wade & Horne 1988). The red standard star is more effective in removing these features, since the blue standard suffers from second-order contamination in these atmospheric bands. In this particular example the B band leaves a small imprint on the SN spectrum, but the inset in the lower panel of Figure 1 shows that this technique is successful in removing the unwanted absorption.
We can check the accuracy of the relative flux calibration of our spectra (no attempt was made to put the spectra on an absolute flux scale) by comparing the B − V color derived from photometry with that derived directly from the spectra (see Matheson et al. 2008, their Figure 4). We interpolated the corresponding B- and V-band light curves at the time each spectrum was taken, unless the difference was larger than 3 days (the interpolated measurements were visually cross-checked). FAST spectra taken before 2004 September do not extend to the blue edge of the B filter (3600 Å). We have run simulations based on the SN Ia spectral template of Hsiao et al. (2007) that show that even for spectra extending only down to 3750 Å the error on the inferred B − V color is less than 0.005 mag, so we include all the 1994–2008 FAST spectra in the comparison. The resulting 1128 B − V measurements are displayed in Figure 2. For SN spectra at phases less than 20 days past B-band maximum light taken within 10° of the parallactic angle (or at low airmass:  ; filled circles), the scatter around zero difference is ∼0.08 mag, slightly larger than the ∼0.06 mag scatter found by Matheson et al. (2008). The reason for this larger scatter is the inclusion of low-S/N spectra in our sample (S/N < 10 pixel−1). Three significant outliers (∼1 mag difference in B − V color) correspond to spectra of the 2002cx-like SN 2005cc that are contaminated by host-galaxy light.

Figure 2. Comparison of B − V color derived from spectra with that derived from photometric measurements (see Matheson et al. 2008, their Figure 4). We show measurements for spectra with phases less than 20 days past B-band maximum (circles), for which the difference between the position angle of the spectroscopic slit and the parallactic angle, noted |ΔΦ|, is less than (black) or greater than (blue) 10°. Spectra taken at low airmass ( ) are included in the |ΔΦ| < 10° measurements. The stars correspond to spectra at phases greater than 20 days past B-band maximum. In each case we indicate the magnitude scatter about the 1:1 relation (dashed line). The +63 day spectrum of SN 2005M has low S/N, SN 1996ai is the most highly reddened SN Ia in our sample (E(B − V) ≈ 1.8 mag), and the spectra of SN 2005cc are contaminated by host-galaxy light.
Download figure:
Standard image High-resolution imageThe scatter is ∼2 times larger for spectra not observed at the parallactic angle (|ΔΦ ⩾ 10°|), regardless of phase (open circles and open stars). The scatter is also significantly larger for SN spectra at phases greater than 20 days past maximum observed at the parallactic angle (filled stars). Possible reasons for this were already noted by Matheson et al. (2008): the spectra become dominated by prominent emission features, giving rise to systematic errors when multiplied by a filter that is not precisely matched to the photometry. The spectra are also fainter, increasing the impact of host-galaxy contamination.
We show example spectral series in Figure 3. Plots of all SNe Ia from the CfA SN Program will be made available alongside the actual data on the CfA SN Archive Web site.

Figure 3. Example SN Ia spectral series from the CfA SN Program. The flux units are fλ (erg s−1 cm−2 Å−1) that have been normalized and then additive offsets applied for clarity. The zero-flux level for each spectrum is marked with an extension on the red edge. The wavelength axis is corrected for the recession velocity of the host galaxy. The number associated with each spectrum indicates the phase in (rest-frame) days from B-band maximum. Spectra with low S/N have been binned; they are indicated with an asterisk appended to the phase label. Shown are spectra of two "normal" SNe Ia in the top row (SN 2007af and SN 2007co); one 1991bg-like (SN 2005ke), one 1991T-like (SN 2007S; the +59 day and +64 day spectra are strongly contaminated by the host galaxy), and one 2002cx-like (SN 2008A) SN Ia in the bottom row.
Download figure:
Standard image High-resolution image3. SAMPLE PROPERTIES
We briefly summarize the properties of the SN Ia sample presented in this paper in terms of phase, redshift, and Δm15(B) distributions, as well as the typical number of spectra per SN. We cross-checked the classifications of all SNe in our sample with those reported in circulars using the SNID code of Blondin & Tonry (2007). Three SNe Ia have no previously reported classifications: SN 2001es, SN 2003de, and SN 2004cu. One SN Ia (SN 1999bv) was misclassified as a "probable Type Ib/c" SN by Jha et al. (1999a), although its spectrum shows it to be a Type Ia SN at ∼3 months past maximum light (as noted by Matheson et al. 2001). All other SNe in our sample are classified as Type Ia in circulars.
We were able to determine a reliable time of B-band maximum (tmax(B); see Table 1) for 271 out of 462 SNe Ia, based for the most part on photometry from the CfA (Riess et al. 1999; Jha et al. 2006; Hicken et al. 2009) and from the LOSS (Ganeshalingam et al. 2010). We rely on a number of light-curve fitters for this purpose: MLCS2k2 (Jha et al. 2007), SALT2 (Guy et al. 2007), SNooPy (Burns et al. 2011), and the BayeSN statistical model of Mandel et al. (2009, 2011). When more than one estimate for tmax(B) is available, we simply take the mean value. For a few SNe we used values from the literature, in particular results from SNooPy fits to light curves from the Carnegie Supernova Program (CSP; Contreras et al. 2010; Stritzinger et al. 2011) by Burns et al. (2011) and Stritzinger et al. (2011). Estimates for six SNe Ia (SN 2001gc, SN 2002es, SN 2007fb, SN 2007fs, SN 2007kk, and SN 2008ae) were provided by the Berkeley SN group based on LOSS light curves (M. Ganeshalingam et al. 2011, private communication), while tmax(B) values for four of the five SNF SNe Ia in our sample were provided by the SNfactory collaboration (S. Bailey 2011, private communication). We thus have 191 SNe Ia with no reliable time of maximum (24 of which have B-band light curves). While this represents a sizeable fraction of the total number of individual SNe Ia in our sample, it is only a modest percentage of the total number of spectra (397 in 2603 spectra or ∼16%).
Table 1. Basic SN Parameters
| SN | za | tmax(B)b | Δm15(B)c | MBd | B − Ve | Bmax − Vmaxf | Phot. Ref.g |
|---|---|---|---|---|---|---|---|
| 1993ac | 0.0503 | 49269.2 (1.2) [Jha07] | 1.19 (0.10) [Phi99] | ... | ... | ... | CfA1 |
| 1993ae | 0.0190 | ...h | ... | ... | ... | ... | CfA1 |
| 1994D | 0.0029 | 49432.5 (0.1) [B,M,SA,SN] | 1.37 (0.03) [B] | ... | ... | ... | Jha07 |
| 1994M | 0.0232 | 49474.5 (0.9) [B,M,SA,SN] | 1.26 (0.06) [B] | −19.21 (0.08) | −0.11 (0.06) | −0.10 (0.06) | CfA1 |
| 1994Q | 0.0295 | 49496.2 (1.1) [Jha07] | 1.03 (0.10) [Phi99] | ... | ... | ... | CfA1 |
| 1994S | 0.0151 | 49518.3 (0.3) [B,M,SA,SN] | 0.94 (0.06) [B] | −19.55 (0.09) | −0.12 (0.05) | −0.11 (0.05) | CfA1 |
| 1994T | 0.0346 | 49514.4 (0.4) [M,SN] | 1.51 (0.08) [SN] | ... | ... | ... | CfA1 |
| 1994ae | 0.0043 | 49685.5 (0.8) [B,M,SA,SN] | 0.96 (0.04) [B] | ... | ... | ... | CfA1,Jha07 |
| 1995D | 0.0067 | 49768.7 (0.1) [B,M,SA,SN] | 1.05 (0.03) [B] | ... | ... | ... | CfA1,Jha07 |
| 1995E | 0.0120 | 49775.2 (0.5) [B,M,SA,SN] | 1.16 (0.05) [B] | ... | ... | ... | CfA1 |
Notes. aHeliocentric redshift as reported in NED (except for the redshifts given in Table 3). bMJD at the B-band maximum light. The 1σ error is given in between parentheses. The fitters used to determine tmax(B) are given in between square brackets: B: BayeSN (Mandel et al. 2009); M: MLCS2k2 (Jha et al. 2007); SA: SALT2 (Guy et al. 2007); SN: SNooPy (Burns et al. 2011). References to estimates taken from the literature are given below. In the case of multiple tmax(B) estimates the error is given as the standard deviation of the individual values. For cases where no error information was available we assume a typical 0.5 day uncertainty. cΔm15(B) decline rate in magnitudes. The 1σ error is given in between parentheses. The fitter used to determine Δm15(B) is given in the square brackets (see above). We assign a minimum 0.05 mag uncertainty to Δm15(B) estimates with SNooPy (which typically yield a formal ∼0.01 mag uncertainty). References to estimates taken from the literature are given below. dIntrinsic absolute peak B-band magnitude from BayeSN (assuming H0 = 72 km s−1 Mpc−1) for SNe Ia with zCMB ⩾ 0.01 and AV < 1 mag. eIntrinsic B − V color at the B-band maximum light from BayeSN for SNe Ia with zCMB ⩾ 0.01 and AV < 1 mag. fIntrinsic Bmax − Vmax pseudocolor from BayeSN for SNe Ia with zCMB ⩾ 0.01 and AV < 1 mag. gReferences for published photometric data used to determine tmax(B) and Δm15(B) (see below). References to "Jha07" are meant to point the reader to references given in Table 1 of Jha et al. (2007). hJha et al. (2007) give tmax(B) = 49288.08 ± 1.19, but the fit is uncertain (first photometric point > + 10 days past B-band maximum). iJha et al. (2007) give tmax(B) = 50630.25 ± 0.98 and Δm15(B) = 1.02 ± 0.10, but the fit is uncertain (first photometric point > + 10 days past B-band maximum). jJha et al. (2007) give tmax(B) = 50840.57 ± 2.02, but the fit is qualified by them as "poor." References. (BSNIP) Berkeley SN Ia Program (2011, private communication); (Buf05) Bufano et al. 2005; (Bur11) Burns et al. 2011; (CfA1) Riess et al. 1999; (CfA2) Jha et al. 2006; (CfA3) Hicken et al. 2009; (Con10) Contreras et al. 2010; (Gan10) Ganeshalingam et al. 2010; (Gan12) Ganeshalingam et al. 2012; (Hic07) Hicken et al. 2007; (Jha07) Jha et al. 2007 (and references therein); (Kas08) Kasliwal et al. 2008; (Kri10) Krisciunas et al. 2011; (Phi99) Phillips et al. 1999; (Phi07) Phillips et al. 2007; (Pri09) J. L. Prieto (2009, private communication; based on the method of Prieto et al. 2006); (Sca10) Scalzo et al. 2010; (SNF) SNfactory collaboration (2011, private communication); (Str11) Stritzinger et al. 2011; (Tau08) Taubenberger et al. 2008.
Only a portion of this table is shown here to demonstrate its form and content. Machine-readable and Virtual Observatory (VO) versions of the full table are available.
Download table as: Machine-readable (MRT)Virtual Observatory (VOT)Typeset image
The resulting phase distribution of the 2206 spectra for which we have a reliable tmax(B) estimate is shown in the left panel of Figure 4 out to 150 days past maximum. Also shown is the corresponding distribution for the sample of spectra published by Matheson et al. (2008), including nine spectra that were accidently omitted from their sample (see Table A1). There are 43 spectra at phases less than −10 days, and 381 spectra within 3 days from maximum light. Many of the SNe Ia in this sample have observations starting before maximum light. The right panel of Figure 4 shows the distribution of SN phases of the first spectrum. There are 23 SNe Ia for which the spectroscopic follow-up was initiated earlier than −10 days, and 168 SNe Ia with spectra starting prior to maximum light. We also have 21 spectra of 12 SNe Ia with spectra taken later than 150 days past maximum (see Table 2).

Figure 4. Distributions of SNe Ia for which we have a reliable estimate for the time of maximum light. Left: distribution of the number of spectra as a function of phase out to 60 days past maximum light. The hatched histogram corresponds to the SN Ia sample published by Matheson et al. (2008). The inset shows spectra at phases in the range [+60,+150] days. Right: number of SNe Ia vs. the phase of the first spectrum.
Download figure:
Standard image High-resolution imageTable 2. CfA SN Ia Spectra at 150 days Past Maximum or Latera
| SN | Phase |
|---|---|
| (days) | |
| 1994D | +611 |
| 1994ae | +152,+366 |
| 1995D | +275,+283 |
| 1998aq | +209,+229,+239 |
| 1998bu | +178,+189,+207,+216,+242 |
| 2000cx | +154,+181 |
| 2002bo | +310 |
| 2002cx | +308 (low S/N) |
| 2003kf | +397 |
| 2006X | +150 |
| 2007af | +301 |
| 2007sr | +190 |
Note. aSee Table A1 for more observational details.
Download table as: ASCIITypeset image
A clearer measure of the scientific potential of this sample is the number of SNe with at least N spectra. Figure 5 shows the corresponding distribution, for all 462 SNe Ia in our sample (solid line) and for the 191 with no time of maximum (dotted line). There are 92 SNe Ia for which we have at least 10 spectra, three of which have no reliable tmax(B) (SN 2002bz, SN 2003fd, and SN 2003iu). There are 20 SNe Ia with at least 20 spectra, and four objects with over 30 spectra (SN 1998bu, SN 2001V, SN 2002bo, and SN 2007af). There are on average eight spectra for each of the 313 SNe Ia with at least two spectra.

Figure 5. Number of SNe Ia with a least N spectra. The solid line is for all SNe Ia, while the dotted line corresponds to SNe Ia with no reliable estimate for the time of maximum.
Download figure:
Standard image High-resolution imageThe redshift distribution of our sample is shown in Figure 6. The median redshift is ∼0.023, and 361 SNe Ia are at z > 0.015 (nearby Hubble flow). The highest-redshift SN Ia in our sample, SN 1996ab at z ≈ 0.123, is part of the CfA1 light-curve sample of Riess et al. (1999). Nearly all redshifts are from the corresponding host galaxy as reported in the NASA/IPAC Extragalactic Database (NED; ∼40% are from the Updated Zwicky Catalog of Falco et al. 1999). For a few objects there is no NED redshift for the host galaxy, and we then determine our own redshift based on narrow emission or absorption lines from the host galaxy (either in the SN spectrum itself or on a separate host-galaxy spectrum; see Table 3), using the IRAF RVSAO package of Kurtz & Mink (1998). When no such lines are visible in the SN spectrum, we resort to cross-correlation with a library of SN spectra using SNID, and report the median redshift based on the top-five matches. For two SN Ia host galaxies the redshift reported by NED is in error: MCG +07-36-33, the host of SN 2003fa, has an NED redshift of 1800 km s−1 (de Vaucouleurs et al. 1991), where we measure z = 0.0404 (cz = 12, 125 km s−1; see Table 3) based on five emission lines (including [O ii] λ3727 and Hα). The host of SN 2002es, UGC 2708, has an NED redshift of 8523 km s−1 (Monnier Ragaigne et al. 2003) reported on the main page, where the correct redshift of 5394 km s−1 (de Vaucouleurs et al. 1991) is reported on the redshift subpage (this is confirmed by the Berkeley SN Group using an optical spectrum of UGC 2708; W. Li 2011, private communication). All other NED redshifts were found to be consistent with our own estimates. Four of the five SNe Ia in our sample discovered by the SNfactory occur in anonymous hosts. We derive their heliocentric redshifts based on the CMB-frame redshifts given in Table 2 of Bailey et al. (2009) and the coordinates as reported on the SNfactory Supernova Discoveries Web site.

Figure 6. Redshift distribution for the 462 SNe Ia in our sample. The hatched histogram corresponds to the SN Ia sample published by Matheson et al. (2008). There are four SNe Ia at redshifts larger than 0.075: SN 1999ce, SN 2006bu (part of the CfA3 light-curve sample), SN 2001bp, and SN 1996ab (part of the CfA1 light-curve sample).
Download figure:
Standard image High-resolution imageTable 3. SN Redshifts not taken from NED
| SN | Host | z | Ref.a |
|---|---|---|---|
| 1993ac | CGCG 307-023 | 0.0503b | abs |
| 1996ab | Anonymous | 0.123c | SNID |
| 1998ex | MCG +11-10-16 | 0.0365 | em |
| 2000dl | UGC 1191 | 0.0611 | abs |
| 2001eo | UGC 3963 | 0.066 | SNID |
| 2001es | 2MASX J2020834+1905246 | 0.0420 | em |
| 2002hu | MCG +06-6-12 | 0.0374 | em |
| 2003fa | MCG +07-36-33 | 0.0404d | em |
| 2003hw | 2MASX J03014982+3544343 | 0.0420 | abs |
| 2004gz | MCG +10-23-45 | 0.0137 | em |
| 2005ch | Anonymous | 0.027 | SNID |
| 2005lz | UGC 1666 | 0.040 | SNID |
| 2006bu | 2MASX J13524703+0518496 | 0.081 | SNID |
| 2007H | Anonymous | 0.0426 | em |
| 2007cq | 2MASX J22144070+0504435 | 0.0262 | em |
| 2007if | Anonymous | 0.0742e | 1 |
| 2007kf | Anonymous | 0.044 | SNID |
| 2007kg | 2MFGC 18005 | 0.006 | SNID |
| 2007qe | Anonymous | 0.0239 | em |
| 2008E | Anonymous | 0.034f | 2 |
| SNF20080522-000 | Anonymous | 0.0450g | 3 |
| SNF20080522-011 | Anonymous | 0.0379g | 3 |
| SNF20080623-001 | Anonymous | 0.0430g | 3 |
| SNF20080720-001 | Anonymous | 0.0209g | 3 |
Notes. aem: emission lines from the host galaxy in our own spectrum; abs: absorption lines from the host galaxy in our own spectrum; SNID: cross-correlation with SN Ia spectral templates using the SNID code of Blondin & Tonry (2007; typical error <0.005). bNED reports a redshift z = 0.049 based on the host-galaxy redshift given in IAUC 5882 (Schmidt et al. 1993). We have re-derived the redshift using the same spectrum of the host galaxy as Schmidt et al. (1993). cNED reports an approximate redshift z = 0.13 based on the blueshift of the Si ii λ5972 line (assumed to be 10,000 km s−1 in IAUC 6405; Garnavich et al. 1996); Riess et al. (1999) give log (cz) = 4.571, or cz = 37,239 km s−1 (z = 0.1242), "from (their) spectra of the host galaxies;" last, Jha et al. (2007) give cz = 37,109 km s−1 (z = 0.1238). There are no obvious galaxy lines in our spectrum of SN 1996ab nor could we find a spectrum of its host galaxy. dNED reports an erroneous redshift of cz = 1800 km s−1 (z = 0.0060) for MCG +07-36-33. eScalzo et al. (2010) report z = 0.07416 ± 0.00082 based on [O ii] λ3727 and Hα. fRedshift of a nearby galaxy cluster; the SN spectrum is consistent with this redshift. gBailey et al. (2009) report the CMB-frame redshift for this SN. We derived a heliocentric redshift using its coordinates as reported on the SNfactory Supernova Discoveries Web site. References. (1) Scalzo et al. 2010; (2) Yuan et al. 2008; (3) Bailey et al. 2009.
Download table as: ASCIITypeset image
The distribution of the light-curve width parameter Δm15(B)17 is shown in Figure 7 (see also Table 1). Of the 271 SNe Ia in our sample with tmax(B) information, 247 have a reliable Δm15(B) estimate. For most SNe we use the Δm15(B) inferred from our own BayeSN (185) or SNooPy (23) fits (we checked these were consistent with previously published values). For the remaining 39 objects, we take Δm15(B) values published in the literature (mostly from Jha et al. 2006; Ganeshalingam et al. 2010; Burns et al. 2011; Stritzinger et al. 2011). Our sample covers a large range in Δm15(B), from luminous SNe Ia with Δm15(B) ≈ 0.7 mag to faint ones with Δm15(B) ≳ 2.0 mag. There are 26 SNe in our sample with 1991T/1999aa-like spectra, while 34 have spectra similar to SN 1991bg or SN 1986G. Of the three SNe Ia with the smallest Δm15(B) in our sample, two (SN 2006gz, Hicken et al. 2007 and SN 2007if, Scalzo et al. 2010) were speculated to originate from super-Chandrasekhar-mass progenitors.

Figure 7. Histogram of the 247 SNe Ia for which we have a reliable Δm15(B) measurement. The hatched histogram corresponds to the SN Ia sample published by Matheson et al. (2008). There are four SNe Ia with Δm15(B) ≈ 0.7 mag (SN 2001ay, SN 2005lu, SN 2006gz, and SN 2007if) and three SNe Ia with Δm15(B) ≈ 2 mag (SN 1999by, SN 2006bz, and SN 2007hj).
Download figure:
Standard image High-resolution image4. SPECTROSCOPIC SUBCLASSES
We investigate how SNe Ia can be classified into various subclasses based on their spectra, using the classification schemes of Branch et al. (2006) and Wang et al. (2009a). We also attempt to quantify the spectroscopic and photometric variation within each subclass. Last, we present updated correlations of several spectroscopic indicators with Δm15(B). The results in this section are largely based on spectra from the CfA SN Program (see Section 3), but we complement them with published data from the literature, whose references are given in Table A2.
4.1. Branch and Wang Classification Schemes
4.1.1. Branch et al. (2006) Classification
Branch et al. (2006) presented a new classification scheme for SNe Ia based on measurements of the pseudo equivalent widths (pEWs) of absorption features near 5750 Å and 6100 Å (generally attributed to Si ii λ5972 and Si ii λ6355, respectively) in their maximum-light spectra. The overall shape of the Si ii λ6355 absorption also enters this classification scheme. They divided SNe Ia into four subgroups based on their position in this two-dimensional parameter space, but noted the absence of strict boundaries between them, suggesting that the different subgroups were not physically distinct but instead corresponded to a continuous distribution of properties (with the possible exception of SN 2002cx-like events).
Figure 8 (left) shows the pEW of the Si ii λ5972 line versus that of the Si ii λ6355 line for 218 SNe Ia (see Figure 2 of Branch et al. 2009), based on spectra within 5 days from maximum light (see Table 4). The different symbols correspond to the various spectroscopic subclasses defined by Branch et al. (2006). Example maximum-light spectra within each subclass are shown in Figure 9. The exact locations of the boundaries between the different subclasses are ill-defined, but this does not affect our analysis.

Figure 8. Left: pseudo-EW of the Si ii λ5972 absorption vs. that of the Si ii λ6355 absorption within five days from maximum light. When several measurements are available for a given SN within this phase range, we only show the measurement closest to maximum light. The different symbols correspond to the various spectroscopic subclasses defined by Branch et al. (2006). The inset corresponds to the region bounded by the dotted box in the main plot. Right: pseudo-EW of the Si ii λ6355 absorption vs. the absorption velocity of the same line within 3 days from maximum light. When several measurements are available for a given SN within this phase range, we only show the measurement closest to maximum light. The different symbols correspond to the various spectroscopic subclasses defined by Wang et al. (2009a). Note that peculiar SNe Ia (e.g., SN 2002cx, SN 2005cc, SN 2005hk, SN 2008A) are not included in this classification scheme. The dotted lines correspond to the mean pseudo-EW and mean vabs of the Si ii λ6355 line for the Normal sample (open circles).
Download figure:
Standard image High-resolution image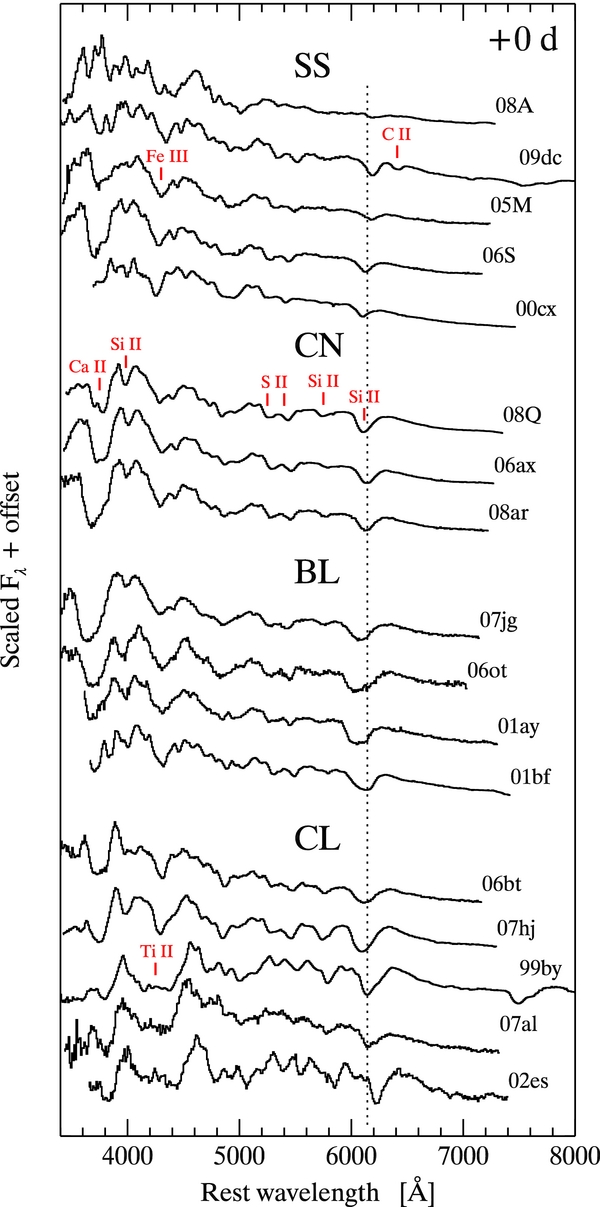
Figure 9. Montage of representative SN Ia spectra at maximum light in each of the spectroscopic subclasses defined by Branch et al. (2006). We indicate tentative line identifications corresponding to the dominant ion contribution to specific absorption features (the BL subclass shares the same line identifications as the CN subclass). The vertical dotted line corresponds to Si ii λ6355 blueshifted by 10,000 km s−1. All the spectra are from the CfA SN Program, except for the spectrum of SN 2009dc (Taubenberger et al. 2011).
Download figure:
Standard image High-resolution imageTable 4. SN Ia Classification using the Schemes of Branch et al. (2006) and Wang et al. (2009a)
| SN | pEW(λ5972)a | pEW(λ6355)b | vabs(λ6355)c | Phased | Branche | Wangf |
|---|---|---|---|---|---|---|
| (Å) | (Å) | (km s−1) | (days) | Class | Class | |
| 1981B | 9.1 | 128.6 | −12050 | −1.5 | BL | N |
| 1984A | 20.4 | 200.5 | −16251 | −2.8 | BL | HV |
| 1986G | 44.4 | 122.7 | −10128 | −0.2 | CL | 91bg |
| 1989B‡ | 20.9 | 120.6 | −10634 | −1.3 | BL | N |
| 1990N | 10.9 | 87.1 | −9352 | 1.6 | CN | N |
| 1990O | 6.7 | 91.1 | −12069 | −0.9 | CN | N |
| 1991M | 18.4 | 134.4 | −12458 | 2.7 | BL | HV |
| 1991T | 0.9 | 29.0 | −9660 | −1.5 | SS | 91T |
| 1991bg | 47.9 | 95.0 | −10004 | 0.9 | CL | 91bg |
| 1992A | 19.1 | 108.9 | −14192 | −0.8 | BL | HV |
Notes. aPseudo-EW of the Si ii λ5972 absorption feature (formal uncertainty typically <1 Å). bPseudo-EW of the Si ii λ6355 absorption feature (formal uncertainty typically <1 Å). cAbsorption velocity the Si ii λ6355 absorption feature (formal uncertainty typically <100 km s−1). dPhase of measurements in rest-frame days from B-band maximum. eBranch class based on pEW(λ5972) and pEW(λ6355) within 5 days from maximum light—CN: Core Normal; BL: Broad Line; SS: Shallow Silicon; CL: Cool. We also report a classification for SNe Ia with no spectra within 5 days from maximum (but within 7 days) based on the overall shape of the Si ii λ6355 absorption feature. fWang class based on vabs(λ6355) within 7 days from maximum light (note that Figure 8 only displays measurements within 3 days from maximum)—N: Normal; HV: High-velocity; 91T: 1991T-like; 91bg: 1991bg-like. Peculiar SNe Ia (SN 2000cx, SN 2002cx, SN 2003fg, SN 2005hk, SN 2006gz, SN 2007if, SN 2008A, SN 2008ae, SN 2009dc) are not part of this classification scheme. gSN 2003fg is also known as SNLS-03D3bb (Howell et al. 2006). †Reddening and contamination by the host galaxy renders the Branch classification uncertain. ‡Branch classification differs from that reported by Branch et al. (2009; indicated in parentheses)—SN 1989B: BL (CL); SN 1999ac: CN (SS); SN 1999ee: CN (SS); SN 1999gd: CN (BL); SN 2000E: CN (SS); SN 2002er: CN (BL); SN 2005cg: CN (SS).
Only a portion of this table is shown here to demonstrate its form and content. Machine-readable and Virtual Observatory (VO) versions of the full table are available.
Download table as: Machine-readable (MRT)Virtual Observatory (VOT)Typeset image
The cluster of black dots forms the "Core Normal" (CN) subclass. SNe Ia with similar pEW(Si ii λ5972) but with broader Si ii λ6355 absorptions (characteristic of larger expansion velocities) are labeled "Broad Line" (BL). Together, these subclasses constitute the bulk of SNe Ia loosely referred to as "normal" in the literature. There is no strict boundary between the CN and BL subclasses, although the SNe Ia we classify as BL have pEW(Si ii λ6355) ≳ 105 Å. As noted by Branch et al. (2009), there is not a one-parameter sequence from the CN subclass to the more extreme BL SNe Ia (such as SN 1984A, SN 2006X, and SN 2006bq). Two SNe Ia classified as BL by Branch et al. (2009) are re-classified by us as CN (SN 1999gd, SN 2002er; see Table 4) based on the magnitude of their pEW(Si ii λ6355). We also classify SN 2009ig in the CN subclass, as opposed to the BL subclass (see Parrent et al. 2011).
The "Cool" (CL) subclass consists of SNe Ia with deeper Si ii λ5972 absorptions, often associated with low-luminosity events. They are referred to as "Cool" due to the notable absorption band around ∼4200 Å caused by lines of Ti ii, a signature of lower temperatures in the line-forming region (see, e.g., Hatano et al. 1999). The strength of this absorption band varies greatly within the CL subclass: it is strong in SN 2005ke, moderate in SN 1986G, and close to nonexistent in SN 2007au. The CL subclass contains SN 2006bt, which has a slowly declining light curve characteristic of luminous SNe Ia but with spectra displaying Ti ii absorption features characteristic of low-luminosity SNe Ia (Foley et al. 2010). It also includes SN 2004eo, labeled "transitional" by Pastorello et al. (2007) due to its intermediate properties between normal and low-luminosity SNe Ia. Based on its resemblance to SN 2004eo, Branch et al. (2009) classified SN 1989B as a CL SN Ia despite its shallower Si ii λ5972 absorption. This SN also displays narrower features in the 4600–5100 Å spectral region, indicative of lower ejecta expansion velocities. However, the width of its Si ii λ6355 absorption is comparable to other BL SNe Ia, and we choose to include SN 1989B in the BL subclass (the developer of this classification scheme concurs; D. Branch 2011, private communication).
As seen from the inset in Figure 8 (left), there appears to be a continuous distribution between CL SNe Ia at the low end of the pEW(Si ii λ5972) distribution and CN and BL SNe Ia at the high end of their pEW(Si ii λ5972) distributions. However, we identify one CL SN Ia (SN 2007al) with a remarkably shallow silicon absorption. We include this SN in the CL subclass based on the presence of a prominent Ti ii absorption feature in its maximum-light spectrum (see Figure 9).
The last subclass, "Shallow Silicon" (SS), consists of SNe Ia with weak Si ii λ5972 and Si ii λ6355. It is a heterogeneous category, including luminous 1991T/1999aa-like events characterized by higher ionization lines (Fe iii), SNe Ia resulting from possible super-Chandrasekhar-mass progenitors (SNLS-03D3bb or SN 2003fg, SN 2006gz, SN 2007if, SN 2009dc), faint 2002cx-like SNe (SN 2005hk, SN 2008A), and otherwise spectroscopically "normal" events (e.g., SN 2006S). Several SNe Ia classified as SS by Branch et al. (2009) are re-classified by us as CN (SN 1999ac, SN 1999ee, SN 2000E, SN 2005cg; see Table 4) based on the magnitude of their pEW(Si ii λ6355). SN 1999ac was already noted as a borderline SS/CN by Branch et al. (2007), and its peculiar nature discussed at length by Garavini et al. (2005) and Phillips et al. (2006).
Of the 246 SNe Ia to which we assign a Branch et al. (2006) classification in Table 4, 94 (38.2%) are of the CN subclass, 74 (30.1%) are of the BL subclass, 43 (17.5%) are of the CL subclass, and 35 (14.2%) are of the SS subclass. Note that these numbers simply reflect the properties of the SN sample studied in this paper and not of the SN Ia class as a whole.
By ∼3 weeks past maximum light, spectra of SS SNe Ia are not distinguishable from those of the CN subclass at similar phases. By comparing the +19 day spectrum of the SN 1999aa to spectra of CN SNe Ia, Branch et al. (2009) found the best match to be SN 1994D at +14 days. The corresponding phase ratio (19/14 ≈ 1.36) closely matched the ratio of their B-band light curve stretch parameters (1.143/0.838 ≈ 1.36), prompting Branch et al. (2009) to suggest that SNe Ia from the CN and SS subclasses "age spectroscopically at the same rate that they decline photometrically." We have tested this hypothesis by finding the best-match CN SN Ia template to spectra of SS SNe Ia in the phase range [+19,+23] days using SNID, and plot the ratio of their phases against that of their stretch parameters (from SALT2) in Figure 10. While most SS SNe Ia indeed lie on or close to the 1:1 relation, there are a few significant outliers (including the peculiar SN 2000cx and the 1991T-like SN 1998ab), and the Pearson correlation coefficient between both ratios is only r = 0.36. We find similar results when considering SS SNe Ia at two and four weeks past maximum light, respectively. The hypothesis of Branch et al. (2009) therefore does not apply universally to SNe Ia of the SS subclass.

Figure 10. Ratio of phases of SN Ia spectra at three weeks past maximum in the SS subclass to that of the best-match SNID template in the CN subclass vs. the ratio of their B-band light-curve stretch parameters from SALT2. The labels associated with each point indicate the name of the SS supernova followed by the name of the best-match CN template. The dashed line is the 1:1 correspondence.
Download figure:
Standard image High-resolution imageThe spectroscopic properties of SNe Ia belonging to these different subclasses have been discussed at length by Branch et al. (2006, 2007, 2008) for maximum-light, pre-maximum, and post-maximum epochs, respectively, and by Branch et al. (2009) at all epochs based on a larger sample. Here, we focus on the spectroscopic variation at maximum-light. Within each subclass, we generate composite spectra using the same pre-processing as done by SNID: The individual spectra are "flattened" through division by a pseudo continuum. We then compute the mean flux in each wavelength bin, as well as the standard (and maximum) deviation from the mean. The result is a composite spectrum with error bands for each subclass, which we show in Figure 11. The large variation within the SS subclass is clearly visible throughout the optical range (3500–7500 Å). The CN subclass displays the smallest variation at any given wavelength, as expected, albeit with a noticeable variation in the strength of the Ca ii H&K absorption feature. The composite spectrum for the BL subclass reveals the presence of high-velocity components to the Si ii λ6355 line in the maximum-deviation spectrum (dark blue) in addition to the large variation blueward of ∼4000 Å as for the CN subclass (see, e.g., SN 2001bf and SN 2007jg in Figure 9). The CL composite spectrum shows the varying strength of the Ti ii absorption feature as well as the large range in depth and position of the Si ii λ6355 absorption (shallow in SN 2007al, less blueshifted in SN 2002es; see Figure 9).

Figure 11. Composite maximum-light spectra for the various spectroscopic subclasses defined by Branch et al. (2006). Individual spectra have been flattened through division by a pseudo continuum (see the text for details). The shaded bands correspond to the standard (light blue) and maximum (dark blue) deviation about the mean maximum-light spectrum. The number in between parentheses indicates the number of individual spectra that were used to generate each composite spectrum.
Download figure:
Standard image High-resolution imageIn a recent paper, Stritzinger et al. (2011) noted a similarity between the photometric properties of SN 2006ot and SN 2006bt (Foley et al. 2010): a broad light curve characteristic of luminous SNe Ia (Δm15(B) = 0.84 mag), but a weak secondary i-band maximum characteristic of low-luminosity events. They also noted major differences between both SNe in their maximum-light spectra. SN 2006bt has a deep Si ii λ5972 absorption and evidence for absorption by Ti ii, both of which are characteristic of low-luminosity SNe Ia. SN 2006ot, on the other hand, is characterized by a shallower Si ii λ5972 absorption and a broad Si ii λ6355 absorption, with no evidence for features associated with Ti ii. In the classification scheme of Branch et al. (2006), SN 2006bt belongs to the CL subclass, while SN 2006ot is an extreme BL SN Ia, reflecting these spectroscopic differences. Nonetheless, Stritzinger et al. (2011) argue that at 3–4 weeks past maximum light, the spectra of SN 2006ot are more similar to those of SN 2006bt than to those of the normal SN 2006ax (part of the CN subclass), again stressing the similarity between both SNe. At such late phases, however, differences between the various subclasses are less apparent than at maximum light, as noted by Foley et al. (2010).18 We have run SNID on the +24 day spectrum of SN 2006ot and find good matches to spectra of SNe Ia from the CN, CL, and BL subclasses at similar phases. The best-match spectrum of SN 2006bt (at +33 days) is ranked only 21st overall. Similarly, the best-match template spectrum for the +33 day spectrum of the CL SN 2006bt (Foley et al. 2010) is the CN SN 2004S (Krisciunas et al. 2007), illustrating the difficulty in distinguishing between different SN Ia subclasses at late times. If anything, SN 2006bt and SN 2006ot demonstrate how two SNe Ia with similar light-curve shapes can have very different maximum-light spectra.
4.1.2. Wang et al. (2009a) Classification
The classification scheme of Wang et al. (2009a) is based on the velocity at maximum absorption (or absorption velocity, vabs) of the Si ii λ6355 line around maximum light. It was designed to study the spectroscopic diversity among "normal" SNe Ia. We use our own measurements on the same sample of 10 SNe Ia used by Wang et al. (2009a) to define a mean vabs trend within one week from B-band maximum. SNe Ia with Si ii λ6355 absorption velocities 3σ above this mean trend (in absolute terms) are classified as "High-velocity" (HV), the remaining objects forming the "Normal" (N) subclass (see Table 4). Note that this classification scheme does not apply to luminous 1991T/1999aa-like SNe Ia nor to low-luminosity 1991bg-like events or peculiar objects (2002cx-like, possibly super-Chandrasekhar etc.). Of the 246 SNe Ia to which we assign a Wang et al. (2009a) classification in Table 4, 143 (58.1%) are of the N subclass, while 51 (20.7%) belong to the HV subclass. Again, these numbers simply reflect the properties of the SN sample studied in this paper and are not meant to reflect the SN Ia class as a whole.
This classification scheme is illustrated in Figure 8 (right), where we show the relation between the pseudo-EW of the Si ii λ6355 line versus its absorption velocity for SNe Ia with spectra within 3 days from maximum light. This figure is largely similar to Figure 2 of Wang et al. (2009a), with the Normal SNe Ia forming a cluster in the (pEW,vabs) plane, and a tail of High-velocity objects following a trend of larger pEW for larger absorption blueshifts. The mean pEW and mean vabs for the Normal sample are ∼95 Å and ∼ −11,000 km s−1, respectively, comparable to the values found by Wang et al. (2009a). At maximum light, the boundary between the N and HV subclasses is located at ∼ −12,200 km s−1. There is a large overlap between the CN subclass of Branch et al. (2006) and the Normal subclass of Wang et al. (2009a), as well as between the BL and HV subclasses (with a few exceptions such as SN 2009ig, which is part of the CN and HV subclasses). The 1991T-like objects have absorption velocities similar to the Normal subclass, but with smaller pEW. All 1991T-like SNe Ia belong to the SS subclass of Branch et al. (2006), except for the 1999aa-like SN 1999ac. SNe Ia with spectra similar to SN 1991bg also have similar velocities but on average larger pEW. Notable exceptions include SN 2007al with similar velocities but much smaller pEW (also an outlier in the CL subclass; see Figure 8, left), and SN 2002es with similar pEW but almost a factor of two lower |vabs|. This latter SN is discussed in more detail by Ganeshalingam et al. (2012). All 1991bg-like SNe Ia belong to the Cool subclass of Branch et al. (2006).
The largest measured Si ii λ6355 pEW and blueshift in Figure 8 is for SN 1984A (pEW ≈200 Å, |vabs| ≈ 16,250 km s−1). This SN is also the most extreme BL SN Ia in the classification scheme of Branch et al. (2006). We note that Wang et al. (2009a) measure pEW ≈170 Å and |vabs| ≈ 15,200 km s−1 (see their Figure 2), but their measurement is based on a non-flux calibrated spectrum directly scanned from Figure 4 of Barbon et al. (1989), biasing their pEW measurement to lower values. Moreover, their use of the classical Doppler formula (as opposed the relativistic version used in this paper; see Equation (6) in Blondin et al. 2006) leads to a ∼500 km s−1 lower blueshift when converting the wavelength at maximum absorption in Si ii λ6355 to a velocity.
4.2. Photometric Properties as a Function of Spectroscopic Class
Based on a restricted sample of nine SNe Ia from the CN subclass, Branch et al. (2009) inferred a mean absolute peak B-band magnitude of −19.48 mag with a scatter of only 0.14 mag, suggesting that SNe Ia belonging to this subclass could be true standard candles. They noted, however, that this should be tested on a larger sample of SNe Ia in the Hubble flow.
We use the BayeSN statistical models of Mandel et al. (2009, 2011) to infer the intrinsic peak absolute B-band magnitude (and hence the total extinction along the line of sight) of SNe Ia in a consistent manner (assuming a Hubble constant of H0 = 72 km s−1 Mpc−1; see Table 1). These statistical models describe the apparent distribution of light curves as a convolution of intrinsic SN Ia variations and a dust distribution. Mandel et al. (2011) modeled the intrinsic covariance structure of the full multi-band light curves, capturing population correlations between the intrinsic absolute magnitudes, intrinsic colors, and light curve decline rates over multiple phases and wavelengths, as well as the distribution of host galaxy dust and an apparent correlation between the dust extinction AV and its wavelength dependence, parameterized by RV. The models fit individual optical and NIR SN Ia light-curve data to estimate the dust extinction, apparent and absolute light curves, and intrinsic colors for each SN. These models were trained on a nearby (z < 0.07) set of SNe Ia with optical (CfA3, Hicken et al. 2009; Carnegie SN Program, Contreras et al. 2010) and NIR (PAIRITEL; Wood-Vasey et al. 2008) data, plus light curves from the literature with joint optical and NIR observations. For the fits used in this paper, we have employed the distance-redshift constraint, except where alternative distance information was used (e.g., Cepheids; see Section 7.2).
Figure 12 shows the resulting intrinsic peak MB distribution for SNe Ia at CMB-frame redshifts zCMB > 0.01 with an inferred visual extinction AV < 1 mag, for the various spectroscopic subclasses defined by Branch et al. (2006; top) and Wang et al. (2009a; bottom). The 41 SNe Ia in the CN subclass that satisfy these criteria have a mean intrinsic peak MB = −19.40 mag with σ(MB) = 0.16 mag. This is comparable to the values derived for the Normal subclass of Wang et al. (2009a) (MB = −19.38 mag; σ(MB) = 0.17 mag). The intrinsic peak MB scatter is small for the CN (or Normal) subclass, but it is in fact larger than for the SS (σ(MB) = 0.13 mag) and BL subclasses (σ(MB) = 0.15 mag; the same is also true when comparing the Normal subclass to the 91T and HV subclasses of Wang et al. 2009a). We note, however, that the SS distribution does not include faint 2002cx-like SNe Ia (which typically have MB ≳ −18 mag; e.g., MB ≈ −17.5 mag for SN 2002cx and MB ≈ −18.0 mag for SN 2005hk; see Phillips et al. 2007) nor luminous (possibly super-Chandrasekhar) events (e.g., SN 2006gz with MB ≈ −19.9, Hicken et al. 2007; or SN 2009dc with MB ≈ −20.2, Taubenberger et al. 2011) since BayeSN did not include such SNe Ia in its training set.

Figure 12. Normalized distributions of intrinsic peak absolute B-band magnitude for the various spectroscopic subclasses defined by Branch et al. (2006; top) and Wang et al. (2009a; bottom). The peak rest-frame magnitude and host-galaxy extinction were determined using the BayeSN light-curve statistical model of Mandel et al. (2011). Only SNe Ia with a CMB-frame redshift zCMB > 0.01 and an inferred visual extinction AV < 1 mag were included. In each panel we indicate the sample mean and standard deviation of the intrinsic peak MB (see also Table 5). The number of SNe Ia in each subclass is indicated in between parentheses. We do not show the distributions for the CL or 91bg subclasses since the BayeSN statistical model did not include SNe Ia with Δm15(B) > 1.6 mag in its training set. The same is true of faint 2002cx-like SNe Ia and luminous (possibly super-Chandrasekhar) events from the SS subclass.
Download figure:
Standard image High-resolution imageThe mean intrinsic peak MB increases steadily along the SS→CN→BL sequence, with a corresponding increase in the mean Δm15(B) (see Table 5). The same applies to the 91T→N→HV sequence. There is a hint of redder mean intrinsic B − V color for the BL (HV) subclass compared to the CN (N) subclass, as expected from the "brighter-bluer" relation of Tripp (1998), but the difference (0.02−0.03 mag) is small compared with the scatter (0.06–0.07 mag) within each subclass and only measurable with sample averages. Low-luminosity SNe Ia from the CL or 91bg subclasses are not included in this comparison since the BayeSN statistical model did not include SNe Ia with Δm15(B) > 1.6 mag in its training set. SNe similar to SN 1991bg have intrinsic peak B-band magnitudes ∼2 mag fainter than normal SNe Ia, with Δm15(B) ≳ 1.9 mag, and much redder intrinsic B − V colors at maximum light. A prime example is SN 2005bl, with MB ≈ −17.2 mag, Δm15(B) ≈ 1.9 mag, and (B − V)max ≈ 0.5 mag (Taubenberger et al. 2008).
Table 5. Mean Properties of SNe Ia in the Classification Schemes of Branch et al. (2006) and Wang et al. (2009a)
| Class | 〈MB〉 (σ) | 〈Δm15(B)〉 (σ) | 〈B − V〉 (σ) | NSN |
|---|---|---|---|---|
| SSa | −19.57 (0.14) | 0.94 (0.13) | −0.11 (0.07) | 21 |
| CN | −19.40 (0.16) | 1.12 (0.18) | −0.12 (0.06) | 41 |
| BL | −19.30 (0.15) | 1.22 (0.15) | −0.10 (0.07) | 37 |
| 91T | −19.59 (0.13) | 0.93 (0.14) | −0.12 (0.07) | 13 |
| Normal | −19.38 (0.17) | 1.15 (0.21) | −0.12 (0.06) | 67 |
| HV | −19.28 (0.16) | 1.21 (0.14) | −0.09 (0.07) | 23 |
Notes. SS: Shallow silicon; CN: Core Normal; BL: Broad Line; HV: High-velocity. Cool (CL) and 1991bg-like SNe Ia are not shown here (see the text for details). aExcluding 2002cx-like SNe Ia and super-Chandrasekhar events.
Download table as: ASCIITypeset image
One might wonder whether SNe Ia in different subclasses obey different width–luminosity relations (WLRs). Figure 13 (left) shows the intrinsic peak MB inferred from BayeSN fits versus Δm15(B) for the SS, CN, and BL subclasses of Branch et al. (2006). Overplotted are best-fit relations of the form MB = a[Δm15(B) − 1.1] + b for the entire sample (solid line) and for the individual subclasses (dashed and dotted lines). The coefficients of the linear fits are given in each case. The slope of the WLR gets steeper along the SS→CN→BL sequence, while the intercept corresponds to a progressively fainter fiducial intrinsic peak MB along this same sequence. The slopes and intercepts for the individual subclasses are, however, consistent within ∼1σ of one another, such that a single average WLR is adequate to describe all the subclasses (other than the CL subclass). As seen from the right panel of Figure 13, the same analysis holds when replacing (SS, CN, BL) with (91T, N, HV) for the Wang et al. (2009a) classification scheme, the only difference being the intercept for the HV subclass, which is ∼2σ larger than those for the Normal and 91T subclasses.

Figure 13. Width–luminosity relation for the various spectroscopic subclasses defined by Branch et al. (2006; left) and Wang et al. (2009a; right). We report the linear coefficients of the fit MB = a[Δm15(B) − 1.1] + b for the entire sample (solid line) and for the individual subclasses. Errors in parentheses are given in units of 0.001 and 0.001 mag for the slope and offset, respectively.
Download figure:
Standard image High-resolution image4.3. Spectroscopic Luminosity Indicators
Several authors have studied the correlation between various spectroscopic indicators and light-curve parameters with the aim to use such indicators to improve distance measurements to SNe Ia. Blondin et al. (2011b) showed that spectroscopic indicators alone could compete with the standard light-curve parameters for distance measurements, but that combining spectra with photometry yielded no statistically significant improvement (see also Silverman et al. 2012b). Their analysis, however, was based on a small number of SNe, so that larger samples may reveal spectroscopic measurements that provide independent information on the luminosity of SNe Ia. Such correlations are also potentially useful to constrain SN Ia models (see, e.g., Blondin et al. 2011a), and we investigate the relation of three spectroscopic indicators with Δm15(B) in Figure 14.

Figure 14. Various spectroscopic indicators vs. Δm15(B). The points are coded according to the spectroscopic subclasses defined by Branch et al. (2006), as in the left panel of Figure 8. The Pearson correlation coefficient is indicated in the upper left or upper right corner of each plot. Top: spectroscopic ratio  of Nugent et al. (1995; left) and its pseudo-EW equivalent (right). Bottom: pseudo-EW of the Si ii λ4130 line (left) and spectroscopic ratio
  (right; Hachinger et al. 2006).
Download figure:
Standard image High-resolution imageThe upper left panel shows the  ratio of Nugent et al. (1995; defined as the ratio of the relative absorption depth of the Si ii λ5972 line to that of Si ii λ6355), which is thought to define a temperature sequence from low-luminosity 1991bg-like SNe Ia to luminous 1991T-like events (see also Hachinger et al. 2008). The different symbols correspond to the spectroscopic subclasses defined by Branch et al. (2006), as in the left panel of Figure 8. There is a clear correlation of
  with Δm15(B) (the Pearson correlation coefficient is r = 0.82), with some notable outliers including two SNe Ia from the CL subclass: SN 2002fb and SN 2006bt (whose peculiar nature has been discussed at length by Foley et al. 2010). At low Δm15(B), the BL SN 2001ay (the most slowly declining SN Ia to date; Krisciunas et al. 2011) and the peculiar SS SN 2006gz (possibly resulting from a double WD merger; Hicken et al. 2007) are modest outliers.
The  ratio has a relatively large associated measurement error, since the relative absorption depth is measured at a specific wavelength. Using the ratio of pseudo-EW of both lines instead not only significantly reduces the error on individual measurements (since we are integrating over many wavelength bins), it also leads to a stronger and tighter relation with Δm15(B) (r = 0.86; upper right). SN 2006bt remains an outlier using the pseudo-EW ratio, but SN 2002fb now follows the linear relation defined by the bulk of the sample. As noted empirically by Hachinger et al. (2006), and later confirmed theoretically by Hachinger et al. (2008), it is the Si ii λ5972 line that drives the correlation of
  and its pseudo-EW equivalent with Δm15(B). Using the relative absorption depth or the pseudo-EW of the Si ii λ5972 line alone leads to equally strong correlations with Δm15(B) (r = 0.79 and r = 0.85, respectively, not shown).
The lower left panel shows the pseudo-EW of the Si ii λ4130 line versus Δm15(B) (see Bronder et al. 2008; Arsenijevic et al. 2008; Walker et al. 2011; Blondin et al. 2011b; Chotard et al. 2011). The correlation is very clear, although a nonlinear relation may need to be invoked to accommodate the CL SNe Ia at Δm15(B) ≳ 1.5 mag. The peculiar SN 2006gz is again a modest outlier, but SN 2001ay is now a significant outlier in this relation. The largest outlier however is the BL SN 2006ot (which was not a significant outlier in the  versus Δm15(B) relation), whose similarity in terms of photometric properties with SN 2006bt was noted by Stritzinger et al. (2011). We argued in Section 4.1.1 that both objects are spectroscopically distinct, and this is clearly visible in this plot, where SN 2006bt follows the same relation as the bulk of the SN Ia sample.
Finally, the lower right panel shows the  ratio of Hachinger et al. (2006), defined as the ratio of the pseudo-EW of the Si ii λ5972 line to that of the Fe ii λ4800 feature (see Blondin et al. 2011b, their Figure 14). The correlation with Δm15(B) is again very strong (r = 0.80). In contrast to pEW(Si ii λ4130), SN 2006bt is this time the largest outlier, while SN 2006ot lies close to the mean relation. As was the case for the
  ratio, both SN 2001ay and SN 2006gz are modest outliers. Since
  and the pseudo-EW equivalent of
  are both positively correlated with Δm15(B), one expects the pseudo-EWs of Fe ii λ4800 and Si ii λ6355 (at maximum light) to also be correlated. There is indeed a modest correlation (r = 0.60) between pEW(Si ii λ6355) and pEW(Fe ii λ4800), but the scatter is large and the relation flattens off for pEW(Fe ii λ4800) ≳ 150 Å.
5. LINE VELOCITIES
We now focus on the defining Si ii λ6355 line of Type Ia SNe, studying the variation in the time evolution of its absorption velocity (Section 5.1). We propose an alternative (and in our view more robust) method to Benetti et al. (2005) for measuring velocity gradients (Section 5.2). Last, we investigate the correlation of Si ii velocity with intrinsic color at maximum light suggested by Foley & Kasen (2011) in Section 5.3.
5.1. Evolution of the Si ii λ6355 Absorption Velocity
Figure 15 shows the time evolution of the Si ii λ6355 absorption velocity for the different spectroscopic subclasses of Branch et al. (2006). Blondin et al. (2006) presented similar measurements (in different Δm15(B) bins) along with a physical interpretation in terms of microscopic atomic-transition properties and macroscopic properties of the ejecta (density and velocity distributions). We refer the reader to that paper for more detail on the impact of these properties on the morphology of line profiles in SN Ia ejecta.

Figure 15. Evolution of the Si ii λ6355 absorption velocity with time for the four spectroscopic subclasses defined by Branch et al. (2006). The color-coding denotes individual SNe Ia. For the CN and BL subclasses we have only included SNe Ia for which we have at least 10 vabs measurements prior to +30 days from maximum light, while for the SS and CL subclasses only SNe Ia with at least five measurements are shown.
Download figure:
Standard image High-resolution imageFor the CN subclass (top left), there is a large variation in vabs(Si ii λ6355) at phases ≲ − 10 days (e.g., SN 2003du and SN 2006gr have vabs ≈ −12,000 km s−1 and −20,000 km s−1 at −10 days, respectively). By maximum light, the spread in vabs has decreased to ≲ 3000 km s−1, SN 2009ig being a clear outlier (it is part of the High-velocity subclass of Wang et al. 2009a, but the pseudo-EW of its Si ii λ6355 line at maximum light places it unambiguously in the CN subclass of Branch et al. 2006; see Figure 8). The evolution is fast at early times and more gradual at post-maximum epochs, reflecting the recession of the line-forming region in the co-moving frame of the ejecta. There is also a large spread in vabs at early times for SNe Ia in the Broad Line subclass (top right), but unlike the CN subclass it remains large at later phases (>5000 km s−1 variation at maximum light). At phases later than −10 days, the absorption velocity is on average larger at any given time when compared with the CN subclass, illustrating the large overlap between the BL subclass and the High-velocity subclass defined by Wang et al. (2009a).
The bulk of the SS subclass (bottom left) has velocities comparable to the CN subclass, except at early times where there are no measurements |vabs| > 15,000 km s−1. A handful of SNe Ia display −5000 km s−1 ≳ vabs ≳ −10,000 km s−1 at maximum light. These include 2002cx-like SNe Ia (SN 2005hk, vabs, max ≈ −5500 km s−1; SN 2008A, vabs, max ≈ −7500 km s−1), SNe Ia resulting from possible super-Chandrasekhar progenitors (SN 2009dc, vabs, max ≈ −8000 km s−1; SN 2007if, vabs, max ≈ −7500 km s−1), and the 1991T-like SN 2005M (vabs, max ≈ −8000 km s−1). This last SN stands out among other 1991T-like SNe Ia which all display ≳10,000 km s−1 absorption blueshifts at maximum light.
The Cool subclass (bottom right) displays velocities similar to the CN and SS subclasses around maximum light, but with a more rapid evolution at post-maximum epochs. One significant outlier is SN 2002es (Ganeshalingam et al. 2012), with vabs ≈ −6000 km s−1 at +2 days (see also Figure 8, right), comparable to the SS SN 2005hk at a similar phase.
Benetti et al. (2005) noted the large variation in post-maximum evolution of the Si ii λ6355 absorption velocity for different SNe Ia. This is clearly visible in Figure 15, not only across the different subclasses but also within each subclass (the largest variation being apparent within the BL subclass). Benetti et al. (2005) introduced the velocity gradient, noted  , representing the average |vabs| decline rate past maximum light (units of
  ), and divided their SN Ia sample into three groups (FAINT for 1991bg-like SNe Ia, HVG and LVG for SNe Ia with high and low velocity gradients, respectively). They suggested that the LVG and HVG groups could consist of SNe Ia with different properties of their outer ejecta, resulting from different degrees of mixing or from interaction with circumstellar material. A recent study by Maeda et al. (2010a) associates the observed diversity in the velocity gradients with viewing-angle effects in off-center delayed-detonation models. Blondin et al. (2011a) showed that varying the criterion for DDT in explosions resulting from an isotropic distribution of ignition points (i.e., not off-center explosions) resulted in a range of velocity gradients comparable to that observed by Benetti et al. (2005).
The notion of velocity gradients has received much attention since the paper by Benetti et al. (2005), and there are different physical interpretations as to the origin of their variation. This however can only be properly addressed if the actual parameter is defined in a robust way, which we set out to do in the following section.
5.2. Redefining Velocity Gradients
According to Benetti et al. (2005), the velocity gradient is derived "from a least-squares fit of the measurements taken between maximum and either the time the Si ii feature disappears or the last available spectrum, whichever comes first." This definition makes two implicit (and related) assumptions: (1) the evolution of vabs is a linear function of time at post-maximum epochs and (2) the phase of the last vabs measurement (or the range of available measurements) has little impact on the derived velocity gradient.
Figure 16 shows that both assumptions can have a significant impact on the derived gradient. In the left panel we show the time evolution of vabs(Si ii λ6355) for the BL SN 2002bo (filled circles) and the CN SN 2005cf (open squares). While the vabs evolution for SN 2005cf appears to be almost linear at post-maximum epochs, that of SN 2002bo is clearly not, with a more rapid change in the interval [+10,+15] days. Moreover, at phases ≳ + 25 days the Si ii λ6355 absorption profile is increasingly contaminated by the emergence of lines from different ions (see inset), such that the vabs measurements at these times are not reliable. The right panel of Figure 16 shows the variation in the measured velocity gradient in the interval [+0,tlast] days as a function of the phase of the last available measurement, tlast. The velocity gradient for SN 2002bo is ∼115  when measured over the interval [+0,+10] days, and ∼165
  when measured over the interval [+0,+20] days. Including the biased vabs measurements at > + 25 days yields a velocity gradient ∼120
  , comparable to that obtained for [+0,+10] days, but with a χ2 for the linear fit that is two orders of magnitude larger. Benetti et al. (2005) report a velocity gradient of 110 ± 7
  for this SN, due to the inclusion of measurements out to +30 days (S. Benetti 2008, private communication). For SN 2005cf, the quasi-linear variation of vabs with time results in a minor variation of the velocity gradient with tlast, from ∼65
  for tlast ≈ +10 days to ∼50
  for tlast ≈ +30 days. Wang et al. (2009b) report a velocity gradient of 38 ± 5
  for this SN using measurements out to +30 days.

Figure 16. Left: time evolution of the Si ii λ6355 absorption velocity for SN 2002bo (filled circles) and SN 2005cf (open squares). The solid lines are third-order polynomial fits to the data. Past +25 days the Si ii absorption profile is increasingly contaminated in SN 2002bo (see the inset) and the velocity measurements at +27, +28, and +29 days are biased (dotted ellipse). Right: variation of the Si ii velocity gradient as defined by Benetti et al. (2005) with the phase of the last vabs measurement for the same supernovae. The dotted ellipse again highlights the biased measurements for SN 2002bo (right panel). The vertical error bars indicate the instantaneous velocity decline rate at maximum light, i.e., the slope of the tangents to the red curves in the right panel at t = +0 days.
Download figure:
Standard image High-resolution imageThe classification of SN 2002bo and SN 2005cf, respectively, in the HVG and LVG groups still holds, regardless of tlast and whether or not the biased vabs measurements of SN 2002bo are included. This is not always the case. For SN 2002er, Benetti et al. (2005) report a velocity gradient of 92 ± 5  , including vabs measurements past +20 days when the Si ii λ6355 absorption profile is clearly contaminated by other lines. Using measurements in the phase interval [+0,+16] days we find 81 ± 3
  , consistent with their value, and confirming the classification of SN 2002er as an HVG SN Ia. However, restricting the phase interval to [+0,+10] days, we infer a velocity gradient of 47 ± 7
  , consistent with the LVG group. One can think of a variety of reasons why no spectra would have been obtained at later times (poor weather, telescope problems, conflict with other observations, etc.), none of which should affect the inferred intrinsic properties of SNe Ia.
We also note that the velocity gradient for SN 2006bt reported by Foley et al. (2010) is in error. We measure a velocity gradient of 93 ± 16  over the time interval [+0,+16] days, while Foley et al. (2010) report 51
  over the same interval. R. J. Foley (2011, private communication) has revised this measurement to 96
  . According to Figure 7 of Foley et al. (2010), this new measurement places SN 2006bt well into the HVG group, whereas Foley et al. (2010) originally included this SN in the LVG group (albeit close to the border with HVG SNe Ia).
A more robust definition of the velocity gradient should consider vabs measurements over a fixed phase range, as done for instance by Foley et al. (2011) over the interval −6 days ⩽ t ⩽ +10 days using linear functions to describe the vabs(t) curves. This still does not account for nonlinear variations in absorption velocity. As an alternative, we suggest the measurement of the mean velocity decline rate Δvabs/Δt over some fixed time interval [t0, t1]:

In practice there are not always measurements at precisely t0 and t1, so one may choose to either select the vabs measurement closest in time to t0 and t1 (within a small time interval, e.g., ±2 days) or to interpolate the vabs measurements at the desired phases, again making sure the vabs(t) data are well sampled around t0 and t1. Figure 17 (left) shows the mean velocity decline rate for the Si ii λ6355 line for the time interval [+0,+10] days versus Δm15(B), where we choose the vabs measurement closest in time and within 2 days from these time boundaries. The clustering into the three groups (FAINT, LVG, HVG) is less obvious than in Figure 3 of Benetti et al. (2005), but the points occupy similar regions of parameter space, with a smaller scatter in Δvabs/Δt[ + 0, +10] for Δm15(B) ≳ 1.5 mag. The Broad Line subclass displays the largest variation in mean velocity decline rate (confirming what was visually apparent in Figure 15), ranging from ∼ − 20  for SN 2006cj to +215
  for SN 2006X. Two other SNe have Δvabs/Δt[ + 0, +10] < 0, SN 1991T and SN 2005M (both part of the SS subclass). A combination of optical-depth effects (e.g., an Si iii→Si ii recombination wave) and measurement error (the Si ii absorption is relatively weak and occurs on a steep pseudo-continuum) could explain why the absorption blueshift apparently increases over this phase range. Several objects have Δvabs/Δt[ + 0, +10] consistent with zero, including the CN SN 2006gr. This was also the case for SN 2005hj, for which Quimby et al. (2007) invoke a shell-like density structure (formed within the context of a pulsating delayed detonation or WD–WD merger scenario) to explain the ∼10 day long plateau in absorption velocity of the Si ii λ6355 line.

Figure 17. Left: mean velocity decline rate Δvabs/Δt between maximum light and 10 days past maximum for the Si ii λ6355 line vs. Δm15(B). The different symbols correspond to the various spectroscopic subclasses defined by Branch et al. (2006), as in Figure 8. Right: instantaneous velocity decline rate dvabs/dt at maximum light for the Si ii λ6355 line vs. Δm15(B).
Download figure:
Standard image High-resolution imageThe CN and CL subclasses appear to form a sequence of linearly increasing Δvabs/Δt[ + 0, +10] with Δm15(B). Both quantities are indeed strongly correlated (r = 0.80) for these two subclasses. Within the BL subclass, there is a strong correlation (r = −0.80) between the Si ii λ6355 absorption velocity at maximum light and its subsequent mean decline over the interval [+0,+10] days. In other words, SNe Ia with the largest absorption blueshifts at maximum light also display steeper velocity gradients (see also Benetti et al. 2005; Wang et al. 2009a; Foley et al. 2011).
In the limit (t1 − t0) → 0, Equation (1) yields an instantaneous velocity decline rate at a given time,  . We determine this using second- or third-order polynomial fits to the vabs(t) data, as shown in Figure 16 (left; solid curves). The instantaneous velocity decline rates at t = +0 days for Si ii λ6355 in SN 2002bo and SN 2005cf are shown as the error bars in the right panel of Figure 16. Figure 17 (right) shows the same quantity for a larger sample versus Δm15(B). The different subclasses occupy similar regions of parameter space as when considering the mean velocity decline rate (not surprisingly, since the mean and instantaneous decline rates are strongly correlated), but reveals an even larger variation within the BL subclass, with instantaneous velocity decline rates at maximum light as large as ∼300
  for SN 2001ay and ∼400
  for SN 2003W. SN 2005hj has the lowest instantaneous velocity decline rate at maximum light (14 ± 5
  ), in line with the results of Quimby et al. (2007).
5.3. Intrinsic Color and Si ii Velocity
Based on the results by Wang et al. (2009a), Foley & Kasen (2011) noted that SNe Ia in the High-velocity subclass were intrinsically redder (in Bmax − Vmax pseudo-color19) than SNe Ia in the Normal subclass. They provided a simple physical explanation using radiative transfer calculations by Kasen & Plewa (2007) based on the detonating failed deflagration (DFD) model of Plewa (2007), although Blondin et al. (2011a) showed that this relation did not hold in the two-dimensional delayed-detonation models of Kasen et al. (2009). Using the Si ii λ6355 absorption velocity measurements presented in this paper, Foley et al. (2011) quantified the relation between Si ii velocity and intrinsic Bmax − Vmax pseudo-color at maximum light for Normal and High-velocity SNe Ia with 1.0 mag ⩽ Δm15(B) ⩽ 1.5 mag. They find that the slope of the relation between both quantities is non-zero at the ∼9σ level using a linear weighted least-squares fit (but only at the ∼3.5σ level when using a Bayesian approach to linear regression; see Kelly 2007), with a Pearson correlation coefficient r = −0.39.
We show the relation between the intrinsic B − V color at B-band maximum light, as derived from BayeSN fits to SN Ia light curves (see Table 1), and the absorption velocity of the Si ii λ6355 line in Figure 18 (left) for the Normal and High-velocity subclasses. We restrict the Δm15(B) range to 1.0 mag ⩽ Δm15(B) ⩽ 1.5 mag, as done by Foley et al. (2011). Moreover we use their interpolated velocity measurements at maximum light (their Table 1). The right panel shows histograms of intrinsic B − V color at maximum light for the Normal (NSN = 51; open) and High-velocity (NSN = 22; filled) subsamples. Of the 65 SNe Ia used by Foley et al. (2011) in their analysis, 42 (27 Normal and 15 High-velocity) are part of our sample.

Figure 18. Left: intrinsic B − V color at B-band maximum light, as derived from BayeSN fits to SN Ia light curves, vs. the absorption velocity of the Si ii λ6355 line, for SNe Ia in the Normal and High-velocity subclasses with 1.0 ⩽ Δm15(B) ⩽ 1.5 mag. The Pearson correlation coefficient is r = −0.35 (r ≈ −0.20 when taking into account the uncertainties in intrinsic color). The dashed line is the result of a least-squares linear fit, with a slope of 0.013 ± 0.005 (∼2σ different from zero). We also indicate the weighted mean intrinsic color (〈B − V〉) for both samples. Right: distribution of intrinsic B − V color at maximum light for the Normal and High-velocity subsamples. A K-S test shows that the two samples are discrepant at the p = 0.023 < 0.05 significance level.
Download figure:
Standard image High-resolution imageA linear weighted least-squares fit to the data in Figure 18 yields the following relation between intrinsic B − V color and Si ii velocity at maximum light:

with a Pearson correlation coefficient r = −0.35 (see Table 6), consistent with that found by Foley et al. (2011). Taking into account the uncertainty in the intrinsic color estimates via a Monte Carlo simulation results in almost no correlation (r ≈ −0.20). The slope of the best-fit linear relation is shallower than that found in their paper, and with a larger associated error that reflects the larger uncertainty we derive on intrinsic color estimates (typically 0.05 mag using BayeSN cf. 0.03 mag for the estimates reported by Foley et al. 2011). The statistical significance of the linear relation that we find is also significantly lower than that reported by Foley et al. (2011). Our fit rejects a non-zero slope at the ∼3σ level20, compared with ∼9σ in their paper. The scatter about the best-fit linear relation (dashed line) is the same to within ∼10% for both samples, in conflict with the results of Foley et al. (2011), who infer a ∼50% larger scatter for the HV sample.
Table 6. Intrinsic Color versus Si ii λ6355 Absorption Velocity
| Intrinsic Color | Slope | r | 〈color〉N | 〈color〉HV | Δ〈color〉HV, N | K-S Prob. |
|---|---|---|---|---|---|---|
| This paper (NN = 51, NHV = 22) | ||||||
| B − V | −0.013 ± 0.005 (2.9σ) | −0.35 | −0.115 ± 0.006 | −0.085 ± 0.011 | 0.030 ± 0.013 (2.3σ) | 0.023 |
| Bmax − Vmax | −0.011 ± 0.005 (2.3σ) | −0.26 | −0.101 ± 0.007 | −0.070 ± 0.012 | 0.030 ± 0.013 (2.3σ) | 0.140 |
| Foley et al. (2011; NN = 46, NHV = 19)a | ||||||
| Bmax − Vmax | −0.033 ± 0.004 (8.8σ) | −0.39 | −0.022 ± 0.005 | 0.047 ± 0.008 | 0.069 ± 0.010 (7.0σ) | 0.003 |
Note. aWe have used our own derived boundary between the N and HV subclasses at ∼ −12,200 km s−1 (see Section 4.1.2).
Download table as: ASCIITypeset image
The robustness of the relation between Si ii velocity and intrinsic color remains questionable given the large uncertainty associated with the determination of the latter quantity. Foley et al. (2011) fit for a relation between light-curve shape corrected peak absolute MV (not corrected for host-galaxy reddening) and observed Bmax − Vmax pseudo-color (their Figure 15), based on Equation (1) of Wang et al. (2009a). They assume that the horizontal scatter about this relation is entirely due to intrinsic variations in Bmax − Vmax pseudo-color, where it in fact also includes some intrinsic scatter about the luminosity–Δm15(B) relation. It is thus unlikely that their "intrinsic color estimates" are simply offset from the true intrinsic color, as postulated in their paper. Moreover, Foley et al. (2011) do not propagate the errors associated with their nuisance parameters (α, MZP, RV, and C in their Equation (15)) in the intrinsic color error bars, which artificially enhances the statistical significance of their correlation. The same limitations apply to the recent study of this relation for high-redshift SNe Ia by Foley (2012), with the additional caveat that their analysis makes use of an indirect measure of the observed Bmax − Vmax pseudo-color.
BayeSN uses a more elaborate statistical treatment of the population correlations between the intrinsic absolute magnitudes (BVRI, including JH when available), intrinsic colors, and light-curve shape, as well as the distribution and properties of host galaxy dust. BayeSN therefore provides an estimate of the true intrinsic color, with realistic error bars reflecting the uncertainty in the various population correlations. It is then not surprising that our estimates for the intrinsic Bmax − Vmax pseudo-color are only weakly correlated (r = 0.21) with those of Foley et al. (2011). Likewise, the mean intrinsic colors that we derive for both Normal and High-velocity samples are significantly bluer (by ∼0.08 mag and ∼0.12 mag, respectively, when using the intrinsic Bmax − Vmax pseudo-color from BayeSN) than those using the color estimates of Foley et al. (2011). The larger uncertainties derived from BayeSN fits reflect the difficulty in obtaining accurate estimates of intrinsic color, properly accounting for the population distributions (or variance) of intrinsic color and dust extinction.
The difference in the weighted mean intrinsic B − V color between the High-velocity and Normal samples is 0.030 ± 0.013 mag, corresponding to a ∼2σ difference (cf. ∼7σ in Foley et al. 2011). A Kolmogorov–Smirnov (K-S) test shows that the two samples are discrepant at the p = 0.023 significance level, which is less than the canonical cutoff of 0.05 for statistical significance,21 with the caveat that this statistic does not consider the (large) uncertainty in intrinsic color. This is still significantly larger (i.e., less significant) than the K-S probability inferred for the Foley et al. (2011) estimates of intrinsic Bmax − Vmax pseudo-color (p = 0.003).
Using the intrinsic B − V color at B-band maximum as opposed to the Bmax − Vmax pseudo-color does not affect our results nor their interpretation, as both quantities are strongly correlated (r = 0.72; see Table 1). The weighted mean difference between intrinsic Bmax − Vmax pseudo-color and intrinsic B − V color at B-band maximum is only 0.02 mag with an rms of 0.04 mag. Pseudo-colors are difficult to interpret since, for an individual SN, the V band may reach its maximum brightness between ∼0 days and ∼4 days later than the B band (see, e.g., Blondin et al. 2011a, their Figure 9). We prefer to use the true color at a given time. The resulting correlation between Si ii absorption velocity and intrinsic Bmax − Vmax pseudo-color is slightly weaker than when using the B − V color at B-band maximum light (r = −0.26). While the High-velocity sample is found to have a redder average intrinsic Bmax − Vmax pseudo-color than the Normal sample at the ∼2σ level (i.e., the same significance than when using the B − V color), a K-S test shows that the two samples are consistent at the p = 0.14 > 0.05 significance level.
A larger sample of SNe Ia with combined optical and NIR photometry should enable a more precise determination of the intrinsic colors of SNe Ia (see Mandel et al. 2011) and a more reliable study of the relation with Si ii velocity.
6. EARLY-TIME SPECTRA
Spectra taken shortly (within ∼10 days) past explosion probe the outer layers of the SN ejecta and hence the completeness of C/O burning in the progenitor WD. The velocity interval over which IMEs absorb (in particular Si and Ca, see Sections 6.1 and 6.2) and the detection of lines from (unburnt) carbon (see Section 6.3) both provide constraints on possible explosion mechanisms.
6.1. Maximum Velocity of Si ii Absorption
In Section 5.1, we investigated the time evolution of the Si ii λ6355 absorption velocity as a function of spectroscopic subclass (see Figure 15). This velocity corresponds to the location of maximum absorption. Here, we are interested in the maximum velocity at which Si ii absorbs, since this value gives an estimate of the extent of incomplete C/O nuclear burning in the progenitor WD star.
In Figure 19, we show the Si ii λ6355 line profile for SNe Ia in the CfA sample for which we have spectra prior to −10 days from B-band maximum light (excluding 1991T/1999aa-like objects and SN 2006cc; see the caption). There is a large variation in the maximum Si velocity (roughly corresponding to the blue edge of the Si ii λ6355 absorption profile), from ∼ −28,000 km s−1 for SN 2003W to ∼ −18,000 km s−1 for SN 1998aq. These values are consistent with the lower limit of ∼12,000 km s−1 found by Mazzali et al. (2007) for the outer extent of the Si-rich layer in SN Ia ejecta, although as noted by Branch et al. (2007) this layer generally extends to much higher velocities, in conflict with pure deflagration models (e.g., Maeda et al. 2010b).

Figure 19. Zoom in on the Si ii λ6355 line for SNe Ia for which we have spectra −10 days from B-band maximum or earlier. The spectra are roughly ordered according to the maximum velocity at which the Si ii λ6355 line absorbs (from ∼ −28,000 km s−1 for SN 2003W to ∼ −18,000 km s−1 for SN 1998aq), and are color-coded according to their spectroscopic subclass as defined by Branch et al. (2006). We do not show spectra of 1991T/1999aa-like SN, which generally have weak to non-existent Si ii absorptions at these epochs, nor the low-S/N highly reddened spectrum of SN 2006cc. Tentative identification of a C ii λ6580 absorption is indicated for some SNe Ia (downward-pointing arrows). The spectrum of SN 1990N (Leibundgut et al. 1991) is not part of the CfA sample presented in this paper, but it was obtained through the CfA SN Program (see Table A2).
Download figure:
Standard image High-resolution imageMazzali et al. (2007) assume that pre-maximum Si ii λ6355 profiles are affected by HVFs (see the next section) that are not representative of the bulk of IMEs. In Figure 19, we clearly see variations in the line-profile morphology of the Si ii line, from single absorptions (both broad as in SN 2003W and narrow as in SN 1998aq) to evidence for multiple components (e.g., SN 2006cp, SN2007le, SN 2005cf). In the latter case the absorption profile is interpreted as consisting of a photospheric and a "detached" high-velocity component, as in the analysis of SN 2005cf by Wang et al. (2009b). In this interpretation both components would then be blended together in SNe Ia displaying a single broad absorption profile (see, e.g., Tanaka et al. 2008).
The emission component of the P-cygni profiles in Figure 19 appears blueshifted with respect to the rest-frame wavelength of the Si ii transition (6355 Å). In SN 2003W, the peak emission occurs at a Doppler velocity of ∼ − 6000 km s−1. Such peak-emission blueshifts are routinely observed in Type II SNe, and result from the steep density gradient in the ejecta, confining the absorbing and emitting regions (as seen by an external observer) to a narrow range of impact parameters (Dessart & Hillier 2005). Sizeable peak-emission blueshifts are also expected theoretically in SNe Ia (Blondin et al. 2006), although line overlap renders their identification problematic (see discussion by Branch et al. 2007). In several cases we note a small absorption notch in the Si ii λ6355 emission profile (downward-pointing arrows), usually attributed to C ii λ6580 (see Section 6.3), which obviously biases the measurement of the velocity at peak emission to higher apparent blueshifts.
6.2. High-velocity Features
The Ca ii near-infrared triplet (IRT; 8498 Å, 8542 Å, and 8662 Å) is less subject to overlap with lines from other ions than Ca ii λ3945 and is hence more appropriate to search for high-velocity absorption features. Mazzali et al. (2005a) found HVFs to be present in all SN Ia spectra with early-time data covering the Ca ii IRT, with evidence of similar features in the Si ii λ6355 line for some. They suggested that an abundance enhancement in Ca and Si was unlikely to be the sole cause, as extreme enhancements were required in the outer ejecta (e.g., factor of 20 increase in the Ca abundance above 20,000 km s−1 for SN 1999ee; Mazzali et al. 2005b). A density enhancement was found to be a more likely explanation, either intrinsic to the explosion or through an interaction with circumstellar material. In the former case one expects a large diversity in HVFs due to line-of-sight effects dependent on the geometry of the high-velocity material (e.g., thick torus or clumpy structure; see Tanaka et al. 2006). There is direct evidence for the multi-dimensional nature of HVFs in one SN Ia, SN 2001el, where spectro-polarimetric observations revealed the high-velocity component of the Ca ii IRT to be polarized at the ∼1% level (Wang et al. 2003; Kasen et al. 2003).
Figure 20 shows Ca ii λ3945 (black) and IRT (red) line profiles in pre-maximum SN Ia spectra, ordered by phase. The diversity in line-profile morphology noted by other authors (e.g., Tanaka et al. 2008) is clearly seen, ranging from single to multiple detached absorption profiles. The correspondence between the Ca ii λ3945 and IRT absorption profiles is obvious in some cases (e.g., SN 1997bq), more questionable in others (e.g., SN 2001da), and nonexistent for a few cases (e.g., SN 2002he, SN 1996X). One possible source of confusion comes from the overlap of the Si ii λ3858 line with Ca ii λ3945, which can lead to an apparent HVF in the H&K line where none are visible in the IRT (e.g., SN 1996X, SN 1989B). The dotted lines in Figure 20 show the location of maximum absorption by Si ii λ3858, assuming it has the same absorption velocity as Si ii λ6355. In several cases it coincides with a blue absorption in the Ca ii λ3945 absorption profile, sometimes resulting in a flat-bottomed absorption (e.g., SN 2002he). Another difficulty when interpreting HVFs associated with Ca ii is that a mass fraction as low as ∼10−5 is sufficient to yield a strong Ca ii absorption at high velocities (see, e.g., Blondin et al. 2011a).

Figure 20. Ca ii λ3945 (H&K; black) and λ8579 (IR triplet or IRT; red) line profiles in pre-maximum SN Ia spectra, ordered by phase, and plotted in velocity space (bottom x-axis). The spectra have been smoothed using an inverse-variance Gaussian weighted filter with dλ/λ = 0.003. The vertical dotted lines indicate the absorption velocity of the Si ii λ3858 line (top x-axis) assuming that it is equal to that of the Si ii λ6355 line. By comparing the H&K and IRT profiles and taking into account the likely location of maximum absorption by Si ii λ3858, one can interpret absorptions in the blue wing of the Ca ii λ3945 line as being due to high-velocity ("detached") Ca ii or normal-velocity ("photospheric") Si ii, although a definitive answer can only come from detailed spectroscopic modeling. Spectra marked with an asterisk are from the CfA SN Program.
Download figure:
Standard image High-resolution imageTanaka et al. (2006) noted that if HVFs result from a density enhancement (regardless of its origin), other lines (e.g., Si ii λ6355) should be affected, and the relative strengths and velocities of these HVFs should be correlated in some way. Stanishev et al. (2007) suggest that the relative strengths of HVFs in Ca ii λ3945, Si ii λ6355, and Ca ii IRT are indeed correlated in SN 2003du, but Tanaka et al. (2008) find that the velocities of the Si ii λ6355 and Ca ii IRT HVFs in several SNe Ia are at odds with this hypothesis. We note based on Figures 19 and 20 that five of the SNe Ia with the largest extent of Ca ii IRT absorption (SN 2002bo, SN 2005cf, SN 1997bq, SN 2002dj, SN 2003W) also have some of the largest Si ii λ6355 absorption velocities at early times (the same is also true for SN 2009ig, shown in Figure 20 but not in Figure 19). Interestingly, Tanaka et al. (2006) also suggest that a combination of density and abundance enhancements might provide a better explanation for the origin of HVFs, on the account that dense blobs covering the entire photosphere would result in Si ii λ6355 absorption velocities in excess of 20,000 km s−1, "never observed in any SN." In fact, such high absorption blueshifts are seen in one SN from the CfA sample, SN 2003W (see Figure 15), and more recently in SN 2009ig (Foley et al. 2012).
6.3. Evidence for Unburnt Carbon
Inferring the presence of unburnt carbon in SN Ia spectra can yield important clues on the properties of the explosion. Pure deflagration models predict that large amounts of unburnt C/O fuel are left over, sometimes mixed to the innermost ejecta regions (see, e.g., Röpke 2005), although one then predicts strong forbidden lines of C i and O i in late-time spectra that are not observed (Kozma et al. 2005). Delayed-detonation models, on the other hand, consume all but the outermost regions of the SN ejecta, leaving varying amounts of unburnt C/O at high expansion velocities (e.g., Maeda et al. 2010b), which can affect early-time SN Ia spectra.
As noted by several authors (e.g., Tanaka et al. 2008), carbon is expected to be ionized once in the ejecta of SNe Ia at early times, such that the "best bet" at constraining the abundance of carbon, let alone inferring its presence, is through its strongest optical line C ii λ6580 (although see the analysis by Marion et al. 2006 using C i lines in NIR spectra). Until recently, firm detections of this line had been reported in only a handful of SNe Ia, the most convincing cases being those of SN 2006D (Thomas et al. 2007) and SN 2006gz (Hicken et al. 2007), both of which show gradually fading C ii λ6580 lines with respect to the earliest detection. The scarcity of C ii detections led to the suggestion of a clumpy carbon distribution in the outer ejecta of SNe Ia combined with line-of-sight effects (e.g., Branch et al. 2007).
In a recent survey of C ii features in SN Ia spectra, Parrent et al. (2011) find evidence for C ii λ6580 absorption in ∼30% of SNe Ia in their sample, a significantly larger fraction than previously suspected (e.g., Thomas et al. 2007). Moreover, they show that these features are most common in SNe in the low-velocity gradient group, in line with the idea that LVG SNe Ia correspond to off-center delayed detonations seen from the deflagration side (Maeda et al. 2010a; although see Blondin et al. 2011a for an interpretation of velocity gradients in the context of symmetric explosions) or at least to WDs that underwent less intense burning (Tanaka et al. 2008).
Thomas et al. (2011a) investigated the presence of C ii λ6580 in early-time SN Ia spectra from the SNfactory collaboration and found definite detections in five SNe Ia. All five SNe are part of the CN/LVG subclass and are otherwise unremarkable, apart from SN 2005cf, which displays clear HVFs in the Si ii λ6355 and Ca ii IRT lines. Of the remaining four SNe, three (SN 2005el, SN 2005ki, and SNF20080514-002) are characterized by blue colors and narrow light-curve widths, suggesting that carbon-positive SNe Ia may be preferentially associated with a specific photometric behavior, and one (SN 2005di) is highly reddened by host-galaxy dust. Thomas et al. (2011a) estimate that ∼20% of "normal" SNe Ia display a C ii λ6580 absorption as late as −5 days from B-band maximum light, in line with the results of Parrent et al. (2011; see also the paper recently submitted by Silverman & Filippenko 2012). They also illustrate using a toy model that a spherically symmetric distribution of carbon can account for the C ii λ6580 line-profile morphology, although they cannot rule out the large-scale asymmetries inferred by Maeda et al. (2010a) to explain the spectroscopic diversity of SNe Ia.
In Figure 21 we show the Si ii λ6355 region in previously unpublished spectra from the CfA SN Program where we tentatively identify an absorption due to C ii λ6580. For each of the 21 SNe Ia in this figure, we only show the earliest spectrum where the C ii λ6580 absorption is seen, except for a few cases where the earliest spectra had too low S/N (SN 2004at, SN 2004fu, SN 2006ax, SN 2007cq, and SN 2008A). Furthermore, we do not show spectra of SNe Ia already included in Figure 19. In all this represents a total of 24 SNe Ia not included in the study by Parrent et al. (2011).22 A C ii λ6580 line in SN 2005el was already noted by Thomas et al. (2011a) in their earliest spectrum.23 We do not attempt to confirm these detections with parameterized spectrum synthesis codes as done by Parrent et al. (2011) using SYNOW (e.g., Branch et al. 2005) or by Thomas et al. (2011a) using SYNAPPS (Thomas et al. 2011b), but most of the tentative C ii identifications (17 out of 24) correspond to firm detections in spectra from different nights. Of the remaining seven SNe Ia, three only have a single pre-maximum spectrum (SN 2004bg, SN 2004fz, and SN 2005mz) and two have possible detections in multiple spectra (SN 2000dn and SN 2003U). For SN 2001ep, we have a definite detection in the −7 day spectrum but none in the −3 day spectrum. The small notch seen in the −2 day spectrum of SN 2007ax is no longer visible one day later.

Figure 21. Tentative identification of a C ii λ6580 absorption feature (downward-pointing arrows) in previously unpublished pre-maximum SN Ia spectra from the CfA SN Program, ordered by phase. The spectra have been smoothed using an inverse-variance Gaussian weighted filter with dλ/λ = 0.002, and are color-coded according to their spectroscopic subclass as defined by Branch et al. (2006). We do not include the spectra with possible C ii λ6580 absorption features already shown in Figure 19.
Download figure:
Standard image High-resolution imageThe majority of SNe Ia with C ii λ6580 detections in Figures 19 and 21 are part of the CN subclass (19 out of 30). Moreover, 7/9 CN SNe Ia with spectra prior to −10 days from B-band maximum (see Figure 19) show C ii absorptions, suggesting that this feature is a generic property of this subclass, and highlighting the need for very early-time spectroscopy. The other 11 SNe Ia are almost equally divided among the SS (four objects), CL (three), and BL (four) subclasses. The carbon-positive SS SNe Ia include the 1991T-like SN 2007cq, the 2002cx-like SN 2008A, and the possibly super-Chandrasekhar SN 2006gz. One of the carbon-positive CL (SN 2007ax) has an obvious 1991bg-like spectrum, while the remaining two (SN 2002fb and SN 2005mz; both similar to SN 2006D) show evidence for more moderate Ti ii absorption. Of the four carbon-positive BL SNe Ia, only one (SN 2004fu) is part of the high-velocity subclass of Wang et al. (2009a), with a high-velocity gradient in the Si ii λ6355 line (
 measured between +2 days and +22 days). This also confirms the results of Parrent et al. (2011) who find only one carbon-positive SN Ia of the HVG group in their sample (SN 2009ig; see also Foley et al. 2012). Parrent et al. (2011) suggest line blending as a possible explanation for the apparent paucity of high-velocity carbon-positive SNe Ia.
The C ii λ6580 blueshifts at maximum absorption in this sample of 30 SNe Ia are typically in the range −10,000 ≳ vabs ≳ −14,000 km s−1, with the notable exceptions of the 2002cx-like SN 2008A (vabs ≈ −8000 km s−1 at −6 days, similar to the Si ii λ6355 absorption velocity at the same phase; see Figure 15) and the peculiar SN 2006gz (vabs ≈ −15,500 km s−1 between −13 days and −11 days), both part of the SS subclass. The absorption velocities of C ii λ6580 and Si ii λ6355 are similar for most objects at any given pre-maximum epoch, their ratio being within 10% of unity (see also Figure 8 of Parrent et al. 2011). Two SNe Ia (SN 1990N at −14 days and SN 2005cf between −13 days and −11 days) have vabs(C ii)/vabs(Si ii) < 0.8, but both display HVFs in the Si ii λ6355 line (see Figure 19), which biases this ratio to lower values. Conversely, SN 2006gz, SN 2008Z (both SS SNe Ia), and the 1991bg-like SN 2007ax display vabs ratios closer to 1.2.
The maximum velocity at which C ii λ6580 absorbs (vmax) is in the range −12,000 km s−1 ≳ vmax ≳ −16,000 km s−1 for most SNe Ia. Since vmax and vabs are strongly correlated, we find the same two outliers as above (SN 2008A, vmax ≈ −10,000 km s−1; SN 2006gz, |vmax| ≳ 18,000 km s−1). Within the same sample, the maximum velocity at which Si ii λ6355 absorbs is typically significantly higher (−20,000 km s−1 ≳ vmax ≳ −28,000 km s−1). This suggests that some silicon is ejected at larger velocities than the bulk of unburnt carbon, incompatible with current delayed-detonation models (see, e.g., Maeda et al. 2010b). As noted by Branch et al. (2007), the pulsating reverse detonation models of Bravo & García-Senz (2006) could provide a viable explanation for the low carbon velocities compared to the bulk of IME.
Thomas et al. (2011a) suggest that the presence of C ii lines in normal SNe Ia could be preferentially associated with blue colors and narrow light-curve widths, based on the SALT2 parameters (x1, c). They note, however, that this trend does not appear to hold for the sample analyzed by Parrent et al. (2011). We have reliable SALT2 fits for 24 out of 30 SNe Ia in our carbon-positive sample, and do not find evidence for bluer colors with respect to the carbon-negative sample (171 SNe Ia with reliable SALT2 fits). The median SALT2 x1 is approximately −0.6 for both samples. Since the SALT2 color parameter does not distinguish between intrinsic color and extinction by dust, we re-ran this analysis using the intrinsic B − V color at B-band maximum and Δm15(B) values from BayeSN. Within the CN sample, the carbon-positive SNe Ia appear to occupy a narrower Δm15(B) range (1 mag ≲ Δm15(B) ≲ 1.5 mag) than the carbon-negative sample (0.8 mag ≲ Δm15(B) ≲ 1.6 mag), but a K-S test shows that the two distributions are consistent at the p = 0.37 > 0.05 significance level. The distribution of intrinsic B − V color is the same for both subsamples (p = 0.34). These conclusions hold when considering only SNe Ia with persistent C ii features (i.e., present later than −5 days), although the numbers become then too small for a robust analysis.
7. NEBULAR SPECTRA
7.1. Nebular Line Widths and Luminosity
We have 21 spectra of 12 SNe Ia with spectra taken later than 150 days past maximum in the CfA sample presented in this paper (see Table 2). At these epochs, the spectra are dominated by forbidden lines of Fe ii and Fe iii, reflecting the NSE composition of the inner ejecta regions. Based on the observed correlation of the FWHM of the iron emission feature centered at ∼4700 Å with Δm15(B) in nebular SN Ia spectra from the Asiago SN archive, Mazzali et al. (1998) found a relation between the kinetic energy of the explosion and the mass of synthesized 56Ni. In particular, the low-luminosity SN 1991bg was associated with a low mass of 56Ni but also a low explosion energy, suggesting that the fast-evolving light curve was the result of a small (sub-Chandrasekhar) exploding mass.
We revisit the relation between the FWHM of the nebular iron feature at ∼4700 Å and Δm15(B) in Figure 22 (see Figure 2 of Mazzali et al. 1998). We have used our own FWHM measurements (see Table 7) on the publicly available data from Mazzali et al. (1998; i.e., with the exception of SN 1989M, SN 1991M, and SN 1993L), supplemented with 10 of the 12 SNe Ia from the CfA SN Program with nebular spectra (we exclude SN 2002cx due to low S/N and SN 2003cg due to the large associated error on FWHM), and additional data from the literature (including a nebular spectrum of SN 1991T from Schmidt et al. 1994, publicly available in the CfA SN Archive; see Table A2). When several measurements are available for a given SN, we plot the error-weighted mean FWHM. We also show the original relation published by Mazzali et al. (1998; long-dashed line).

Figure 22. Relation between decline-rate parameter Δm15(B) and FWHM of the Fe emission feature at ∼4700 Å (which includes emission from [Fe ii] and [Fe iii]) in nebular SN Ia spectra. The points are color-coded according to the spectroscopic subclasses defined by Branch et al. (2006). Two SNe with no Branch class (SN 2006dd and SN 2007sr) are shown as open stars. We have used previously unpublished data from the CfA SN Program supplemented with our own measurements on publicly available data from the literature, where we have excluded SN 1989B and SN 2003cg due to the large associated error (σFWHM ≈ 6000 km s−1 and 3500 km s−1, respectively), and SN 2002cx due to the low S/N of the spectrum. The dashed line corresponds to the original relation published by Mazzali et al. (1998). The inset shows a Magellan Clay+LDSS3 spectrum of SN 2007sr at 190 days past maximum with the Fe λ4700 feature highlighted.
Download figure:
Standard image High-resolution imageTable 7. FWHM Measurements of the Fe λ4700 Feature in Nebular SN Ia Spectra
| SN | Branch | Δm15(B) | FWHM | Phase(s) |
|---|---|---|---|---|
| Class | (mag) | (km s−1) | (days) | |
| 1981B | BL | 0.91 (0.05) | 13705 ± 790 | +266 |
| 1986G | CL | 1.65 (0.04) | 12112 ± 521 | +256,+323 |
| 1990N | CN | 0.95 (0.05) | 15047 ± 1750 | +212,+227,+244,+245,+254,+279,+308,+331 |
| 1991T | SS | 0.93 (0.05) | 17044 ± 1507 | +259 |
| 1991bg | CL | 1.94 (0.05) | 2474 ± 317 | +201 |
| 1992A | BL | 1.41 (0.02) | 14588 ± 519 | +225 |
| 1994D | CN | 1.37 (0.03) | 15656 ± 717 | +611 |
| 1994ae | CN | 0.96 (0.04) | 14363 ± 1895 | +152,+366 |
| 1995D | CN | 1.05 (0.03) | 15612 ± 782 | +283 |
| 1996X | CN | 1.26 (0.04) | 15039 ± 1459 | +296 |
| 1998aq | CN | 1.11 (0.04) | 16824 ± 204 | +229,+239 |
| 1998bu | CN | 1.03 (0.02) | 15473 ± 1577 | +178,+189,+207,+216,+242,+248,+328 |
| 2000cx | SS | 0.99 (0.02) | 15486 ± 499 | +154,+181 |
| 2001el | CN | 1.16 (0.03) | 16901 ± 1759 | +397 |
| 2002bo | BL | 1.08 (0.04) | 20281 ± 35 | +310 |
| 2002dj | BL | 1.19 (0.05) | 15606 ± 1081 | +219,+271 |
| 2002er | CN | 1.23 (0.03) | 13882 ± 720 | +212 |
| 2003du | CN | 1.07 (0.06) | 15772 ± 1876 | +219,+374 |
| 2003hv | CN | 1.31 (0.05) | 14433 ± 797 | +322 |
| 2003kf | CN | 1.10 (0.05) | 18139 ± 1877 | +398 |
| 2004dt | BL | 1.14 (0.04) | 13294 ± 657 | +347 |
| 2004eo | CL | 1.38 (0.03) | 14480 ± 630 | +225 |
| 2005cf | CN | 1.10 (0.03) | 15013 ± 2377 | +317 |
| 2006X | BL | 1.18 (0.03) | 16653 ± 1754 | +150,+275 |
| 2006dd | ⋅⋅⋅ a | 1.07 (0.03) | 15554 ± 1142 | +186,+193 |
| 2007af | BL | 1.20 (0.02) | 14347 ± 36 | +301 |
| 2007sr | ⋅⋅⋅ a | 1.13 (0.06) | 14621 ± 32 | +190 |
Notes. When several FWHM measurements are available (see the Phase(s) column), we report the error-weighted mean FWHM. aNo Branch class for SN 2006dd or SN 2007sr since there are no available spectra around maximum light.
Download table as: ASCIITypeset image
We have performed multiple least-squares fits of the relation Δm15(B) = a + b(FWHM − 15) (FWHM in units of 103 km s−1) of Mazzali et al. (1998) to the data, the results of which are reported in Table 8, including the reduced χ2ν and Pearson correlation coefficient (r). We also include the results of fits to the original data of Mazzali et al. (1998, see their Table 1). The entire CfA+Literature sample yields a slope (b = −0.069) that is somewhat shallower than the relation published by Mazzali et al. (1998; b = −0.103), although the correlation is strong in both cases (r = −0.71 and −0.80, respectively). The large χ2ν indicates that the scatter about the best-fit linear relation is real and not the result of measurement uncertainties. Mazzali et al. (1998) suggested that this intrinsic scatter could be taken as evidence for a second parameter affecting the light-curve widths (in addition to the 56Ni mass) or the velocities of the iron-dominated nebula (in addition to the kinetic energy of the explosion).
Table 8. Coefficients of Least-squares Fits of Δm15(B) = a + b(FWHM [103 km s−1] − 15) to Nebular SN Ia Spectra
| Sample | a | b | χ2ν | r |
|---|---|---|---|---|
| CfA + Literature sample | ||||
| All | 1.20 (0.01) | −0.069 (0.003) | 7.5 | −0.71 |
| Excl. 91bg | 1.21 (0.01) | −0.079 (0.004) | 7.4 | −0.37 |
| Excl. 91bg+86G | 1.20 (0.01) | −0.072 (0.005) | 6.9 | −0.17 |
| Mazzali et al. (1998) samplea | ||||
| All | 1.24 (0.03) | −0.103 (0.012) | 4.4 | −0.80 |
| Excl. 91bg | 1.26 (0.04) | −0.169 (0.024) | 2.7 | −0.69 |
| Excl. 91bg+86G | 1.25 (0.04) | −0.168 (0.034) | 3.0 | −0.58 |
Notes. 1σ errors are given in between parentheses. aMeasurements taken from Table 1 of Mazzali et al. (1998).
Download table as: ASCIITypeset image
As noted by Mazzali et al. (1998), the low-luminosity SN 1991bg appears to be a clear outlier, being the only SN Ia with FWHM < 10,000 km s−1 (FWHM ≈ 2500 km s−1). Excluding this single SN from our sample results in a similar slope (b = −0.079) but a significantly degraded correlation (r = −0.37). This is somewhat different to the result obtained using the original measurements of Mazzali et al. (1998), where the exclusion of SN 1991bg leads to a steeper slope (b = −0.169) and a minor impact on the correlation strength (r = −0.69). The new CfA+Literature sample indicates that the scatter about the best-fit linear relation (excluding SN 1991bg) is ∼30% larger than for the original Mazzali et al. (1998) sample (∼50% larger when including SN 1991bg). Further excluding the low-luminosity SN 1986G (i.e., only considering SNe Ia with Δm15(B) < 1.6 mag), there is essentially no correlation between Δm15(B) and the FWHM of the 4700 Å Fe line (r = −0.17). If the latter quantity is indeed a proxy for the kinetic energy of the explosion, as suggested by Mazzali et al. (1998), our measurements imply that the kinetic energy of the explosion does not strongly depend on Δm15(B), and hence on the SN Ia luminosity, for all but the least luminous events. This is expected in delayed-detonation models where the WD star is almost completely incinerated, as burning of C/O to Ni or Si-group elements releases similar amounts of energy (see, e.g., Hoeflich et al. 1995). One will need to see whether additional data (in particular for low-luminosity SNe Ia) continue to disfavor a strong relation between both quantities.
7.2. Nebular Line Shifts and Intrinsic Color
A recent study of nebular-phase SN Ia spectra by Maeda et al. (2010c) revealed that some forbidden lines associated with Ni ii and Fe ii displayed up to ±3000 km s−1 velocity shifts about the central wavelength, while others did not (this was first noted in mid-IR spectra of SN 2003hv by Gerardy et al. 2007). This result was interpreted by Maeda et al. (2010c) in the context of a simple kinematic model crafted to reproduce basic characteristics of an off-center delayed-detonation model. These include an inner high-density region of stable iron-group elements and 56Ni, and an outer low-density 56Ni-rich region. The former results from the deflagration phase, and hence presents a global velocity offset in the case of an off-center ignition, while the latter results from the detonation phase, resulting in a spherically symmetric distribution of 56Ni in the outer region. Different spectral lines in nebular SN Ia spectra thus trace different zones of the inner ejecta, and the diversity in velocity shifts for lines tracing the deflagration ash (in particular [Fe ii] λ7155 and [Ni ii] λ7378) then stems from viewing-angle effects: the lines are blueshifted when the SN is viewed from the ignition side and redshifted when it is viewed from the opposite direction.
Subsequent investigations by Maeda and coworkers showed that these nebular line shifts were related to the velocity evolution of the Si ii λ6355 line around maximum light (Maeda et al. 2010a) and to the intrinsic color at maximum light (Maeda et al. 2011), suggesting that both quantities were also related to viewing angle effects in off-center delayed-detonation models.
We investigate the relation between nebular line shifts and intrinsic color in Figure 23. We use the intrinsic B − V color at B-band maximum light derived from BayeSN fits as opposed to the intrinsic Bmax − Vmax pseudo-color used by Maeda et al. (2010a, 2010c, 2011; see also discussion in Section 5.3). We were not able to determine reliable intrinsic colors for SN 1986G, SN 2000cx, or SN 2009dc, since BayeSN does not include such objects in its training sample. We also highlight two objects with an inferred visual extinction AV > 1 mag, and note that objects at redshifts <0.01 are subject to a larger uncertainty given the impact of peculiar velocities on the redshift-based distance. We have checked, however, that using external distance priors based on Cepheids or Surface Brightness Fluctuations results in inferred intrinsic colors that are consistent within <1σ with those reported here. We computed nebular line shifts based on a two-Gaussian fit to the emission profiles of [Fe ii] λ7155 and [Ni ii] λ7378. The nebular velocity, vneb, is simply computed as the mean velocity of both lines, while the error is set to the standard deviation of both measurements (see Table 9). For cases where only one of two lines has a well-defined emission profile (usually [Fe ii] λ7155), we set the error in vneb to 600 km s−1, as done by Maeda et al. (2011). Our measurements are consistent within the errors with those reported by Maeda et al. (2010a, 2011), with a scatter about zero difference of ∼150 km s−1 when the same spectrum was used (marked with a "†" in Table 9) and of ∼700 km s−1 when using a different spectrum of the same object. One notable exception is SN 2006X for which we infer a ∼1500 km s−1 larger vneb (2832 ± 343 km s−1 cf. 1331 ± 164 km s−1 reported by Maeda et al. 2011). This difference is suspiciously close to the host-galaxy redshift (cz = 1550 km s−1 from Falco et al. 1999) and results from Maeda et al.'s accidental use of spectra of SN 2006X available in the SUSPECT24 archive that were already de-redshifted by 1587 km s−1 (K. Maeda 2011, private communication; this error does not affect their conclusions, however). We include four SNe Ia (SN 1994ae, SN 1995D, SN 2003kf, SN 2007af) that are not part of the sample studied by Maeda et al. (2010a, 2010c, 2011) and for which we have spectra past +150 days from B-band maximum light (see Table 2).

Figure 23. Bottom: intrinsic B − V color at B-band maximum light, as derived from BayeSN fits to SN Ia light curves, vs. the nebular line shift (vneb) derived from [Fe ii] λ7155 and [Ni ii] λ7378 (see Table 9), for SNe Ia in the Normal and High-velocity subclasses of Wang et al. (2009a). Highly reddened SNe Ia (AV > 1 mag) are circled in red. Objects part of the low-extinction sample are marked with an asterisk (see the text for details). We could not determine the spectroscopic subclass of SN 2006dd (open star) since no spectra are available around maximum light (Stritzinger et al. 2010). We have no intrinsic color estimates for the low-luminosity SN 1986G, the peculiar SN 2000cx, or the possibly super-Chandrasekhar-mass SN 2009dc, but we nonetheless indicate their nebular line shifts (crosses). Top: distribution of vneb for the Normal (open) and High-velocity (filled) subsamples. SN 2006dd and the three SNe Ia with no intrinsic color estimates mentioned above are not included in either distribution but their names appear in the corresponding velocity bin.
Download figure:
Standard image High-resolution image
Table 9. Intrinsic Color versus Nebular Line Shift
| SNa | zCMB | Wangb | Δm15(B) | (B − V)0c | Phased | vFe | vNi | vnebe | Ref. | Notes |
|---|---|---|---|---|---|---|---|---|---|---|
| Class | (mag) | (mag) | (days) | (km s−1) | (km s−1) | (km s−1) | ||||
| 1986G | 0.003 | 91bg | 1.65 (0.04) | ... | +256† | ⋅⋅⋅ | −639 | −639 ± 600 | This paper | |
| 1990N* | 0.004 | N | 0.95 (0.05) | −0.16 (0.06) | +309 | −478 | ... | −478 ± 600 | This paper | |
| 1994D* | 0.004 | N | 1.37 (0.03) | −0.09 (0.04) | +306† | ... | ... | −2220 ± 220 | Maeda11 | |
| 1994ae | 0.005 | N | 0.96 (0.04) | −0.18 (0.05) | +152 | −1204 | ... | −1204 ± 600 | This paper | |
| 1995D* | 0.008 | N | 1.05 (0.03) | −0.16 (0.04) | +283 | −1193 | ... | −1193 ± 600 | This paper | |
| 1997bp* | 0.009 | HV | 1.08 (0.06) | −0.13 (0.06) | +300 | ... | ... | 2539 ± 410 | Maeda11 | |
| 1998aq | 0.005 | N | 1.11 (0.04) | −0.18 (0.04) | +239† | −1249 | −1065 | −1157 ± 129 | This paper | |
| 1998bu | 0.004 | N | 1.03 (0.02) | −0.17 (0.04) | +328† | −1567 | −1135 | −1351 ± 305 | This paper | AV > 1 mag |
| 2000cx | 0.007 | ... | 0.99 (0.02) | 0.06 (0.05) | +146† | ... | −172 | −172 ± 600 | This paper | Peculiar SN Ia |
| 2001el | 0.004 | N | 1.16 (0.03) | −0.15 (0.05) | +397† | 834 | 1126 | 980 ± 206 | This paper | |
| 2002bo | 0.005 | HV | 1.08 (0.04) | −0.05 (0.06) | +310 | 2002 | 2513 | 2258 ± 361 | This paper | |
| 2002dj* | 0.010 | HV | 1.19 (0.05) | −0.07 (0.05) | +271† | 1728 | 2313 | 2021 ± 414 | This paper | |
| 2002er | 0.009 | N | 1.23 (0.03) | −0.13 (0.05) | +212† | ... | 582 | 582 ± 600 | This paper | |
| 2003du* | 0.007 | N | 1.07 (0.06) | −0.21 (0.04) | +374† | −644 | −243 | −443 ± 283 | This paper | |
| 2003hv* | 0.005 | N | 1.31 (0.05) | −0.14 (0.06) | +321† | −2553 | −3097 | −2825 ± 384 | This paper | |
| 2003kf | 0.008 | N | 1.10 (0.05) | −0.12 (0.05) | +398 | 928 | 1213 | 1070 ± 201 | This paper | |
| 2004dt | 0.019 | HV | 1.14 (0.04) | −0.07 (0.05) | +347 | −2623 | ... | −2623 ± 600 | This paper | |
| 2004eo* | 0.015 | N | 1.38 (0.03) | −0.12 (0.04) | +225† | −188 | −152 | −170 ± 25 | This paper | |
| 2005cf* | 0.007 | N | 1.10 (0.03) | −0.15 (0.04) | +317 | −123 | ... | −123 ± 600 | This paper | |
| 2006X | 0.006 | HV | 1.18 (0.03) | −0.09 (0.05) | +275† | 2589 | 3075 | 2832 ± 343 | This paper | AV > 1 mag |
| 2006dd* | 0.005 | ... | 1.07 (0.03) | −0.21 (0.04) | +193† | −1696 | −1410 | −1553 ± 201 | This paper | No spectra around max |
| 2007af | 0.006 | N | 1.20 (0.02) | −0.13 (0.04) | +301 | 583 | 1079 | 831 ± 350 | This paper | |
| 2007sr | 0.007 | HV | 1.13 (0.06) | −0.09 (0.05) | +190 | 1185 | ... | 1185 ± 600 | This paper | |
| 2009dc | 0.022 | ... | 0.76 (0.01) | ... | +281 | −1190 | ... | −1190 ± 600 | This paper | Peculiar SN Ia |
Notes. aSN names marked with an asterisk are part of the low-extinction sample (see the text for details). bSpectroscopic class of Wang et al. (2009a). SN 2000cx and SN 2009dc are both peculiar SNe Ia, while SN 2006dd lacks spectra around maximum light. cIntrinsic B − V color at B-band maximum light from BayeSN. dRest-frame phase of the spectrum used to determine the nebular line shift, in days relative to B-band maximum. For SN 1994D and SN 1997bp we give the phase as reported by Maeda et al. (2010a). A "†" indicates that the same spectrum was used as Maeda et al. (2010a, 2011). eMean velocity derived from [Fe ii] λ7155 (vFe) and [Ni ii] λ7378 (vNi). The associated error is simply the standard deviation of both measurements. When only a single measurement is available, we set the associated error to 600 km s−1, as done by Maeda et al. (2011). We use our own measurements when available, and those reported by Maeda et al. (2011; noted Maeda11) otherwise.
Download table as: ASCIITypeset image
The data points in Figure 23 are color coded according to their spectroscopic subclass ("Normal" and "High-velocity" in the classification scheme of Wang et al. 2009a). Our spectroscopic coverage for SN 2007sr only starts ∼2 weeks past B-band maximum (see Table A1), so we infer its spectroscopic subclass (HV) based on the Si ii λ6355 absorption velocity of −12,300 km s−1 at +5 days reported in CBET 1173 by Naito et al. (2007). We could not determine a spectroscopic subclass for SN 2006dd, since there are no available spectra around maximum light (Stritzinger et al. 2010).
The distribution of nebular line shifts (Figure 23, top) shows a clear separation at vneb ≈ 1000 km s−1 between the N/HV spectroscopic subclasses. One notable exception is the HV SN 2004dt, whose nebular spectrum was shown by Maeda et al. (2010a) to resemble most that of the faint SN 1991bg than other HV SNe Ia. We thus reproduce the main result of Maeda et al. (2010a), although they base their spectroscopic classification on the velocity gradient of the Si ii λ6355 line defined by Benetti et al. (2005) as opposed to its absorption velocity at maximum (all the HV SNe Ia in Figure 23 are classified as HVG by Maeda et al. 2010a). In the context of the simple kinematic model of Maeda et al. (2010c), the HV subclass consists of SNe Ia viewed from the direction opposite to the initial off-center ignition (hence the pronounced redshift of nebular lines), where IMEs synthesized during the detonation phase are ejected at higher velocities.
The overall correlation between intrinsic B − V color at B-band maximum and nebular line shift is rather modest (r = 0.36; r = 0.58 when excluding the peculiar HV SN 2004dt). Considering only the 10 SNe Ia part of our low-extinction sample (by which we mean SNe Ia with E/S0 hosts or in the outskirts of spiral galaxies, following Maeda et al. 2011; see SNe Ia marked with an asterisk in Figure 23 and Table 9), the correlation is even lower than for the entire sample (r = 0.30). The bulk of SNe Ia in our sample with vneb > −2000 km s−1 (18 out of 21 with intrinsic color estimates) do nonetheless appear to follow a clear trend of redder intrinsic color for larger vneb (r = 0.82). It is unclear whether the two Normal SN 1994D and SN 2003hv at vneb < −2000 km s−1 simply reflect a larger scatter at large nebular line blueshifts or reveal a non-monotonic relation between nebular line shifts and intrinsic color (which would then also accommodate SN 2004dt).
Our results appear to differ slightly from those of Maeda et al. (2011), who find a strong correlation and an obvious linear relation between intrinsic color and nebular line shift for their low-extinction sample (which includes SN 1994D and SN 2003hv, both modest outliers in the relation defined by the bulk of our sample), and which also applies to all other SNe Ia in their sample (including SN 2004dt) after excluding three highly reddened objects (SN 1998bu, SN 2002bo, and SN 2006X; their Figure 4). In fact, Maeda et al. (2011) use the relation between "intrinsic" Bmax − Vmax pseudo-color25 and Δm15(B) found by Folatelli et al. (2010) to correct their own pseudo-color measurement. Using this same approach we too find a strong correlation between this color residual and vneb for our low-extinction sample (r = 0.72). We note, however, that the Δm15(B)–color relation of Folatelli et al. (2010) has a low statistical significance (∼2σ), and that there is no correlation between the Bmax − Vmax pseudo-color and Δm15(B) for the low-extinction sample of Maeda et al. (2011; r = 0.05; their Figure 3). Whether or not we apply this correction makes little difference to the strength of the correlation between Bmax − Vmax pseudo-color and vneb for our low-extinction sample (r = 0.68 with no correction).
In any case these nebular line shifts do seem to provide information on the intrinsic properties of SNe Ia independently from Δm15(B). We confirm the lack of correlation between vneb and Δm15(B) (|r| < 0.1 whether or not we exclude peculiar SNe Ia) noted by Maeda et al. (2010a), although Maeda et al. (2011) argue that such a correlation is expected theoretically given the correlation they find between Δm15(B) and viewing angle (for their model with 0.3 M☉ of 56Ni; their Figure 12). The recent study of two-dimensional delayed-detonation models of Kasen et al. (2009) by Blondin et al. (2011a) shows, however, that the relation between Δm15(B) and viewing angle is a complex one, both non-monotonic and nonlinear in character regardless of the 56Ni mass. While we agree with Maeda et al. (2011) that more data are needed to study the relation between nebular line shifts and Δm15(B), we also note the limiting predictive power of simple models crafted to reproduce the observed trends.
8. CONCLUSIONS
We have presented 2603 spectra of 462 nearby SNe Ia out to z ≈ 0.12 obtained through the CfA Supernova Program between 1993 October and 2008 August (2065 spectra of 406 SNe Ia are published for the first time in this paper). For comparison, the entire SUSPECT archive contains 1741 spectra of 185 SNe of all types, with 867 spectra of 81 SNe Ia (including the 432 spectra of 32 SNe Ia published by Matheson et al. 2008 and other spectra from the CfA SN Archive). The SN group at Berkeley is also preparing a public release of their sample of 1298 spectra of 582 SNe Ia (Silverman et al. 2012a), complementary in many ways to the data set presented here. The sample of 2447 SNe Ia spectra taken with the FAST spectrograph at the FLWO 1.5 m telescope constitutes the largest homogeneous SN data set to date. All spectra were reduced in a consistent manner (except for 37 MMT spectra from 1993 to 1997), making this a unique sample for detailed spectroscopic studies of SNe Ia. The sample spans a large range in Δm15(B) (between ∼0.7 mag and ∼2 mag) and includes spectra as early as −15 days and as late as +611 days from B-band maximum. There are 168 SNe Ia with spectra before maximum light, and 92 SNe Ia with at least 10 epochs of spectroscopy.
Using this unique data set, complemented with additional data from the literature, we have studied the diversity of SN Ia properties as a function of spectroscopic class, using the classification schemes of Branch et al. (2006) and Wang et al. (2009a). We find that there is a continuum of properties (i.e., no strict boundaries) between the different subclasses, but that a single parameter is unlikely to explain the spectroscopic variation between extreme members of each subclass. We have studied two hypotheses of Branch et al. (2009), namely, that (1) SNe Ia from the Core Normal (CN) subclass have a significantly smaller scatter in intrinsic peak MB and (2) SNe Ia from the CN and Shallow Silicon (SS) subclasses age at the same rate that they decline photometrically. We reject the first and show that the second is not universally true. Last, we examine the width–luminosity relation (intrinsic peak MB versus Δm15(B)) for individual spectroscopic subclasses and find that SS→CN→Broad Line (BL) form a sequence of increasingly steeper relations, although a single relation is found to adequately describe all subclasses (other than the faint CL subclass). The same is true for the 91T→Normal→High-velocity sequence using the Wang et al. (2009a) classification scheme.
We provide updated versions of the relations between several spectroscopic indicators (the  ratio of Nugent et al. 1995 and its pseudo-EW equivalent, the pseudo-EW of the Si ii λ4130 line, and the
  ratio of Hachinger et al. 2006) and Δm15(B). We confirm the strong correlation reported in previous publications with a significantly larger sample, but note a significant scatter and possible nonlinearities, as well as notable outliers, e.g., SN 2006ot in the pEW(Si ii λ4130) versus Δm15(B) relation (which we argue is spectroscopically distinct from SN 2006bt, contrary to claims by Stritzinger et al. 2011).
We then focus on the evolution of the velocity at maximum absorption (vabs) of the defining Si ii λ6355 line with spectral phase, for the different spectroscopic subclasses of Branch et al. (2006). The CN and BL subclasses display a large variation in vabs at early times (prior to −10 days from B-band maximum), which is largely suppressed at maximum light in the former but persists in the latter. The BL subclass has the largest variation in the post-maximum evolution of vabs (the velocity gradient). The SS subclass has similar vabs as the CN subclass around maximum light, except for 2002cx-like SNe Ia and possibly super-Chandrasekhar events. The same applies to the Cool (CL) subclass, with the exception of the 1991bg-like SN 2002es which displays a factor of ∼2 lower Si ii blueshifts (Ganeshalingam et al. 2012).
We propose alternative measurements of velocity gradients that do not depend on the phase of the last available measurement and can accommodate a nonlinear evolution of the absorption velocity with time. These are the average decline rate over a fixed phase interval [t0, t1] and the instantaneous decline rate at a given phase (i.e., in the limit t0 → t1). The clustering into the three groups defined by Benetti et al. (2005; FAINT, LVG, HVG) is less obvious than in their Figure 3, and the use of the instantaneous velocity decline rate at maximum reveals a significantly larger range in velocity gradients (from ∼0  for SN 2005hj to ∼400
  for SN 2003W).
We revisit the relation of Foley & Kasen (2011) between Si ii velocity and intrinsic color, re-analyzed by Foley et al. (2011) using our velocity measurements. A key difference in our approach is the use of intrinsic color estimates inferred from the BayeSN statistical model for SN Ia light curves (Mandel et al. 2011), which allows for variations in the host-galaxy dust properties on an SN-by-SN basis, as opposed to assuming a single reddening law for all SNe Ia. The intrinsic colors estimated using BayeSN have significantly larger (and probably more realistic) uncertainties, resulting in a very weak correlation between Si ii velocity and intrinsic color (r ≈ −0.20) when these are taken into account. SNe Ia from the High-velocity subclass have a redder mean intrinsic color that those from the Normal subclass, but the difference is only at the ∼2σ level of statistical significance. Moreover, we find that the scatter in intrinsic color is comparable for both N and HV samples, contrary to claims made by Foley et al. (2011).
Through a study of early-time spectra, which probe the outermost ejecta, we attempt to place constraints on the extent and completeness of nuclear burning in SNe Ia. Silicon is found to absorb at significantly larger velocities (−28,000 km s−1 ≲ vmax ≲ −18,000 km s−1) than the lower limit of ∼12,000 km s−1 found by Mazzali et al. (2007) for the outer extent of the Si-rich layer in SN Ia ejecta, in conflict with pure deflagration models. We study the impact of HVFs on the Ca ii near-infrared triplet, and find that SNe Ia with the largest extent of Ca absorption correspond to those with the largest Si ii absorption velocity. By comparing the line-profile morphology of the Ca ii IRT and Ca ii H&K absorptions, we illustrate the contamination of the latter profile by Si ii λ3858, which can be confused with an HVF in the absence of spectra covering the IRT absorption feature.
We searched for signs of unburnt carbon in pre-maximum spectra, a subject that has received much attention lately with the studies by Parrent et al. (2011) and Thomas et al. (2011a), and find evidence for a C ii λ6580 absorption feature in 23 new SNe Ia (four of which have confirmed detections by Folatelli et al. 2012), the majority of which are from the CN subclass. Moreover, 7/9 CN SNe Ia with spectra prior to −10 days show C ii absorptions, suggesting that this feature is a generic property of this subclass, and highlighting the need for very early-time spectroscopy. The absorption velocity of C ii λ6580 is in general within ∼10% of that of Si ii λ6355, but silicon is present at significantly larger velocities than carbon, in conflict with current delayed-detonation models. Contrary to Thomas et al. (2011a), we find no preference for carbon detections in SNe Ia with blue intrinsic colors and narrow light curves, although we are currently lacking data to study this association for SNe Ia with persistent C ii lines.
Using nebular spectra of 27 SNe Ia, we investigate the relation between Δm15(B) and the FWHM of the iron emission feature at ∼4700 Å found by Mazzali et al. (1998), interpreted as a correlation between luminosity and explosion kinetic energy, more luminous SNe Ia corresponding to more energetic explosions. We find the correlation is largely driven by the low-luminosity SN 1991bg, which is clearly separated from the rest of the sample in the (Δm15(B), FWHM) plane. Excluding SN 1986G from the sample (i.e., only considering SNe Ia with Δm15(B) < 1.6 mag), we find no correlation between both quantities (r = −0.17), suggesting that the peak luminosity is only weakly dependent on explosion kinetic energy for most SNe Ia, as in delayed-detonation models in which the WD star is almost completely incinerated.
Last, we studied the relation between velocity shifts of certain nebular emission lines and intrinsic SN Ia properties at maximum light, following the recent work of Maeda et al. (2010a, 2010c, 2011), and interpreted in the context of an off-center delayed-detonation model. Excluding the spectroscopically peculiar SN 2004dt, the five SNe Ia in our sample that are part of the High-velocity subclass of Wang et al. (2009a) display pronounced redshifts in the nebular lines of [Fe ii] λ7155 and [Ni ii] λ7378 (vneb > +1000 km s−1) and are thus consistent with SNe Ia viewed from the direction opposite to an initial off-center ignition. We find a strong correlation (r = 0.82) of nebular line shifts with intrinsic B − V color at B-band maximum light for SNe Ia with vneb > −2000 km s−1 (18 out of 21 in our sample), in line with the results presented by Maeda et al. (2011), but note the possibility of a non-monotonic behavior for the largest blueshifts. We caution that their toy models do not capture the complexity of the variation of Δm15(B) with viewing angle in off-center delayed detonation models, as inferred by Blondin et al. (2011a) based on the two-dimensional models of Kasen et al. (2009).
The study presented here is far from exhaustive, and we still have a lot to learn from the study of SN Ia spectra, from constraining the physics of the explosion and the nature of their progenitors to determining more precise distances on cosmological scales. All 2603 spectra will be made publicly available through the CfA Supernova Archive to enable further studies by the rest of the SN community.
We thank the staffs of the F. L. Whipple, MMT, and Las Campanas observatories for their extensive assistance and support during this project, as well as everyone who assisted with observations (see Table A1). We acknowledge useful discussions with David Branch, Luc Dessart, Gastón Folatelli, Ryan Foley, Keiichi Maeda, and Xiaofeng Wang. Additional thanks to Mohan Ganeshalingam, Weidong Li, and Jeff Silverman from the Berkeley SN Group for sending us tmax(B) values for six SNe Ia; and to Stephen Bailey from the SNfactory collaboration for sending us the results of SALT2 fits to five SNe Ia; to Giuseppe Altavilla, Stefano Benetti, Seppo Mattila, Jesper Sollerman, and Max Stritzinger, for sending us spectroscopic data. Some of the non-CfA spectra used in this paper were downloaded from the SUSPECT archive. Support for supernova research at Harvard University, including the CfA Supernova Archive, is provided in part by NSF grant AST 09-07903. S.W.J. is supported at Rutgers University in part by NSF CAREER award AST-0847157. This research has made use of the NASA/IPAC Extragalactic Database (NED), which is operated by the Jet Propulsion Laboratory, California Institute of Technology, under contract with the National Aeronautics and Space Administration.
Facilities: FLWO:1.5m - Fred Lawrence Whipple Observatory's 1.5 meter Telescope, MMT - MMT at Fred Lawrence Whipple Observatory, Magellan:Baade - Magellan I Walter Baade Telescope, Magellan:Clay - Magellan II Landon Clay Telescope
APPENDIX
Table A1 presents the observational details of the spectra and Table A2 presents the references for spectroscopic data from the literature used in this paper.
Table A1. Journal of Observations
| UT Datea | HJDb | Phasec | Tel./Instr.d | Rangee | Disp.f | Res.g | P.A.h | |ΔΦ|i | Air.j | Flux Std.k | See.l | Slitm | Exp.n | Observer(s)o |
|---|---|---|---|---|---|---|---|---|---|---|---|---|---|---|
| (days) | (Å) | (Å/pix) | (Å) | (°) | (°) | ('') | ('') | (s) | ||||||
| SN 1993ac | ||||||||||||||
| 1993-10-16.49 | 2449276.99 | +6.9 | MMTblue | 3150–8172 | 1.95 | 7–8 | ... | 83.5 | 1.18 | ... | ... | 1.5 | 900 | CF, ND, RW |
| 1993-10-20.52 | 2449281.02 | +10.8 | MMTblue | 3567–7145 | 3.18 | 7–8 | ... | 81.7 | 1.21 | ... | ... | 5.0 | 420 | ... |
| SN 1993ae | ||||||||||||||
| 1993-12-13.11 | 2449334.61 | @0.0 | MMTblue | 3562–10536 | 6.29 | 7–8 | ... | 0.0 | 1.24 | ... | ... | ... | 900 | BS |
| SN 1994D | ||||||||||||||
| 1994-03-10.36 | 2449421.86 | −11.1 | MMTblue | 3161–9061 | 1.92 | 7–8 | ... | 79.7 | 1.09 | ... | ... | ... | 120 | RK, PC, AR |
| 1994-03-11.41 | 2449422.91 | −10.0 | FAST | 3703–7633 | 1.47 | 6–7 | 90.0 | 60.7 | 1.14 | F67/F56 | 2–3 | 3.0 | 300 | ST |
| 1994-03-13.31 | 2449424.81 | −8.1 | FAST | 3701–7631 | 1.47 | 6–7 | 90.0 | 52.0 | 1.15 | F67/F56 | 2 | 3.0 | 600 | ST |
| 1994-03-15.36 | 2449426.86 | −6.1 | MMTblue | 3560–7964 | 1.90 | 7–8 | ... | 79.7 | 1.09 | ... | ... | ... | 120 | RC, JHuc, ST |
| 1994-03-16.37 | 2449427.87 | −5.1 | FAST | 3702–7635 | 1.47 | 6–7 | 90.0 | 81.3 | 1.23 | F67/F56 | 1–2 | 3.0 | 600,2 × 420 | ST |
| 1994-03-17.35 | 2449428.85 | −4.1 | FAST | 3705–7635 | 1.47 | 6–7 | 90.0 | 80.4 | 1.09 | F67/F56 | 1–2 | 3.0 | 2 × 600 | ST |
| 1994-03-18.36 | 2449429.86 | −3.1 | FAST | 3705–7635 | 1.47 | 6–7 | 90.0 | 87.5 | 1.09 | F67/F56 | 2–3 | 3.0 | 420,480 | ST |
| 1994-03-21.35 | 2449432.85 | −0.1 | FAST | 3704–7635 | 1.47 | 6–7 | 90.0 | 87.0 | 1.09 | F67/F56 | 2–3 | 3.0 | 420,2 × 480 | JPe |
| 1994-04-01.28 | 2449443.78 | +10.8 | FAST | 3706–7636 | 1.47 | 6–7 | 90.0 | 65.0 | 1.11 | F67/F56 | 2–3 | 3.0 | 600 | JPe, SMu |
| 1994-04-03.36 | 2449445.86 | +12.8 | FAST | 3706–7636 | 1.47 | 6–7 | 90.0 | 61.0 | 1.15 | F67/F56 | 2 | 3.0 | 660 | JPe |
| 1994-04-05.34 | 2449447.84 | +14.8 | FAST | 3707–7636 | 1.47 | 6–7 | 90.0 | 71.1 | 1.12 | F67/F56 | 2–3 | 3.0 | 900 | PBe |
| 1994-04-07.42 | 2449449.92 | +16.9 | FAST | 3708–7638 | 1.47 | 6–7 | 90.0 | 37.8 | 1.48 | F67/F56 | 1–2 | 3.0 | 600,900 | PBe |
| 1994-04-10.26 | 2449452.76 | +19.7 | FAST | 3706–7636 | 1.47 | 6–7 | 90.0 | 62.2 | 1.11 | F67/F56 | 1–2 | 3.0 | 900 | JPe |
| 1994-04-11.23 | 2449453.73 | +20.7 | FAST | 3706–7636 | 1.47 | 6–7 | 90.0 | 54.2 | 1.14 | F67/F56 | 1–2 | 3.0 | 600 | PBe |
| 1994-04-30.32 | 2449472.82 | +39.7 | FAST | 3708–7632 | 1.47 | 6–7 | 110.0 | 64.4 | 1.30 | F67/F56 | 1–2 | 3.0 | 900 | PBe |
| 1994-05-03.25 | 2449475.75 | +42.6 | FAST | 3707–7631 | 1.47 | 6–7 | 110.0 | 77.8 | 1.11 | F67/F56 | 1–2 | 3.0 | 1800 | JPe |
| 1994-05-06.28 | 2449478.78 | +45.7 | FAST | 3708–7632 | 1.47 | 6–7 | 110.0 | 75.3 | 1.20 | F67/F56 | 1–2 | 3.0 | 1200 | PBe |
| 1994-05-10.16 | 2449482.66 | +49.5 | FAST | 3707–7631 | 1.47 | 6–7 | 110.0 | 30.2 | 1.13 | F67/F56 | 1–2 | 3.0 | 1800 | JPe |
| 1994-05-15.20 | 2449487.70 | +54.6 | FAST | 3721–7645 | 1.47 | 6–7 | 110.0 | 73.1 | 1.10 | F67/F56 | 2–3 | 3.0 | 600 | SMu |
| 1994-05-16.18 | 2449488.68 | +55.5 | FAST | 3710–7634 | 1.47 | 6–7 | 110.0 | 58.8 | 1.09 | F67/F56 | 2–3 | 3.0 | 2 × 600 | SMu |
| 1994-05-17.17 | 2449489.67 | +56.5 | FAST | 3739–7666 | 1.47 | 6–7 | 110.0 | 58.5 | 1.09 | F67/F56 | 2–3 | 3.0 | 600 | SMu |
| 1994-05-19.18 | 2449491.68 | +58.5 | FAST | 3748–7671 | 1.47 | 6–7 | 110.0 | 58.6 | 1.09 | F67/F56 | 2–3 | 3.0 | 1200 | JPe |
| 1994-06-02.18 | 2449505.68 | +72.5 | FAST | 3797–7721 | 1.47 | 6–7 | 110.0 | 87.4 | 1.12 | F67/F56 | 2–3 | 3.0 | 1200 | JPe |
| 1994-06-04.22 | 2449507.72 | +74.5 | FAST | 3801–7724 | 1.47 | 6–7 | 110.0 | 65.0 | 1.29 | F67/F56 | 2–3 | 3.0 | 900 | SMu |
| 1994-06-12.23p | 2449515.73 | +82.5 | MMTblue | 3217–8572 | 1.91 | 7–8 | ... | 77.1 | 1.50 | ... | ... | 2.0 | 2 × 900 | RK, PC |
| 1995-11-24.46 | 2450045.96 | +611.2 | MMTblue | 3167–8170 | 1.95 | 7–8 | ... | 76.4 | 1.23 | ... | ... | ... | 1200 | ... |
Notes. aUT at midpoint of observation(s). bHeliocentric Julian date at midpoint of observation(s). cRest-frame phase of spectrum in days relative to B-band maximum. For SNe Ia with no reliable estimate for the time of maximum, we indicate the rest-frame days relative to the first spectrum preceded by an "@" symbol dTelescope and instrument used for this spectrum: FAST: FLWO 1.5 m+FAST; IMACS: Magellan Baade+IMACS; LDSS2: Magellan Clay+LDSS2; LDSS3: Magellan Clay+LDSS3; MMTblue: MMT+Blue Channel; MMTred: MMT+Red Channel. eObserved wavelength range of spectrum. fSpectral dispersion in Å per pixel. gApproximate FWHM spectral resolution in Å. hObserved position angle during the observation(s). iAbsolute difference between the observed position angle and the average parallactic angle over the course of the observation(s). jAirmass of the observation. kStandard stars: BD17 = BD+17°4708, BD26 = BD+26°2606, BD28 = BD+28°4211, BD33 = BD+33°2642, CD32 = CD-32 9927, EG131 = EG 131, EG274 = EG 274, F15 = Feige 15, F25 = Feige 25, F34 = Feige 34, F56 = Feige 56, F66 = Feige 66, F67 = Feige 67, F110 = Feige 110, G191 = G191B2B, H102 = Hiltner 102, H600 = Hiltner 600, HD19 = HD 192281, HD21 = HD 217086, HD84 = HD 84937, HZ44 = HZ 44, HZ14 = HZ 14, L3218 = LTT 3218, L3864 = LTT 3864, L4816 = LTT 4816, vMa2 = van Maanen 2. lSeeing is based upon estimates by the observers. mSpectroscopic slit width. nExposure time. Separate exposures are indicated. oObservers—EA: E. Adams; VA: V. Antoniou; HA: H. Arce; JA: J. P. Anderson; ZB: Z. Balog; PBa: P. Barmby; EB: E. Barton; JB: J. Battat; PBe: P. Berlind; GB: G. Bernstein; WBl: W. P. Blair; SB: S. Blondin; AB: A. E. Bragg; CB: C. Briceño; WBr: W. Brown; NC: N. Caldwell; MC: M. L. Calkins; BC: B. J. Carter; PC: P. Challis; JC: J. R. Cho; CC: C. Clemens; ACo: A. Cody; ACr: A. Crook; TC: T. Currie; RC: R. M. Cutri; KD: K. Dendy; AD: A. Diamond-Stanic; ND: N. Dinshaw; JDon: J. L. Donley; JDow: J. J. Downes; KE: K. Eriksen; GE: G. Esquerdo; EF: E. E. Falco; RF: R. Fesen; CF: C. B. Foltz; JF: J. Foster; JGa: J. Gallagher; AG: A. Garg; PG: P. M. Garnavich; IG: I. Ginsburg; JGr: J. Graves; NG: N. Grogin; TG: T. Groner; VH: V. Hradecky; HH: H. Hao; CHei: C. Heinke; CHel: C. Heller; JHe: J. Hernandez; MH: M. Hicken; CHi: C. Hill; JHuc: J. P. Huchra; JHug: J. P. Hughes; CHu: C. Hutcheson; RH: R. Hutchins; RJ: R. Jansen; SJ: S. Jha; SKa: S. J. Kannapan; SKe: S. Kenyon; RK: R. P. Kirshner; DK: D. M. Koranyi; JK: J. Kuraszkiewicz; HL: H. Landt; TL: T. Lappin; NL: N. Lepore; LM: L. Macri; JM: J. A. Mader; AM: A. Mahdavi; EM: E. Mamajek; SMa: S. A. Mao; NM: N. Martimbeau; TM: T. Matheson; MM: M. Modjaz; FM: F. Munshi; SMu: S. Muscarella; GN: G. Narayan; PN: P. Nutzman; CP: C. A. Pantoja; BP: B. M. Patten; KP: K. Penev; JPe: J. Peters; WP: W. Peters; MP: M. Phelps; JPi: J. Piñeda; AR: A. G. Riess; KR: K. Rines; BS: B. P. Schmidt; MS: M. Schrödter; JS: J. D. Silverman; IS: I. Song; ST: S. Tokarz; MT: M. Torres; CT: C. Tremonti; AV: A. Vaz; LW: L. Wells; MW: M. Westover; RW: R. J. Weymann. pSpectra with ∼400 Å wide gaps (∼6150–6550 Å) between blue and red halves. qThe first two standard stars were used to calibrate a spectrum taken with our standard grating tilt, while the third was used to calibrate a spectrum taken with a red tilt. rSpectra accidently ommitted from Matheson et al. (2008). sSpectra strongly affected by dark-current problems following UV flashing, for which we have trimmed off a portion of the spectrum.
Only a portion of this table is shown here to demonstrate its form and content. Machine-readable and Virtual Observatory (VO) versions of the full table are available.
Download table as: Machine-readable (MRT)Virtual Observatory (VOT)Typeset image
Table A2. References for Spectroscopic Data from the Literature used in this Paper
| SN | References |
|---|---|
| 1981B | Branch et al. (1983) |
| 1984A | Barbon et al. (1989) |
| 1986G | Phillips et al. (1987), Cristiani et al. (1992)a |
| 1989B | Wells et al. (1994) |
| 1990N | Leibundgut et al. (1991)b, Mazzali et al. (1993)a, Gómez & López (1998)a |
| 1991M | Gómez & López (1998)a |
| 1991T | Jeffery et al. (1992)b, Schmidt et al. (1994)b |
| 1991bg | Turatto et al. (1996)a |
| 1992A | Kirshner et al. (1993)b, Mazzali et al. (1998) |
| 1994D | Patat et al. (1996)a |
| 1996X | Salvo et al. (2001)a |
| 1997cn | Turatto et al. (1998)a |
| 1998bu | Cappellaro et al. (2001)a |
| 1999aa | Garavini et al. (2004)a |
| 1999ac | Garavini et al. (2005)a, Phillips et al. (2006) |
| 1999aw | Strolger et al. (2002) |
| 1999ee | Hamuy et al. (2002)a |
| 2000E | Valentini et al. (2003)a |
| 2000cx | Li et al. (2001)a |
| 2001ay | Krisciunas et al. (2011) |
| 2001el | Wang et al. (2003)a, Mattila et al. (2005) |
| 2002bo | Benetti et al. (2004)a |
| 2002dj | Pignata et al. (2008)a |
| 2002er | Kotak et al. (2005) |
| 2003cg | Elias-Rosa et al. (2006)a |
| 2003du | Anupama et al. (2005)a, Stanishev et al. (2007) |
| 2003fg | Howell et al. (2006) |
| 2003hv | Leloudas et al. (2009) |
| 2004S | Krisciunas et al. (2007)a |
| 2004dt | Altavilla et al. (2007) |
| 2004eo | Pastorello et al. (2007)a |
| 2005bl | Taubenberger et al. (2008)a |
| 2005cf | Garavini et al. (2007)a, Wang et al. (2009b) |
| 2005cg | Quimby et al. (2006)a |
| 2005hj | Quimby et al. (2007) |
| 2005hk | Phillips et al. (2007) |
| 2006D | Thomas et al. (2007) |
| 2006X | Wang et al. (2008) |
| 2006bt | Foley et al. (2010) |
| 2006dd | Stritzinger et al. (2010) |
| 2006gz | Hicken et al. (2007)b |
| 2006ot | Stritzinger et al. (2011) |
| 2007if | Scalzo et al. (2010), Yuan et al. (2010) |
| 2009dc | Taubenberger et al. (2011) |
Notes. We do not include references to SN Ia spectra from our sample that have previously been published (see references in Section 1). aSpectra downloaded from the SUSPECT supernova archive. bSpectra available at the CfA Supernova Archive.
Download table as: ASCIITypeset image
Footnotes
- *
Based in part on observations obtained at the F. L. Whipple Observatory, which is operated by the Smithsonian Astrophysical Observatory, the MMT Observatory, a joint facility of the Smithsonian Institution and the University of Arizona, and with the 6.5 m Magellan Telescopes located at Las Campanas Observatory, Chile.
- 12
Starting in 2008 we also followed a few supernovae discovered by the SNfactory collaboration (Aldering et al. 2002) and reported on the SNfactory Supernova Discoveries Web site, http://snfactory.lbl.gov/snf/open_access/snlist.php.
- 13
Except for 11 spectra of 10 SNe Ia with too low signal-to-noise ratio (S/N) and excessive host-galaxy contamination, which were not used for spectroscopic classifications.
- 14
Throughout this paper the spectral phase corresponds to the number of rest-frame days from B-band maximum light.
- 15
- 16
IRAF is distributed by the National Optical Astronomy Observatory, which is operated by the Association of Universities for Research in Astronomy, Inc., under cooperative agreement with the National Science Foundation.
- 17
The difference in B-band magnitude between maximum light and 15 days after maximum (Phillips 1993).
- 18
In fact, Foley et al. (2010) note the similarity between the spectra of SN 2006bt and SN 2006ax at ∼40 days past maximum light.
- 19
Difference between the B magnitude at B-band maximum and the V magnitude at V-band maximum.
- 20
- 21
Note that a smaller p-value indicates a higher level of statistical significance for the K-S test.
- 22
An even more recent paper by Folatelli et al. (2012) confirms C ii detections in four SNe Ia from Figure 21 (SN 2005el, SN 2006ax, SN 2007A, and SN 2007af). They argue, however, that SN 2007ax shows no such absorption. They also report a C ii detection in pre-maximum spectra of SN 2008bf. We have spectra of this SN, but only past maximum light, by which time the C ii absorption feature is no longer detected.
- 23
Thomas et al. (2011a) also report a C ii detection in SN 2005ki, for which we have one FLWO 1.5 m+FAST spectrum taken at +1 day past B-band maximum light, and SNF20080514-002, for which we have spectra only starting at +2 days (see Table A1), cf. −8 days for the latest detection by Thomas et al. (2011a).
- 24
- 25
Really the apparent Bmax − Vmax pseudo-color for a low-extinction sample.