
Abstract
Ocular microtremor (OMT) is a small involuntary eye movement present in all subjects. In this paper we present the results of in vivo OMT measurement using a novel non-contact laser speckle technique. OMT signals have not previously been measured from the sclera using this laser speckle correlation technique. To verify the system's ability to record eye movements, it is first tested using a large angle eye rotation. Next, the system is tested with a group of 20 subjects and OMT parameters are extracted. The results of OMT measurements gave a mean frequency of 78 ± 3.86 Hz and peak-to-peak amplitude of 21.42 ± 7.01 µrad, these values are consistent with known values from eye-contacting methods.
Export citation and abstract BibTeX RIS
1. Introduction
Ocular microtremor (OMT) is the smallest and fastest of three fixational eye movements. Fixational eye movements (microsaccades, drift and OMT) are involuntary movements that occur even while the eye appears to be at rest. They were first described by Adler and Fliegelman (1934) and have been studied extensively since (Coakley 1983, Ditchburn and Ginsborg 1953, Ditchburn 1973, Ratliff and Riggs 1950, Martinez-Conde et al 2004). Most studies on fixational eye movements concentrate on microsaccades (Martinez-Conde et al 2004, 2013) and drift. Because of its small amplitude (12–216 µrad) and high frequency (mean of 84 Hz), OMT is difficult to measure.
To date, the most widely used tool to measure OMT has been an eye-contacting piezoelectric technique (PZT) (Al-Kalbani 2009, Sheahan et al 1993, Thomas and Coakley 1977). The technique has a number of disadvantages including patient discomfort (Sheahan 1991, Sheahan et al 1994) and possible bias of the measurement results by the eye-contacting probes (McCamy et al 2013). Ideally, for clinical use, a non-contact method would be employed to record OMT.
OMT records are typically measured in the horizontal direction. The frequency content of the record is of most interest and is typically measured using a 'peak count' method. A reduction in OMT frequency has been shown to be of clinical importance in a number of medical circumstances, mostly associated with neurological disease (Bojanic and Bolger 1999, Bojanic et al 2001, Bolger et al 1999a, 1999c, 1999d, 2000, Coakley et al 1976, 1986, Coakley and Phillips 1984, Coakley and Thomas 1977a, 1977b, 1979). The peak frequency of OMT has been shown to increase when the eye is adducting (looking towards the nose) or abducting (looking away from the nose) (Collins 2011). Alcohol (Collins 2011), caffeine (Collins 2011) and age (Bolger et al 2001) have all been shown to influence OMT. Time of day of testing (Collins 2011), gender (Bolger et al 1999b) and right or left eye (Sheahan et al 1994) have not been found to have a significant effect on OMT parameters (Collins 2011).
Accurate measurement of OMT amplitude has proven difficult with the currently available measurement devices and any possible application of OMT amplitude, rather than frequency, as a clinical marker remains unexplored. For clinical comparisons, it is essential for an OMT measurement device to accurately measure the frequency content of the signal. Precise measurement of OMT amplitude would be useful for research but not essential.
It is expected that a recorded OMT signal will be disrupted by microsaccades and drift. Drift causes a background movement in the measured signal, while microsaccades cause intermittent jumps in amplitude. OMT and drift occur together. Drift has a frequency of 2–5 Hz and it is typical in OMT studies to remove drift from the OMT signal using a 20–150 Hz bandpass filter. Microsaccades can be removed from the recorded OMT signal using a cutting method (Bolger et al 2000, Heaney et al 2004, Sheahan et al 1993, Spauschus et al 1999). Briefly, the cutting method utilizes an analysis program to identify any short segments of signal distortion associated with microsaccades. It then discards those segments and reconnects and realigns the signal before and after the discarded period to close the resulting gaps.
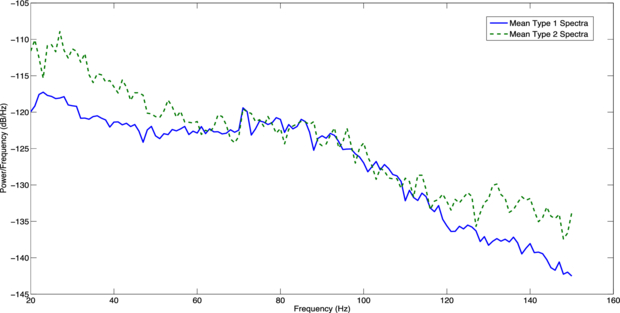
The bulk of the OMT spectrum lies in the 40–80 Hz range. (Sheahan 1991) defined the shape OMT spectra to be either 'type 1' or 'type 2' spectra. Type 1 spectra consist of significant high frequency peaks around 80 Hz, while in type 2, no significant high frequency peaks are found.
The ideal resolution requirements of a system to measure OMT using speckle correlation have been described elsewhere (Kenny et al 2013b). In short, a resolution of 2 µrad, a dynamic range of 2 µrad-9.52 mrad, a frame rate of 500 frames per second and a minimum frame-to-frame measurement ability of 1.56 mrad are desired. Using these parameters, other unwanted eye and head movements will be recorded and will therefore need to be filtered out of the overall signal during the signal processing stage. Previous studies using the speckle correlation system focused on tests using an in vitro eye movement simulator. Here, we test the measurement system in vivo on the human eye and initial results of OMT recorded using the non-contact system are presented.
1.1. Laser speckle correlation metrology
Laser speckle is a pattern of dark and bright spots observed when laser light is reflected from an optically rough surface. The design of a straightforward, non-contact technique to measure angular displacements in the range of OMT using laser speckle has been described elsewhere (Kenny et al 2013b). The design is based upon an angular laser speckle correlation system with imaging in the Fourier plane of a lens (Rose et al 1998a, 1998b). Included in the advantages of using this Fourier plane technique are that there is no strict target distance requirement and it has a relatively large insensitivity to displacements along the optical axis (Kenny et al 2013b). These features help ease the set-up alignment.
The set-up for the system is shown in figure 1. Light from a collimated, plane polarized HeNe laser beam is directed through a filter to a beam splitter, from there it is sent to a target where it is then reflected back to an image sensor placed in the Fourier plane of a lens. The out-of-plane angular rotation (θ) of the object is transformed to a linear displacement in the Fourier plane of the lens. The image sensor records the speckle patterns over a certain time.
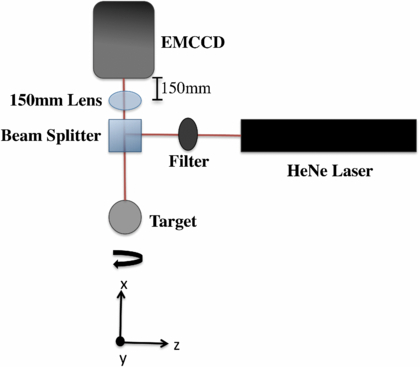
Figure 1. Set-up for speckle correlation. The system is invariant to lens to target distance.
Download figure:
Standard image High-resolution imageDuring post-processing, the recorded speckle-image frames are compared using a cross-correlation algorithm. The location of the cross-correlation peak between a reference frame and the frame preceding it shows the displacement shift, in pixels, between the two frames. Using known parameters of the optical set-up, this shift is converted from pixels to units of angular rotation, i.e. radians.
Speckle from an 'ideal' surface will exhibit surface scattering of the incoming light. However, speckle from laser light that penetrates into the volume of an object will exhibit multiple scattering. It is expected that this multiple scattering will lead to a bias error in the amplitude of measured displacement results.
Furthermore, when recording speckle from a living object, a form of time-varying speckle referred to as 'biospeckle' is expected. However, it has been shown that when recorded at a frame rate of 500 Hz, despite of the presence of biospeckle, the speckle captured from the eye sclera is reasonably stable between successive image frames and biospeckle alone has no systematic influence on the angular displacement measurement from the sclera (Kenny et al 2013a).
The primary aim of this paper is to determine whether useful OMT information can be recorded from the eye sclera in vivo using the proposed laser speckle correlation system.
2. Methods
2.1. Equipment and analysis
The equipment used to record OMT in vivo is shown in figure 2. The 632.8 nm plane polarized HeNe laser was reduced down to an eye safe level of 180 µW with the use of a beamsplitter and a neutral density filter. The maximum permissible exposure (MPE) outlined by international safety standards (IEC 2007, ANSI 2007) for a 10 s exposure of a 632.8 nm HeNe laser on a 7 mm pupil diameter is approximately 385 µW. This value of MPE is a limiting corneal exposure set to ensure retinal safety, whereas here the laser is directed at the sclera and will therefore pose less risk of retinal exposure. Speckle patterns were collected by an EMCCD camera (Cascade 128+, Roper Scientific) operating at 500 Hz with a 2 ms integration time, a 128 × 128 array of 24 µm pixels and a 100% fill factor. The EMCCD sensor was placed in the Fourier plane of the lens. The equipment was mounted on an x–y–z stage that allowed for movement in all directions and precise alignment of the laser on the eye sclera.
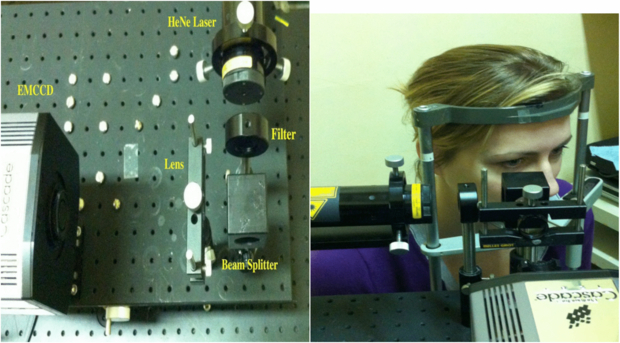
Figure 2. Equipment to measure OMT in vivo (left). The subject placed their head in the headrest during measurement (right).
Download figure:
Standard image High-resolution imageAfter the speckle images were captured, the 8-bit uncompressed avi file was sent to the numerical software package Matlab for processing. During the processing, each displaced speckle-image frame was cross-correlated with the previous speckle-image frame. The full 128 × 128 pixels were used for every image during the cross-correlation analysis. To increase the accuracy in finding the exact correlation peak, and consequently the speckle displacement, a sub-pixel algorithm was used to calculate cross-correlation peak. The change in correlation peak location over time was used to calculate the pixel displacement of the speckle images. The pixel displacement was then converted to units of angular rotation.
To study the evolution of speckle patterns in the eye, time history speckle patterns (THSP) (Oulamara et al 1989) plots were calculated. As an estimate of the frame-to-frame stability of the speckle patterns, a correlation peak height-to-standard deviation of floor estimate was calculated. This parameter is found from the cross-correlation plot between two successive images and is calculated from the peak of the plot divided by the average of the background floor value.
An analysis programme was written in Matlab to identify microsaccades in the signal and remove them. To isolate the OMT signal and remove the 2–5 Hz drift artifact and other unwanted noise, the measured displacement signal was bandpass filtered between 20–150 Hz using a Butterworth filter of the fifth-order.
The peak frequency of the measurements was calculated using the peak counting method. A peak counting program was written in Matlab to automatically count the peaks of the filtered OMT signal.
A segment overlap periodogram was implemented to estimate the spectral content of the OMT data. For this, the filtered data was divided into 512 segments with a 0.9 Hz resolution. The power spectral density was then estimated using a Fourier transform. Each segment was windowed with a Hamming window prior to being Fourier transformed.
To estimate the amplitude of the measured displacement over the measurement period, each local trough in the signal wave was subtracted from each subsequent peak and the mean of all values was taken to be the peak-to-peak amplitude of the measured signal.
2.2. In vitro phantom experiment
To investigate the influence of volume scattering on the speckle correlation results, an OMT simulator device (Kenny et al 2013b) was employed. First, a piece of cardboard was attached to the simulator's surface. The cardboard target approximately represented surface scattering. Using a frequency generator, the simulator was made to displace in a sine wave motion at the typical OMT frequency of 80 Hz and at OMT-like amplitudes ranging from 0 to 200 µrad in steps of 20 µrad. The experiment was repeated ten times at different target locations so that a unique speckle pattern was tested each time. Next, to represent volume scattering, a piece of plastic was used as the target for the laser beam and the procedure was repeated.
For these experiments, each speckle frame was cross-correlated with the original reference speckle-image frame in the sequence.
2.3. Subjects
The protocol established for this study was approved by the local ethics committee (St James's/AMNCH Research Ethics Committee). All volunteers were provided with an information leaflet and educated about the purpose and nature of the study. Written informed consent was obtained from all volunteers.
In accordance with the findings and recommendations of Collins (2011), volunteers in this study were asked to refrain from caffeine for 2 h prior to testing.
The following measurement procedure was implemented for all trials in this work. Any deviations from the procedure are noted. In all cases, OMT was measured in the horizontal direction.
The subject was seated and asked to place their head in a headrest. They were then asked to maintain as steady a position as possible, not to blink and to keep fixated in the straight ahead position. The beam was positioned approximately at the center of the visible area of lateral sclera. A 5 s recording was taken for each measurement. The total time taken to record speckle images from a subject was approximately 1 min, including set-up. The recordings were processed off-line.
2.4. In vivo measurement of a large angular displacement
As mentioned previously, multiple scattering is expected to cause a material-dependent systematic bias error in the speckle correlation measurement results. To check the accuracy of amplitude measurement by the system in vivo an experiment was designed to measure a known displacement.
A small group of three healthy volunteers (two male, one female, average age of 30 years) were recruited to investigate the ability of the system to follow a large angular movement at OMT-like resolution. Each volunteer was asked to follow a crosshair moving linearly across a computer screen. The screen was placed 100 cm away from the volunteer and the crosshair translated a distance of 4 cm in the horizontal direction. With this set-up the angular displacement of the eye is expected to be 40 mrad. The speckle patterns were recorded as described above, although, a 7 s (3500 image frames) recording was taken to allow time for the eye to comfortably follow the crosshair.
With this design, the mean velocity of the eye as it tracks the crosshair will be 5.71 mrad s−1. Using a frame-to-frame measurement and a 500 Hz sample rate, this is equivalent to a displacement of 5.71 mrad s−1–500 s−1 = 11.4 µrad per frame (assuming all other eye movements cause a zero net displacement). As such, if the overall 'large' movement can be measured, then this demonstrates that displacements close to the desired 12 µrad resolution necessary to measure OMT can be measured by the technique.
2.5. Measurements of OMT on a group of volunteers
In vivo speckle measurements were captured from twenty healthy volunteers (7 males, 13 females, aged between 23–34 with a mean age of 27 years). In addition to calculating the signal spectral data and measuring amplitude, OMT speckle patterns were analyzed using the speckle contrast (i.e. the standard deviation of the speckle intensity divided by the mean intensity) (Goodman 2007), correlation peak height-to-standard deviation of floor ratio and THSP (Oulamara et al 1989).
3. Results
3.1. In vitro phantom experiment
The input versus output displacement traces for the cardboard and plastic materials are shown in figure 3. As can be seen in the figure, the measured displacement from the plastic surface (volume scattering material) is much lower than expected. Conversely, the measured displacement from the cardboard (surface scattering material) agrees closely with the expected results. The slopes of the linear fit of the measured versus expected displacement, were found to be 1.02 ± 0.02 and 0.60 ± 0.03 for the cardboard and plastic respectively. The uncertainties given are standard deviations. For both materials, the values were not found to differ radically with different beam target locations i.e. with different speckle realizations. This is exemplified by the low standard deviations. These results show that the measured displacement is dependent on the scattering properties of the target material and suggest a material dependent 'calibration' factor could be potentially be used to correct the measured displacement amplitudes.
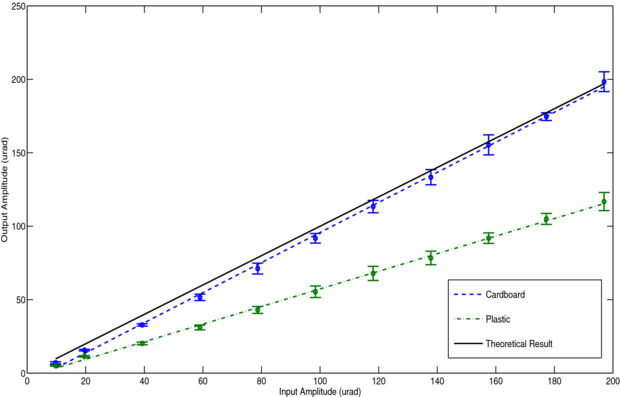
Figure 3. Input versus output amplitude measured for cardboard and plastic surfaces using an OMT movement simulator. The error bars represent the standard deviation between the mean amplitude of each of the ten measurement results.
Download figure:
Standard image High-resolution image3.2. In vivo measurement of a large angular displacement
The displacement as shown in figure 4 is generated by integrating the displacement estimated from frame to frame. Where there is a sudden jump between frames, e.g. in the case of a microsaccade, the displacement may not in all cases faithfully follow the actual movement and result in an erroneous DC shift in the trace. Faithfully following intermittent microsaccades is not a goal of the design. A fairer test of the response of the system to the voluntary rotation of the eye used in this experiment, is to remove these jumps and look at the average trace measured velocity compared to expected velocity. With the jumps removed the expected linear progression of the movement is more clearly shown. Because of the cutting technique used to remove the microsaccades, the traces are marginally shorter than the original 7 s duration of data recorded. The expected velocity per frame is 5.71 mrad s−1. The mean velocity from each subject (calculated from the average value of rotation per frame) was found to be 2.97, 1.44 and 2.03 mrad s−1 with an average error  of 63.2% on velocity. Table 1 displays the measured rotation and means velocity for each subject, calculated from the traces with microsaccades removed.

Figure 4. Measured large angular displacement of human sclera as subjects tracked a crosshair moving on a computer screen. Microsaccades were removed from the traces. The results from three different subjects are shown.
Download figure:
Standard image High-resolution imageTable 1. Measured displacement and mean velocity for each subject. Mean values are shown with their corresponding standard deviations.
| Total displacement (mrad) | Mean displacement per frame (µrad per frame) | Mean velocity per frame (mrad s−1) | |
|---|---|---|---|
| Subject 1 | 20.27 | 5.93 | 2.97 |
| Subject 2 | 13.89 | 4.05 | 2.03 |
| Subject 3 | 9.81 | 2.88 | 1.44 |
| Mean values | 14.66 ± 5.27 | 4.29 ± 1.54 | 2.15 ± 0.77 |
| Expected result | 40 | 11.4 | 5.71 |
3.3. Measurements of OMT on a group of volunteers
3.3.1. Blinks
Any blinks in the measurement traces were immediately obvious. The effects of a blink on the measurement are shown in figure 6. They caused a lowering the speckle contrast, a jump in the unfiltered displacement trace and a dark area in the THSP. In figure 5(a), it is important to note the unfiltered displacement trace is almost flat during the blink and is followed by a discontinuous jump after the blink occurs, when the eye is returning to its normal condition.
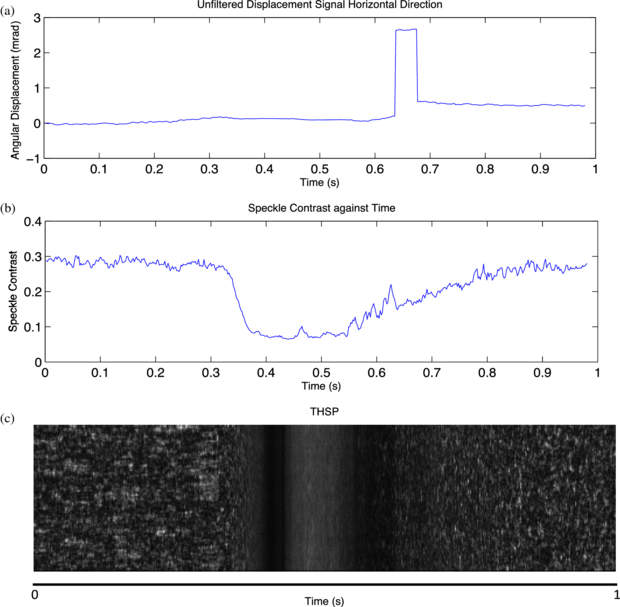
Figure 5. Effect of a blink on the measurement results of (a) the unfiltered measured displacement, (b) the speckle contrast and (c) the THSP.
Download figure:
Standard image High-resolution image
Figure 6. Influence of miscrosaccades on the measurement results of (a) the unfiltered displacement, (b) the filtered displacement (before microsaccade removal), (c) the speckle contrast, (d) the correlation peak height-to-standard deviation of floor ratio and (e) the THSP.
Download figure:
Standard image High-resolution imageThe effects of blinks on the THSP appeared distinctly different to change in the THSP caused by microsaccades. When a blink occurred, the THSP displayed blurred speckle, a dark area, more blurred speckle, another dark area and more blurred speckle before returning to the high-contrast speckle. It is supposed that the middle blurred speckle is speckle reflected from the closed eyelid, while the dark areas on either side are caused from the eyelid opening and closing. The outer blurred areas are likely to be due to changes in the tear layer prior to, and following a blink.
3.3.2. Microsaccades
Most recorded eye traces showed evidence of irregular, large, sudden displacements consistent with microsaccades. Results recorded from a 5 s measurement of one subject are shown in figure 6. Locations where microsaccades occur are indicated with arrows. Evidence of the microsaccade-like displacements can be seen in the unfiltered and filtered displacement signals as well as in the speckle contrast, peak height-to-standard deviation of floor ratio and TSHP. Large amplitude microsaccades are easily visible in the displacement traces, where they distort the measured signal. Smaller microsaccades are found upon closer inspection of the displacement trace but are more striking in the contrast and correlation plots. The high velocity of the microsaccades caused a reduction in the speckle contrast of the recorded speckle patterns and lead to blurred speckle patterns and a reduction in the signal peak height-to-standard deviation floor ratio. This can be noted in the plots of speckle contrast and peak height-to-standard deviation of floor ratio over time. The blurred speckle can be noted in the THSP. In comparison to the blurring caused by blinks, the microsaccades do not cause the distinctive fully dark areas in the THSP and are of a shorter duration.
The measured values for the microsaccade-like displacements are consistent with values for microsaccades in the literature (frequency of 1–2 microsaccades per second and an amplitude of 1.45 mrad). The peak-to-peak amplitudes of the microsaccades varied, with a range of 0.058–7.89 mrad and a mean and standard deviation of 1.4 ±1.8 mrad. The number of microsaccades per unit time in the recorded traces also varied between subjects. The range across subjects was found to be between 0–2.6 microsaccades per second with a mean and standard deviation of 0.65 ± 0.75 microsaccades per second. A similar variability of between 0–2.73 microsaccades per second was reported by Collins (2011). Figure 7 shows an example of an unfiltered OMT measurement both before and after microsaccade removal.
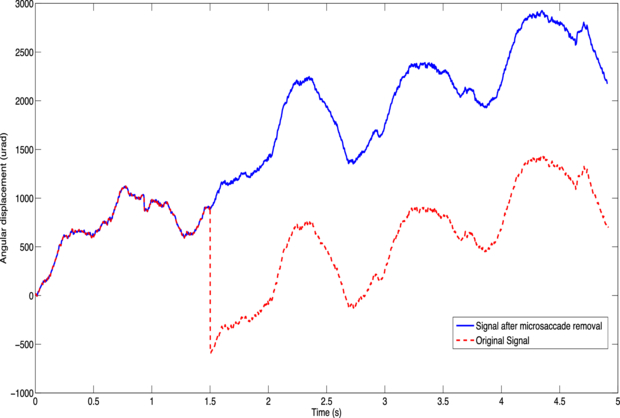
Figure 7. A 5 s unfiltered signal measured from a subject in vivo showing the trace before microsaccade removal (dashed line) and after microsaccade removal (solid line).
Download figure:
Standard image High-resolution image3.3.3. Drift
The slow drifting background of figure 7 is indicative of drift type eye movement. The plot shows a high frequency component overlaid on the drift component. As can be seen in the OMT signal in figure 8, the drift component of the signal was effectively filtered out by the 20–150 Hz bandpass filter.

Figure 8. 1 s of a measured OMT signal from a subject. Microsaccades were removed from the signal and it was bandpass filtered between 20–150 Hz to remove any drift artifact.
Download figure:
Standard image High-resolution image3.3.4. OMT
Figure 8 shows a typical 1s filtered OMT record. Microsaccades were removed from the trace prior to bandpass filtering. The mean peak frequency for the 20 subjects, estimated from peak counting, was 78.27 ± 3.86 Hz, where the uncertainty is the standard deviation of results. This peak frequency is similar to the peak count values reported from both the largest OMT frequency study (84 Hz) (Bolger et al 1999b) and the most recent report of OMT peak frequency (87.3 Hz) (Collins 2011).
The mean and standard deviation of the peak-to-peak amplitude of OMT was found to be 21.42 ± 7.01 µrad. This is within the same order of the expected range of 12–200 µrad peak-to-peak. However, from the results of section 3.1 for a large angular displacement, the measured amplitude is expected to be approximately 37% of the true value. Potentially this error may be nonlinear and change with amplitude. However, the mean frame-to-frame displacements measured in the crosshair tracking study were of the same order of OMT. Therefore, it is reasonable to assume that the measurement error found in the large angular displacement experiment, also applies to the measurements recorded for OMT and that the true mean value for the amplitude might be about 29 µrad.
The periodograms of the OMT spectra recorded for all 20 subjects displayed shapes that were consistent with those defined by Sheahan (1991). The spectral category of each periodogram was classified by visual inspection based on whether or not a 'knee' of high frequency peaks was present in the periodogram. Thirteen of the twenty spectra were found to be type 1 while the remaining seven were classified as type 2 spectra. Figure 9 displays the mean power spectra for both type 1 and type 2 spectra. The means were derived by averaging all type 1 and all type 2 spectra. As can be seen in the figure, the type 1 spectra power falls from 20 Hz and rises again between 70–80 Hz before falling off. In comparison, the type 2 spectra show no clear spectral peak.
Figure 9. Periodogram derived by averaging all 'type 1' and all 'type 2' OMT spectra.
Download figure:
Standard image High-resolution image
4. Discussion
A non-contacting device to record OMT is essential to extend its feasibility as a clinical tool and to provide a means to allow for further research into OMT's role in vision. This paper aimed to investigate whether a reliable OMT signal could be recorded using a non-contact laser speckle correlation system.
It was established in this study that parameters consistent with known OMT values could be recorded using the proposed speckle correlation system. A mean peak frequency of 78 ± 3.86 Hz, established from the peak counting method, was calculated for the 20 subjects tested in the study. This is in the same order of the mean peak value of 83.68 ± 5.78 Hz calculated by Bolger et al (1999b) in the largest study performed on OMT frequency. Discrepancies between the two mean peak values could be due to the different measurement techniques used and the small number of subjects in this study. Since there is no gold standard approach to measure OMT frequency, the values reported here can only be compared to values reported elsewhere in the literature.
Preliminary results using an OMT movement simulator to investigate the influence of multiple scattering on the speckle correlation system found the plastic target to underestimate the applied amplitude. This error in amplitude measurement was not present with the cardboard (surface scattering) material and we attribute the amplitude error to multiple scattering. A more complete theory to account for the error seen with multiple scattering targets is required. Future work to develop this theory should examine whether the error is linear or nonlinear with amplitude.
The in vivo measurement of a large angular displacement from the sclera showed that the speckle correlation system is capable of tracking a gross voluntary eye-movement. As this gross voluntary movement is tracked by detecting and integrating frame-to-frame eye rotations of the order of only 11.4 µrad, the experiment also demonstrates that the system has sufficient resolution to track displacements in the range of OMT (12–216 µrad).
In the same experiment, the speckle system underestimated the overall amplitude of eye rotation expected. A likely explanation for this is that the scleral surface does not behave as the 'perfect' singly scattering surface envisaged in speckle correlation metrology theory and that this introduces a bias error. The laser beam does penetrate into the scleral surface and suffers from multiple scattering before emerging again. A limitation on the error estimation here is that it is unclear as to what range of errors to expect from the small numbers studied in this work. The error may vary for different individuals and it is unknown whether the error is linear or if the error changes with amplitude.
Measurements that contained blinks were not processed for the results of this study since if a subject blinked, a new measurement was recorded. Nonetheless, processing of the discarded measurements did show instances of signal loss due to blinks and their corresponding build up of tears. The cutting method used to remove microsaccades was also capable of removing parts of the signal that contained blinks. In contrast to other studies (Boyle 1999, Collins 2011), in this work the eyelids were not taped open. Taping the eye open can lead to discomfort for a subject and drying out of the eye. Since blinks can be easily removed from the signal (with only the same limitations as those for microsaccade removal), it is reasonable to assume that OMT measurement can be performed without taping the eyes open.
Future refinements to the optical set-up would include making it more compact so that it could be developed into a handheld device. Laser diodes could be implemented to reduce the size of the optics. However, to produce good quality speckle, the laser diodes would need to be highly coherent. Any change in the wavelength of the laser used for speckle correlation would have the effect of changing the speckle size and the scattering properties of the target.
A more compact and portable optical design would also allow for the system to be tested simultaneously with the eye-contacting piezoelectric probe system for OMT measurement. Typically, the PZT is used while the subject is in the supine position. Our current system, however, is designed for a subject who is seated or standing. Further research using a portable optical design should consider a direct comparison between the proposed non-contact system and the gold standard piezoelectric method.
The optimal choice of source wavelength for this application is a balance between safety, camera sensitivity and scattering effects. In general the eye hazard reduces as the wavelength increases, allowing higher permissible power levels and potentially greater signal-to-noise ratios. This favors using visible over ultraviolet and infra-red over visible. Infra-red sources are typically used in other eye-tracking systems. These sources have the benefit of allowing the power levels used to be about five times higher than that of a red HeNe laser without increasing the hazard to the eye. However, not all of this benefit can be realized as the spectral response of available cameras typically drops moving into the infra-red range. For example, for the camera used here, the quantum efficiency drops from its peak in the visible range to about half that value at 800 nm. While cameras with better infra-red responses are available, this application demands higher than standard frame rates, limiting potential choices.
Multiple scattering in a material is dependent on the absorption coefficient of the material, which in turn is dependent on the wavelength of the incoming light. To keep multiple scattering at a minimum at short penetration of the incoming light is desired. In the infra-red range of the electromagnetic spectrum (λ ≥ 2000 nm), light is mostly absorbed and penetrates only to a depth of about one or two cell layers in tissue (Tuchin 2002). In the 600–1600 nm wavelength range, scattering prevails over absorption and the percentage of reflected incident light increases to 35–70%. In this range, light penetrates to a depth of about −10 mm (Tuchin 2002). Given the potential for increasing source power and reducing multiple scattering, investigation of the technique using an infra-red laser would seem worthwhile.
An alternative method to attempt to overcome the difficulties associated with multiple scattering would be to incorporate a polarization difference imaging technique into the design of the speckle system. This could aid the separation of the singly-scattered speckle from the multiply-scattered speckle. However, the technique would require an additional camera and other optics, increasing the bulk of the system. Nonetheless future work may consider this design.
5. Conclusions
A novel technique to measure ocular microtremor (OMT) in vivo from the eye sclera in a non-contact manner was tested. It was found that, even in the presence of other eye and head movements, tear flow and time-varying speckle, that the OMT signal could be tracked. Motion consistent with OMT, drift and microsaccades was detected by the technique. Some uncertainty is noted in the amplitude measurement. A peak frequency of 78.27 ± 3.86 Hz and mean peak-to-peak amplitude of 21.42 ± 7.01 µrad was measured from OMT measurements of 20 subjects. Although a small number of subjects was used, the study has shown evidence that OMT can be recorded in a non-contact manner using laser speckle correlation.
Acknowledgment
This work is based on research supported by Science Foundation Ireland.