
Abstract
Monte Carlo simulation was used to calculate correction factors for output factor (OF), percentage depth-dose (PDD), and off-axis ratio (OAR) measurements with the CyberKnife M6 System. These include the first such data for the InCise MLC. Simulated detectors include diodes, air-filled microchambers, a synthetic microdiamond detector, and point scintillator. Individual perturbation factors were also evaluated. OF corrections show similar trends to previous studies. With a 5 mm fixed collimator the diode correction to convert a measured OF to the corresponding point dose ratio varies between −6.1% and −3.5% for the diode models evaluated, while in a 7.6 mm × 7.7 mm MLC field these are −4.5% to −1.8%. The corresponding microchamber corrections are +9.9% to +10.7% and +3.5% to +4.0%. The microdiamond corrections have a maximum of −1.4% for the 7.5 mm and 10 mm collimators. The scintillator corrections are <1% in all beams. Measured OF showed uncorrected inter-detector differences >15%, reducing to <3% after correction. PDD corrections at d > dmax were <2% for all detectors except IBA Razor where a maximum 4% correction was observed at 300 mm depth. OAR corrections were smaller inside the field than outside. At the beam edge microchamber OAR corrections were up to 15%, mainly caused by density perturbations, which blurs the measured penumbra. With larger beams and depths, PTW and IBA diode corrections outside the beam were up to 20% while the Edge detector needed smaller corrections although these did vary with orientation. These effects are most noticeable for large field size and depth, where they are dominated by fluence and stopping power perturbations. The microdiamond OAR corrections were <3% outside the beam. This paper provides OF corrections that can be used for commissioning new CyberKnife M6 Systems and retrospectively checking estimated corrections used previously. We recommend the PDD and OAR corrections are used to guide detector selection and inform the evaluation of results rather than to explicitly correct measurements.
Export citation and abstract BibTeX RIS

Original content from this work may be used under the terms of the Creative Commons Attribution 3.0 licence. Any further distribution of this work must maintain attribution to the author(s) and the title of the work, journal citation and DOI.
1. Introduction
Dosimetric measurement uncertainties in small fields can be significant (Aspradakis et al 2010), leading to recommendations for the use of additional detector and treatment unit specific corrections to reduce uncertainty (Alfonso et al 2008). Previously, we have used Monte Carlo (MC) simulation to evaluate these corrections for circular fields on the CyberKnife® Robotic Radiosurgery System (Accuray Inc., Sunnyvale USA). This system uses an un-flattened 6 MV treatment beam collimated to a set of 12 field diameters ranging from 5 mm to 60 mm at 800 mm SAD. This work concentrated initially on corrections for output factor (OF) measurement (Francescon et al 2012, 2014a) and was then expanded to corrections for percentage depth dose (PDD), tissue phantom ratio (TPR), and off axis ratio (OAR) measurement (Francescon et al 2014b). A range of stereotactic diode detectors and air-filled microchambers were investigated together with a liquid-filled microchamber and a point scintillation detector. These studies used the CyberKnife VSI or earlier versions (Kilby et al 2010). Subsequently, the CyberKnife M6 series has been introduced. This features a new modulator, fixed beam line components, and circular secondary collimator designs, all of which are relevant to MC modelling and therefore influence the correction factors. A multileaf collimator (MLC) has been introduced for the first time, increasing the range of treatment fields available and increasing the maximum field size to 115 mm × 100 mm (Asmerom et al 2016). Currently there are no published detector corrections for the M6 version with circular collimators or MLC.
New types of detector which offer advantages for small field dosimetry over diodes in terms of water equivalence, and air-filled microchambers in terms of volume averaging and density variation, are commercially available. One such is a point scintillation detector which combines good water equivalence and a small sensitive volume (Carrasco et al 2015). We previously calculated correction factors for OF measurement with this detector as ⩽0.3% for all VSI system circular collimators, although this wasn't verified by measurement (Francescon et al 2014a). A subsequent multi-centre study comparing OF measurements to corrected diode measurements showed an average agreement of ⩽1.0% for all CyberKnife circular fields (Masi et al 2016), and a study using another 6 MV treatment beam with similar field sizes reported corrections of ⩽0.6% (Papaconstadopoulos et al 2014). We also reported very small corrections (<1%) for TPR, PDD, and OAR measurements with this detector and small circular CyberKnife fields (Francescon et al 2014b). Slightly larger OAR corrections of up to 3% outside of other 6 MV beams have been reported (Papaconstadopoulos et al 2014).
Another promising technology is the synthetic microdiamond detector. This provides superior water equivalence to diode detectors and smaller sensitive volume than air-filled microchambers, although is inferior to a point scintillator in both respects. The first evaluation of microdiamond measured OF using CyberKnife VSI circular fields compared them against a mean of corrected diode and microchamber measurements and reported a maximum difference (microdiamond over-response) of 1.9% at the 7.5 mm field size (Chalkley et al 2014). A subsequent measurement comparison using CyberKnife, in which a corrected diode measurement was used as reference, showed a maximum over-response of 0.6% at the 7.5 mm field size (Russo et al 2016), and an expanded version of that study has reported this to be increased to 1.3% (Masi et al 2016). At the smallest field size (5 mm) these studies report an over-response of 1.0% (Chalkley et al 2014), 0.2% (Masi et al 2016) and under-response of 0.2% (Russo et al 2016). Multiple studies have been performed with this detector using other treatment devices (Azangwe et al 2014, Morales et al 2014, Papaconstadopoulos et al 2014, Ralston et al 2014, Lárraga-Gutiérrez et al 2015, Underwood et al 2015, O'Brien et al 2016) and have reported inconsistent behavior at small field sizes, from over-response of 5.0% (Ralston et al 2014) to under-response of 2.7% (Lárraga-Gutiérrez et al 2015). The applicability of these results to CyberKnife is complicated by the differences in collimator design, beam quality, measurement depth and distance, definition of machine specific reference field, and presence or absence of a flattening filter, and also by the variety of empirical and numerical methods employed. Very small corrections (<1%) have been reported for PDD measurements with this detector, both with CyberKnife (Chalkley et al 2014) and other treatment systems (Lárraga-Gutiérrez et al 2015, Underwood et al 2015). For OAR, studies have shown a relative over-response with this detector in the first 2–3 mm outside the beam with a magnitude varying between 3% with CyberKnife (Chalkley et al 2014) to 10% with other systems (Papaconstadopoulos et al 2014, Lárraga-Gutiérrez et al 2015).
This paper will present the first set of correction factors obtained by MC simulation for OF, PDD, and OAR measurements on the CyberKnife M6 System, including circular collimators and MLC. These corrections are evaluated for a range of commercial stereotactic diodes and microchambers, together with the synthetic microdiamond and point scintillation detectors, and are validated by comparison to measurement. In addition, the impact of each aspect of detector design on measurement perturbation will be presented with the intention that this might provide guidance for the improvement of future detector designs and make clear the relative importance of capturing each design component in MC simulations.
2. Method
2.1. MC simulation
The correction factor, kΩ, converting a ratio of measurements corrected for influence quantities to a ratio of absorbed doses was calculated as

where D(r, z, f) is the MC calculated absorbed dose per history at off-axis position r, depth d, and field aperture f. The subscript 'det' indicates that dose is scored within the sensitive volume of the detector placed within a water phantom, and 'w' indicates that dose is scored at the same position in the absence of the detector in a single voxel of 0.25 mm radius and 0.5 mm height. We assume that Ddet is directly proportional to measurement after correction for influence quantities, and therefore a ratio of measurements multiplied by kΩ yields the corresponding point dose to water ratio in the absence of the detector. With appropriate selection of geometric parameters this method was used to calculate correction factors for OF, PDD, and OAR. Specifically, for OF simulations we set r = rref = 0, z = zref = 15 mm, f was variable circular and rectangular apertures formed by the fixed collimators and MLC respectively, and fref = 60 mm fixed collimator (the machine specific reference, msr, field for CyberKnife). Simulations were performed with the water phantom at 785 mm SSD to place the calculation point at msr distance 800 mm. In this situation kΩ is identical the  as defined in Alfonso et al (2008). For PDD we set r = rref = 0, z is variable, f is variable rectangular MLC apertures, zref = 15 mm, fref = f. For OAR we set r to be variable and rref = 0, z is variable, f is variable rectangular MLC apertures, zref = z, fref = f. PDD and OAR calculations were at 800 mm SSD.
MC simulations were performed using BEAMnrc (Rogers et al 2005) as a particle source for egs_chamber (Wulff et al 2008) and the details have been reported previously (Francescon et al 2012, 2014b). A CyberKnife M6 head model, including both fixed circular collimators and MLC, was developed using vendor supplied data. The primary electron beam was modelled as monoenergetic with a Gaussian profile, with energy and full-width half maximum (FWHM) optimized by comparison of MC simulated dose to detector OAR and PDD with corresponding measurements. The MLC was constructed as a new model by combining classes from the EGSnrc geometry library, and included the 0.5° leaf tilt designed to minimize inter-leaf leakage (Asmerom et al 2016).
The detectors modelled were air-filled ionisation microchambers PTW 31014 PinPoint (PTW, Freiburg, Germany) and Exradin A16 (Standard Imaging, Middleton WI, USA), stereotactic diodes PTW 60008, 60017, 60018, Sun Nuclear Edge detector (Sun Nuclear, Melbourne FL, USA), and IBA Razor detector (IBA Dosimetry GmbH, Schwarzenbruck, Germany), the PTW 60019 synthetic microdiamond detector, and the Exradin W1 point scintillation detector. Vendor supplied data was used to model each detector, with the dimensions of the 60019 sensitive volume taken from Marinelli et al (2016). These detector types have been included in our previous studies except the synthetic microdiamond, and therefore  for fixed collimators with this detector were calculated at the two additional SDD (650 mm and 1000 mm) needed to commission the vendor supplied treatment planning system in order to derive distance correction factors, CFSDD as defined in Francescon et al (2014a)

OF corrections were calculated for all detectors. PDD and OAR corrections were calculated for all except W1 since it cannot currently perform automated scanning measurements. Because of the asymmetry in the Edge detector design, OAR simulations were performed in two orientations as illustrated in the results, and in the parallel orientation the simulations included the detector positioned at both sides of the beam.
The chain method of multiple MC simulations, in which the full detector geometry is sequentially reduced to a small volume of water, was used to calculate perturbation factors for each part of the design. We performed this analysis for the 31014 microchamber, 60018 diode, and 60019 microdiamond at variable depths. For the microchamber we used the method and terminology described by Bouchard et al (2009). For the diode and microdiamond we use the method and terminology from Francescon et al (2014b) except that here we divide Pwall1 into two parts, Pwall1 = Patt × Pscatt, where Patt is the perturbation associated with only the encapsulation above the sensitive layer, and Pscatt is that associated with the encapsulation lateral to and behind the sensitive layer. The correction factor kΩ is linked to the product of these perturbations by
where Pi is one of the N perturbations considered. These factors were evaluated for 7.6 mm × 7.7 mm and 53.8 mm × 53.9 mm MLC fields. Also, since the synthetic microdiamond was not included in our previous study we calculated its perturbations for the smallest fixed collimator. Finally, the variation in mean photon and electron energy in water as a function of off-axis distance for the smallest and largest fixed collimators was calculated.
2.2. Experimental
Measurements were performed using CyberKnife M6 Systems at the vendor's test facility (site I) and at the CyberKnife Center, IFCA, Florence (site II). At site I, OF measurements were made with fixed collimators and MLC using 60008, 60018, 60019, Edge, Razor, and A16 detectors. Measurements were performed at 785 mm SSD and 15 mm depth in water and were normalized to the 60 mm fixed collimator. Detectors were mounted in a PTW MP3 water tank with stems parallel to the beam central axis, except the Edge detector which was perpendicular as per vendor recommendations. For the A16 a bias of 300 V was applied and measurements were averaged between positive and negative polarity, with temperature and pressure variations monitored and found to be insignificant. The effective point of measurement for each detector was taken from vendor supplied data. Detectors were initially aligned using the beam central-axis laser, and these positions were fine-tuned by scanning OAR with the 5 mm fixed collimator or 7.6 mm × 7.7 mm MLC aperture and aligning to dose maximum. Repeat measurements at a reference field size were made throughout each series to correct for output variation, and each measurement was averaged over at least three repeat exposures. PDD and OAR were measured using a subset of detectors at 800 mm SSD in water for multiple fields including the smallest and largest MLC apertures and the smallest fixed collimator.
At site II, fixed collimator and MLC OF were measured using the same experimental procedures as site I, with the 60017, 60019, and W1 detectors (a different 60019 detector to that used at site I). Cerenkov background correction was performed for the W1 using the two-channel method recommended by the vendor (Guillot et al 2011), whereby the corrected reading is derived from the charge measurements in colour channels 1 (C1) and 2 (C2) as Gain * (C1 − C2 * CLR). CLR is the Cerenkov light ratio and is obtained using measurements made with two different irradiated optical fibre lengths. A water phantom geometry with the detector oriented vertically as for OF measurement was used to determine CLR as described by Morin et al (2013) and recommended by the vendor (Standard Imaging 2014). W1 measurements were made using the vendor supplied dual-channel SuperMAX electrometer (Standard Imaging). CLR calibration and OF measurements were repeated over a period of 2.5 months to assess reproducibility.
Measured OF were compared between detectors before and after correction, i.e.

Where OF is the ratio of detector measurements, M, in fields fclin and fmsr ( corrected only for detector influence quantities, and Ω is the corresponding point dose ratio or field factor (Alfonso et al 2008).
2.3. Estimation of uncertainties
2.3.1. MC simulation uncertainties.
Type A uncertainty was calculated from the statistical uncertainty in each term of equation (1). For OF corrections these were ⩽0.26% (mean 0.13%), and for PDD corrections the average uncertainty was 0.20% at 15 mm depth increasing to 0.45% at 300 mm. For OAR correction the average uncertainty at points within the beam was 0.2% at 15 mm depth and 0.4% at 300 mm. Statistical uncertainty was increased outside the beam, but remained ⩽4% at the largest off-axis distance and depth included in figure 3. Type B uncertainties associated with cross-section data, detector modelling, and electron beam parameters that were previously evaluated in Francescon et al (2012) were used here.
2.3.2. Measurement uncertainties.
Reproducibility in each OF measurement, without changing the detector setup or aperture, was evaluated over at least three repeat readings and was ⩽0.5% (one S.D.) for the point scintillator and ⩽0.3% for all other detectors. The uncertainty in OF measurement associated with MLC aperture reproducibility has been shown previously to be ⩽0.1% (Asmerom et al 2016), and that due to detector positioning uncertainty is <0.5% (Francescon et al 2012). For detector positioning uncertainties in PDD and OAR we used the method developed by Bouchard et al (2011), For PDD measurement this has been shown previously to give a combined uncertainty of 0.26%, assuming detector positioning uncertainty of 0.1 mm, an SSD uncertainty of 1 mm, and an angular uncertainty of 0.1° in the alignment of the detector motion and beam axes (Francescon et al 2014b). For OAR we have previously shown that the measurement uncertainty varies with off-axis position, and for the 5 mm fixed collimator varies from 0% at central axis to 8% in the steepest dose gradients given the positional uncertainties described above (Francescon et al 2014b).
3. Results
3.1. MC modelling
The optimum model parameters were E = 6.5 MeV and FWHM = 2.2 mm. With these the average agreement of MC simulated and measured diode (60018) and microdiamond PDD across the full range of field sizes was <1% at 10 cm and 20 cm depth. Comparison of simulated and measured MLC beam profiles demonstrated that the leaf tip and leaf side geometries were accurately modelled and the effect of the leaf tilt on the y-profile symmetry and FWHM were captured in the simulations.
3.2. Output factors
The  for fixed collimators are shown in table 1 and for MLC in table 2. The combined uncertainty in these factors is <1.0% for microchambers and <0.8% for other detectors. As in previous studies, these calculations show that diodes over-respond in small fields and air-filled microchambers under-respond. Measured output factors from sites I and II before (
 ) and after (
 ) correction using the data presented in these tables are shown in figure 1 for fixed collimators and figure 2 for MLC fields. The estimated uncertainty in each corrected OF is 1.2% for microchambers, 1.0% for diodes, and 1.1% for the point scintillator. The inter-detector variations are significantly reduced after correction factors are applied. For the 5 mm fixed collimator OF measurements made using six different detector types at site I show a maximum difference between any two detectors of 15.3%, reducing to 2.9% after application of corrections. In the 7.6 mm × 7.7 mm MLC field the corresponding values were 8.3% and 1.7%. At site II measurements were made with three detectors, and after application of corrections the maximum variation between any two was <1.5% for both fixed collimators and MLC. The distance correction factors for the synthetic microdiamond are shown in table 3. Reproducibility of measured output factors after repeat set-up was found to be relatively large with the W1 detector, with a maximum difference of 2.2% over four measurement sets. The measured CLR ranged between 0.691 and 0.709.
Table 1. Values of  calculated for the six smallest circular fixed collimators on the CyberKnife M6 System.
| Detector |  Field size (mm) Field size (mm) |
|||||
|---|---|---|---|---|---|---|
| 5 | 7.5 | 10 | 12.5 | 15 | 20 | |
| PTW 60008 | 0.939 | 0.958 | 0.972 | 0.983 | 0.990 | 0.998 |
| PTW 60017 | 0.949 | 0.967 | 0.977 | 0.984 | 0.991 | 0.999 |
| PTW 60018 | 0.942 | 0.965 | 0.975 | 0.984 | 0.991 | 0.996 |
| SN edge | 0.943 | 0.953 | 0.963 | 0.976 | 0.984 | 0.995 |
| IBA razor | 0.965 | 0.991 | 0.997 | 1.000 | 1.002 | 1.003 |
| Exradin A16 | 1.099 | 1.025 | 1.013 | 1.006 | 1.002 | 1.002 |
| PTW 31014 | 1.107 | 1.028 | 1.014 | 1.006 | 1.003 | 1.003 |
| PTW 60019 | 1.007 | 0.986 | 0.986 | 0.991 | 0.992 | 0.997 |
| Exradin W1 | 1.008 | 1.006 | 0.999 | 1.003 | 1.004 | 1.009 |
Table 2. Values of  calculated for the smallest, largest, and four intermediate rectangular MLC fields symmetric about the beam central axis on the CyberKnife M6 System.
| Detector |  Field size (mm)
 |
|||||
|---|---|---|---|---|---|---|
| 7.6 × 7.7 | 15.4 × 15.4 | 23.0 × 23.1 | 53.8 × 53.9 | 84.6 × 84.7 | 115 × 100.1 | |
| PTW 60008 | 0.958 | 0.990 | 1.004 | 0.999 | 0.999 | 0.996 |
| PTW 60017 | 0.963 | 0.996 | 0.999 | 1.001 | 0.997 | 0.998 |
| PTW 60018 | 0.961 | 0.994 | 0.998 | 0.998 | 0.998 | 0.996 |
| SN edge | 0.955 | 0.989 | 0.999 | 1.003 | 1.003 | 1.003 |
| IBA razor | 0.982 | 0.996 | 0.996 | 0.995 | 0.988 | 0.985 |
| Exradin A16 | 1.035 | 1.005 | 1.002 | 1.003 | 0.999 | 0.999 |
| PTW 31014 | 1.040 | 1.004 | 1.000 | 0.999 | 1.001 | 1.001 |
| PTW 60019 | 0.990 | 0.995 | 0.997 | 1.001 | 0.995 | 1.001 |
| Exradin W1 | 1.003 | 1.005 | 1.005 | 1.006 | 1.004 | 1.004 |
Table 3. Values of CFSDD calculated for the six smallest circular field sizes on the CyberKnife M6 System with the PTW 60019 synthetic microdiamond detector.
| SDD (mm) | Field size (mm) | |||||
|---|---|---|---|---|---|---|
| 5 | 7.5 | 10 | 12.5 | 15 | 20 | |
| 650 | 1.003 | 1.000 | 1.001 | 0.996 | 0.999 | 0.998 |
| 1000 | 0.993 | 1.005 | 1.005 | 1.002 | 1.004 | 0.998 |
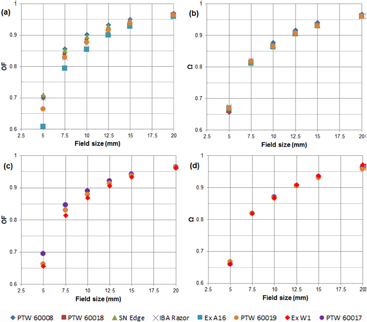
Figure 1. Measured output factors for the six smallest fixed collimators before ( , simplified to OF in the figures (a) and (c)) and after (
 , simplified to Ω in figures (b) and (d)) correction using the data from table 1. Measurements made using CyberKnife systems at site I ((a) and (b)), and site II ((c) and (d)).
Download figure:
Standard image High-resolution image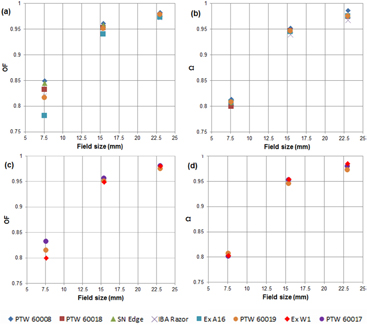
Figure 2. Measured output factors for the three smallest commissioned square MLC fields before ( , simplified to OF in the figures (a) and (c)) and after (
 , simplified to Ω in figures (b) and (d)) correction using the data from table 2. Measurements were made using CyberKnife systems at site I ((a) and (b)) and site II ((c) and (d)).
Download figure:
Standard image High-resolution image3.3. Percentage depth dose
MC simulations show the largest corrections in the build-up region where microchambers under-respond by up to 10% (kΩ ⩽ 1.10) and diodes over-respond by up to 3% (kΩ ⩾ 0.97). At depths >15 mm, microchamber and most diode corrections remain <2% down to 300 mm depth in all fields. In the largest (115 mm × 100 mm) MLC field the IBA Razor over-response is larger than other diodes, reaching 4% (kΩ = 0.96) at 300 mm. The microdiamond correction is <1% at all depths for the smallest and largest MLC fields. The air-filled microchamber corrections are <1% at most field sizes, except the smallest where correction varies almost linearly with depth, decreasing to kΩ = 0.98 at 300 mm depth.
3.4. Off axis ratios
Figure 3 shows MC calculated kΩ for OAR as a function of off-axis distance for the smallest and largest MLC fields. In general, the corrections are much smaller inside the field than outside. At distances >5 mm inside the field edge the corrections for all depths and detectors are ⩽1%. At the field edge microchambers blur the penumbra, underestimating OAR by up to 4–5% inside the edge and overestimating immediately outside the edge by up to 10–15%, but further out they provide accurate OAR. Because of penumbra blurring diodes are usually preferred for small field OAR measurement. Diode response within the beam is constant within 1–2% up to the beam edge but the out of field response is more complex. At smaller field sizes diodes underestimate OAR in this region. At large field sizes OAR is overestimated with kΩ = 0.8 or lower for the PTW and IBA diodes, while the Edge detector maintains a more uniform response. The results shown for Edge detector parallel to the scan are with the detector tip oriented to +ve X (i.e. tip advancing beyond the beam edge). If instead the cable end of the detector advances across the beam edge the corrections change by 3%–4% outside the beam at the smallest field size. There is a larger correction factor variation with this detector between parallel and perpendicular orientations (keeping the detector stem perpendicular to the beam axis in both cases), with differences most pronounced at 15 mm depth and decreasing with depth. OAR correction variations are most apparent during routine beam commissioning when the out-of-beam OAR is largest, which occurs for the combination of large field size and depth. This is illustrated in figure 4, which shows measured OAR for the 115 mm × 100 mm field size at 300 mm depth. Within the beam the microdiamond and diode (60018) agree well, but outside of the beam the diode OAR are higher by approximately 2% of central axis dose. If the diode measurements are corrected based on the factors shown in figure 3, the agreement is improved to approximately 0.5%. Over all field sizes and depths, the microdiamond detector has the most uniform response with corrections <1% at all depths and field sizes within the beam, and <2%–3% outside of the beam at depths >15 mm. Penumbral blurring of synthetic microdiamond measurements in comparison to diode measurements has been reported with the 5 mm fixed collimator (Chalkley et al 2014). Figure 5 shows OAR measured for the 5 mm fixed collimator and 7.6 × 7.7 mm MLC aperture with both detectors, before and after correction using kΩ. The raw measurements agree relatively well even in the smallest field, with penumbra just 0.1 mm larger in the microdiamond measurements, but after correction the agreement is improved. It should be noted that the corrections applied to the diode measurement are larger than those applied to the microdiamond.

Figure 3. MC calculated correction factors for OAR measurement kΩ(r, z, f, 0, z, f), simplified to kΩ in the figure, as a function of off-axis distance along the x-axis for rectangular MLC fields at 800 mm SSD. Data is shown for the 7.6 mm × 7.7 mm field at (a) 15 mm depth and (c) 300 mm, and for the 115 mm x 100 mm field at (b) 15 mm depth and (d) 300 mm. The dashed vertical line shows the geometric field edge. The inset shows the two orientations used for Edge detector calculations, with the top surface long axis parallel to scan direction (top) and perpendicular (bottom).
Download figure:
Standard image High-resolution image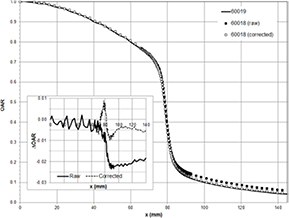
Figure 4. Measured OAR for the 115 mm × 100 mm MLC field at 800 mm SSD and 300 mm depth. Diode (PTW 60018) measurements are higher than synthetic microdiamond (PTW 60019) outside of the beam by about 2% of central axis dose (the inset shows microdiamond OAR—diode OAR). After the diode measurements are corrected with the factors shown in figure 3 the agreement in this region is improved to approximately 0.5%. A polynomial fit was used to interpolate the correction factor data.
Download figure:
Standard image High-resolution image
Figure 5. Measured OAR for 5 mm fixed collimator and 7.6 mm × 7.7 mm MLC field at 800 mm SSD and 100 mm depth. Measurements were made using the synthetic microdiamond (PTW 60019) and diode (PTW 60018), and are shown (a) before, and (b) after corrections are applied to both detectors. Just outside the field the uncorrected microdiamond OAR are larger than uncorrected diode by up to 2% of central axis dose, although the measured penumbra widths are only 0.1 mm different because of the high dose gradient. After corrections are applied to both detectors the agreement is within approximately 0.5%. OAR differences (microdiamond—diode) are shown (c) before, and (d) after correction. A polynomial fit was used to interpolate the correction factor data.
Download figure:
Standard image High-resolution image3.5. Detector perturbations
Perturbation factors are shown in figure 6 as a function of off-axis distance for two MLC field sizes. With small fields the change in microchamber response across the beam edge is mainly associated with the lower density air cavity. Volume averaging, which might intuitively be expected to dominate the OAR correction, is in fact a smaller effect that is largely offset by a reduction in scatter from the chamber wall. With the 60018 diode, the OAR underestimation seen outside the beam at small field sizes is mostly associated with the higher density of the silicon layer plus scatter and attenuation in the encapsulation around and behind the sensitive volume. The corresponding OAR overestimation seen at large field sizes is caused by the higher atomic number of the sensitive volume relative to water in combination with the spectral changes shown in table 4. For the microdiamond detector a relatively flat response is observed at both field sizes. However, at the smallest field size this is only because the scatter perturbation associated with the diamond substrate is offset by the volume averaging in the sensitive region, similar to the cancellation of the wall versus volume perturbations observed with air-filled microchambers. Figure 7 shows corresponding data for the synthetic microdiamond in the smallest (5 mm) fixed collimator field. In this smaller field the volume averaging is a larger effect than substrate backscatter, and therefore the total perturbation factor decreases to 0.97 outside the beam (i.e. OAR is overestimated in this region).
Table 4. Average photon and electron energies at 800 mm SSD and 100 mm depth for 5 mm and 60 mm fixed collimators, as a function of relative off-axis distance (r0 = geometric field edge).
| r/r0 | Field size (mm) | |||
|---|---|---|---|---|
| 5 mm | 60 mm | |||
| Mean photon energy (MeV) | Mean electron energy (MeV) | Mean photon energy (MeV) | Mean electron energy (MeV) | |
| 0 | 1.709 | 1.031 | 1.509 | 0.986 |
| 0.5 | 1.708 | 1.030 | 1.518 | 0.984 |
| 1 | 1.718 | 1.028 | 1.399 | 0.970 |
| 1.5 | 1.692 | 1.003 | 0.316 | 0.613 |
| 2 | 1.550 | 0.963 | 0.265 | 0.512 |
| 2.5 | 1.460 | 0.959 | 0.246 | 0.481 |

Figure 6. Perturbation factors at 100 mm depth normalized to central axis, as a function of relative off-axis distance (r0 = geometric field edge). Factors are shown for PTW 31014 at (a) 7.6 mm × 7.7 mm field size, and (b) 53.8 mm × 53.9 mm, and the same field sizes for (c) and (d) PTW 60018 and (e) and (f) PTW 60019. The factors for the microchamber are chamber stem Pstem, central electrode, Pcel, wall Pwall, fluence and stopping power ratio differences between air and water  (Pfl in the legend), sensitive volume density (Prho in the legend), and volume averaging Pgeom, together with the total perturbation factor Ptotal. The factors shown for solid state detectors are attenuation and scatter in the overlying detector encapsulation Patt, other detector encapsulation Pscatt, and the silicon substrate around the sensitive volume Pwall2, with other terms as per the microchamber (although silicon or carbon replace air in the fluence term).
Download figure:
Standard image High-resolution image
Figure 7. Perturbation factors at 100 mm depth with the 5 mm fixed collimator for the PTW 60019 as a function of relative distance off-axis (r0 = geometric field edge). The perturbations are as described in figure 6.
Download figure:
Standard image High-resolution imageTable 4 shows the average electron and photon energy at 100 mm depth as a function of off-axis distance. These are relatively constant within the beam, probably because of the absence of a flattening filter, but decrease outside of the beam to a degree that increases with field size. At 60 mm field size the average photon energy outside the beam is 40%–50% lower than inside the beam, consistent with an increasing proportion of out-of-field fluence being generated by phantom scatter as field size increases.
4. Discussion
Corrections factors for beam commissioning measurements (OF, PDD, and OAR) made with various detectors in small fields have been presented. Our method is to calculate all terms on the right hand side of equation (1) by MC simulation, which is consistent with our previous work (Francescon et al 2012, 2014a, 2014b) and some others (e.g. Papaconstadopoulos et al 2014). An objection to this method is that it requires knowledge of the detector construction, and deficiencies in information provided by vendors or manufacturing variability may cause inaccuracy in the calculation (O'Brien et al 2016). Methods avoiding this uncertainty are
- (i)Comparison of detector measurement with reference detector measurements (i.e. substitution of reference detector measurements for the Dw terms in equation (1)), where the reference detector measurements are themselves subjected to appropriate correction factors (e.g. Masi et al 2016) or the reference detector requires no correction (e.g. Underwood et al 2015). If the reference detector requires correction the problem is just deferred. Alternatively, where the reference detector requires no correction in small fields the key difficulty is accessing and verifying such a gold-standard dosimeter.
- (ii)Comparison of detector measurements with MC simulated dose to water (i.e. use measurements for the Ddet terms and MC simulation for the Dw terms in equation (1)), e.g. (Lárraga-Gutiérrez et al 2015, O'Brien et al 2016). This removes uncertainties in detector modelling, but we have shown previously that it increases the impact of uncertainties in treatment machine modelling on the correction factors. For example, a mismatch of just 0.1 mm between the physical aperture size and modelled aperture size for a nominal 5 mm circular field with the CyberKnife iris collimator results in an 8% change in
 calculated this way, which reduces to 0.1% when both dose to water and detector are simulated (Francescon et al 2012).

Detector modelling uncertainties are mitigated in our method by inter-comparing measurements made with multiple detector types after correction, and we recommend this as a method for other studies.
We present the first set of  for fixed circular collimators with the CyberKnife M6 System. The majority of these results are <0.5% different to those with previous CyberKnife versions and all differences are ⩽1.0% (comparing against the mean of tables 3(A) and (B) in Francescon et al 2012 and against table 2 in Francescon et al 2014a). The magnitude of the diode corrections is consistently larger with the M6 system versus older systems by 0.3% on average. There is no bias in the changes in microchamber corrections between CyberKnife versions. For MLC no previous data exist. If MLC apertures are converted to equivalent circular apertures, the diode corrections are <0.5% different to those in Francescon et al (2012) at all except the 7.6 mm × 7.7 mm field, where the differences range from 0.7% to 1.2%. Again there is a bias for the M6 corrections to have larger magnitude than for older CyberKnife systems. With air-filled microchambers the differences are also <0.5% at all except the smallest field, but here the differences are 1.6% (A16) and 1.8% (31014). Given that these changes are generally small (<1%) it is probably not necessary to re-commission any existing M6 systems where corrections for circular and MLC OF measurements have been estimated based on previously published data, unless microchambers were used in which case it may be advisable to adjust the smallest MLC OF using corrections from this study. For new M6 system commissioning we recommend using the corrections from this study.
A key question to be addressed is which are suitable (or optimal) detectors to use for small field commissioning measurements with CyberKnife? For OF measurement, one suggested criterion is that  should remain <5% for all field sizes (Palmans 2016). Our results show that all detector types meet this criterion for MLC measurements (if microchambers are used with the stem parallel to the beam axis), but for the smallest fixed collimators only the synthetic microdiamond and point scintillation detector are suitable. Most diodes exceed this threshold by <1% and we would argue that with appropriate correction their use for CyberKnife commission should be considered acceptable. This is in-line with most common practice today.
For PDD, TPR, and OAR measurement, while the application of correction factors is technically possible (e.g. as in figures 4 and 5), we consider it to be impractical because of the multidimensional factor dependencies (i.e. with field size, depth, and distance). Therefore, this work is best used to help select a detector which maintains kΩ close to unity, and to inform the evaluation of measured OAR versus other detector measurements and calculation. For PDD measurements all detectors have corrections <2% and might be considered suitable (again, assuming that microchambers are used with stems parallel to the axis), unless accurate dose measurement within the build-up region is important in which case diodes should be favoured over microchambers, and the synthetic microdiamond or point scintillator over diodes. The one exception is the IBA Razor detector which demonstrated larger corrections and should be investigated further. It has previously been shown that corrections for TPR are similar to or smaller than those for PDD measurements with CyberKnife (Francescon et al 2014b), and so these conclusions can also be applied to TPR measurement.
For OAR measurement diodes are most commonly used because of the penumbra blurring observed in small fields with microchambers. The correction factors for MLC OAR in this study, together with previous results for fixed collimators (Francescon et al 2014b) show that these typically underestimate out-of-beam OAR at the smaller field sizes. At larger field sizes OAR in this region is over-estimated by the PTW diodes and IBA Razor, whereas the Edge detector has a more stable response outside the beam that might be due to its more substantial brass encapsulation. The impact with small beams is relatively minor because the out-of-beam dose is itself very small. However, the problem with large beams can be substantial and becomes more important with MLC because the out-of-beam dose is increased in the larger field sizes available. We found the maximum over-estimation in the 115 mm × 100 mm field size at 300 mm depth to be approximately 2% of central axis dose. A user should at least be aware of this effect when evaluating any beam model fit to the measured data at larger field sizes and depths.
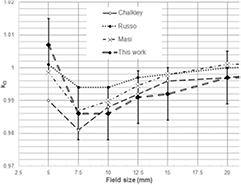
The two newer detector types studied here, point scintillator and synthetic microdiamond, are associated with the smallest corrections for all measurement types and on that basis might be considered a preferred option if available. However, both of these detectors have disadvantages not captured in MC simulations. A major current practical limitation of the W1 detector is that it doesn't interface with any commercially available plotting tank system. This means that it can only be used for manual scanning which makes it impractical for anything except OF measurement. In addition, this detector has exhibited relatively large measurement non-reproducibility after repeat set-ups which might be related to uncertainties in the Cerenkov correction obtained using the method of Morin et al (2013) (in this study OF variation of 2.2% between repeat set-ups was observed, with CLR varying between 0.691 and 0.709). Similar CLR variability and OF variations have been observed in a larger measurement series using CyberKnife (Masi et al 2016). CLR inconsistencies have been also noted elsewhere and a dependency of CLR on the exact fibre orientation within the beam has been suggested (Underwood et al 2015). The synthetic microdiamond has lower inherent sensitivity than some other detectors investigated here, and therefore longer exposures are needed to maintain equivalent signal to noise ratio, which extends the overall beam commissioning time. The sensitive volume is also larger than either diode or point scintillation detector, although as shown in figures 6 and 7 the total perturbation factor remains smaller than a diode even at the smallest field size and the difference in measured penumbra relative to a diode is only 0.1 mm even at 5 mm field size. As discussed previously, a greater degree of consistency is observed in the published studies of OF corrections with this detector when used with the CyberKnife system only than when other treatment systems are considered. This might be partly the result of differences in method but might also reflect a genuine difference in the detector response between treatment units at small field sizes. Figure 8 shows that MC calculated  in this study exhibit the same trends as previously measured for CyberKnife fixed collimators. Agreement between MC calculated values and the average of the three experimental studies is 1% at 5 mm field size and ⩽0.5% at all others. At least until the practical limitations of the point scintillator are overcome the synthetic microdiamond is probably the closest to an optimal detector for small field dosimetry in a routine setting that is commercially available today, and we recommend applying treatment unit specific correction factors with it (e.g. factors calculated for the CyberKnife system and measurement geometry when used for CyberKnife beam measurements).
Figure 8. Values of  with the synthetic microdiamond detector for the six smallest circular CyberKnife fixed collimators obtained in previous measurement studies (Chalkley et al 2014, Masi et al 2016, Russo et al 2016) and those calculated by MC simulation in this work.
Download figure:
Standard image High-resolution image
Significant microchamber perturbations at the smallest fields are associated with the lower density of the sensitive volume. This means that the total perturbation is larger than would be expected from a simple estimate of volume averaging, a finding that is consistent with experimental data for the A16 and 31014 chambers in small CyberKnife fields (Pantelis et al 2010). Interestingly the perturbations arising from scatter from the chamber wall and volume averaging largely cancel out. This data suggests that the largest advantage of a liquid filled microchamber is the reduction of the density effect. For the 60018 diode the most significant perturbations in small beams are related to scattering from encapsulating material adjacent to and behind the sensitive volume and the higher density of the sensitive volume itself. This suggests that modifying the lateral and downstream encapsulation design might improve the stability of detector response for small field OAR measurement. In larger beams the fluence and stopping power perturbation within the high Z sensitive volume dominates the out-of-beam response, which is consistent with the significant change in beam spectrum seen outside of large beams due to phantom scatter. The total kΩ varied in a similar manner with the 60008 and Razor diodes, so it seems reasonable to assume that the individual perturbations are similar to those calculated for 60018. The Edge detector had a very different kΩ variation in large beams, meaning that at least some of its perturbation factors must also be different. We hypothesize that the significant amount of high Z brass and copper encapsulation material with this detector attenuate the incident low energy fluence outside of these beams which approximately compensates for the fluence and stopping power perturbation in the silicon in at least the geometries tested, but this requires further work to confirm.
With the synthetic microdiamond, scatter from the diamond around the sensitive volume and volume averaging are significant at the smallest field sizes. These largely cancel except at the 5 mm fixed collimator field in which volume averaging causes a small OAR over-estimation outside the beam. The importance of scatter within the diamond suggests that the calculation is sensitive to the dimensions used in the detector model. This has been a subject of recent discussion, with one study (Andreo et al 2016) suggesting that the sensitive volume was significantly smaller than the vendor specification, a conclusion that was subsequently disputed by a study showing a result very close to that provided by the vendor (Marinelli et al 2016). In this work we have used the dimensions of Marinelli et al (2016). Our results show good agreement between microdiamond measurements corrected using simulations based on these dimensions and those made with other detectors, which suggests that these dimensions are accurate.
5. Conclusions
A method has been developed to evaluate the correction factors needed for beam commissioning measurements. This has been applied to circular and MLC fields on the CyberKnife M6 System but is recommended for use with other treatment delivery systems. The largest corrections are needed for OF measurements with diodes and air-filled microchambers at field sizes smaller than 15 mm. These are generally <1% different to published correction factors for older CyberKnife versions if equivalent square is used to convert circular to rectangular fields. The results also show a substantial out-of-field diode OAR overestimation at large field sizes and depths which should be recognised during commissioning although we do not recommend explicit corrections are applied. The correction factors are much smaller for point scintillation and synthetic microdiamond detectors, although both of these suffer from other limitations which make the microdiamond a more practical alternative currently. The dominant measurement perturbations are associated with density for air-filled microchambers, or encapsulation material scattering and attenuation plus high atomic number of the sensitive volume for diodes. The perturbation analysis shows that a simple consideration of geometric averaging does not accurately predict the total correction factor, and that the individual perturbation magnitudes vary significantly with field size and detector position.