A Test of Using Markov-Switching GARCH Models in Oil and Natural Gas Trading


1
Faculty of Accounting and Management, Saint Nicholas and Hidalgo Michoacán State University (UMSNH), 58030 Morelia, Mexico
2
Financial Economy and Accounting Department, Faculty of Business, Finance and Tourism, University of Extremadura, 10071 Cáceres, Spain
*
Author to whom correspondence should be addressed.
Energies 2020, 13(1), 129; https://doi.org/10.3390/en13010129
Submission received: 18 November 2019
/
Revised: 16 December 2019
/
Accepted: 17 December 2019
/
Published: 26 December 2019
(This article belongs to the Special Issue Intelligent Optimization Modelling in Energy Forecasting)
Abstract
:In this paper, we test the use of Markov-switching (MS) GARCH (MSGARCH) models for trading either oil or natural gas futures. Using weekly data from 7 January 1994 to 31 May 2019, we tested the next trading rule: to invest in the simulated commodity if the investor expects to be in the low-volatility regime at t + 1 or to otherwise hold the risk-free asset. Assumptions for our simulations included the following: (1) we assumed that the investors trade in a homogeneous (Gaussian or t-Student) two regime context and (2) the investor used a time-fixed, ARCH, or GARCH variance in each regime. Our results suggest that the use of the MS Gaussian model, with time-fixed variance, leads to the best performance in the oil market. For the case of natural gas, we found no benefit of using our trading rule against a buy-and-hold strategy in the three-month U.S. Treasury bills.
1. Introduction
Energy futures, such as oil and natural gas, are a widely used means for hedging the commodity price risk and also for investing and speculation. Given their close relationship with economic activity and general prices, energy commodities (especially oil) have also been a source of portfolio diversification. Nowadays, given electronic trading, as well as global flow of capital, it is possible for institutional investors to diversify their investments, given the expected correlations of commodities with securities such as stocks and bonds. Some related tests about the benefits of diversification with alternative assets (such as commodities) are found in [1,2,3]. Nevertheless, there are some issues with the correlations between commodities and conventional assets that need to be addressed. The first issue is the level of the contagion effect (i.e., higher positive correlations), given the corresponding increase of the demand in alternative assets such as commodities [4,5]. An alternative asset, in terms of the investment industry, is different from the three types of conventional securities which include: money market instrument, fixed income, and equity. The second issue to be addressed is that investing in a commodity index adds little mean-variance efficiency to a portfolio [6]. In other words, the diversification benefit for a portfolio is observed only with agricultural commodities [4] and other types of alternative assets, such as real estate [5], hedge funds [6], volatility futures [3], or clean-energy (technology) stocks [7]. Despite this, the issue of a diversified portfolio has been tested in several academic reviews, such as in [2,8,9] which are some of the most recent ones.
Among the potential causes of limited diversification benefits in commodities, is the fact that the correlation between the commodities and conventional securities increases significantly in distress time periods. This is a phenomenon known as “correlation clustering” and implies that the correlation levels are not always negative or close to zero and tend to increase during bad-performing time periods in financial markets.
Confirmation of the presence of correlation clustering has been probed by several studies such as [10,11,12,13,14] which are some of the most recent and closely related studies to this paper. Additionally, [15,16,17] found evidence of correlation clustering, by measuring this effect in two regimes. In these cases, similar to this paper, the authors split the states of nature (or regimes) into two regimes, as follows:
- A k = 1, “normal”, good-performing, or low volatility regime, in which the price fluctuations are narrow, and the expected returns tend to be positive;
- A k = 2, “distress”, bad-performing, or high volatility regime, in which the price fluctuations tend to be wider than the ones in k = 1. In addition, it is expected to have negative returns in this regime.
Therefore, and as detailed in the methodology section, it is expected that the standard deviation in the second regime is higher than the observed in the first regime: .
Given the marginal diversification benefits of commodities in a portfolio, trading activities in energy commodities could be more appropriate for active trading purposes. Therefore, we aim to test a trading strategy in the following most traded energy commodities futures in the U.S. [18]: The one-month West Texas Intermediate (henceforth OIL) and Henry Hub delivered natural gas (NATGAS).
Departing from the motivation that an energy commodity index in a portfolio could lead to marginal risk-return benefits [4,5], an interesting question to answer is, “What would the performance of a given investor have been if she followed the next active trading strategy at t?”
- To invest in a risk-free asset (such as three-month U.S. Treasury bill or USTBILL) if the investor expects to be in the “distress” (k = 2) regime at T + 1;
- To otherwise invest in an energy commodity (OIL or NATGAS).
Our position is that an investor could achieve an outstanding performance if this strategy was followed as compared with a “buy-and-hold” or “passive” strategy, that is, a strategy in which the investor holds her proceedings unchanged in the OIL, the NATGAS, or the USTBILL through time. In addition, we assume that an active trading strategy, such as the previous one, could help to reduce risk exposure and increase mean-variance (i.e., risk-return) efficiency.
A key step, in the previous trading strategy, is to estimate the probability, , of being in the distress (k = 2) regime at T + 1. For this purpose, we suggest the use of a time series method known as Markov-switching (MS) model [19,20]. Sometimes this model is also known as Hamilton’s filter. With this type of model, the returns’ () generating stochastic process can be estimated with a K, location (mean) and scale (standard deviation) parameters. Another interesting feature of the MS model is the fact that the investor or trader can estimate the smoothed probability, , of being in each k regime at t. In addition, the transition probabilities, , of changing (or staying) from regime k = i at t, to regime k = j at t + 1 are part of this model’s outputs. With these transition probabilities, the investor is able to forecast the smoothed probabilities for and to perform the previous investment strategy.
As described below, MS models, as originally proposed by Hamilton, assume a time-fixed scale (standard deviation, ) parameter in each regime. Given this, some extensions [21,22,23,24] have been made in order to incorporate a generalized, autoregressive conditional heteroskedastic (GARCH) process [25,26] in a MS model. This led to the development of the Markov-switching GARCH (MSGARCH) model, a model that allows a more precise estimation of the time-varying standard deviations, , in each regime at t.
The trading strategy that we propose herein is based on the one proposed by Brooks and Persand [27] for U.K. equities and fixed income securities (as risk-free assets). This trading strategy and the use of MS models for trading have been extended and tested in other equity markets [28,29,30,31] or in the optimal pension fund selection in Mexico [32].
To our knowledge and based on a detailed literature review of the most important and well-known academic journal databases, nothing has been written about the practical use of MS models for trading in energy commodity markets. The only related reference to this work is a very interesting paper by Alizadeh et al. [33], who proposed the calculation of MS hedge ratios. They proposed to use MS models in order to determine how much of the portfolio must be placed in OIL, gasoline, or heating oil futures and how much of it in the corresponding spot delivered underlying commodity. Although this interesting work is somewhat related to the present one, our purposes are different. We state this due to the fact that our trading strategy is to buy the energy commodity if the investor expects a “normal” or low volatility regime at T + 1, or otherwise buy a risk-free asset. As a research method, we started from the databases of Scopus and the Web of Science and continued with other repositories such as EBSCO, Jstor, Econpapers, Ideas-Repec, and finally, Google scholar.
Our results contribute significantly to the existing literature because almost all previous studies (including [27]) use a time-fixed or “constant” variance scale parameter and do not use MSGARCH models. Our first purpose is to determine if it is more appropriate to use MSGARCH models instead of the time-fixed MS models. In addition, we extend the literature by testing the potential use of this trading strategy in other types of markets such as OIL and NATGAS.
Among the potential benefits of our results among practitioners, we find that an energy commodity trader could decide to hold a long position from t to T + 1, or liquidate the commodity if the probability, , of being in a distress regime at T + 1 is known. In addition, an institutional investor could use our results in order to enhance portfolio energy commodity positions, more specifically, to enhance total portfolio performance. In a similar manner, a futures trader or underwriter could use this strategy to determine if it is necessary to hold OIL, or NATGAS positions, during low volatility periods, as a coverage of the issued OIL or NATGAS derivatives.
Given the theoretical and practical goals of this paper, we tested, from a U.S. dollar-based agent’s point of view, the following hypothesis: “The use of the suggested trading strategy with MSGARCH models leads to a better performance in the OIL and NATGAS market as compared with a buy-and-hold strategy”.
For a more detailed and introductory review about the difference between a trader, speculator, or investor, please refer to [34].
Having presented our main goals and purposes, we organized the remainder of this paper as follows: In the next section, we present our literature review and an introductory review of MSGARCH models, for the unrelated reader and to link the use of MSGARCH models in the simulated trading rule. In Section 3, we describe the MS model fitting of the input data and we present the pseudocode used in our simulations, followed by a review of the simulation results in OIL and NATGAS. Finally, in the last section, we present our concluding remarks and guidelines for further research.
2. Literature Review and the Use of MSGARCH Models in Our Simulations
2.1. Review of the Previous Literature That Motivates Our Tests
The use of MS models has been tested and suggested in several fields of research in economics, finance, and even meteorology or energy (turbine) engineering [10,11,35,36]. The first test was the estimation of the probabilities that a given country is in a recession regime () or expansion regime () at [12,13] and, closely related, these models were used to test the potential presence of common changes in economic cycles [13,15,16,17]. Other noneconomic applications are the modeling of temperature or wind speed modeling and forecasting [37,38,39,40]. From the studies more related to the present one and, as an application of MS models in financial time series, we mention the tests made in developed countries’ stock markets. A good example is by Klein [41], who tested the presence of time-varying herd behavior in the U.S. and Euro area stock markets. With the use of MS models, the author found that there is a notable deviation from rational asset pricing in distress or periods of high volatility, because the behavior of market agents was more rational in normal or low volatility periods than during distress periods. Another related paper is by Areal et al. [42] who tested the performance of a “vice” or non-socially responsible portfolio against a socially responsible portfolio, in the U.S. stock markets. Contrary to the claims in the literature, they found that the vice fund is an underperformer during distress or high volatility time periods. Finally, for the developing stock markets case, we mention the work of Zheng and Zuo [43] who used MS models to measure the “spillover” or contagion effect between stock markets of the U.S., the U.K., Germany, Japan, and Hong Kong and found that there is a spillover effect between markets, and that this effect is higher during distress time periods.
In our literature review, we also found increasing literature related to testing the use of MS, GARCH, and MSGARCH models in European and emerging stock markets [41,44,45] (Reference [28] makes a first review of the benefits of time-varying GARCH variances in the European Emerging stock markets and found the benefits of their use in Value at Risk calculation.). For a more detailed definition of the typology of markets (i.e., frontier, emerging, or developed), please refer to the classification and methodology document of MSCI [46]. This document is made in association with Standard & Poor Dow Jones LLC.
Among the closely-related works that test the use of MS models in emerging markets, we mention Rotta and Valls Pereira [14] who extended the regime-switching dynamic conditional correlation model with asymmetric GARCH variances. By using the model in the U.S., the U.K., Brazil, and South Korea, they found that their model was appropriate to model the volatility clustering effect, due to the time-varying properties of the correlation among markets, but also given their tested regime-switching framework. With respect to emerging stock markets, we mention the works of Cabrera et al. [47] and Sosa, Ortiz and Cabello [48] who tested the use of either MS or MSGARCH models in Latin American stock markets. Their results were in agreement in that it was appropriate to use either two regime MS models [48] or three regime MSGARCH models [47] in order to characterize the performance of these markets. In addition, they suggested that these models could be useful to measure the spillover effect and the potential presence of a “Latin American stock market common cycle”.
For the specific case of the use of MS models in Asian stock markets, we mention the work of Lin [49] who tested the co-movements of some of the main Asian stock markets (India, Indonesia, Korea, the Philippines, Thailand, and Taiwan) as well as their currencies. The author found that the co-movement is higher during distress time periods. Related also to this paper and as a test to the random walk stochastic process, the study by Shen and Holmes [50] showed that the use of non-switching unit root tests is not appropriate in the Asian stock markets. They favored the use of a two-regime switching test and suggested the presence of a higher mean-reverting effect in normal or low-volatility time periods.
For the midwest stock markets, Balcilar et al. [51] showed the presence of three regimes (low, high, and crash volatilities) in the integration of the stock markets of Abu Dhabi, Dubai, Kuwait, Qatar, and Saudi Arabia. In a similar fashion, the works of Boamah [52] and Bundoo [53] tested the presence of herding and stock market integration during non-normal or high volatility time periods, in a two or three regime context.
Up to this point we have presented literature that mostly relates to the use of MS models for time series characterization. The characterization of the stock index time series in two or more regimes is crucial for the appropriateness of MS models in investment decisions. Up to now, the previous references have shown the benefits of using MS models in these stock markets. Given this, we found strong evidence in favor of these models. Next, we continue with the literature review related to the proper use of MS models in other types of time series.
From the perspective of the use of MS and MSGARCH models in other types of time series, we found the works of Alexander and Kaeck [54] and Ma and Deng [55]. These authors searched for the determinants of credit default swaps (CDS), in developed or emerging economies, and their behavior in the context of two regimes. Both papers characterized properly the two-regime behavior of CDS and found a close relationship of CDS with interest rate levels and stock index performance.
For the specific case of the use of MS or MSGARCH models in commodity markets, we can mention the paper of Valera and Lee [56] who also tested the random-walk and informational efficiency hypothesis in the rice market of the following six Asian countries: China, Hong Kong, Indonesia, Malaysia, Philippines, and Singapore. Their test also showed that the use of a single regime unit root test is not appropriate, and therefore the Asian rice prices do not follow a conventional (single regime) random walk. Instead, the authors found that it is appropriate to model the stochastic process with a MS random walk, that is, to use the assumption that the random walk process is generated and inferred with a two regime MS model.
Among all the references mentioned herein, the previous study relates closely to this paper because it reviews the benefits of MS models for commodity time series characterization in commodities. However, the paper does not review the use of MS models in an investment decision process. Next, we mention some of the works that review this use of MS models (investment decisions).
As noted in this detailed but not exhaustive literature review, due to issues of space, most of the literature related to the benefits of MS or MSGARCH models focused on determining if these appropriately characterize the number of regimes, to measure contagion (spillover) effects between markets or to estimate the risk exposure. For the specific case of using MS models in investment decisions, little has been written. Brooks and Persand [27] were the first to propose using MS models for investment decisions. In a Gaussian, two regime context and by using the forecasted smoothed probabilities () of the gilt-equity ratio, the authors determined how much to invest, (), at , in the U.K. gilts (as the risk-free asset) or in the FTSE-100 ( as the risky one). In order to determine this investment level (), they used the aforementioned probabilities as follows:
Their simulations show that their active trading strategy in these two assets lead to a better performance than a passive or buy-and-hold strategy in the gilts or the FTSE-100.
It is worth noting that this paper was the main motivation for this review. The key difference between the tests made in [27] and this paper, is the fact that the simulated trader decides to invest in the risky asset only if a normal or low volatility time period is expected at . In addition, we test the use of MS and MSGARCH models with Gaussian and t-Student probability density functions (pdfs), whereas [27] uses only a time-fixed variance, i.e., MS model with Gaussian pdf.
After the original proposal by [27], little has been written about the use of MS or MSGARCH models for investment purposes [57,58,59]. Only the works of Hauptmann et al. [28] and Engel, Wahl and Zagst [31] extended the use of MS models with time-varying (logit regression) smoothed probabilities. More specifically, these works estimated sequentially three regime MS models. Given the influence of economic and financial factors, they forecasted the probability of being in each regime and made investment decisions with these forecasts. Their results in the U.S., Euro, and Asian markets showed an overperformance of their simulated portfolio against a buy-and-hold strategy. A result that is related to the results of our paper.
Following a rationale similar to that of [27], De la Torre, Galeana-Figueroa, and Álvarez-García [29] extended the use of the Gaussian and t-Student MS models to the U.K., U.S., Italian, and Mexican stock markets. In addition, [30] extended the use of the test of MS to MSGARCH models in the Andean region countries (Chile, Colombia, and Peru) and [32] to the informed and mean-variance efficient pension fund selection in Mexico.
Despite these extensions, nothing has been written about the use of MS or MSGARCH models in commodities and, more specifically, energy commodities. With this in mind, it is necessary to review the benefits of using the Gaussian or t-Student MS or MSGARCH in the active trading of these commodities.
As previously mentioned in the introduction, Alizadeh et al. [33] tested the use of MS models for the calculation of hedge ratios in the OIL futures market, as a hedging strategy that was tested only for fitting purposes and not for active trading activities.
On the basis of this literature review, we want to explain the rationale behind MS and MSGARCH models and how we used these in our simulations.
As mentioned previously, the active trading strategy that we test in this paper uses the forecast of the smoothed probability, , of the high volatility regime. Because this is the key parameter to use in the decision process, it is of interest for us to present a brief and introductory review of MS and MSGARCH models for the unrelated reader.
2.2. The Rationale of MS and MSGARCH Models and Their Use in Our Simulations
MS models were primarily proposed by Hamilton [19,20,60] using a straightforward rationale, i.e., “the stochastic process of a (return) time series can be modeled with a set of K number of location (mean) and scale (variance) parameters. This, given the k probability density functions (pdf) of k hidden and unobserved regimes”. Because these k number of regimes are unobserved, they can be modeled with a Markovian chain with k number of states (or regimes), a chain that has a k × k transition probability matrix Π. Each entrance of this matrix corresponds to the transition probability () of transiting from one state k = i, at , to another one k = j at t. This means that, as is the case of a non-absorbing Markovian chain, there is a probability of migrating from one regime to another ( or ) or staying in it ( or ). For the case of interest (a two-regime scenario) we represent the 2 × 2 transition probability matrix Π as follows:
where θ is the likelihood function parameter set and θ is estimated using a Bayesian method known as the E-M algorithm [61], in which the analyst starts with an assumed value of θ and the pdf parameters (including Π). Then, the algorithm maximizes the log-likelihood function (the sum of natural logarithm of the assumed pdf in each regime at t) and, then, filters the maximized parameters with the data. This last step is done in order to have more suitable (better fitted) parameters for the data. For further reference and for a straight-forward review of the estimation algorithm of the MS models, please refer to [60].
In order to estimate the transition probability matrix in the second step (the filtering process), Hamilton proposes to filter (from the time series ) the probability that a given realization of is generated from regime k. This can be done with a Gaussian or a t-Student pdf for the purposes of this paper:
Once the filtered probabilities have been estimated for each regime in each realization, one can estimate the location () and scale () parameters for each regime and also the transition probability matrix in Equation (2). As a complementary estimation, the k-th regime filtered probabilities can be smoothed (by using Kim’s [62] algorithm) to avoid abrupt changes in the regime probability at . This last process leads to a smoothed regime probability, , for each regime and each realization of . These are presented in a smoothed probability matrix .
With this matrix, the application of a MS model to the time series leads to the next parameter set:
From this set, the transition probability matrix and the last realization of the smoothed regime probabilities matrix () at , are of primary interest. These two parameters allowed us to forecast the probability of being in each regime at as shown next:
Finally, from this vector, we are interested in the forecasted smoothed probability of the distress () regime , in order to determine the probability of being in this regime at .
Among the assumptions of the MS model, as originally proposed by Hamilton [19,20], we mention that the transition probability matrix and the location () and scale () parameters are time fixed.
Despite this, some extensions were made to the original MS model in order to allow the scale () parameter to be a time-varying parameter. The need for time-varying variances has two practical motivations as follows:
- Because one of the applications of MS models is market risk measurement, the assumption of a time-fixed standard deviation through time is very limiting for risk management. As an example, an OIL futures trader could incorporate the effect of the change of regime, but the estimation of potential losses could be over or underestimated if the variance is time fixed, which causes the trader’s financial institution to save higher or lower risk capital reserves than needed.
- An energy derivatives trader or a clearance chamber in an energy derivatives market needs a more reliable risk measure (i.e., a proper variance), given the actual state of nature (or regime) in the market. This suggest, as appropriate for derivatives pricing and clearance, the use of a regime dependent time-varying scale parameter (.
As one answer to these previous practical needs, the generalized autoregressive conditional heteroskedastic (GARCH) models were proposed by Engle [63] and Bollerslev [64]. These models estimate the variance as a time-varying one and also forecast it in future time periods (). The general functional form of a GARCH model is the following:
In the previous expression, the actual (or even forecasted) value of the volatility depends of the squared lagged values of the residuals () and also from past values of the estimated volatility. The lagged squared values in the second term of (7) correspond to the ARCH (autoregressive conditional heteroskedastic) effect and the lagged values of the estimated variance to the generalization of the ARCH equation (GARCH term). This is a necessary generalization for faster and more efficient estimation purposes. The limitation of the GARCH model and his extensions such as the ones proposed by [65,66,67], is the presence of the persistence effect. This means that in some market circumstances, leads also to an over estimation of the variance and the risk exposure.
On the basis of the previous motivations and the persistence effect in GARCH models, a potential solution to this effect is to estimate the GARCH model (7) in a Markov-switching context. This is supported by the fact that the potential presence of the persistence effect is due to the presence of breaks or regimes in the behavior of the time series [21,22,23,24]. With this in mind, Markov-switching models with GARCH variance (henceforth MSGARCH) are a natural extension of the GARCH model in (6):
Given this, the theoretical and practical motivation of this paper is to determine if it is appropriate to use either MS or MSGARCH models to estimate the expected variance (or standard deviation). This, in order to estimate a more accurate forecast of the smoothed probability at . It is necessary to test this because the use of a time-fixed () or a time-varying GARCH () standard deviation leads to different estimations of the smoothed probabilities with (3) or (4).
Given the previous review of MS and MSGARCH models, if a trader estimates the forecasted second regime smoothed probability () with a time-fixed or a GARCH variance, it is expected to have different probability values. Given these different probability values, the trader could perform a different trading decision in each case. With this rationale, there are practical and theoretical reasons to test our two aforementioned hypotheses, that is, to demonstrate that it is better to use a MSGARCH model, than a MS model for trading decisions in the OIL and NATGAS markets.
As a methodological note, the MSARCH or MSGARCH model can be estimated with the following two possible Bayesian inference methods [25,26,68]: The E-M [61] algorithm previously described or Makov chain Monte Carlo simulation methods such as the Metropoli–Hastings [69] sampler. In our simulations, we estimated the three types of models (MS, MSARCH, and MSGARCH) with the E-M algorithm, through the simplification suggested by Viterbi [70] (please refer to Ardia [25] for further details of the algorithm). We estimated the models with the MSGARCH R library [71].
Next, we review the input data, how we conducted our simulations, and the main findings in our results.
3. Methodology
3.1. Input Data Processing and Simulation Dates
Since we have reviewed how the MSGARCH models are used in the simulated decision-making process, next, we briefly describe the input data. First, we will start with a description of our sources, along with the input data processing, followed by a fitting test of the MS and MSGARCH models in the time series of interest.
For the intended purposes, we used the weekly historical data of the OIL and NATGAS continuous one-month future price, as summarized in Table 1. We used these historical weekly close prices from 6 April 1990 to 31 May 2019.
With the historical price () of each simulated commodity, we calculated the continuous time return or continuous time percentage variation of each energy future each week (leading to a total of 1521 observations):
Our portfolio trading simulations started from 7 January 1994 and ended 31 May 2019 ( = 1326 weeks) but we used the historical return data from 7 April 1990 to the simulated date () for estimation purposes.
Once we simulated all six aforementioned scenarios in the 1326 weeks of interest, we compared the performance of the simulated portfolio with the “buy-and-hold” strategy, in OIL, NATGAS, and USTBILL.
We calculated the accumulated return of the simulated portfolios and the buy-and-hold strategies as follows:
We also summarized the performance of the portfolios by calculating the continuous time percentage variation return (). With these returns, we calculated the observed mean return, its standard deviation, the maximum potential loss (defined as the minimum or lowest return value), the Sharpe [73] ratio () as in (11) and the 95% and 98% confidence conditional value at risk (CVaR) as in (12). The Sharpe ratio (SR) is a performance measure that estimates how much risk premia (extra return from a risk-free asset) the investor receives, given each 1.00% of risk exposure taken in a given investment. The higher the SR, the better.
In the previous expression, is the percentage variation of the portfolio value at and represents the corresponding observed weekly equivalent rate of the USTBILL.
As an additional methodology note, we ran our simulations in the following six scenarios:
- The simulation of the two commodities of interest using the MS model with homogeneous Gaussian pdf and time-fixed variance. We denote this scenario as [commodity name]-MS-Gaussian (e.g., “Oil-MS-Gaussian”);
- The use of the MS model with homogeneous t-Student pdf and time-fixed variance ([commodity]-MS-tStud);
- The simulation with a MS model with homogeneous Gaussian pdf and ARCH variance ([commodity]-MSARCH-Gaussian);
- The use of a t-Student MSARCH model ([commodity]-MSARCH-tStud);
- The scenario of the MS model with homogeneous Gaussian pdf and GARCH variance as (4). Denoted as [commodity]-MSGARCH-Gaussian;
- The simulation of the homogeneous t-student MSGARCH ([commodity]-MSGARCH-tStud).
First, we explain the simulation process and data processing and, then, review the appropriateness of using MS or MSGARCH models in the two commodities. For this purpose, we estimated the models in the entire time series of both commodities (the 1521 dates) and then we estimated the LLF in each of the six scenarios as follows:
In the previous expression, is the filtered Gaussian (3) or t-Student (4) pdf and is a regime mixture law that measures the proportion of the k-th regime in the entire LLF ().
With these LLF values, we estimated the Akaike information criterion (AIC) [14] and determined, as “the best” model or scenario, the one with lowest AIC. Our results are summarized in Table 2.
The results, shown in Table 2, suggest that the two regime, Gaussian MSGARCH, is the best model to fit the time series of the two simulated commodities. A result that preliminarily confirms our first hypothesis. In order to test the validity of this result through time, we ran the recursive estimation of the six MS tested models (with constant, ARCH or GARCH variance). This, in each of the 1326 weeks of the simulation since 7 January 2000 to 31 May 2019. After this, we calculated the mean AIC value. The results are summarized in Table 3.
As noted, given the inference algorithm used for estimation purposes and the nature of the data, the MS-tStud scenario in both commodities is marked as “not feasible”. This is because, in some of the dates (The unfeasible dates are 24 April 2009 and 19 June 2009 in the OIL market and 31st December 2010 and 12 June 2015 for the NATGAS.), the use of Hamilton’s [19,20] filter with the Viterbi [70] algorithm did not converge and it did not found a feasible solution. For this reason, we excluded, from our trading simulations, the MS-tStud scenario.
In addition, from Table 3, we found a result that looks contradictory to the results in Table 2, in terms of fitting. If we compared the results of Table 3 with those of Table 2, the MS model with Gaussian pdf and constant variance showed the best fit in oil and natural gas.
Despite these contradictory results, we ran our investment simulations in the feasible scenarios of Table 3. Up to this review of results, the full time series and the recursive MS and MSGARCH analysis prove that the time series of the three commodities can be modeled with two regime MS, or MSGARCH models.
Next, we provide a brief description of the pseudocode used in our simulations.
3.2. The Pseudocode and Assumptions Used in Our Simulations
As previously mentioned, from all the parameters in the parameter set of MS or MSGARCH models, we are interested in the smoothed probabilities of being in each regime, , and also in the transition probability matrix . With these two parameters and by using (8), we can forecast the smoothed probability of being in both regimes at . Contrary to [27], we do not use both regimes’ smoothed probabilities. We pay special attention to the forecasted smoothed probability of the second regime, (). As a methodological note, the MSGARCH library sorts the regimes from the regime with the lowest () to the highest () standard deviation, in order to perform the next indicator function of the forecasted regime at as follows:
It is of methodological importance to mention that we estimated the MSGARCH, MSARCH, and MS models only with the residuals as recommended by Haas et al. [24]. In order to estimate these residuals, we detrended the historical return time series with the arithmetic single regime mean as follows:
With the forecasted regime at (), we ran the simulations of the investment process by following the next pseudocode in each simulation date ( 7 January 1994 and 31 May 31 2019) as follows:
For date 1 to T in the simulation:
- To determine the actual balance in the portfolio (cash balance and market value of holdings);
- To execute the Markov-switching model analysis in (4) with either GARCH, ARCH, or constant variance and also a Gaussian (6) or t-Student (7) pdf;
- To determine the expected regime () at with (9);
- With , to perform the next trading decision rule:
- To invest in the energy commodity if ,
- To invest in the risk-free asset if ;
- To value the portfolio with a mark-to-market procedure.
End
In order to run our simulations, we used the following assumptions in the portfolio and its trading activities:
- We simulated the performance of a USD 100,000.00 theoretical fund that only invests in the following two possible assets:
- A theoretical ETF that tracks the performance of the simulated energy commodity. An ETF that has a starting value of USD 100.00 and zero tracking error as assumption.
- A theoretical fund that pays the three-month U.S. Treasury bill rate each week. This fund also has a USD 100.00 theoretical starting value.
- This portfolio is not allowed to make short sales and only has the following two accounts:
- A cash balance account,
- A security custody account in which the energy commodity futures are saved.
- In order to simplify the simulations and given the potential heterogeneity in the trading fees among institutional investors, we are assuming that the simulated portfolio has no trading costs or taxes to pay.
Next, we review of our simulations, starting with the buy-and-hold strategy.
3.3. Passive or “Buy-and-Hold” Investment Strategy Results
In Table 4, we present the results that a given investor or commodity trader would have had, had she performed a “buy-and-hold” strategy during the simulated period. As noted, the passive investment strategy in OIL paid an accumulated return of 249.21%. A return that is equivalent to a yearly return (in brackets) of 9.77%. As noted, this value is higher than the 90.50% accumulated return paid by the USTBILL (3.54% yearly). With this in mind, investing in OIL has a proper risk return or mean-variance relation as shown in the Sharpe ratio. The result of this measure suggests that investing in OIL paid a weekly 0.0097% (0.13% yearly) of risk premium for each 1.00% risk exposure in this energy commodity.
A different situation is observed in the passive investment in NATGAS. As noted in the same table, the passive investment strategy in this commodity paid only a 13.82% of accumulated return in the whole simulation period (a 0.54% in a yearly basis). This return is lower than the observed one in USTBILL.
For the case of the risk measures (max drawdown and CVaR) in the two simulated commodities, we compared the observed results for these two passive strategies with their corresponding active trading scenarios in OIL and NATGAS.
3.4. Results of the Markov-Switching Active Investment Strategy in the WTI Oil Market
For the particular case of OIL futures, we present the performance results of our simulations in Table 5. As noted, all the simulated scenarios paid a higher accumulated return than their corresponding passive or buy-and-hold strategy.
In addition, the MS and MSGARCH models led to better results if they are used in active investment strategies, with the Gaussian MS scenario paying the highest return. This result does not entirely fulfill our first hypothesis, due to the fact that the best model for the intended purposes is not an MSGARCH.
Had an investor used this type of MS model in their investment strategy, they would have earned a 1097.49% return (43.03% in yearly basis). This result is higher than the Gaussian MSGARCH that paid the second-best accumulated return in our simulations (788.00% or 30.90% yearly).
By comparing the risk exposure measures in Table 4 (buy-and-hold strategy), it can be observed that the max drawdown and the potential loss (CVaR) in the simulated portfolios are lower than the ones in Table 4 for OIL.
Despite this, it is noted that the Gaussian MS scenario shows higher CVaR values than the MSGARCH scenarios. This result is important because, if a trader wants to use an MS or MSGARCH model for trading purposes, it is preferable to use a Gaussian time-fixed variance MS one. But, if a futures trader or a risk manager wants to measure more appropriately the risk exposure in the OIL position, it is better to use a Gaussian MSGARCH model.
This preliminary conclusion (the use of MS models for trading and the use of MSGARCH for risk management) is explained by the fact that the Gaussian (constant variance) MS model is more appropriate to make forecasts of the second regime at , leading to a proper trading sign of buying (selling) the OIL future during “calm” (“distress”) forecasted periods. This statement is supported by the “mean risky exposure” field of Table 5, a result that shows a less conservative strategy than the one made in the other scenarios or MS models.
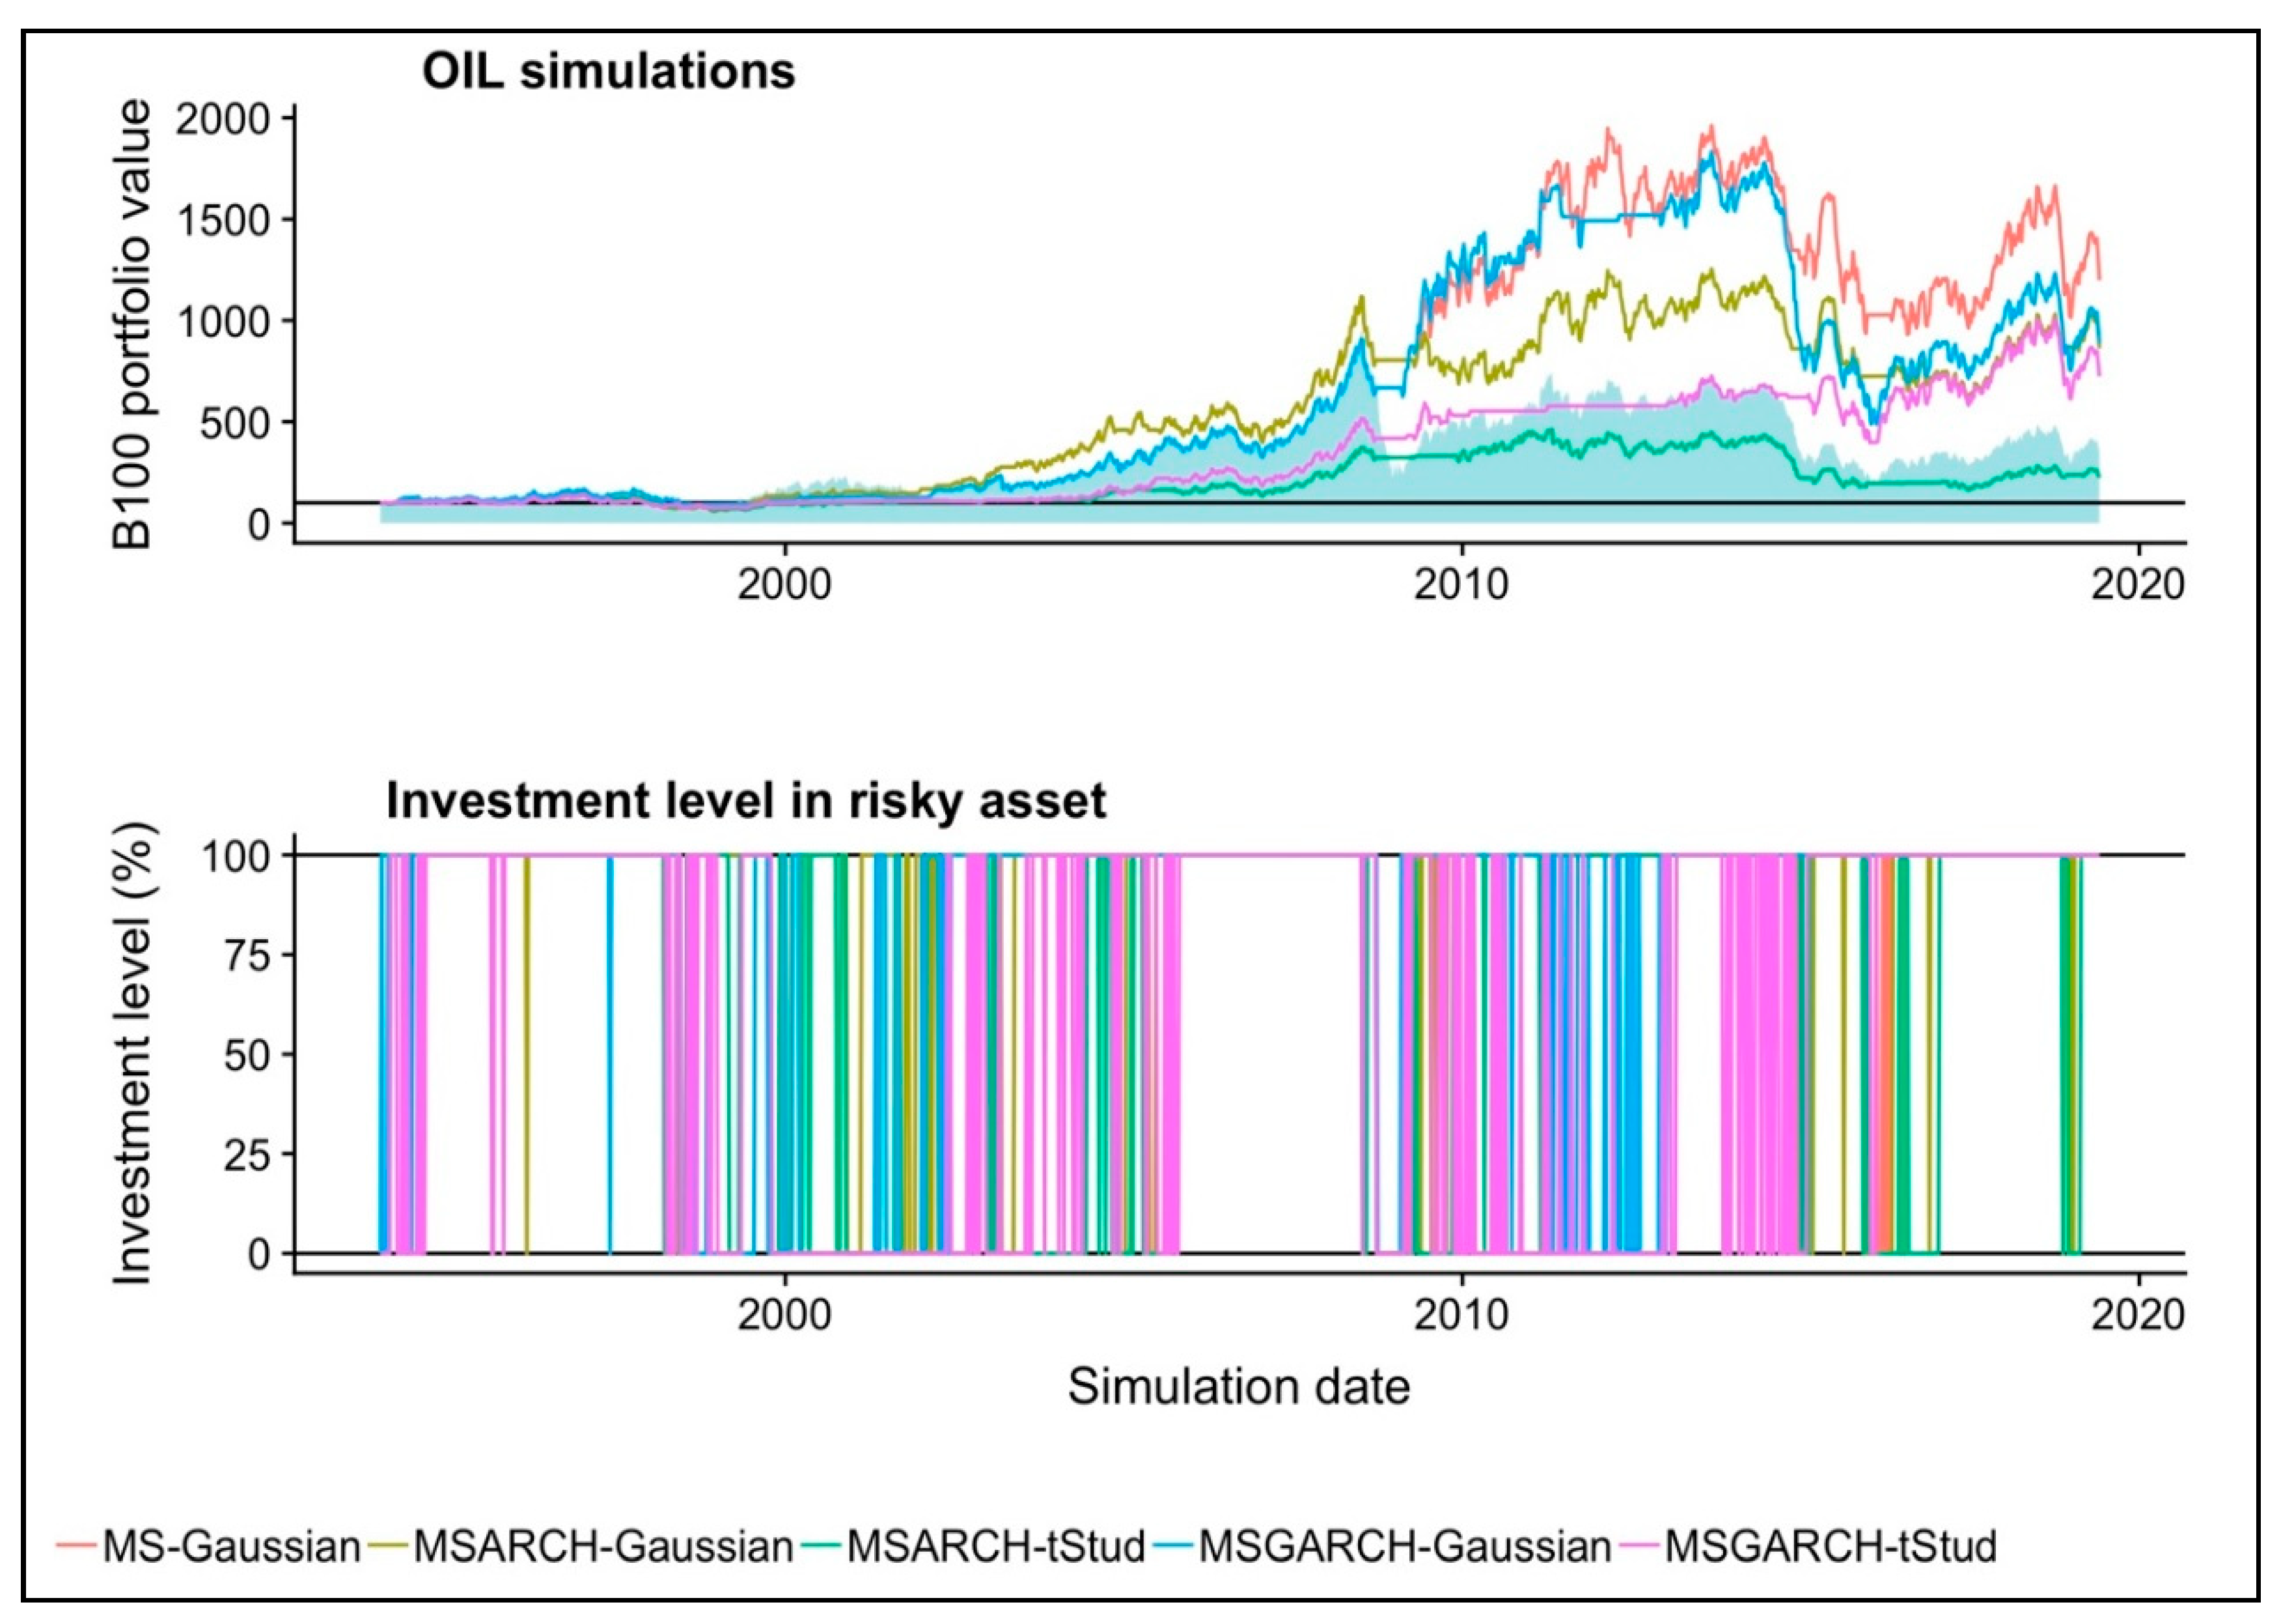
In Figure 1, we present the historical performance of the five simulated portfolios (lines), together with the performance of the passive or buy-and-hold portfolio in the simulated commodity (shaded area).
As noted, practically all the portfolios were sensitive to the increase in volatility in the next distress periods such as: the 2000 to 2001 technology companies crisis, the reputational and accounting issues of companies such as Enron (a closely-related event with these two commodities); the subprime credit crisis of 2007 to 2008, the European debt issues of 2011 to 2013, and the most recent issues of the U.S. negotiations with key trade partners (2018 to 2019). From the simulated scenarios, the one that used the Gaussian MS model was the most parsimonious in the rebalancing activities and the one that showed a good fit for these crisis episodes. This is noted in the “almost straight” behavior of the simulated portfolio during these periods. The bottom panel of the same Figure 1 shows the investment level in the simulated commodity at . We present this panel in order to show the benefits of the use of MS, MSARCH, or MSGARCH modes. As noted, there are some differences in the estimation of the forecast of the second regime and this leads to different decisions in each simulated portfolio. More specifically, the reader can note that three best performing portfolios reduced to 0.00% their holdings in the oil futures in distress time periods. Examples of this are the subprime crisis of October 2008 to February 2009 or the mid 2013 European debt issues. For the specific case of the time-fixed variance MS model (with Gaussian pdf), this model was less sensitive to the changes on the volatility levels. The use of this model allowed long positions in the oil futures to be held when the most sensitive MSARCH and MSGARCH did not. This difference led the simulated oil trader to have a better performance result.
In order to strengthen the performance review of the simulated portfolios, we performed a one-way ANOVA test and a nonparametric Kruskal–Wallis test, with the five simulated portfolios and the performance of the buy-and-hold ones in OIL and USTBILL. The results of these two tests are shown in Table 6. As noted, the results of these tests suggest that there is no significant difference. This issue is due to the fact that the previous tests make a mean or median comparison between the simulated portfolios and do not differentiate the performance fluctuations and risk exposure. In addition, these tests do not differentiate the distance between the highest to the lowest observed return in each case.
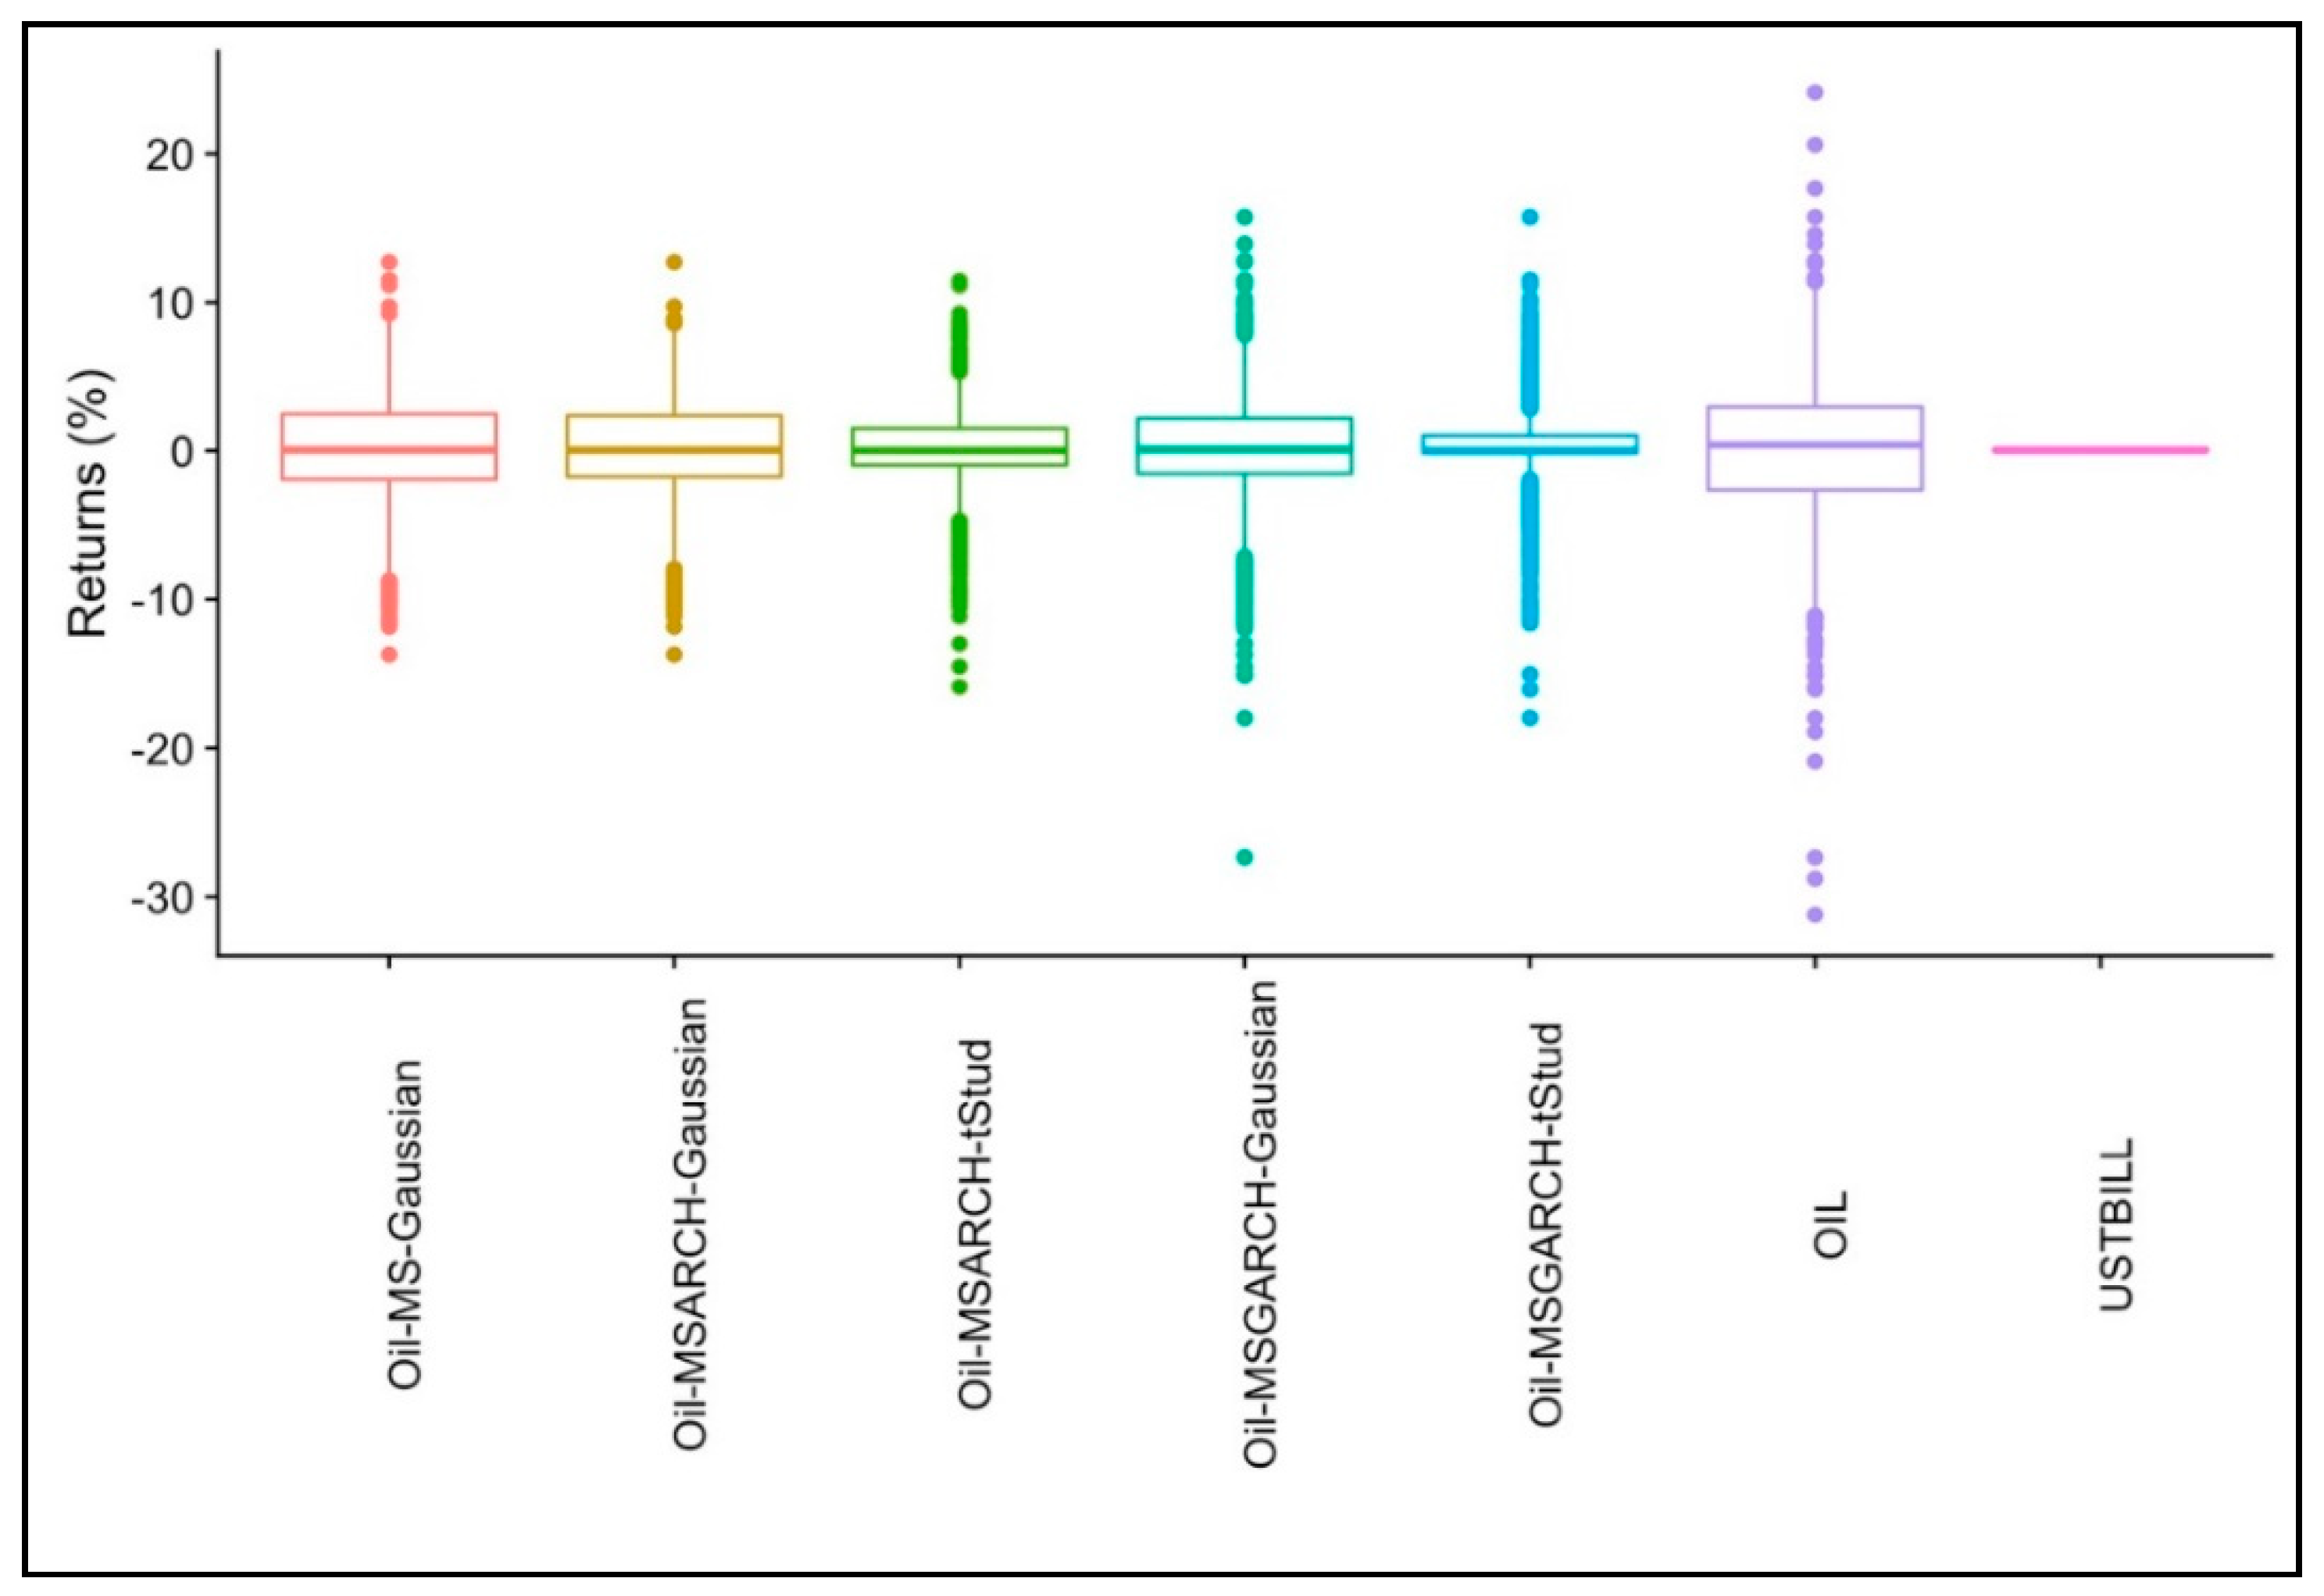
In order to complete a deeper performance review of the simulated portfolios, we present the box plots of Figure 2. As noted by the reader, the box plots of the simulated portfolios are narrower than those of the buy-and-hold strategy in OIL. This gives support to our position that the use of our trading rule with MS models leads to a better performance, due to a lower risk exposure of the simulated portfolios and a potential good market timing.
In order to strengthen our position that the Gaussian MS model led to the best performance, we ran the next attribution and market timing test:
In the previous expression, is the percentage variation of the buy-and-hold portfolio. With this term, we measured how much the commodity performance contributed to the simulated return each week. In the second term we added a nonlinearity to the generated return. This second term measures the market timing of the simulated portfolio. If the value is greater than zero, the trading rule enhanced market timing skills (our main purpose herein). The previous regression was made in the risk premiums of the simulated portfolios and OIL, that is, we are regressing only the difference between the return paid by the USTBILL and by each commodity and simulated portfolio. The results of this attribution and market timing test are shown in Table 7.
This test gives a stronger support to our results by the fact that, as expected, the value is not significant, whereas that of is positive and significant. For the specific case of the Gaussian MS portfolio (the best performer from the simulated ones), we found evidence of good market timing. This, with a 0.9731 value that suggests that for each 1.00% increase in the OIL risk premium, the simulated trading rule generated an extra 0.9731%, given a good market timing. This is higher than the 0.6049% explained by This last constant suggests that each 0.6049% of the returns paid by the simulated portfolios is explained by a 1.00% OIL price increase.
Next, we proceed to the observed results in the NATGAS.
3.5. Results of the Markov-Switching Active Investment Strategy in the Natural Gas Market
In the case of the NATGAS trading simulations, no useful results were found for a NATGAS trader. We mention this due to the fact that the results are not as attractive as the ones observed in the OIL market. In Table 8, we present the performance results of the five feasible simulated scenarios. As noted, only the use of Gaussian MS or MS-ARCH models led to a positive accumulated return. Even if these two simulated portfolios generate alpha (higher returns than the buy-and-hold strategy), the observed values are not higher than the ones observed in the passive USTBILL portfolio (Table 4).
Even if this result supports part of our working hypothesis of alpha generation, it is preferable to invest in a buy-and-hold strategy in USTBILL than trading with our strategy in natural gas.
We observe that this result is not due to the active investment strategy proposed herein, but because the NATGAS did not paid a higher return than the USTBILL. This leads us to observe that this commodity is not appropriate for trading purposes with a quantitative strategy.
For the specific case of the risk exposure in this commodity, practically all the scenarios show a significant reduction from the observed values in the buy-and-hold strategy and the CVaR values are lower than the ones of the passive investment scenario.
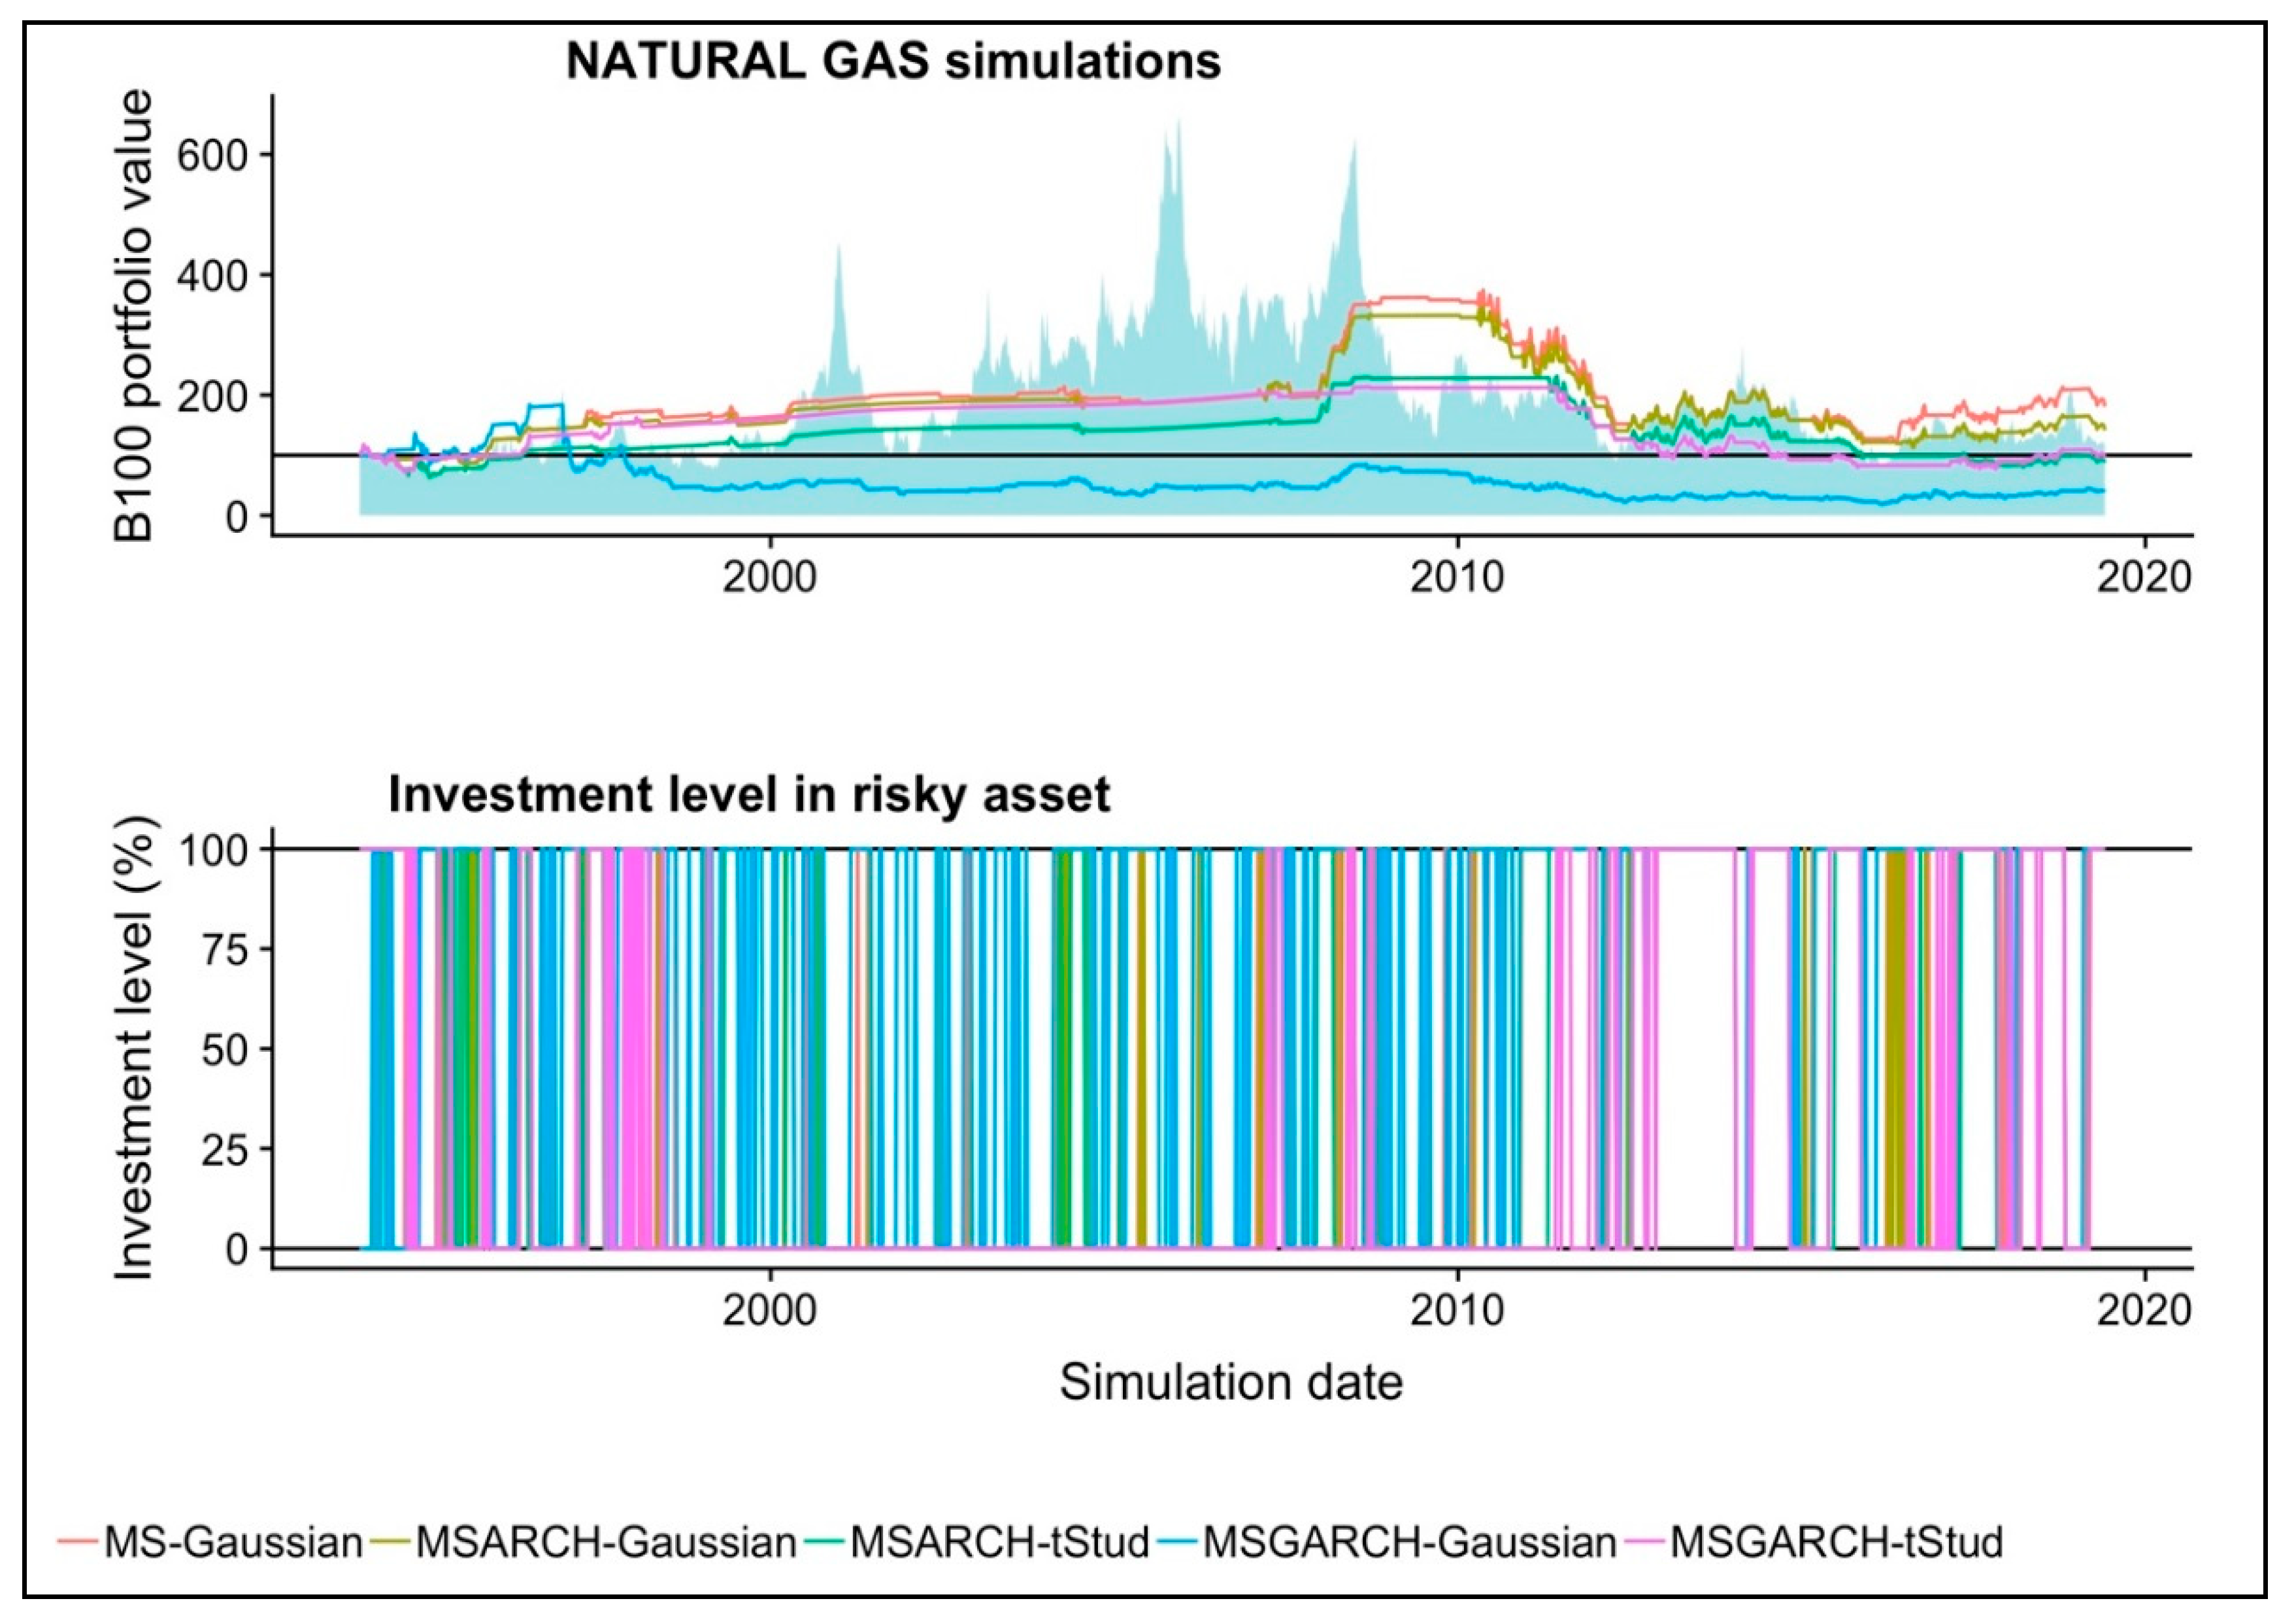
Figure 2 shows the historical performance of the simulated portfolios, along with the historical investment level in the NATGAS future. Even if the Gaussian MS model is the best for fitting the data recursively (Table 3), the accumulated return is not so attractive. As Figure 2 and Table 8 show, the mean risky investment level (or exposure) is lower than 50.00% in the simulations. This produced a more conservative strategy. In addition, in some periods, such as July 2007 to October 2008, the presence of the distress or high volatility periods was higher, and the price was subject to wider fluctuations. This led our trading algorithm to invest in the risk-free asset.
This last statement is proven in the historical investment level in the natural gas future, as shown in the lower panel of Figure 3. As noted, the Gaussian time-fixed and ARCH variance MS models were highly sensitive to changes in the high-volatility regime probability. This led to a sell of the natural gas futures position and to an increase in the risk-free asset. This behavior was of practical use in the 2009 to 2010 period in which the quantitative easing program of the U.S. Federal Reserve took effect which allowed a reduction in the speculative positions in this commodity and a price downfall. This change of regime was noted by these two models, resulting in a sell of the risky position in this future. This last decision was crucial, in order to generate an overperformance against the buy-and-hold strategy (shaded area). Despite the performance results observed in our simulations, the performance of the five simulated portfolios is not better than that of the USTBILL.
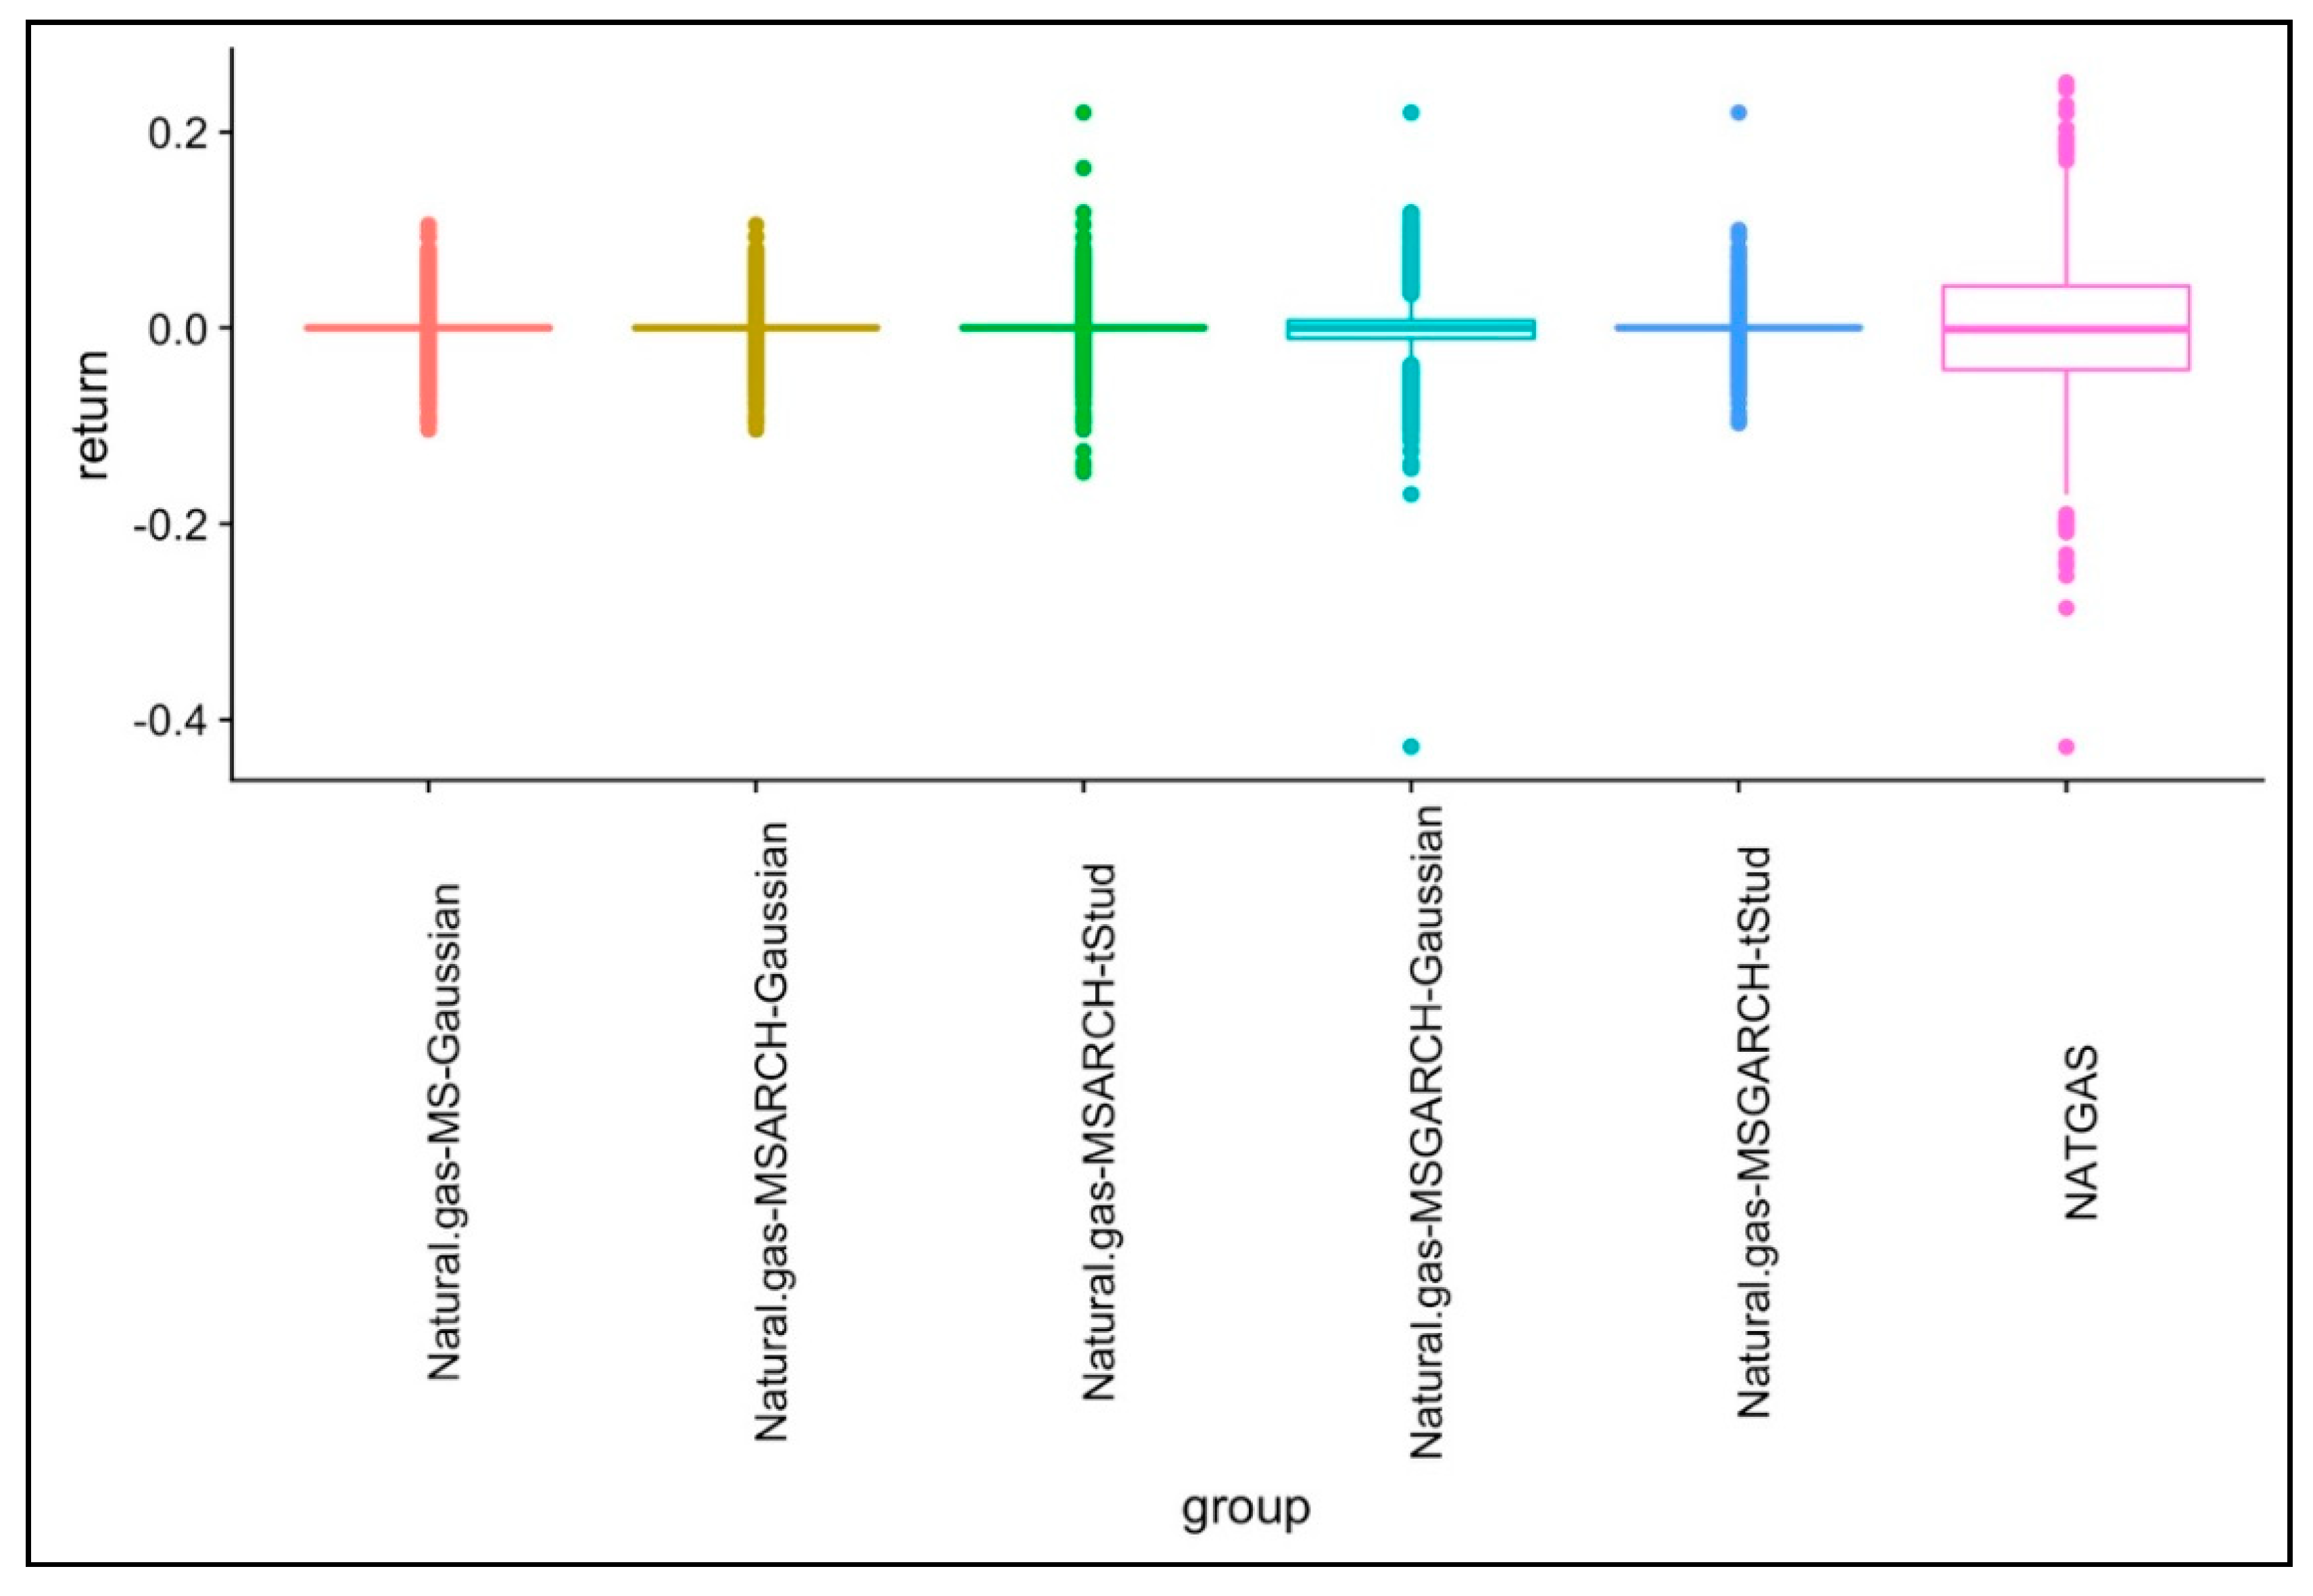
In order to make a more consistent review, we performed the one-way ANOVA and Kruskal–Wallis tests, along with the review of the returns box plots. The results are shown in Table 9 and Figure 4. As noted, there is no significant difference in the performance of the five simulated portfolios, even if the return fluctuation is narrower in these. This last result suggests that, even if the risk exposure is lower in the simulated portfolios, their performance is not so different between them.
In order to verify if the observed performance results in the NATGAS are due to market timing skills with the simulated trading rule, we present the proper test results in Table 10. As noted, the values suggest that the performance in the simulations made in this commodity is due only to NATGAS price fluctuations. Only the values are significant and low. This gives stronger support to our conclusions related to this commodity; the commodity did not have a better performance than the USTBILL and, complementary to this our trading rule did not generate good market timing, that is, it did not work for the intended purposes.
As a corollary of results, the use of MS models leads to a better performance if these are used for trading decision purposes in the oil market only. More specifically, the use of Gaussian, time-fixed variance MS models lead to the best performance in both commodities. This is an issue that does not completely fulfill our working hypothesis because the best performing model is the Gaussian with time-fixed variance and not a MSGARCH model. Despite this, we found that the use of MS models for trading is useful only in the oil market. We mention this, given the poor performance of the natural gas simulations against the U.S. Treasury bills and the poor market timing of the simulated trading rule in this case.
4. Concluding Remarks and Guidelines for Further Research
Markov-switching (MS) models have been used in several applications since their first proposal in [19,20]. From all these, we were interested in their use for active trading in the most traded energy commodities [18]: The West Texas Intermediate oil (OIL) and the Henry Hub delivered natural gas (NATGAS). More specifically, we were interested, for trading decision purposes, in the forecast of the distress or high volatility regime or time period for these two commodities.
The use of MS models for active trading was originally proposed by Brooks and Persand [27] in the U.K. gilt and stock markets, in a two regime and Gaussian probability density function (pdf) context. This test was later extended to other stock markets by [28,31,57,58,59] in a Gaussian, constant (or time-fixed) variance, and in a two or three-regime context. Only the work of [30] extend the use of MS models with a time-varying autoregressive conditional heteroscedasticity (ARCH) or a generalized autoregressive conditional heteroscedasticity (GARCH) variance (henceforth MSARCH and MASGARCH models, respectively).
By the fact there is no literature on studies that test the use of MS, MSARCH, or MSGARCH models for commodity trading, we extended the review of the practical usefulness of MS models in the following three ways:
- The use of MS models for trading in the OIL and NATGAS markets;
- The use of a two regime, t-Student pdf by comparing the observed results with the ones in a Gaussian context;
- By using an ARCH or GARCH variance for the estimation of the MS model.
These energy commodities were of special interest to us, given their direct link in the economic activity and their use in the diversification practices in institutional investors such as mutual funds, pension funds, or insurance companies.
With weekly data from 6 April 1990 to 31 May 2019, we performed weekly simulations (from 7 January 1994 to the end of the dataset) of the next investment strategy which included:
- To invest in the commodity future of interest if the investor expects to be in the “normal” or “calm” regime () at ;
- To invest in the risk-free asset (the three-month U.S. Treasury bill or USTBILL) if the investor expects to be in the “distress” or “high volatility” time period.
This led us to test the following working hypotheses:
- It is better to use a MSARCH or MSGARCH model in order to forecast the the probability, , of being in the distress regime in the OIL or NATGAS market;
- The use of the suggested trading strategy with MS-GARCH models leads to a better performance in the OIL and NATGAS market. This compared with a passive or “buy-and-hold” one.
As a corollary of results of the simulations performed herein, we want to highlight that our first working hypothesis partially holds for OIL. That is, the use of MS models is appropriate for an active investment in the OIL market. We concluded this because the use of MS models leads to a proper forecast of the distress regime probability and to a proper investment decision (proper market timing). Despite this, our position in our first hypothesis was that it is preferable to use a MSARCH or MSGARCH model instead. As part of our results, it is important to mention that the t-Student MSGARCH model is the best one for risk measurement (that is for energy market risk management purposes) but the constant variance MS model with Gaussian pdf is the best option for active trading in the OIL market. This last result is due to the 1097.49% accumulated return observed in this scenario.
For the specific case of the NATGAS market, we found that the accumulated results are lower than those of a buy-and-hold strategy in USTBILL, due to the fact that the NATGAS had a lower performance (accumulated return) than the USTBILL during the simulation period. Therefore, we conclude that the use of Gaussian or t-Student MS, MSARCH, or MSGARCH models does not lead to good performance results in this market, given the performance of the simulated commodity.
We believe that our results contribute to the existing literature about the practical usefulness of Markov-switching (MS) models in trading activities. In addition, our simulations lead us to suggest that the use of the proposed active investment strategy could help portfolio managers, energy traders, or individual investors to invest in these types of commodities, with an acceptable level of accuracy in the forecast of distress time periods.
Limitantions Found in Our Simulations and Guidelines for Further Research
Among the limitations (opportunity areas) that we found in our simulations is the fact that we used (due to space restrictions and for simplicity in the rhetoric situation) symmetric and homogeneous Gaussian and t-Student pdfs and, for the same exposition reasons, we used a two regime assumption and symmetric ARCH and GARCH models. Had we made our test in a symmetric vs. asymmetric pdf and GARCH models, we would have needed to present the results of not six but of 18 scenarios. This number of scenarios is reached had we used asymmetric Gaussian and t-Student pdfs [74] and the two most used asymmetric GARCH models, the T-GARCH [67] and the GJR-GARCH [66]. Related to this issue, we suggest testing the use of these pdfs and GARCH variances in similar simulations and to extend the study to the use of the generalized error distribution (GED) pdf.
Another limitation in our test is the fact that the MSARCH or MSGARCH can be estimated only in the residuals, because we estimated these with the arithmetic mean of the returns. We suggest extending our test by using other nonlinear mean models such as the ARMA model.
Finally, we used the assumption that the transition probability matrix () is time fixed, the extension to time-varying transition probabilities and also the incorporation of external factors in the estimation of the MS models could be of potential interest.
Author Contributions
All authors contributed equally to this work. All authors wrote, reviewed, and commented on the manuscript. All authors have read and approved the final manuscript. All authors have read and agreed to the published version of the manuscript.
Funding
This research received funding from the Teacher’s Development Program (PRODEP) of the Mexican Public Education Secretary (SEP), as part of its academic paper’s publication sponsorship program.
Conflicts of Interest
The authors declare no conflict of interest with the analysis and tests made herein.
References
- Jacobs, H.; Müller, S.; Weber, M. How Should Private Investors Diversify?—An Empirical Evaluation of Alternative Asset Allocation Policies to Construct A World Market Portfolio. SSRN Electron. J. 2011. [Google Scholar] [CrossRef] [Green Version]
- Christoffersen, P.; Errunza, V.; Jacobs, K.; Jin, X. Correlation dynamics and international diversification benefits. Int. J. Forecast. 2014, 30, 807–824. [Google Scholar] [CrossRef] [Green Version]
- Alexander, C.; Korovilas, D.; Kapraun, J. Diversification with volatility products. J. Int. Money Financ. 2016, 65, 213–235. [Google Scholar] [CrossRef]
- Bessler, W.; Wolff, D. Do commodities add value in multi-asset portfolios? An out-of-sample analysis for different investment strategies. J. Bank. Financ. 2015, 60, 1–20. [Google Scholar] [CrossRef]
- Hung, K.; Onayev, Z.; Tu, C.C. Time-varying diversificafion effect of real estate in institutional portfolios: When alternative assets are considered. J. Real Estate Portf. Manag. 2008, 14, 241–261. [Google Scholar]
- Jackwerth, J.C.; Slavutskaya, A. The total benefit of alternative assets to pension fund portfolios. J. Financ. Mark. 2016, 31, 25–42. [Google Scholar] [CrossRef] [Green Version]
- Ahmad, W.; Rais, S. Time-Varying Spillover and the Portfolio Diversification Implications of Clean Energy Equity with Commodities and Financial Assets. Emerg. Mark. Financ. Trade 2018, 54, 1838–1856. [Google Scholar] [CrossRef]
- Hoevenaars, R.; Molenaar, R.; Schotman, P.; Steenkamp, T. Strategic asset allocation with liabilities: Beyond stocks and bonds. J. Econ. Dyn. Control 2008, 32, 2939–2970. [Google Scholar] [CrossRef]
- Yan, L.; Garcia, P. Portfolio investment: Are commodities useful? J. Commod. Mark. 2017, 8, 43–55. [Google Scholar] [CrossRef]
- Guo, J.; Sun, Z.; Tang, H.; Jia, X.; Wang, S.; Yan, X.; Ye, G.; Wu, G. Hybrid Optimization Algorithm of Particle Swarm Optimization and Cuckoo Search for Preventive Maintenance Period Optimization. Discr. Dyn. Nat. Soc. 2016. [Google Scholar] [CrossRef] [Green Version]
- Zhang, Z.; Hong, W. Electric load forecasting by complete ensemble empirical model decomposition adaptive noise and support vector regression with quantum-based dragonfly algorithm. Nonlinear Dyn. 2019, 98, 1107–1136. [Google Scholar] [CrossRef]
- Chauvet, M. An econometric characterization of business cycle dynamics with factor structure and regime switching. Int. Econ. Rev. (Philadelphia) 2000, 10, 127–142. [Google Scholar] [CrossRef] [Green Version]
- Misas, M.; Ramírez, M.T. Depressions in the Colombian economic growth during the twentieth century: A Markov switching regime model. Appl. Econ. Lett. 2007, 14, 803–808. [Google Scholar] [CrossRef]
- Rotta, P.N.; Valls Pereira, P.L. Analysis of contagion from the dynamic conditional correlation model with Markov Regime switching. Appl. Econ. 2016, 48, 2367–2382. [Google Scholar] [CrossRef]
- Camacho, M.; Perez-Quiros, G. Commodity Prices and the Business Cycle in Latin America: Living and Dying by Commodities? Emerg. Mark. Financ. Trade 2014, 50, 110–137. [Google Scholar] [CrossRef]
- Hamilton, J.; Lin, G. Stock Market Volatility and the Business Cycle. J. Appl. Econom. 1996, 11, 573–593. [Google Scholar] [CrossRef]
- Dufrénot, G.; Keddad, B. Business cycles synchronization in East Asia: A Markov-switching approach. Econ. Model. 2014, 42, 186–197. [Google Scholar] [CrossRef] [Green Version]
- Commodity Futures Trading Commission Commitments of Traders | U.S. COMMODITY FUTURES TRADING COMMISSION. Available online: https://www.cftc.gov/MarketReports/CommitmentsofTraders/index.htm (accessed on 22 April 2019).
- Hamilton, J.D. A New Approach to the Economic Analysis of Nonstationary Time Series and the Business Cycle. Econometrica 1989, 57, 357–384. [Google Scholar] [CrossRef]
- Hamilton, J.D. Analysis of time series subject to changes in regime. J. Econom. 1990, 45, 39–70. [Google Scholar] [CrossRef]
- Lamoureux, C.G.; Lastrapes, W.D. Persistence in Variance, Structural Change, and the GARCH Model. J. Bus. Econ. Stat. 1990, 8, 225–234. [Google Scholar] [CrossRef]
- Hamilton, J.D.; Susmel, R. Autoregressive conditional heteroskedasticity and changes in regime. J. Econom. 1994, 64, 307–333. [Google Scholar] [CrossRef]
- Klaassen, F. Improving GARCH volatility forecasts with regime-switching GARCH. In Advances in Markov-Switching Models; Physica-Verlag HD: Heidelberg, Germany, 2002; pp. 223–254. [Google Scholar]
- Haas, M.; Mittnik, S.; Paolella, M.S. A New Approach to Markov-Switching GARCH Models. J. Financ. Econom. 2004, 2, 493–530. [Google Scholar] [CrossRef]
- Ardia, D. Financial Risk Management with Bayesian Estimation of GARCH Models; Springer: Belin/Heidelberg, Germany, 2008; Volume 612. [Google Scholar]
- Ardia, D.; Bluteau, K.; Boudt, K.; Catania, L. Forecasting risk with Markov-switching GARCH models: A large-scale performance study. Int. J. Forecast. 2018, 34, 733–747. [Google Scholar] [CrossRef]
- Brooks, C.; Persand, G. The trading profitability of forecasts of the gilt–equity yield ratio. Int. J. Forecast. 2001, 17, 11–29. [Google Scholar] [CrossRef] [Green Version]
- Hauptmann, J.; Hoppenkamps, A.; Min, A.; Ramsauer, F.; Zagst, R. Forecasting market turbulence using regime-switching models. Financ. Mark. Portf. Manag. 2014, 28, 139–164. [Google Scholar] [CrossRef]
- De la Torre, O.; Galeana-Figueroa, E.; Álvarez-García, J. Using Markov-Switching models in Italian, British, U.S. and Mexican equity portfolios: A performance test. Electron. J. Appl. Stat. Anal. 2018, 11, 489–505. [Google Scholar] [CrossRef]
- De la Torre-Torres, O.V.; Aguilasocho-Montoya, D.; Álvarez-García, J. Active portfolio management in the Andean countries’ stock markets with Markov-Switching GARCH models. Rev. Mex. Econ. y Finanz. 2019, 14, 601–616. [Google Scholar] [CrossRef]
- Engel, J.; Wahl, M.; Zagst, R. Forecasting turbulence in the Asian and European stock market using regime-switching models. Quant. Financ. Econ. 2018, 2, 388–406. [Google Scholar] [CrossRef]
- De la Torre-Torres, O.; Álvarez-García, J.; Santillán-Salgado, J.; López-Herrera, F. Potential improvements to pension funds performance in Mexico Mejoras potenciales al desempeño de los fondos de pensiones en México. Rev. Espac. 2019, 40, 26–41. [Google Scholar]
- Alizadeh, A.H.; Nomikos, N.K.; Pouliasis, P.K. A Markov regime switching approach for hedging energy commodities. J. Bank. Financ. 2008, 32, 1970–1983. [Google Scholar] [CrossRef]
- Bodie, Z.; Kane, A.; Marcus, A. Investments Global Edition, 10th ed.; Mc Graw-Hill: New York, NY, USA, 2014. [Google Scholar]
- Hong, W.-C.; Li, M.-W.; Geng, J.; Zhang, Y. Novel chaotic bat algorithm for forecasting complex motion of floating platforms. Appl. Math. Model. 2019, 72, 425–443. [Google Scholar] [CrossRef]
- Pant, T.; Han, C.; Wang, H. Examination of errors of table integration in flamelet/progress variable modeling of a turbulent non-premixed jet flame. Appl. Math. Model. 2019, 72, 369–384. [Google Scholar] [CrossRef]
- Ailliot, P.; Monbet, V. Markov-switching autoregressive models for wind time series. Environ. Model. Softw. 2012, 30, 92–101. [Google Scholar] [CrossRef] [Green Version]
- Elias, R.S.; Wahab, M.I.M.; Fang, L. Stochastics and Statistics A comparison of regime-switching temperature modeling approaches for applications in weather derivatives. Eur. J. Oper. Res. 2014, 232, 549–560. [Google Scholar] [CrossRef]
- Ailliot, P.; Bessac, J.; Monbet, V.; Pène, F. Non-homogeneous hidden Markov-switching models for wind time series. J. Stat. Plan. Inference 2015, 160, 75–88. [Google Scholar] [CrossRef] [Green Version]
- Monbet, V.; Ailliot, P. Sparse vector Markov switching autoregressive models. Application to multivariate time series of temperature. Comput. Stat. Data Anal. 2017, 108, 40–51. [Google Scholar] [CrossRef] [Green Version]
- Klein, A.C. Time-variations in herding behavior: Evidence from a Markov switching SUR model. J. Int. Financ. Mark. Institutions Money 2013, 26, 291–304. [Google Scholar] [CrossRef]
- Areal, N.; Cortez, M.C.; Silva, F. The conditional performance of US mutual funds over different market regimes: Do different types of ethical screens matter? Financ. Mark. Portf. Manag. 2013, 27, 397–429. [Google Scholar] [CrossRef]
- Zheng, T.; Zuo, H. Reexamining the time-varying volatility spillover effects: A Markov switching causality approach. North Am. J. Econ. Financ. 2013, 26, 643–662. [Google Scholar] [CrossRef]
- Sorin Gabriel, A. Evaluating the Forecasting Performance of GARCH Models. Evidence from Romania. Procedia-Social Behav. Sci. 2012, 62, 1006–1010. [Google Scholar] [CrossRef] [Green Version]
- Ye, W.; Zhu, Y.; Wu, Y.; Miao, B. Markov regime-switching quantile regression models and financial contagion detection. Insur. Math. Econ. 2016, 67, 21–26. [Google Scholar] [CrossRef]
- MSCI Inc. MSCI Global Investable Market Indexes Methodology. Available online: http://www.msci.com/eqb/methodology/meth_docs/MSCI_Jan2015_GIMIMethodology_vf.pdf (accessed on 2 May 2018).
- Cabrera, G.; Coronado, S.; Rojas, O.; Venegas-Martínez, F. Synchronization and Changes in Volatilities in the Latin American’S Stock Exchange Markets. Int. J. Pure Appl. Math. 2017, 114. [Google Scholar] [CrossRef]
- Sosa, M.; Ortiz, E.; Cabello, A. Dynamic Linkages between Stock Market and Exchange Rate in mila Countries: A Markov Regime Switching Approach (2003-2016). Análisis Económico 2018, 33, 57–74. [Google Scholar] [CrossRef] [Green Version]
- Lin, C.-H. The comovement between exchange rates and stock prices in the Asian emerging markets. Int. Rev. Econ. Financ. 2012, 22, 161–172. [Google Scholar] [CrossRef]
- Shen, X.; Holmes, M.J. Do Asia-Pacific stock prices follow a random walk? A regime-switching Perspective. Appl. Econ. Lett. 2013, 21, 189–195. [Google Scholar] [CrossRef]
- Balcilar, M.; Demirer, R.; Hammoudeh, S. Investor herds and regime-switching: Evidence from Gulf Arab stock markets. J. Int. Financ. Mark. Institutions Money 2013, 23, 295–321. [Google Scholar] [CrossRef]
- Boamah, N.A.; Watts, E.J.; Loudon, G. Investigating temporal variation in the global and regional integration of African stock markets. J. Multinatl. Financ. Manag. 2016, 36, 103–118. [Google Scholar] [CrossRef]
- Bundoo, S.K. Stock market development and integration in SADC (Southern African Development Community). J. Adv. Res. 2017, 7, 64–72. [Google Scholar] [CrossRef]
- Alexander, C.; Kaeck, A. Regime dependent determinants of credit default swap spreads. J. Bank. Financ. 2007, 1008–1021. [Google Scholar] [CrossRef]
- Ma, J.; Deng, X.; Ho, K.-C.; Tsai, S.-B. Regime-Switching Determinants for Spreads of Emerging Markets Sovereign Credit Default Swaps. Sustainability 2018, 10, 2730. [Google Scholar] [CrossRef] [Green Version]
- Valera, H.G.A.; Lee, J. Do rice prices follow a random walk? Evidence from Markov switching unit root tests for Asian markets. Agric. Econ. 2016, 47, 683–695. [Google Scholar] [CrossRef]
- Ang, A.; Bekaert, G. International Asset Allocation With Regime Shifts. Rev. Financ. Stud. 2002, 15, 1137–1187. [Google Scholar] [CrossRef]
- Ang, A.; Bekaert, G. How regimes affect asset allocation. Financ. Anal. J. 2004, 60, 86–99. [Google Scholar] [CrossRef]
- Kritzman, M.; Page, S.; Turkington, D. Regime Shifts: Implications for Dynamic Strategies. Financ. Anal. J. 2012, 68, 22–39. [Google Scholar] [CrossRef]
- Hamilton, J.D. Time Series Analysis; Princeton University Press: Princeton, NJ, USA, 1994. [Google Scholar]
- Dempster, A.P.; Laird, N.M.; Rubin, D.B. Maximum Likelihood from Incomplete Data via the EM Algorithm. J. R. Stat. Soc. Ser. B 1977, 39, 1–38. [Google Scholar] [CrossRef]
- Kim, C.-J. Dynamic linear models with Markov-switching. J. Econom. 1994, 60, 1–22. [Google Scholar] [CrossRef]
- Engle, R. Autoregressive Conditional Heteroscedasticity with estimates of the variance of United Kingdom inflation. Econometrica 1982, 50, 987–1007. [Google Scholar] [CrossRef]
- Bollerslev, T. Generalized Autorregresive Conditional Hetersoskedasticity. J. Econom. 1986, 31, 307–327. [Google Scholar] [CrossRef] [Green Version]
- Nelson, D.B. Conditional Heteroskedasticity in Asset Returns: A New Approach. Econometrica 1991, 59, 347. [Google Scholar] [CrossRef]
- Glosten, L.; Jaganathan, R.; Runkle, D.E. On the Relation between the Expected Value and the Volatility of the Nominal Excess Return on Stocks. J. Finance 1993, 48, 1779–1801. [Google Scholar] [CrossRef]
- Zakoian, J.-M. Threshold heteroskedastic models. J. Econ. Dyn. Control 1994, 18, 931–955. [Google Scholar] [CrossRef]
- Ardia, D.; Bluteau, K.; Boudt, K.; Trottier, D. Markov–Switching GARCH Models in R: The MSGARCH Package. J. Stat. Softw. 2019, 91, 38. [Google Scholar] [CrossRef] [Green Version]
- Metropolis, N.; Rosenbluth, A.W.; Rosenbluth, M.N.; Teller, A.H.; Teller, E. Equation of State Calculations by Fast Computing Machines. J. Chem. Phys. 1953, 21, 1087–1092. [Google Scholar] [CrossRef] [Green Version]
- Viterbi, A. Error bounds for convolutional codes and an asymptotically optimum decoding algorithm. IEEE Trans. Inf. Theory 1967, 13, 260–269. [Google Scholar] [CrossRef] [Green Version]
- Ardia, D.; Bluteu, K.; Boudt, K.; Catania, L.; Ghalanos, A.; Peterson, B.; Trottier, D.-A. Package “MSGARCH” Title Markov-Switching GARCH Models. Available online: https://cran.r-project.org/web/packages/MSGARCH/index.html (accessed on 21 November 2018).
- Refinitiv Refinitiv Eikon. Available online: https://eikon.thomsonreuters.com/index.html (accessed on 3 June 2019).
- Sharpe, W. Mutual fund performance. J. Bus. 1966, 39, 119–138. [Google Scholar] [CrossRef]
- Fernández, C.; Steel, M.F.J. On Bayesian Modeling of Fat Tails and Skewness. J. Am. Stat. Assoc. 1998, 93, 359–371. [Google Scholar] [CrossRef] [Green Version]
Figure 1.
Historical performance of the five simulated scenarios of the investment strategy in the WTI oil continuous price one-month future and its historical investment level. Source: Own elaboration with results of our simulations and data from Refinitiv Eikon [72].
Figure 1.
Historical performance of the five simulated scenarios of the investment strategy in the WTI oil continuous price one-month future and its historical investment level. Source: Own elaboration with results of our simulations and data from Refinitiv Eikon [72].

Figure 2.
Box plot of the returns of five simulated scenarios in the WTI oil continuous. Source: Own elaboration with results of our simulations and data from Refinitiv Eikon [72].
Figure 2.
Box plot of the returns of five simulated scenarios in the WTI oil continuous. Source: Own elaboration with results of our simulations and data from Refinitiv Eikon [72].

Figure 3.
Historical performance of the five simulated scenarios of the investment strategy in the natural gas price one-month future and its historical investment level. Source: Own elaboration with results of our simulations and data from Refinitiv Eikon [72].
Figure 3.
Historical performance of the five simulated scenarios of the investment strategy in the natural gas price one-month future and its historical investment level. Source: Own elaboration with results of our simulations and data from Refinitiv Eikon [72].

Figure 4.
Box plot of the returns of five simulated scenarios in the natural gas continuous. Source: Own elaboration with results of our simulations and data from Refinitiv Eikon [72].
Figure 4.
Box plot of the returns of five simulated scenarios in the natural gas continuous. Source: Own elaboration with results of our simulations and data from Refinitiv Eikon [72].


Table 1.
Summary of the time series used as input in our simulations, their tickers, price-contract size relation and source.
Table 1.
Summary of the time series used as input in our simulations, their tickers, price-contract size relation and source.
| Refinitiv™ RIC® | Source | Index Name | Ticker in the Paper | Trading Units |
|---|---|---|---|---|
| CLc1 | Refinitiv™ Eikon™ | CME-NYMEX WTI continous 1-month commodity future | Oil | USD per barrel |
| NGc1 | Refinitiv™ Eikon™ | CME-NYMEX Henry Hub Natural Gas continous 1-month commodity future | Natural gas | USD per BTU (1 BTU = 27.05 cubic meters) |
| UST3MT = RR | Refinitiv™ Eikon™ | US 3-month treasury bill | USTBILL | USD |
Source: Own elaboration with data of Refinitiv Eikon [72].
Table 2.
Single and multiple regime AIC fitting test for the three commodities’ time series of interest.
Table 2.
Single and multiple regime AIC fitting test for the three commodities’ time series of interest.
| Model or Scenario | Oil | Natural Gas |
|---|---|---|
| Single-Gaussian | −4840.63 | −3750.07 |
| Single-tStud | −4992.30 | −3824.21 |
| MS-Gaussian | −5054.02 | −3882.19 |
| MS-tStud | −5048.80 | −3873.38 |
| MSARCH-Gaussian | −5044.06 | −3870.25 |
| MSARCH-tStud | −5043.92 | −3861.60 |
| MSGARCH-Gaussian | −5067.62 [Best fit] | −3885.0747 [Best fit] |
| MSGARCH-tStud | −5053.89 | −3875.72 |
Source: Own elaboration with results of our simulations and data from Refinitiv Eikon [72].
Table 3.
Single and multiple regime recursive AIC fitting test for the three commodities’ time series of interest.
Table 3.
Single and multiple regime recursive AIC fitting test for the three commodities’ time series of interest.
| Model or Scenario | Oil | Natural Gas |
|---|---|---|
| Single-Gaussian | −2711.1544 | −2077.9385 |
| Single-tStud | −2807.7203 | −2127.7972 |
| MS-Gaussian | −2841.9781 [Best fit] | −2147.2707 [Best fit] |
| MS-tStud | Not feasible | Not feasible |
| MSARCH-Gaussian | −2829.7621 | −2135.5721 |
| MSARCH-tStud | −2823.6334 | −2127.4305 |
| MSGARCH-Gaussian | −2825.6056 | −2133.9354 |
| MSGARCH-tStud | −2818.5195 | −2125.1552 |
Source: Own elaboration with results of our simulations and data from Refinitiv Eikon [72].
Table 4.
Performance of a passive or “buy-and-hold” investment strategy in the two simulated energy commodities and the U.S. Treasury bills.
Table 4.
Performance of a passive or “buy-and-hold” investment strategy in the two simulated energy commodities and the U.S. Treasury bills.
| Model or Scenario | Accumulated Return | Mean Return | Return Std. Dev. | Max Drawdown |
| Oil | 249.2167 [9.7732] | 0.0944 [4.9088] | 4.9222 [35.4945] | −31.218 |
| Natural Gas | 13.8219 [0.542] | 0.0098 [0.5096] | 7.125 [51.3791] | −42.6905 |
| USTBILL | 90.502 [3.5491] | 0.0546 [2.8392] | 0.0449 [0.3238] | - |
| Model or scenario | CVaR (95%) | CVaR (98%) | Sharpe ratio | |
| Oil | −11.8377 [−85.3629] | −15.3773 [−110.8873] | 0.0097 [0.1383] | |
| Natural Gas | −15.7226 [−113.3773] | −19.8391 [−143.0618] | −0.0052 [0.0099] | |
| USTBILL | - | - | - |
Note: All the values are presented in % with the exception of the Sharpe ratio. In addition, all the values are shown in weekly terms with the exception of the accumulated return that is measured for the whole simulation period. The equivalent yearly values are presented in brackets. Source: Own elaboration with results of our simulations and data from Refinitiv Eikon [72].
Table 5.
Performance of the Markov-switching active investment strategy applied in the continuous one-month WTI oil future price contract.
Table 5.
Performance of the Markov-switching active investment strategy applied in the continuous one-month WTI oil future price contract.
| Model or Scenario | Accumulated Return | Mean Return | Return Std. Dev. | Max Drawdown |
| Oil-MS-Gaussian | 1097.49 [43.0388] | 0.1874 [9.7448] | 3.7326 [26.9162] | −13.7099 |
| Oil-MS-tStud | Not feasible | Not feasible | Not feasible | Not feasible |
| Oil-MSARCH-Gaussian | 762.0588 [29.8847] | 0.1626 [8.4552] | 3.5678 [25.7278] | −13.7099 |
| Oil-MSARCH-tStud | 123.3836 [4.8386] | 0.0607 [3.1564] | 3.1883 [22.9912] | −15.8776 |
| Oil-MSGARCH-Gaussian | 788.0043 [30.9021] | 0.1648 [8.5696] | 3.8678 [27.8911] | −27.353 |
| Oil-MSGARCH-tStud | 624.3021 [24.4824] | 0.1494 [7.7688] | 3.2428 [23.3842] | −17.9683 |
| Model or scenario | CVaR (95%) | CVaR (98%) | Sharpe ratio | Mean risky exposure |
| Oil-MS-Gaussian | −8.4109 [−60.6519] | −10.1399 [−73.1199] | 0.0252 [0.3620] | 0.902 |
| Oil-MS-tStud | Not feasible | Not feasible | Not feasible | Not feasible |
| Oil-MSARCH-Gaussian | −8.124 [−58.583] | −9.7196 [−70.089] | 0.0206 [0.3286] | 0.8808 |
| Oil-MSARCH-tStud | −7.9165 [−57.0867] | −9.7627 [−70.3998] | 0.0041 [0.1378] | 0.7323 |
| Oil-MSGARCH-Gaussian | −9.2385 [−66.6198] | −12.0042 [−86.5635] | 0.0256 [0.3072] | 0.8032 |
| Oil-MSGARCH-tStud | −8.052 [−58.0638] | −10.3119 [−74.3602] | 0.0182 [0.3322] | 0.6305 |
Table 6.
ANOVA and Kruskal–Wallis test of the observed weekly returns in the simulated portfolios of the OIL price and the USTBILL portfolio.
Table 6.
ANOVA and Kruskal–Wallis test of the observed weekly returns in the simulated portfolios of the OIL price and the USTBILL portfolio.
| One-Way ANOVA Test | ||||
| Degrees of Freedom | Squred Sums | Squared Means | F Value | Pr (>F) |
| 5.0000 | 0.0016 | 0.0003 | 0.2162 | 0.9558 |
| 7944.0000 | 11.4572 | 0.0014 | ||
| Kruskal-Wallis test | K-W statistic | Degrees of Freedom | Pr (>Xi2) | |
| 2.7928 | 5.0000 | 0.7319 | ||
Source: Own elaboration with results of our simulations and data from Refinitiv Eikon [72].
Table 7.
Attribution and market timing test of the five simulated portfolios in the OIL market.
| Simulated Portfolio | α | α p-Value | β1 | β1 p-Value |
| Oil-MS-Gaussian | −0.0012 | 0.0794 | 0.6049 | 0.0000 |
| Oil-MSARCH-Gaussian | −0.0012 | 0.1095 | 0.5511 | 0.0000 |
| Oil-MSARCH-tStud | −0.0014 | 0.0593 | 0.4358 | 0.0000 |
| Oil-MSGARCH-Gaussian | −0.0005 | 0.4508 | 0.6356 | 0.0000 |
| Oil-MSGARCH-tStud | −0.0009 | 0.2301 | 0.4552 | 0.0000 |
| Simulated portfolio | β2 | β2 p-Value | R2 | |
| Oil-MS-Gaussian | 0.9731 | 0.0000 | 0.5982 | |
| Oil-MSARCH-Gaussian | 0.8441 | 0.0000 | 0.5443 | |
| Oil-MSARCH-tStud | 0.5300 | 0.0000 | 0.4293 | |
| Oil-MSGARCH-Gaussian | 0.5807 | 0.0000 | 0.6262 | |
| Oil-MSGARCH-tStud | 0.6881 | 0.0000 | 0.4495 |
Source: Own elaboration with results of our simulations and data from Refinitiv Eikon [72].
Table 8.
Performance of the Markov-switching active investment strategy applied in the continuous one-month natural gas future price contract.
Table 8.
Performance of the Markov-switching active investment strategy applied in the continuous one-month natural gas future price contract.
| Model or Scenario | Accumulated Return | Mean Return | Return Std. Dev. | Max Drawdown |
| Natural gas-MS-Gaussian | 80.607 [3.1611] | 0.0446 [2.3192] | 2.473 [17.8331] | −10.3716 |
| Natural gas-MS-tStud | Not feasible | Not feasible | Not feasible | Not feasible |
| Natural gas-MSARCH-Gaussian | 41.3346 [1.621] | 0.0261 [1.3572] | 2.4053 [17.3449] | −10.3692 |
| Natural gas-MSARCH-tStud | −12.3048 [−0.4825] | −0.0099 [−0.5148] | 2.4059 [17.3492] | −14.6584 |
| Natural gas-MSGARCH-Gaussian | −61.2853 [−2.4033] | −0.0716 [−3.7232] | 3.986 [28.7435] | −42.6652 |
| Natural gas-MSGARCH-tStud | −3.8858 [−0.1524] | −0.003 [−0.156] | 1.9494 [14.0573] | −9.642 |
| Model or Scenario | CVaR (95%) | CVaR (98%) | Sharpe Ratio | Mean risky Exposure |
| Natural gas-MS-Gaussian | −6.4364 [−46.4135] | −7.9449 [−57.2915] | 0.0027 [0.1301] | 0.4412 |
| Natural gas-MS-tStud | Not feasible | Not feasible | Not feasible | Not feasible |
| Natural gas-MSARCH-Gaussian | −6.383 [−46.0285] | −7.9212 [−57.1206] | −0.0005 [0.0782] | 0.4118 |
| Natural gas-MSARCH-tStud | −6.5453 [−47.1988] | −8.5821 [−61.8864] | −0.008 [−0.0297] | 0.3145 |
| Natural gas-MSGARCH-Gaussian | −9.572 [−69.0247] | −12.0872 [−87.162] | −0.0162 [−0.1295] | 0.6599 |
| Natural gas-MSGARCH-tStud | −5.4323 [−39.1729] | −6.8775 [−49.5944] | −0.0041 [−0.0111] | 0.2481 |
Table 9.
ANOVA and Kruskal–Wallis test of the observed weekly returns in the simulated portfolios of the NATGAS price and the USTBILL portfolio.
Table 9.
ANOVA and Kruskal–Wallis test of the observed weekly returns in the simulated portfolios of the NATGAS price and the USTBILL portfolio.
| One-Way ANOVA Test | ||||
| Degrees of Freedom | Squred Sums | Squared Means | F Value | Pr (>F) |
| 5 | 0.0010 | 0.0002 | 0.1444 | 0.9817 |
| 7944 | 11.6639 | 0.0014 | ||
| Kruskal–Wallis test | K-W statistic | Degrees of Freedom | Pr (>Xi2) | |
| 10.8893 | 5.000 | 0.0536 | ||
Source: Own elaboration with results of our simulations and data from Refinitiv Eikon [72].
Table 10.
Attribution and market timing test of the five simulated portfolios in the NATGAS market.
| Simulated Portfolio | α | α p-Value | β1 | β1 p-Value |
| Oil-MS-Gaussian | −0.0001 | 0.8563 | 0.0402 | 0.0047 |
| Oil-MSARCH-Gaussian | −0.0003 | 0.6503 | 0.0405 | 0.0034 |
| Oil-MSARCH-tStud | −0.0007 | 0.3583 | 0.0415 | 0.0027 |
| Oil-MSGARCH-Gaussian | −0.0019 | 0.1157 | 0.1455 | 0.0000 |
| Oil-MSGARCH-tStud | −0.0006 | 0.2841 | 0.0270 | 0.0158 |
| Simulated portfolio | β2 | β2 p-value | R2 | |
| Oil-MS-Gaussian | 0.0230 | 0.8485 | 0.0062 | |
| Oil-MSARCH-Gaussian | 0.0257 | 0.8261 | 0.0067 | |
| Oil-MSARCH-tStud | 0.0147 | 0.8998 | 0.0071 | |
| Oil-MSGARCH-Gaussian | 0.2118 | 0.2698 | 0.0305 | |
| Oil-MSGARCH-tStud | 0.0341 | 0.7194 | 0.0044 |
Source: Own elaboration with results of our simulations and data from Refinitiv Eikon [72].
© 2019 by the authors. Licensee MDPI, Basel, Switzerland. This article is an open access article distributed under the terms and conditions of the Creative Commons Attribution (CC BY) license (http://creativecommons.org/licenses/by/4.0/).
Share and Cite
MDPI and ACS Style
De la Torre-Torres, O.V.; Galeana-Figueroa, E.; Álvarez-García, J. A Test of Using Markov-Switching GARCH Models in Oil and Natural Gas Trading. Energies 2020, 13, 129. https://doi.org/10.3390/en13010129
AMA Style
De la Torre-Torres OV, Galeana-Figueroa E, Álvarez-García J. A Test of Using Markov-Switching GARCH Models in Oil and Natural Gas Trading. Energies. 2020; 13(1):129. https://doi.org/10.3390/en13010129
Chicago/Turabian StyleDe la Torre-Torres, Oscar V., Evaristo Galeana-Figueroa, and José Álvarez-García. 2020. "A Test of Using Markov-Switching GARCH Models in Oil and Natural Gas Trading" Energies 13, no. 1: 129. https://doi.org/10.3390/en13010129
Note that from the first issue of 2016, this journal uses article numbers instead of page numbers. See further details here.