Article

Mapping Cynodon Dactylon Infesting Cover Crops with an Automatic Decision Tree-OBIA Procedure and UAV Imagery for Precision Viticulture

by
Ana I. de Castro
1,*,
José M. Peña
2,
Jorge Torres-Sánchez
1,
Francisco M. Jiménez-Brenes
1,
Francisco Valencia-Gredilla
3,
Jordi Recasens
3 and
Francisca López-Granados
1
1
Department of Crop Protection, Institute for Sustainable Agriculture (IAS), Spanish National Research Council (CSIC), 14004 Córdoba, Spain
2
Plant Protection Department, Institute of Agricultural Sciences (ICA), Spanish National Research Council (CSIC), 28006 Madrid, Spain
3
Grupo de Malherbología y Ecología vegetal, Dpto HBJ. ETSEA. Agrotecnio, Universitat de Lleida, 25198 Lleida, Spain
*
Author to whom correspondence should be addressed.
Remote Sens. 2020, 12(1), 56; https://doi.org/10.3390/rs12010056
Submission received: 1 November 2019 / Revised: 13 December 2019 / Accepted: 18 December 2019 / Published: 21 December 2019
(This article belongs to the Special Issue Remote Sensing in Viticulture)

Abstract

:
The establishment and management of cover crops are common practices widely used in irrigated viticulture around the world, as they bring great benefits not only to protect and improve the soil, but also to control vine vigor and improve the yield quality, among others. However, these benefits are often reduced when cover crops are infested by Cynodon dactylon (bermudagrass), which impacts crop production due to its competition for water and nutrients and causes important economic losses for the winegrowers. Therefore, the discrimination of Cynodon dactylon in cover crops would enable site-specific control to be applied and thus drastically mitigate damage to the vineyard. In this context, this research proposes a novel, automatic and robust image analysis algorithm for the quick and accurate mapping of Cynodon dactylon growing in vineyard cover crops. The algorithm was developed using aerial images taken with an Unmanned Aerial Vehicle (UAV) and combined decision tree (DT) and object-based image analysis (OBIA) approaches. The relevance of this work consisted in dealing with the constraint caused by the spectral similarity of these complex scenarios formed by vines, cover crops, Cynodon dactylon, and bare soil. The incorporation of height information from the Digital Surface Model and several features selected by machine learning tools in the DT-OBIA algorithm solved this spectral similarity limitation and allowed the precise design of Cynodon dactylon maps. Another contribution of this work is the short time needed to apply the full process from UAV flights to image analysis, which can enable useful maps to be created on demand (within two days of the farmer´s request) and is thus timely for controlling Cynodon dactylon in the herbicide application window. Therefore, this combination of UAV imagery and a DT-OBIA algorithm would allow winegrowers to apply site-specific control of Cynodon dactylon and maintain cover crop-based management systems and their consequent benefits in the vineyards, and also comply with the European legal framework for the sustainable use of agricultural inputs and implementation of integrated crop management.

Graphical Abstract

1. Introduction

Farmers´ adoption of Precision Viticulture (PV) practices has been progressively growing in grape production, with the aim of optimizing crop production and increasing profitability through a more efficient use of farm inputs (e.g., pesticides, fertilizers, water, labor, fuel, etc.) and, consequently, reducing potential environmental impacts caused by the over-application of inputs [1]. Moreover, PV strategies enable farmers to fulfill decision making with regard to the European Union’s (EU) Directives included in the Common Agricultural Policy concerning both the digitizing of agriculture and the sustainable use of agricultural inputs, which foster the development of alternative strategies that limit or optimize their usage. PV strategy implementation involves identifying the intra- and inter-crop-field spatial variability and the causes that determine such variability, as well as designing optimal site-specific management strategies accordingly [2]. One of the most innovative technologies that can be employed to quantify this variability is the use of Unmanned Aerial Vehicles (UAVs), due to their high spatial resolution and flexibility of flight scheduling, which are essential characteristics for accurate and timely crop monitoring [3,4]. Therefore, UAVs allow necessary data to be taken at the desired time and place with ultra-high spatial resolution, which has not been feasible with traditional airborne or satellite imagery [5,6]. In addition, UAVs can also acquire images with high overlaps that allow Digital Surface Models (DSMs) to be generated by using photogrammetry techniques [7]. As a result of these advantages, UAVs are becoming the most suitable remote sensing platform for PV purposes, thereby making the development of new techniques based on UAV imagery a required target for PV [8]. Moreover, its capacity to transport different kinds of sensors has broadened its use to different vineyard applications, such as 3D vineyard characterization using RGB cameras [5,9,10], detection of vine diseases and pests with conventional and multispectral sensors [11,12,13], assessments of the spatial variability of yield and berry composition using multispectral sensors [14,15,16], trimming and leaf removal employing a modified camera [17], water status with thermal and multispectral sensors [18,19,20], and the building of prescription maps using RGB, modified cameras and multispectral ones [21,22]. In spite of its wide use, UAV imagery have not been employed to identify weed infestations in vineyard cover crop systems.
Natural or sown cover crops in inter-rows, as an alternative practice to tillage, are widely used as a management tool in irrigated conditions or organic vine farming in Spain [23,24] and California-USA [25,26], among other locations. This practice can help to maintain an optimal balance between vine vegetative growth and fruit development by controlling the excess grapevine shoot vigor through proper cover crop management [27,28]. Moreover, cover crops bring many other benefits to the farm, such as slowing erosion, improving soil, enhancing nutrient and moisture availability, smothering weeds, controlling pests, and reducing the need for pesticides [29,30]. However, these benefits are reduced when Cynodon dactylon (L.) Pers. (bermudagrass) infests cover crops [24,31]. C. dactylon is a stoloniferous perennial, mostly with rhizomes, and is a very competitive grass, tolerant of salinity and reap, widely adapted to soils and climate, and very difficult to eradicate [32,33]. In addition, as a summer perennial grass, bermudagrass can compete with vines for soil resources, especially water in the Mediterranean climate characterized by severe summer droughts and strong year-to-year variation in rainfall [28], becoming a serious weed in cultivated land [33,34]. Once C. dactylon infests the cover crops, it may easily colonize the intra-row area, making eradication more difficult.
Although C. dactylon can be controlled by some specific herbicides, the timing of herbicide applications is crucial, as it impacts the control efficiency [35]. The short herbicide application window is determined by the manufacturer’s approved interval so that damage at the vineyard is minimal, i.e., from vine dormancy to bud burst development, and the peak efficiency period corresponding to the beginning of C. dactylon regrowth stage [34]. Therefore, it is desirable to detect C. dactylon plants in mid-winter and control them soon after during the regrowth period. At that optimum detection time (late January/early February in Mediterranean conditions), the cover crop is at a vegetative stage, covering the inter-row spaces, making the vineyard a complex scenario due to the spectral similarity between vines, green cover crops, and weeds [8,18]. In addition, bermudagrass may also be spectrally confused with bare soil during the latency period [22]. Nevertheless, this spectral similarity can be solved using Object Based Image Analysis (OBIA) techniques. OBIA basically consists of segmenting images in groups of adjacent pixels with homogenous spectral values called “objects” and then using these objects as the basic elements of classification by combining spectral, spatial, topological, and contextual information [6,36,37]. In recent years, OBIA techniques have reached high levels of automation and adaptability to ultra-high spatial resolution images. Moreover, the use of orthomosaic and DSMs as inputs has allowed to address complicated agronomical studies, i.e., the efficient identification and characterization of individual trees of woody crops, such as olive trees [38,39] and vines [9,22,40], classification of vegetation types [41], plant breeding program applications [42], and plant count estimation [43]. In addition, OBIA techniques using UAV imagery-based geomatic products have enabled the discrimination of weeds and crops in the early vegetative stage between [6] and within crop rows [3,44], and in tilled soils of vineyards without cover crops [22], which makes OBIA one of the most useful methodologies in complex scenarios with spectral similarity [36,45,46]. Therefore, combining the advantages of UAV imagery, in terms of flexibility and high spatial resolution, with OBIA´s ability to solve complicated spectral issues could be a suitable solution for the hitherto unresolved challenge of mapping C. dactylon infesting vineyards cover crops.
Incorporating suitable features into OBIA classifier algorithms may lead to a strong accuracy improvement of automated classification and self-adaptation to different geographic regions or time [3,47,48]. However, the selection of optimum features has been a significant challenge, especially in the OBIA context, due to the large number of object features generated after segmentation that can be used in the subsequent classification task [49,50,51,52]. In that complex situation, machine learning tools, e.g., neural networks (NNs), support vector machines (SVM), and decision trees (DTs), are advanced techniques for feature identification and pattern recognition that have been widely used in agronomic scenarios [53,54,55]. Among these techniques, DTs have received increasing attention from the remote sensing community due to their fast operation, the lack of assumption in data distribution, the ease of interpretable rules, and their ability to select embedded features [56], and have thus been shown to be highly suitable for agricultural image classification [57,58]. Moreover, DTs have been successfully used for feature selection in the context of UAV imagery-based OBIA procedures in agricultural scenarios, e.g., for rangeland monitoring [59]; land-cover classification [48,60]; and individual tree production at the orchard scale [61]. However, this technique combination remains to be addressed for weed mapping.
As part of an overall research program to implement Integrated Crop Management (ICM) Systems in vineyards, a combination of UAV-based technology and OBIA techniques has been evaluated to propose PV strategies that achieve a more sustainable use of agricultural products (e.g., herbicides) and efficient production (environmental and economic benefits). As the first step of this program, a robust OBIA procedure using DSMs was developed for 3D grapevine characterization [9], which is able to isolate vines and can be used as a basis to create new procedures for designing site-specific vineyard management strategies. Thus, as a second step of the program, the aim of the present study was to develop a novel and robust image analysis procedure for the automatic and accurate mapping of C. dactylon infesting cover crops in vineyards for the purpose of applying site-specific weed control. To achieve this objective, a two-step approach was proposed, consisting of: (1) selecting the optimum features to efficiently discriminate cover crops, C. dactylon and bare soil using DTs, and (2) developing and evaluating an automatic OBIA algorithm for vine, cover crop, bare soil and C. dactylon classification. To the best of our knowledge, the use of DT tools has not yet been applied to UAV images in the context of OBIA technology for weed mapping. Therefore, using the combination of UAV-based DSM, DTs, and OBIA would enable the significant challenge of automating image analysis in a complex vineyard scenario to be tackled, which represents a relevant advancement in PV.

2. Materials and Methods

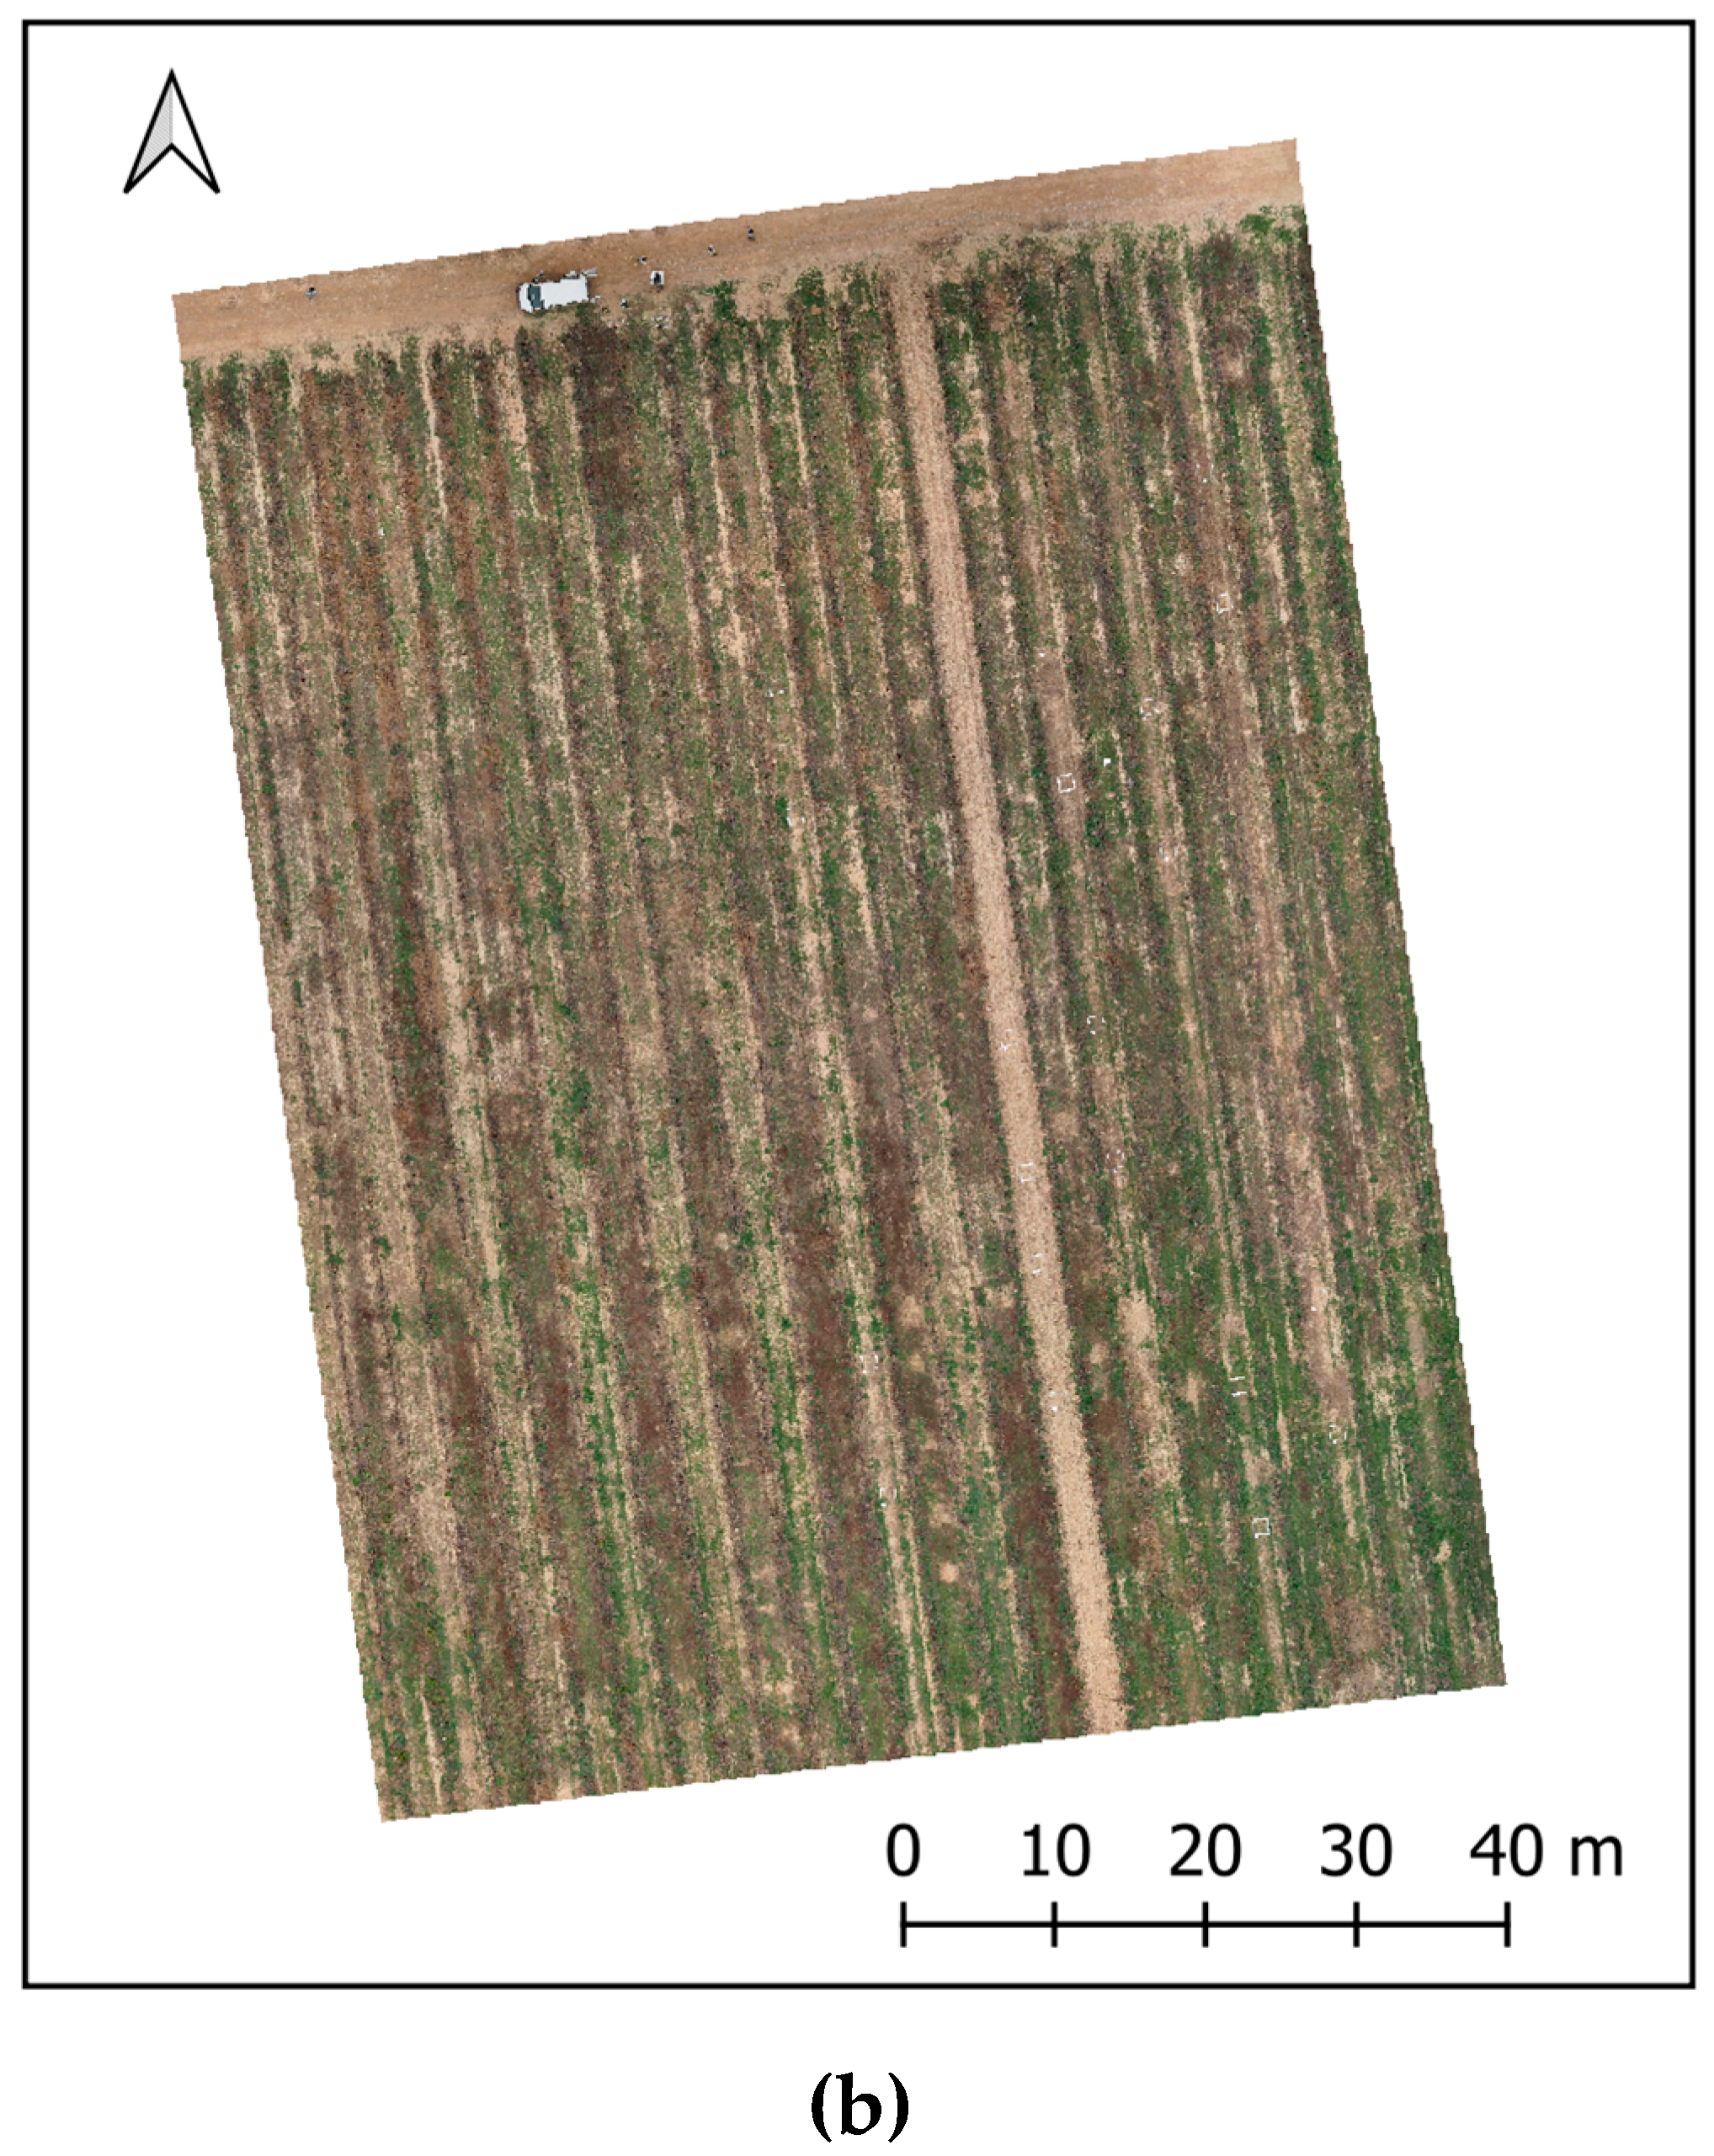
2.1. Study Fields and UAV Imagery Acquisition

The experiment was carried out in four commercial vineyards (Vitis vinifera L. cv. Pinot noir) located in Raimat, province of Lleida (Northeastern Spain), identified as fields A-16, B-16, C-16, and C-17 (Table 1). Vines were drip-irrigated and trellis-trained, with rows separated by 2.4 m and vine spacing of 1.7 m in the case of A-16 and B-16, and by 3 × 2 m for C-16 and C-17. Sown cover crops in the inter-row spaces were composed of different species (Table 1) at an early vegetative stage, showing the typical green color in all fields and were naturally infested by C. dactylon (Figure 1). However, the B-16 cover crop showed a slightly less advanced growth stage, resulting in fewer and smaller plants emerging (Figure 1a). The cover crop management was mainly focused on minimizing soil erosion and compaction, as well as control of weeds, which were also managed through the application of herbicides in early autumn and spring. C. dactylon plants infesting cover crops were in a dormant stage and in some of the fields, due to the frequent variability in field conditions, shortly before initiating the vegetative growth stage, thus showing spectral similarity with bare soil and cover crops, respectively (Figure 1). A few days prior to flights, vines of C-16 and C-17 were manually pruned, while no pruning was carried out for A-16 and B-16 vines due to the early age of the vines.
The aerial images were taken in early February 2016 and late January 2017 with a quadrocopter UAV platform model MD4-1000 (Microdrones GmbH, Siegen, Germany) equipped with a commercial off-the-shelf camera, model Olympus PEN E-PM1 (Olympus Corporation, Tokyo, Japan). This low-cost RGB (R: red; G: green; B: blue) camera is composed of a 17.3 × 13.0 mm sensor, capable of acquiring 12.2-megapixel spatial resolution images with an 8-bit radiometric resolution and is equipped with a 14 mm focal length. The flight routes based on the waypoint navigation system were designed to take photos continuously at a 30 m flight altitude with a forward overlap of 90% and a side overlap of 60%, large enough to achieve a 3D reconstruction of vineyards according to previous research [9], and leading to a spatial resolution of 1 cm/pixel, i.e., a ground sample distance (GSD) of 1 cm.pixel−1, which is crucial for identification and mapping vegetation in early growth stages [3].
The UAV flights were authorized by the private company Raimat S.L, owner of the fields and the operations fulfilled the list of requirements established by the Spanish National Agency of Aerial Security, including the pilot license, safety regulations and limited flight distance (AESA).

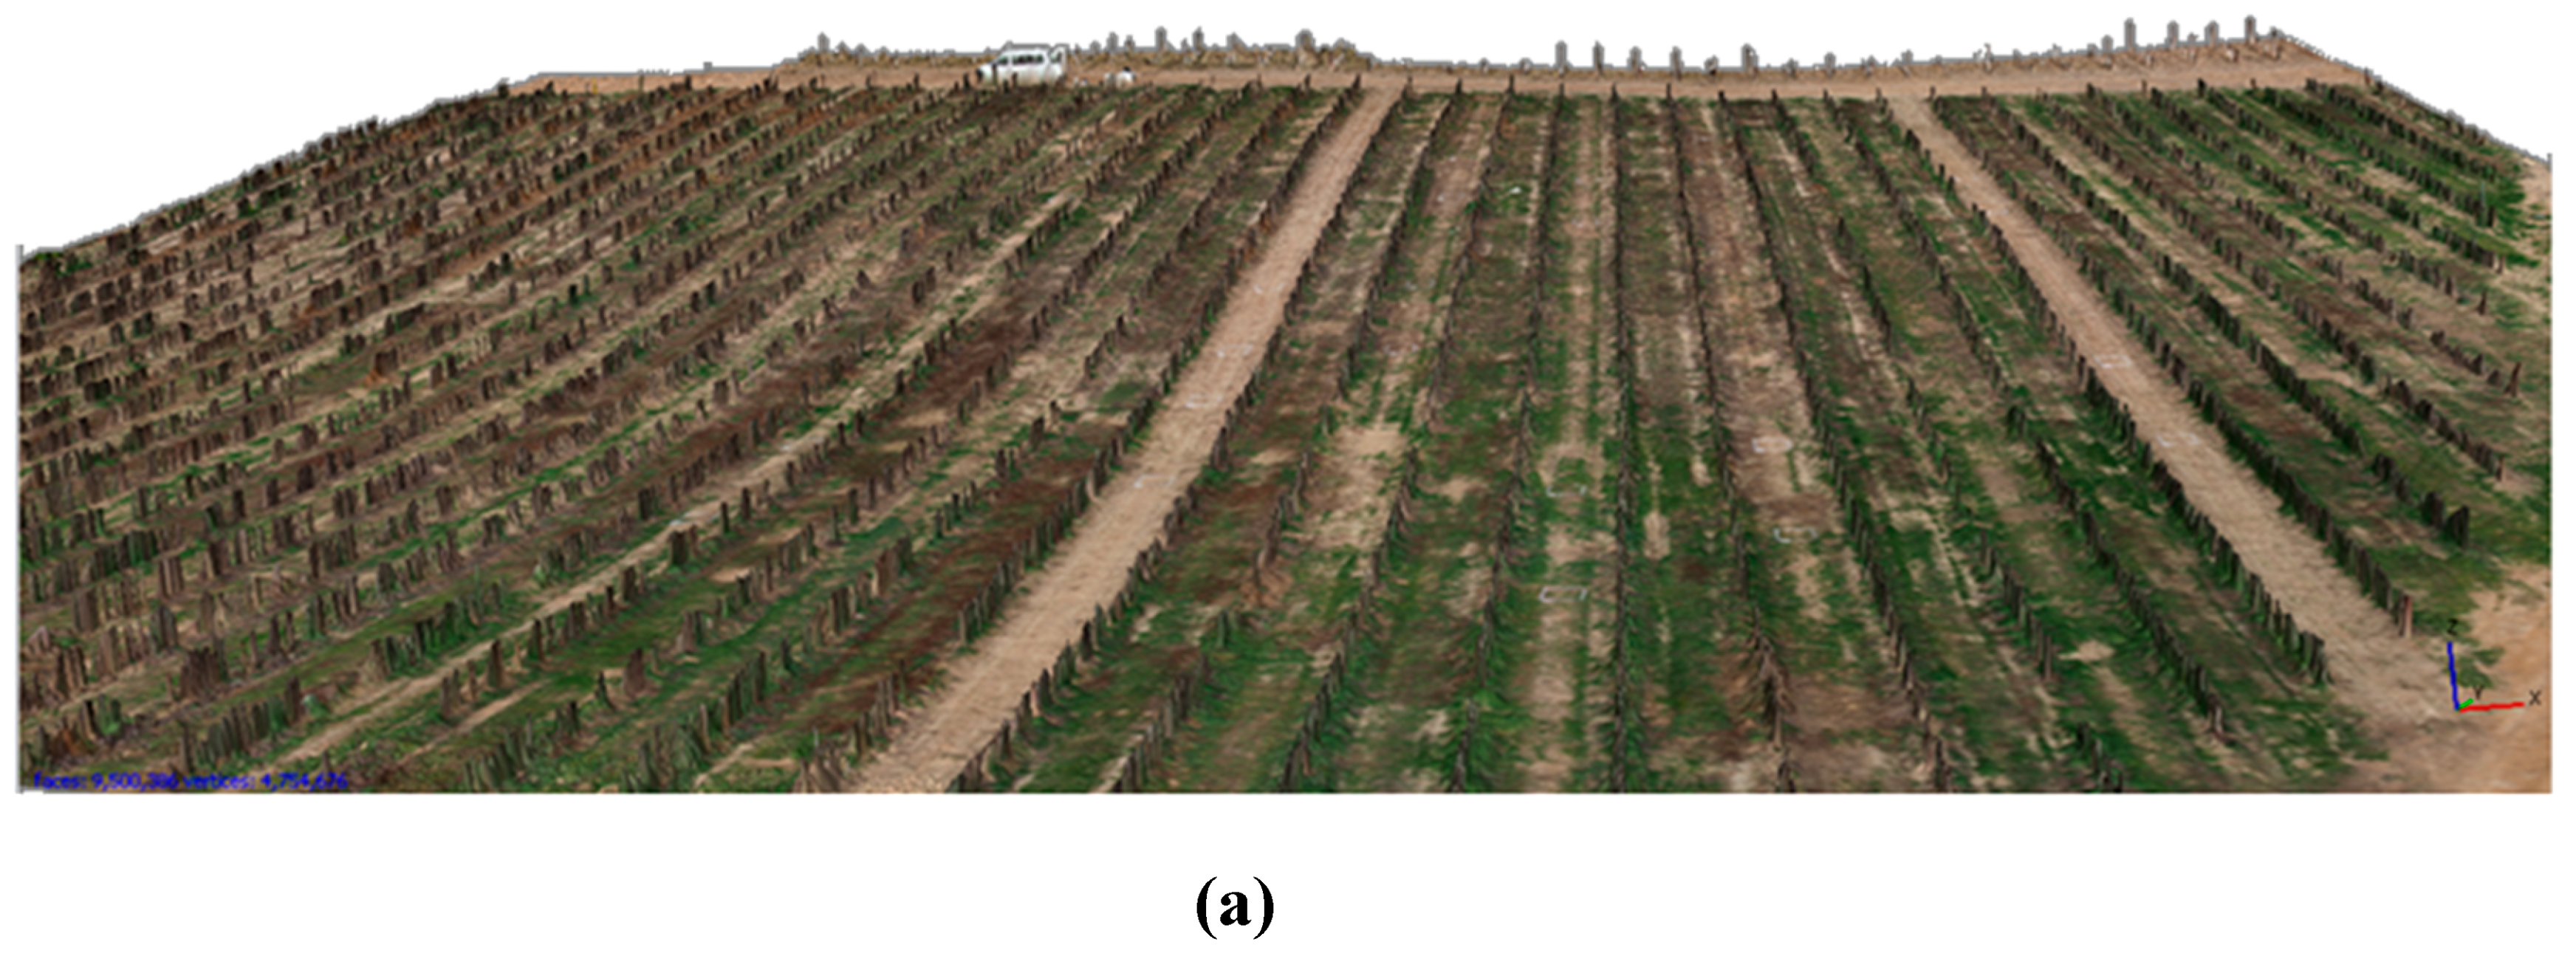
2.2. Generation of the Digital Surface Model (DSM) and Image Mosaicking

Geomatic products (DSM and orthomosaics) were generated using Agisoft PhotoScan Professional Edition software (Agisoft LLC, St. Petersburg, Russia) version 1.2.4 build 1874. The mosaic development process was fully automatic, with the exception of the manual localization of five ground control points in the corners and center of each field with a Trimble R4 Global Positioning System (GPS) (Trimble company, Sunnyvale, California, United States; centimeter accuracy) to georeference the DSM and orthomosaic. The whole automatic process involved three main stages, as follows: (1) aligning images, in which the software searched for common points and matched them, to estimate the camera position in each one, and calculated the camera calibration parameters; (2) building field geometry (dense 3D point cloud and DSM) by applying the Structure from Motion (SfM) technique to the images (Figure 2a); and (3) orthomosaic generation through the projection of individual images over the DSM. The described methodology used to build accurate geomatic products in woody crops has been validated in previous research [38,62]. The DSMs, which represent the overflown area and reflect the irregular geometry of the ground and plant shape, were saved in a grayscale tiff format and joined to the orthomosaic, producing a 4-band multi-layer file (R, G, B, and DSM) (Figure 2b). The DSMs were mainly employed to isolate and classify vines, as explained in [9].

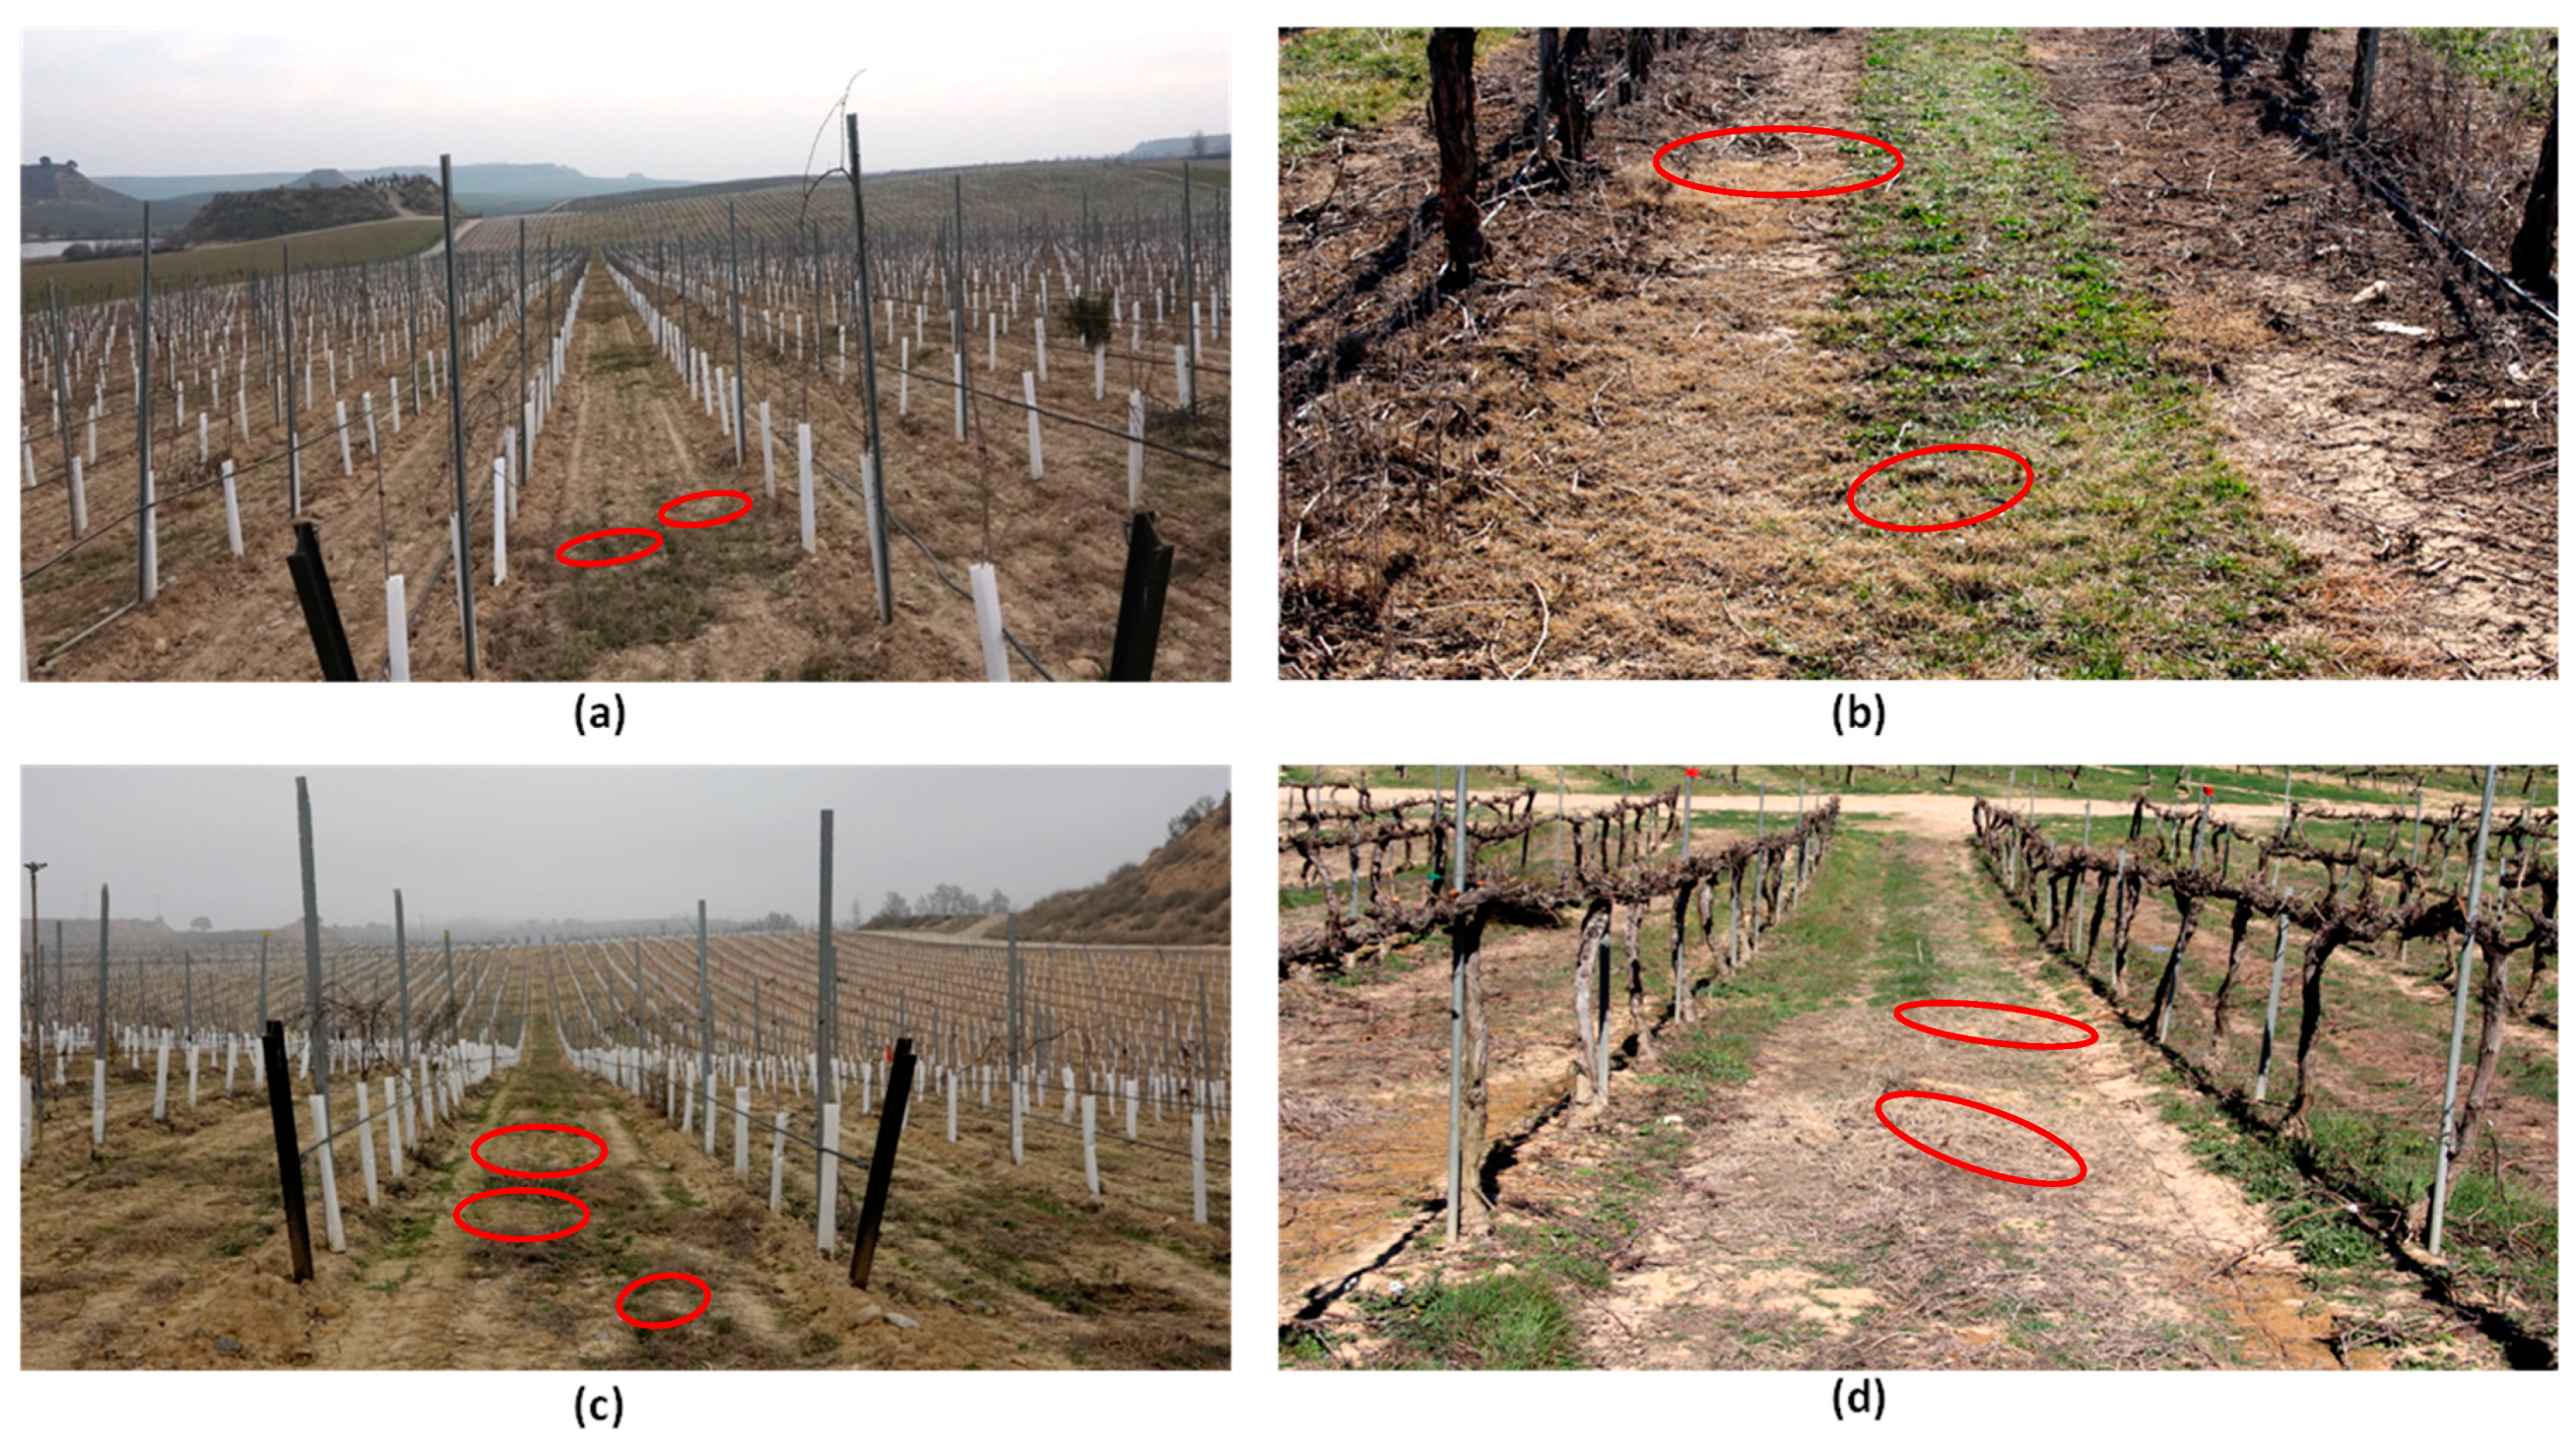
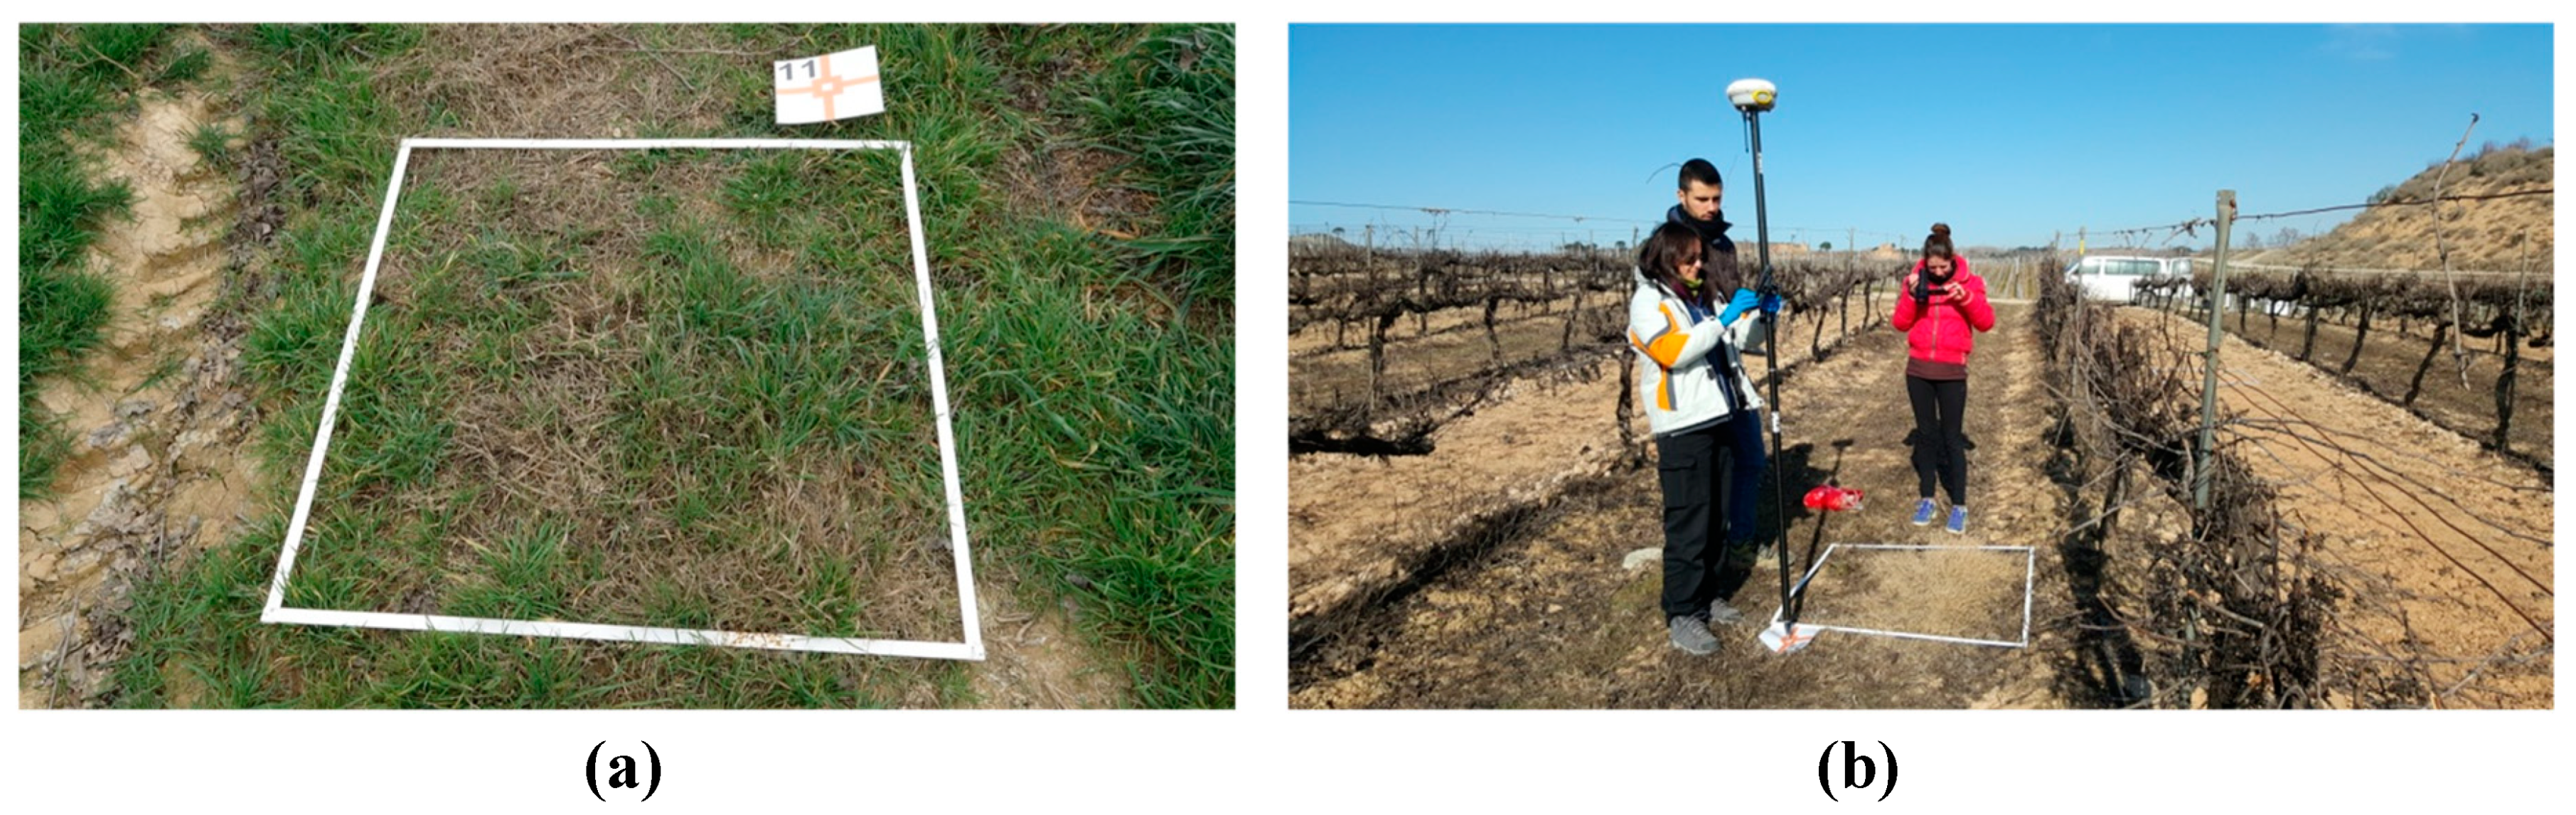
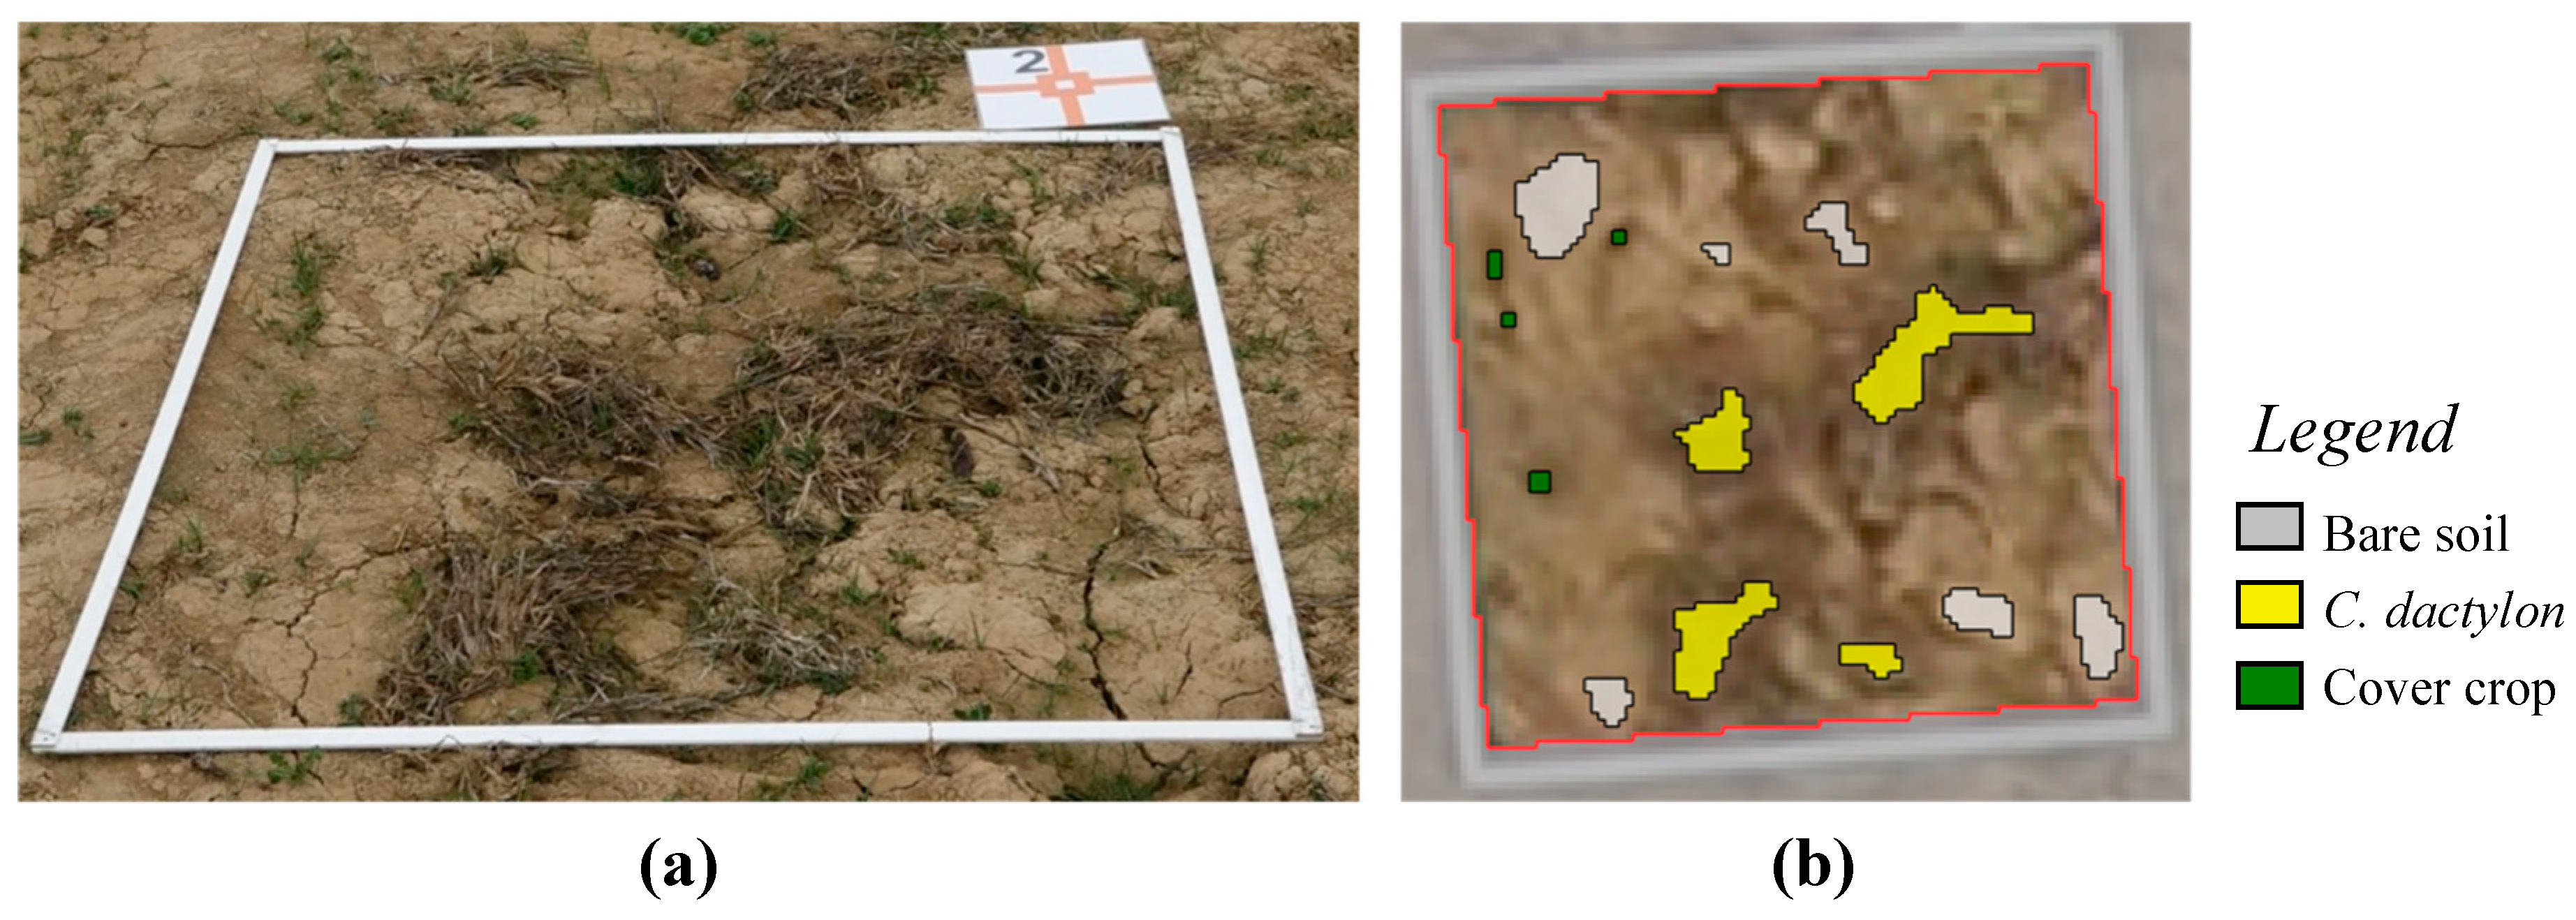
2.3. Ground Truth Data

Training (i.e., selection of the optimum features) and validation of the DT-OBIA algorithm were carried out on the basis of a random on-ground sampling procedure conducted during the UAV flights in each vineyard. A set of 18 ground-truth 1 × 1 m frames for C-16 and C-17, and 24 similar frames for A-16 and B-16 were distributed in the inter-rows of each field to ensure that the entire field had an equal chance of being sampled without operator bias [63]. Every sampling frame was georeferenced and photographed (Figure 3b), and was employed to visually identify bermudagrass infestation within the cover crops.
The very high spatial resolution of the UAV images made it possible to conduct manual digitization of cover crop, bermudagrass plants, and bare soil in every sampling frame by weed experts, creating a vector shapefile of the ground truth data of each vineyard (Figure 4).
The research was divided into two parts: firstly, DT-based Machine Learning analysis was carried out to select the optimum features for C. dactylon discrimination, and secondly, object-based image analysis was performed to map C. dactylon in the interrow cover crops and the developed OBIA algorithm was evaluated. Therefore, the field data set was divided into two independent sub-sets: (1) C-16 and C-17 fields were employed as training parcels to model and evaluate the decision tree, and (2) A-16 and B-16 fields were used as validation parcels to evaluate the OBIA algorithm for C. dactylon, cover crop, vines and bare soil mapping, as explained in the following sections.

2.4. Optimum Feature Selection

2.4.1. Image Segmentation and Definition of Object-Based Features

This first part of this experiment consisted of defining the most effective features to discriminate cover crops, bare soil, and bermudagrass using ground truth data from C-16 and C-17 fields by DT modeling. To that end, a multi-resolution segmentation algorithm (MRS) included in the eCognition Developer 9.2 software (Trimble GeoSpatial, Munich, Germany) was used to segment the orthomosaics in objects that delineate the plant borders, and to generate the object-based framework. MRS is a bottom-up segmentation algorithm based on a pairwise region merging technique in which, on the basis of several parameters defined by the operator (scale, color/shape, smoothness/compactness), the image is subdivided into homogeneous objects. Visual assessment of segmentation outputs was used to fix the optimal values of scale, color, shape, smoothness and compactness at 5, 0.7, 0.3, 0.5, and 0.5, respectively. Once the ground truth data (cover crops, bare soil and bermudagras objects) were correctly identified in the orthomosaics, features were extracted from images.
The object-based framework offers the possibility of computing spectral and textural features of each object in the image [64], therefore providing more information to enhance the power to discriminate heterogeneous classes [65]. Three groups of object features were extracted and evaluated in this research, as defined in Table 2. The first group corresponded to object spectral information based on the mean, mode and standard deviation (SD), which were calculated for each R, G, and B bands from the values of all the pixels forming an object. The SD value indicates the degree of local variability of pixel values within the object, and the mode is the value most likely to be sampled. For the second group, eight object Vegetation Indices (VIs) derived from the aforementioned bands were created. VIs are ratios or linear combinations of bands that take advantage of differences in the reflectance of vegetation between wavelengths. The selected VIs are related to vegetation conditions and plant structure and have been widely used for agricultural studies because of their potential to highlight vegetation characteristics crucial for class differentiation [57,66]. In the third group, seven object textural features based upon the gray-level co-occurrence matrix (GLCM) were calculated by determining how often pairs of pixels with specific values and in a specified spatial relationship occur in an image [67]. Textural information has shown potential to improve the detection of weeds [64,68]. The textural features herein evaluated have been considered the most relevant statistical parameters extracted from the GLCM [69]: the Homogeneity and Dissimilarity features measure high or low object pixel uniformity, respectively; the Entropy feature is related to object pixel disorder; the Contrast feature measures the local variations in the image; the Standard Deviation feature is a measure of the dispersion of values around the mean; the Ang. 2nd Moment measures the homogeneity of the image; and the Correlation feature measures the linear dependency of gray levels of neighboring pixels [70].

2.4.2. Decision Tree Modeling and Model Evaluation

The extracted object features (spectral, VIs and textural) constituted the data pool for creating, pruning, interpreting, and evaluating the DTs of each training parcel. Modeling was performed using the recursive Partitioning platform of the statistical software JMP 12.0.1 (SAS Institute Inc., Cary, NC, USA). The tree was built by binary recursive splitting of the training set and selecting the feature that best fit the partial response in every split. The partition algorithm chooses optimum splits from a large number of possible ones by the largest likelihood-ratio chi-square (G2) statistic, commonly used in assessing goodness of fit in multivariate statistics [57,71]. The G2 statistic involves the ratios between the observed (f) and expected (fi) frequencies, as expressed in the equation (1). In either case, the split is chosen to maximize the difference in the responses between the two branches of the split (2).
G 2 = 2 f ln ( f f i )
G 2 t e s t = G 2 p a r e n t ( G 2 l e f t + G 2 r i g h t )
A five-fold cross-validation procedure was performed for parameter adjustment and model evaluation, i.e., dividing the entire data into five subsets, and testing the model developed from four folds on the fifth fold, repeated for all five combinations, and averaging the rate predictions. The Global Accuracy (GA), Correct Classification C. dactylon Rate (CCCR, the percentage of C. dactylon ground truth data correctly classified by the model), Receiver Operating Characteristic (ROC) curve and the root mean square error (RSME) derived from the process were used to select the model. CCCR is the percentage of C. dactylon objects correctly classified, while GA indicates the total percentage of correctly classified objects. ROC involves the count of true positives by false positives as frequencies accumulate across a rank ordering measured by the area under the ROC curve: the greater the area under the curve, the more accurate the test/prediction model. Since the objective of using DT models was the identification of meaningful and robust features for weed discrimination, similar results in the DT for every field were observed. Finally, the best DT was chosen by selecting the optimal features that yielded the higher accuracy, and was then used for C. dactylon mapping in the next part of this study.

2.5. Object-Based Image Analysis

After DT-based multivariate analysis was carried out at the training parcels to select the optimum features, object-based image analysis was performed in the validation parcels to develop the algorithm for mapping C. dactylon in vineyards under a cover crop system and quantify its correctness.

2.5.1. OBIA Algorithm Development

The features selected by the DT models were used to develop a novel and robust OBIA algorithm to generate a four-class map (i.e., vine, cover crop, C. dactylon, and bare soil). For this end, A-16 and B-17 vineyard geomatic products, i.e., DSM and orthomosaics, were employed to assess the transferability of the model to different UAV image subsets captured at different times and locations.

2.5.2. OBIA Model Validation

The performance of the OBIA classification algorithm was evaluated by comparing the results obtained in the classified map of each validation parcel (A-16 and B-16) with their ground truth data. The accuracy was assessed in terms of thematic and geometrical typification, as the spatial locating and the class of objects were evaluated. An object was considered as correctly classified when it coincided with a ground truth data in terms of position, area covered and class. All these parameters are relevant as errors in weed coverage and weed density might affect the decision-making process of crop management [3,64]. Then, a confusion matrix was created for each classified orthomosaic providing the Overall Accuracy (OA), which indicates the percentage of correctly classified pixels, and the User’s accuracy (UA), defined as the percentage of classified pixels of each class that coincide with the verified ground-truth map, indicating how well training-set pixels were classified [72]. This area- and location-based validation approach herein performed overcomes the site-specific accuracy assessment limitations associated with pixel-based classification applied to object-based image analysis [73].

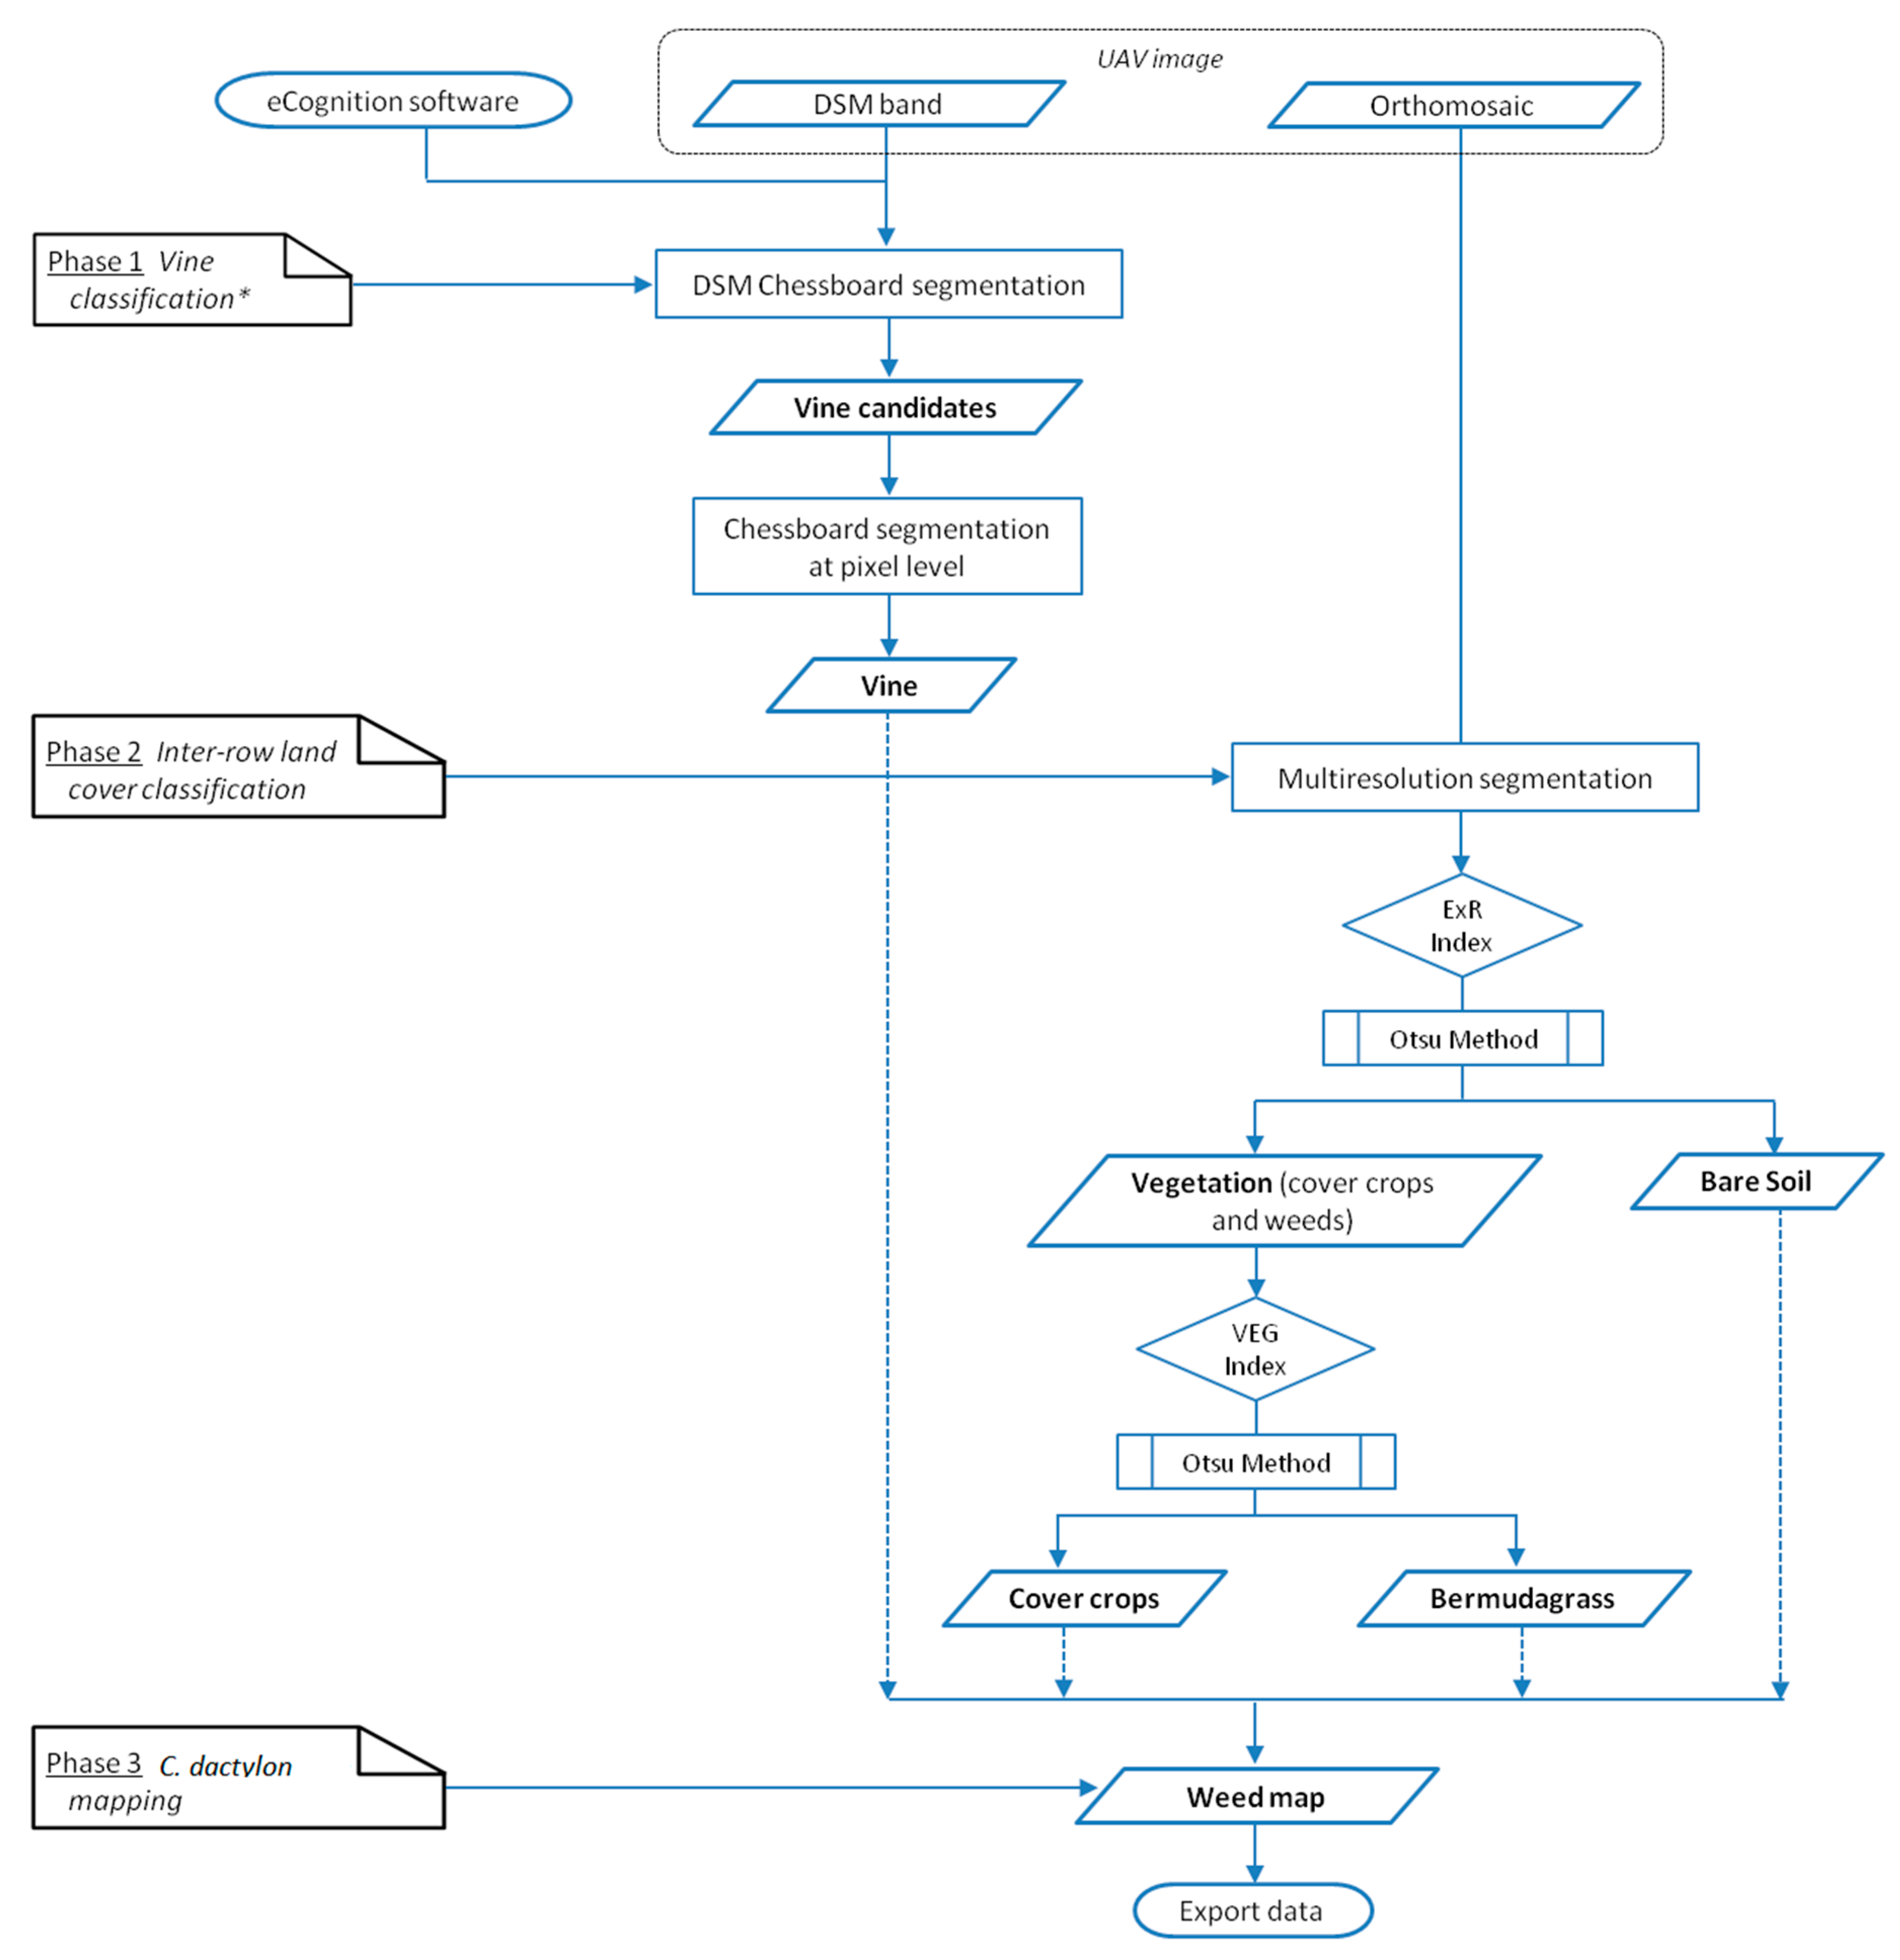
3. Results and Discussion

3.1. Machine Learning Analysis-Features Selected

DT models selected the object-based features and their cutting instructions that best separated every class (Figure 5). The same DT scheme was found for both training parcels, which indicates a high robustness in the feature selection and split decisions, given the diversity of the studied vineyards.
The model consisted of two splits, thus making the model easy for implementation in a classification algorithm. The first split was based on discriminating between bare soil and vegetation using the ExR vegetation index. ExR is a redness index widely used to identify soil [74] and emphasize the brown color of some land uses [66], allowing a good separation from green color classes. Vegetation classes (C. dactylon and cover crop) were discriminated in the second split by means of the VEG index, as C. dactylon plants showed very low greenish vigor due to the dormancy period. Similar results were reported by [57], where the VEG index was required to discriminate between tomato fields and safflower in early-summer on the basis of the differences in greenness at that time. Table 3 shows the importance of each selected feature by means of its contribution to the total G2 statistic. ExR was the feature that predominantly contributed to the DT built for every training parcel, with values of 59% for C-16 and 92% for C-17, followed by VEG, which contributed 41% and 8% to the overall G2 of the respective models. These results reflected that a larger difference in the spectral response was found for the bare soil data than for the C. dactylon and cover crop grouping, which also implied that the spectral information of C. dactylon and cover crop was more closely associated.
The VIs selected in the DT models provided a high accuracy in data classification (Table 4). High GA values were found in both training vineyards analyzed, and all of them were higher than 97%. Similarly, the accuracy statistic that evaluated the weed classification correctness (CCCR) reported values close to the maximum, indicating that this DT model may be well suited for C. dactylon mapping. In terms of individual accuracy for each class, large values of area under the ROC curve were obtained for each one, being higher than 0.95 for all cases, pointing out an excellent test according to the traditional academic point system [75]. Moreover, low RMSE values were achieved in the classifications (<0.16), showing an excellent fit of the model to the ground truth data.
No information from any other evaluated object feature group, i.e., spectral features based on the mean, mode, SD and textural ones, was selected for the DTs, although texture metrics have often been used for weed detection as this enhances the separation of spectrally similar image regions [49,76]. In that context, [68] combined spectral and textural features to improve the accuracy of a two-class discrimination problem composed of C. dactlylon patches and sugarcane rows. For that purpose, the authors tested several window sizes in a pixel-based analysis with a single VI, as well as a dataset of textural features very suitable for separating the two classes by capturing the textural transition between them. In our experiment, which consisted of a four-class discrimination issue, the DSM-based OBIA approach enabled us to isolate the vines using the height parameter, as explained by [9], which has been shown to be a more accurate and efficient alternative to crop isolation in spectral similarity scenarios. Moreover, eight VIs were tested, which increased the likelihood of selecting a well-functioning VI, and proved to be more suitable than textural information, possibly due to the larger number of classes involved in this experiment.
These results showed that ExR and VEG are suitable for the accurate discrimination of C. dactylon, bare soil, and cover crop. However, the use of these VIs as a feature to classify these land uses in a vineyard is only practicable within the context of OBIA, as it requires every individual plant in the field to be identified through a segmentation process, thus overcoming the limitations of pixel heterogeneity and spectral similarity of the pixel-based method. Therefore, the combination of DT and OBIA enabled the efficient selection of features for the discrimination of land uses in the inter-row vineyards. Consequently, these optimum features should be used to develop the C. dactylon classification algorithm in the next part of this experiment.

3.2. Image Analysis

Once the optimal features to discriminate C. dactlylon, bare soil and cover crops were selected, a novel OBIA algorithm was developed and validated for the analysis of the high resolution UAV imagery.

3.2.1. Description of the OBIA-Algorithm Developed Using DT Modeling

The most effective features identified by the DT model were implemented in the OBIA algorithm for C. dactylon mapping, which was developed using the Cognition Network programming language with the eCognition Developer 9.2 software (Trimble GeoSpatial, Munich, Germany). The algorithm was based on the versions fully described in our previous work and used for the 3D characterization of grapevines [9], in which vines were identified and vine geometric features computed. However, land covers in the inter-row were not detected. Therefore, the new version presented here is original and also includes mapping of the inter-row classes: cover crop, C. dactylon, and bare soil. The algorithm is fully automatic as it does not require user intervention, and is self-adaptive to the different conditions of fields, such as the slope; vine size; row-orientation; row and vine spacing; row gaps; and vegetation growing in the cover crop, whether natural or sown, grass or legume. The algorithm consisted of a sequence of phases (Figure 6), as follows:
  • Vine classification: vine objects were automatically identified and classified on the basis of the DSM information, thus avoiding misclassification as a cover crop or weed due to spectral similarity, as described by [9]. Firstly, chessboard segmentation was performed for object generation. Then, the DSM standard deviation feature was used to define "vine candidates", and a subsequent analysis at a pixel level comparing their DSM value with that of the surrounding soil square enabled the refinement of vine object delimitation and classification of the rest of the land covers as not-vineyard. The use of this approach to identify vine objects has great advantages as it prevents errors due to the eventual field slope, and decreases the computational time of the full process, without penalizing the segmentation accuracy [9].
  • Inter-row land cover classification: once the vines were identified, the remaining land covers in the vineyard were classified by the following three steps:
    2.1
    Segmentation: the orthomosaic was segmented with the MRS algorithm using the spectral (R, G, and B) information. MRS is a bottom-up segmentation algorithm based on a pairwise region merging technique involving several parameters (scale, color/shape, smoothness/compaction) definition to subdivide the image into homogeneous objects; plant objects in this research. The values of these parameters were set to 5, 0.3, 0.5, and 0.5 for scale, color, shape, smoothness, and compactness, respectively, to generate objects adjusted to the actual shape of cover crop and weed plants. They were obtained in a preliminary study using a large set of vineyard plot imagery.
    2.2
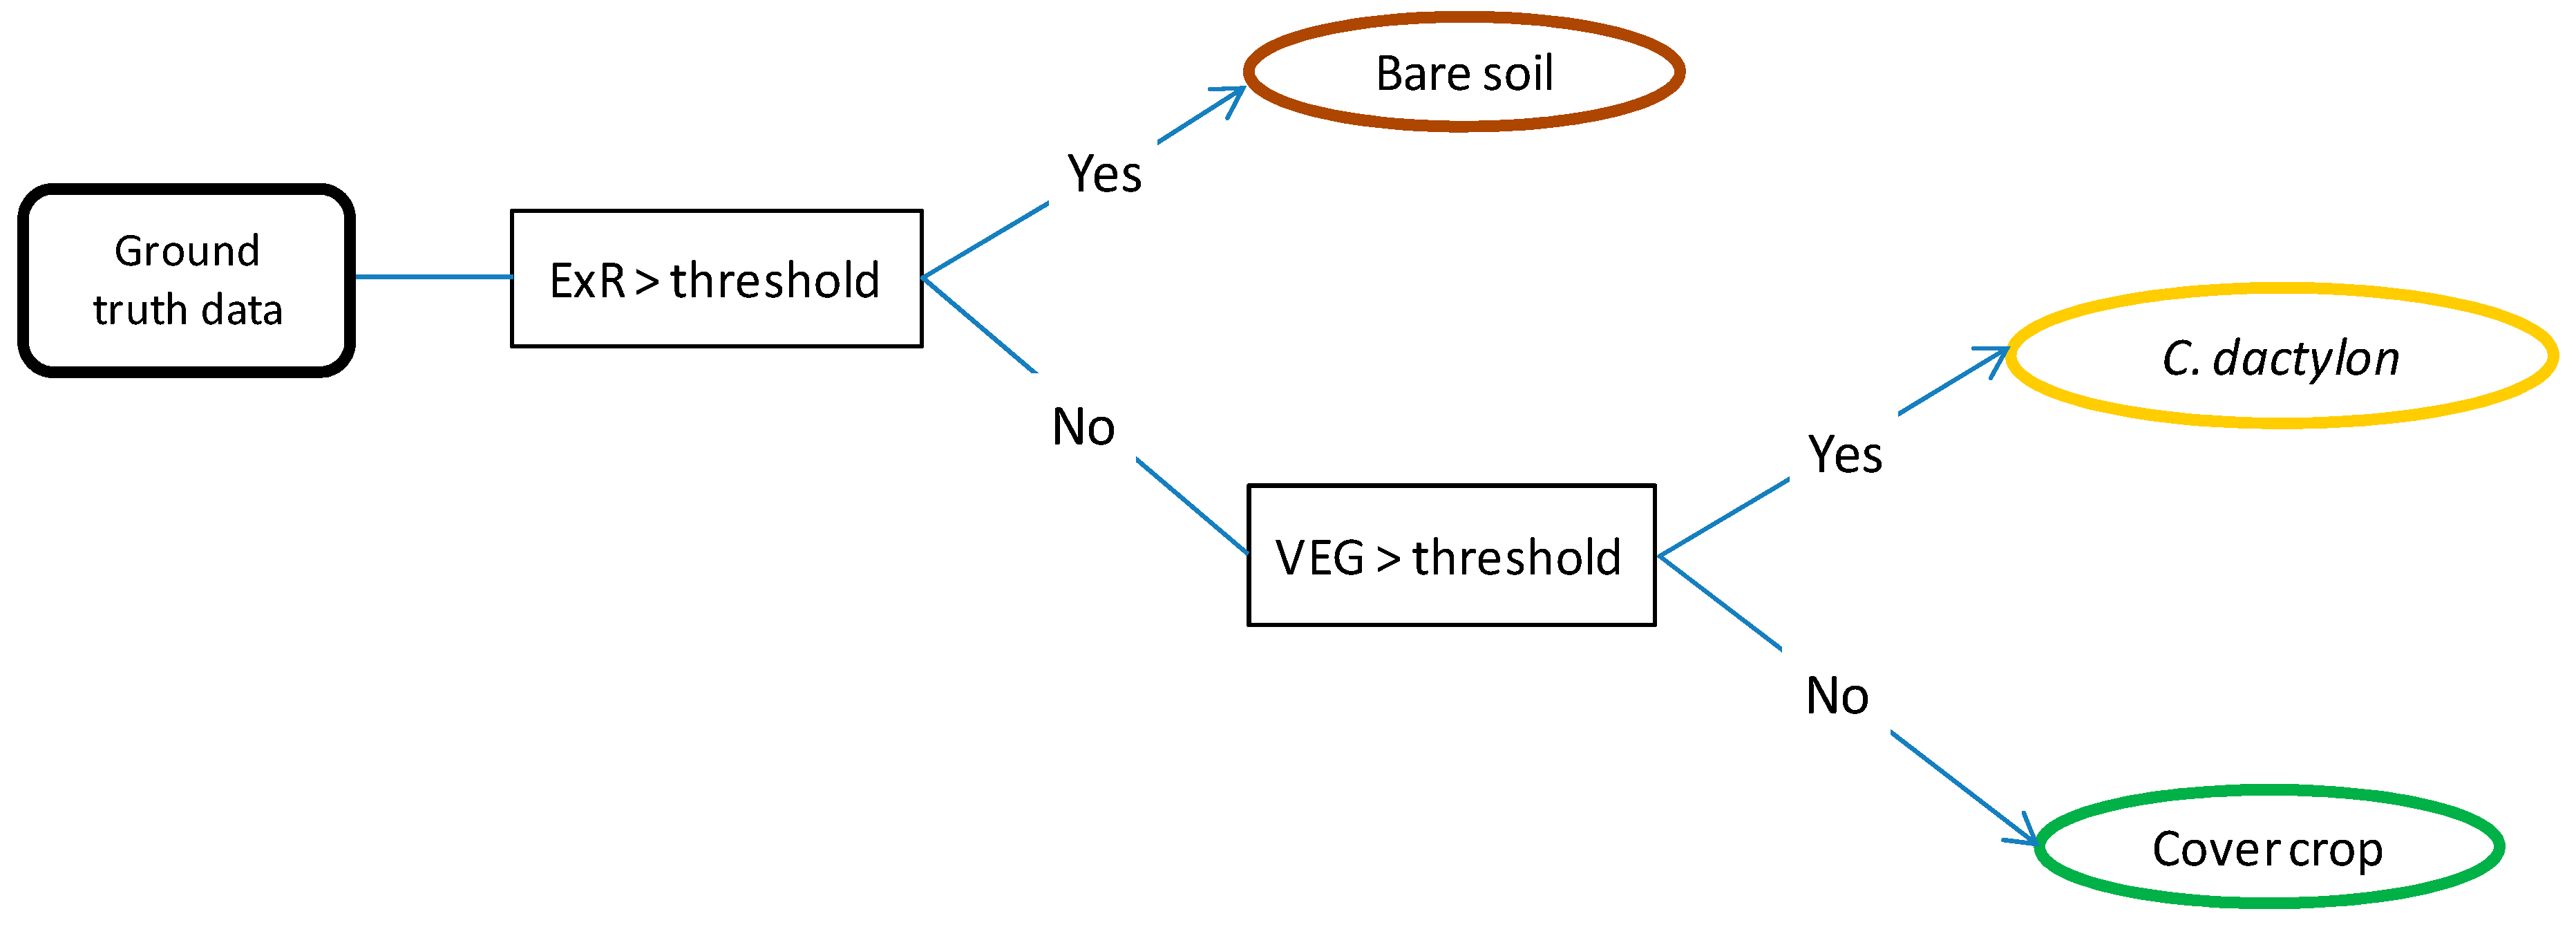
    Bare soil thresholding: following the results obtained in the DT analysis, the bare soil objects were first separated from the vegetation (cover crop and C. dactylon) using the ExR index. The automatic selection of the optimal threshold value in each image was carried out by implementing the Otsu method (an iterative threshold approach defined by [77]) in the algorithm according to [78].
    2.3
    Cover crop and C. dactylon classification: once the bare soil was separated, the remaining objects of the image, corresponding to vegetation, were discriminated and classified using the VEG index based on the DT results. The optimal threshold value to separate cover crop and bermudagrass was automatically obtained in each image using the Otsu method. Therefore, no user intervention was necessary at any stage of the classification.
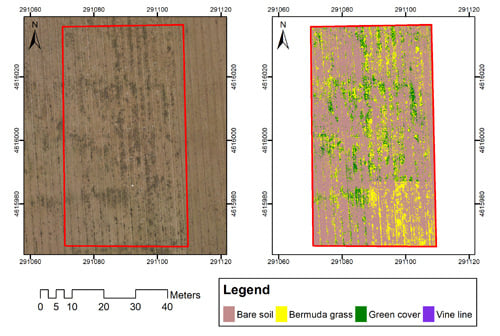
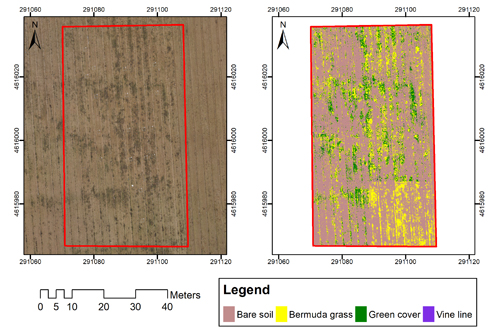
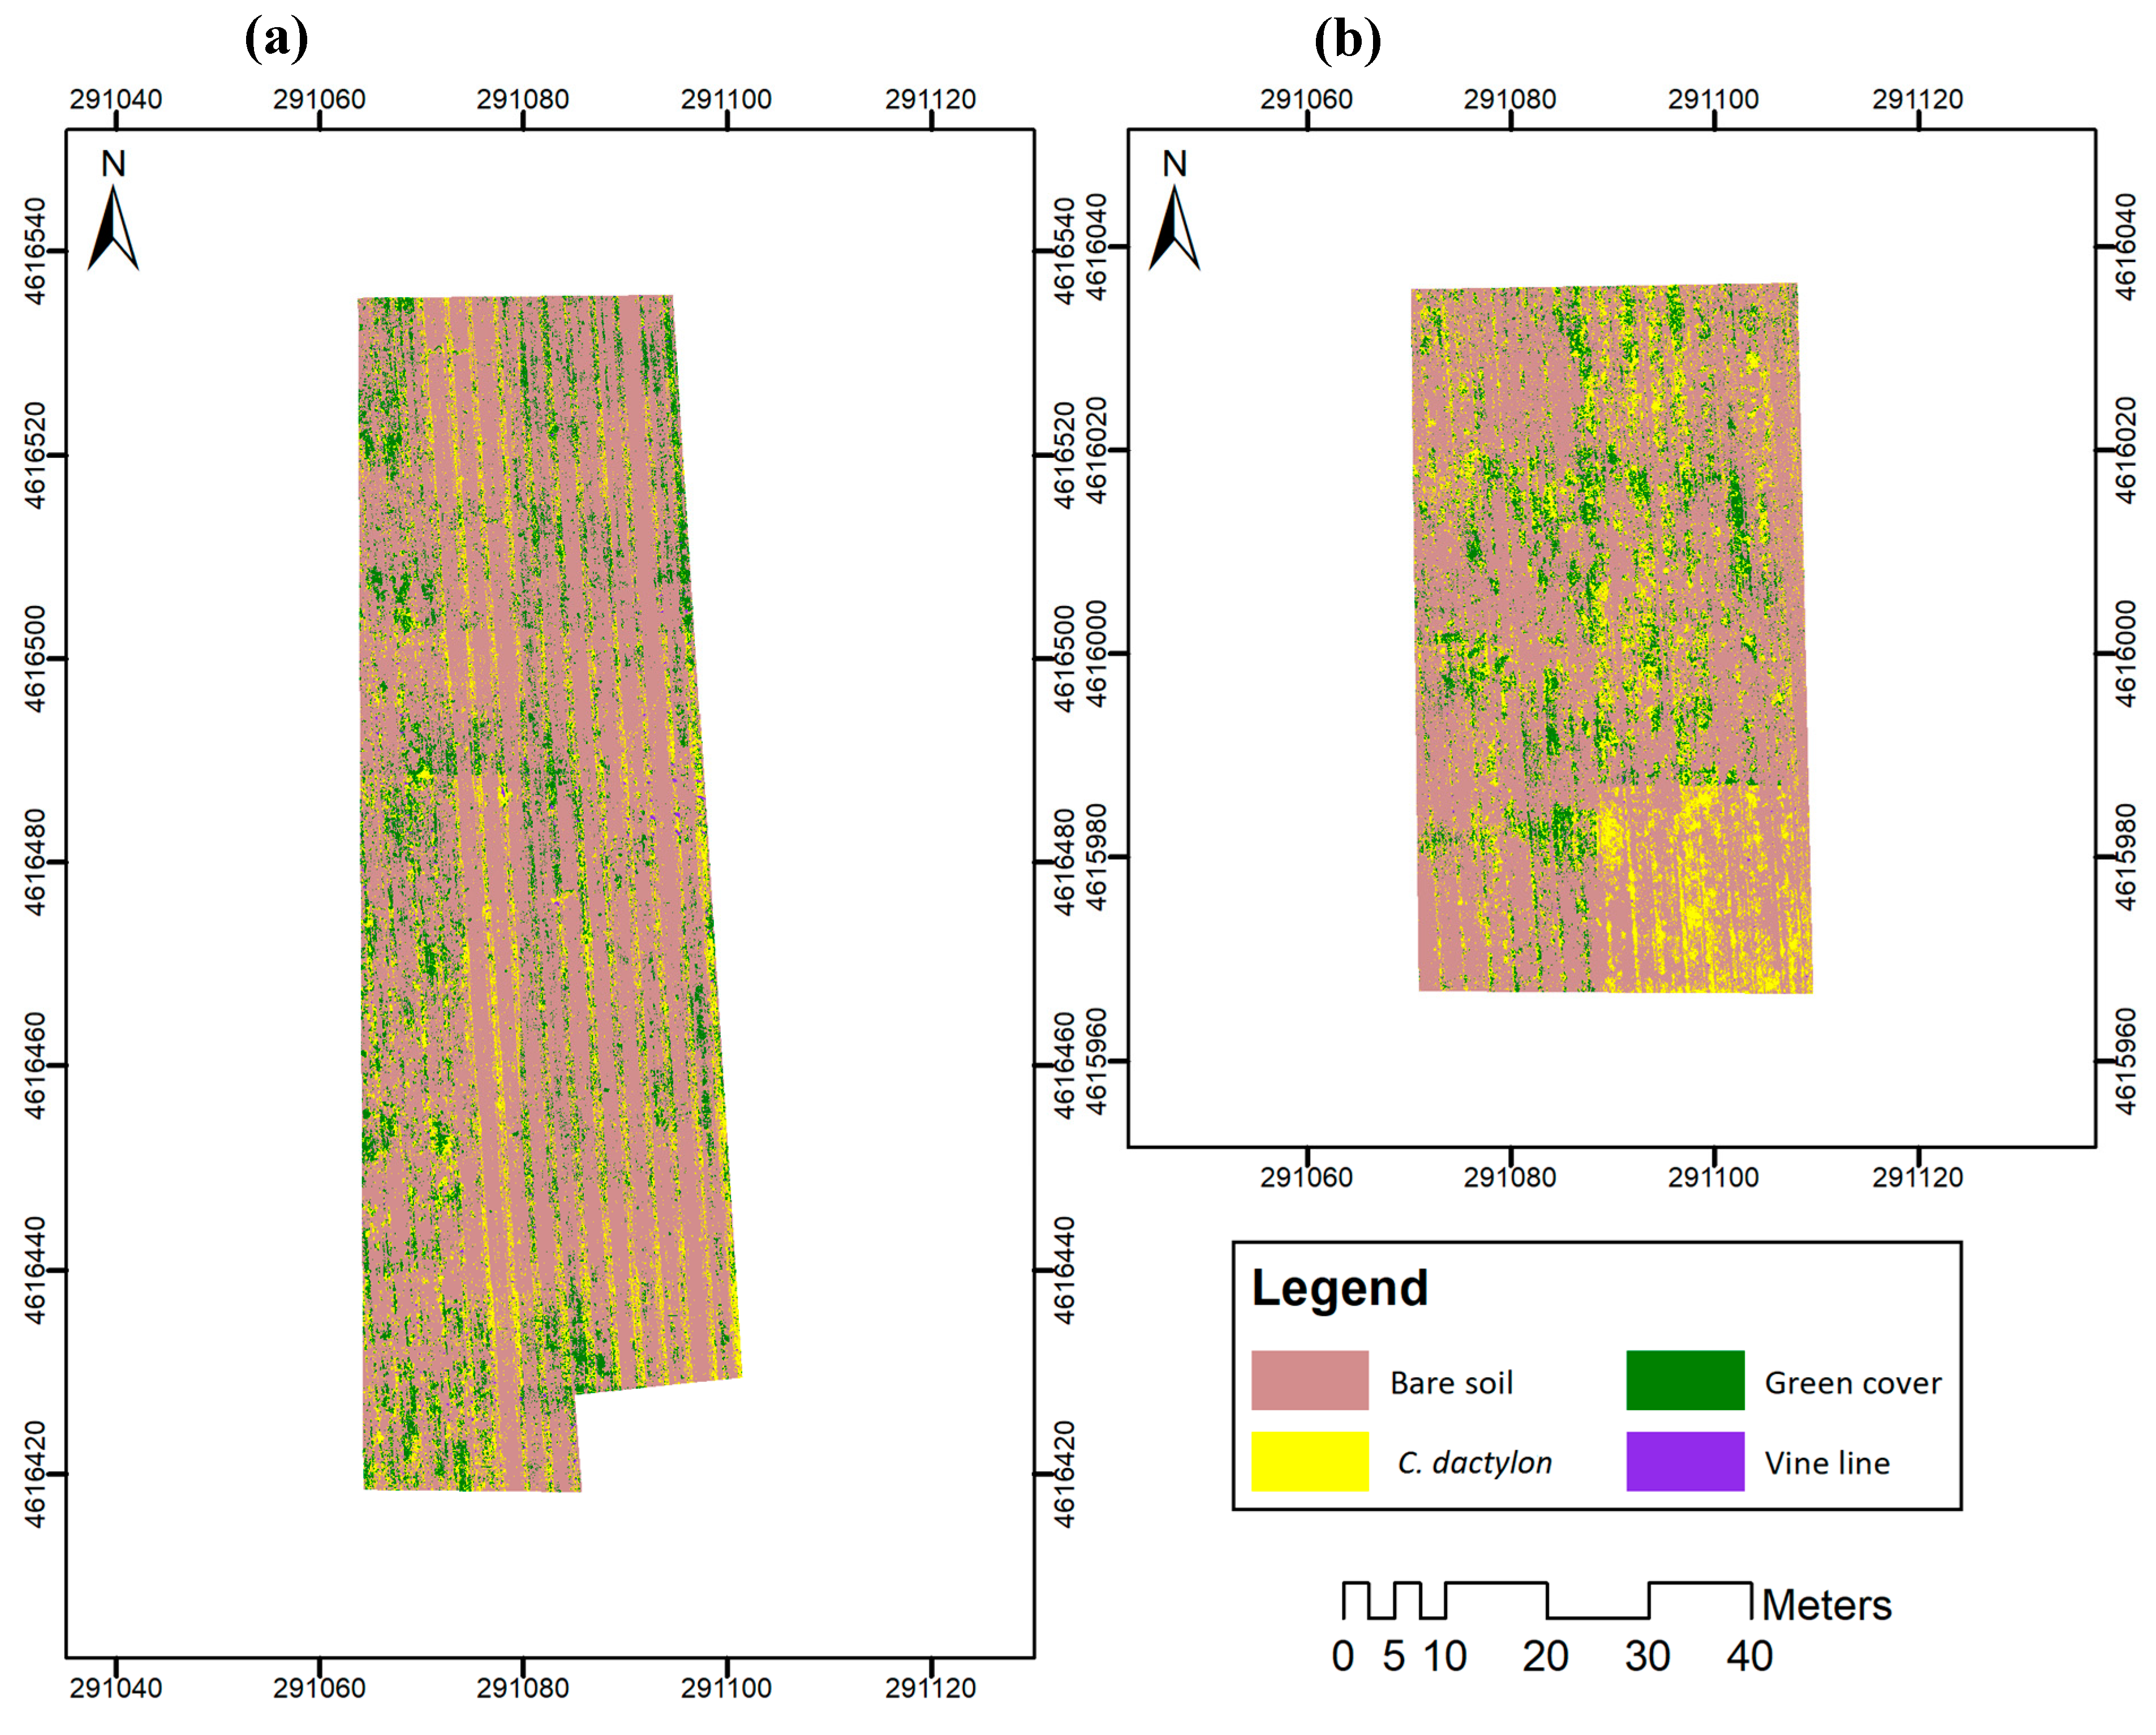
  • C. dactylon mapping: a classified map composed of the vines, bare soil, cover crop plants and C. dactylon patches was generated. From the map, the OBIA algorithm identified every vine, bermudagrass and cover crop plant, and their geographic coordinates and surface values were reported.

3.2.2. Evaluation of the DT-OBIA Algorithm for Weed Mapping

A classified map was generated by the described OBIA algorithm for each validation parcel, A-16, and B-16 (Figure 7), and UAV image subsets not used in the first part of this study. The algorithm automatically classified each object as vine, cover crop, C. dactylon, or bare soil, using both the spatial information and the features selected in the DT analysis to create a georeferenced map, where x and y coordinates were attributed to every object and their geometric characteristics (area, height, and shape) were calculated and exported.
The vines were correctly identified with an accuracy higher than 93% based on the previous study performed by [9], which showed algorithm robustness for adapting to different vineyard scenarios, as A-16 and B-16 consisted of small young vines and many gaps (missing vine plants) due to the early age of the vineyard plantations of these validation parcels. Once the vines were separated on the basis of DSM information, thereby overcoming the spectral similarity between vines and the rest of the vegetation (cover green and weeds), the algorithm mapped the bare soil, cover crop, and C. dactylon with a high accuracy. The classification statistics from the confusion matrix for each classified map are shown in Table 5.
Satisfactory OA results were obtained for both maps (89.82% in A-16 and 84.03% in B-16), with values very close and higher than the established criteria of 85% for successful land cover categorization [79]. In addition, the obtained results far outperformed the accuracy criteria for complex vegetation classifications stated as being 60% [80]. In that sense, an OA criteria of 80% for the correct classification of weeds has been set for very complex scenarios, such as weed discrimination within rows or at a broad-scale [3,81]. Additionally, mapping weeds within cover crops is considered a major challenge in precision viticulture [31]. Moreover, the accuracy assessment in our research work was performed in both thematic and geometrical typing, providing classified objects that were correctly identified and located.
The lower accuracy obtained in B-16 could be due to the frequent variability inherent in field condition experiments, making plants to be slightly less advanced in terms of the growth stage. This parcel belonged to a field experiment on cover crops for vineyard management and the experts reported less plant emergencies and growth than expected. These circumstances could have caused the cover crop plants to be reduced in size and also smaller than objects created by the segmentation process, thus forming mixed objects of cover green and bare soil or bermudagrass, and leading to misclassifications. Moreover, the manual delineation of these tiny plants might have been slightly imprecise and not fully concordant with the actual data. Accordingly, this issue could be solved by employing a lower segmentation scale parameter in the MRS algorithm, so that smaller objects fitted to the borders of those tiny cover green plants are generated. The scale parameter controls the final object size by limiting its heterogeneity, more strongly affecting the segmentation outputs than the remaining MRS settings, and also the classification accuracy [78,82]. However, the scale parameter also has strong implications in terms of time and computational cost. The lower the scale, the longer the time involved in the process. Moreover, a lower scale means adapting the OBIA algorithm to this special field situation and reducing the algorithm robustness. Consequently, a good solution might be to wait for the green cover plants to be slightly more advanced in growth and become larger, and before C. dactylon reaches the vegetative stage, to avoid spectral similarity. Taking images rapidly and at the optimum time is crucial for accurate bermudagrass detection whithin cover crops, which is only feasible using UAV platforms due to their flexibility of flight scheduling and fast acquisition.
A very high level of accuracy was reached in C. dactylon UA, with values higher than 98% for both validation parcels (Table 5). These results indicated that classified C. dactylon objects actually represented the category on the ground with very a high probability, according to [72]. Furthermore, complementarily to UA, very low values of commission error in the C. dactylon classification were achieved, showing the proportion of bare soil and cover crop misclassified as C. dactylon, which was lower than 2.0% in both maps. This means that the overclassification rate was less than 2.0 % in both parcels. Based on these results, if the C. dactylon maps would be used for herbicide application in the context of PV strategies, only 17.4% of the surface would require treatment in the case of A-16, thus leaving the remaining 82.6% without any treatment, as it was composed of cover crops and bare soil. Similarly, the area to treat would be 41.4% for B-16 and the herbicide-free surface would consist of 58.6%. Moreover, the use of bermudagrass maps would allow farmers to keep cover crop-based farming systems and their great benefits to the vineyard, as well as herbicide treatment with minimal overapplication (<2.0%), therefore complying with the European legal framework. In addition to these aforementioned benefits, these maps could also optimize fuel, the field operating time, and costs. Similarly, [22] reported large potential savings from site-specific C. dactylon maps using UAV imagery in the context of an OBIA approach. However, they conducted the experiment in an organic vineyard consisting of tilled soils in the inter-rows, i.e., without cover crops, and in early summer, when C. dactylon patches infesting the inter-row were at the vegetative growth stage, showing a green color. Therefore, the vineyard scenario was not as complex as the one herein studied, where four classes with high spectral similarity were discriminated. In addition, the time at which they performed the experiment would not treatments to be carried out at the optimal moment, so those maps should be used in the subsequent years and farmers would assume the risk of allowing C. dactylon to grow in the vineyards. Therefore, our experiments are considered an advanced step in controlling this complicated weed at the right time.
The full process, consisting of acquiring and mosaicking UAV images and running the OBIA algorithm, took less than 48 hours. The high procedure speed would allow farmers to use the C. dactylon map in the critical period for control, i.e., in the herbicide application window, which is crucial for weed control efficiency. The application window corresponds to the bermudagrass regrowth period, usually soon after the convenient time for C. dactylon detection, as explained above. Delaying the herbicide application may reduce the herbicide effectiveness [83] and thus, C. dactylon control.
In general, the DT-OBIA algorithm automatically and accurately mapped the four classes in the vineyard, i.e., vines, bare soil, cover crop, and C. dactylon. First, the use of DSM-based spatial information for vine identification, and then, the VIs selected by the DT model, were employed to classify C. dactylon, cover crop, and bare soil. These results therefore confirmed the suitable feature selection by DT models in the previous machine learning analysis. The classified map showed the position and surface value of every plant in the vineyard, including cover crops. Therefore, these maps may have multiple applications for PV purposes, for example, to plan cover management strategies in accordance with the covered surface, density, or plant height, as well as to define site-specific vine management according to plant size, gaps, or spectral information-based health status. In addition, the Otsu method has been implemented in the developed OBIA algorithm, which is able to automatically estimate the optimal threshold value that sets the breakpoint between classes for the vegetation indices. Therefore, this OBIA algorithm overcomes the problem of DTs assuming hard boundaries among land-cover classes [60], as it automatically selects a threshold based on imagery data and following a stable rule set, thus allowing an unsupervised classification [78].
The combination of UAV imagery and the DT-OBIA algorithm enables the automatic, accurate, and timely mapping of C. dactylon within cover crops in vineyards, considering the variety of situations and years evaluated in this study.
This is feasible due the high overlap and spatial resolution of UAV-imagery to create 3D models; the flexibility of flight scheduling to take images at a convenient time for bermudagrass detection, i.e., when it is at a latency stage and cover crops are in the vegetative stage; and the high analysis capacity of the OBIA techniques to overcome spectral similarity issues. Using this technological combination could help farmers to control C. dactylon infesting cover crops and increase the vineyard profitability, as one of the large benefits of maintaining cover crops in the inter-row, as well as a more efficient use of herbicides due to the very low rate of over-application, reducing potential environmental impacts. These PV practices comply with the decision making to European Union’s (EU) Directives included in the Common Agricultural Policy. More specifically, PV strategies are part of the agronomical basis of the current regulatory framework governing the Sustainable Use of Plant Protection Products (Directive 2009/128/EC), and the European Horizon2020 Research and Innovation programme, which concern agricultural digitization and input use that fosters the development of alternative strategies that limit or eliminate its usage.

4. Conclusions

As part of an overall research program to implement ICM systems in vineyards, a novel, automatic, and robust UAV-based DT-OBIA algorithm has been developed for the quick and accurate mapping of bermudagrass infesting the cover crops in vineyards. The spectral similarity of this complex scenario composed of vines, cover crops, C. dactylon and bare soil was overcome by the implementation of height information from DSM and features selected in the machine learning analysis based on DT models in the OBIA algorithm.
The vines were correctly identified by the algorithm based on spatial information from the DSM, thus avoiding misclassification as cover crop or weeds due to the spectral similarity. The remaining classes were discriminated using the suitable features selected from the DT models. Finally, the algorithm automatically and accurately mapped the vines, cover crops, C. dactylon, and bare soil in the validation parcels for site-specific herbicide treatment.
Another interesting aspect of this research is the high speed of the full procedure of taking and analyzing UAV images that enables weed maps to be designed as quickly as two days after a farmer´s requests, meaning that it is timely for C. dactylon control in the herbicide application window. Therefore, the combination of UAV imagery and the DT-OBIA algorithm would allow farmers to control C. dactylon and thus maintain cover crop-based management systems and their consequent benefits in the vineyards. In addition, farmers would comply with the European legal framework for the implementation of ICM systems and the sustainable use of agricultural inputs, by just applying alternative strategies that limit their usage, and also reduce potential environmental impacts caused by over-application.

Author Contributions

A.I.d.C., J.M.P., J.R. and F.L.-G. conceived and designed the experiments; A.I.d.C., F.V.-G., J.T.-S. and F.M.J.-B. performed the experiments; A.I.d.C. analyzed the data; F.L.-G., J.M.P. and J.R. contributed with equipment and analysis tools; A.I.d.C. wrote the paper. F.L.-G. and J.R. collaborated in the discussion of the results and revised the manuscript. All authors have read and agreed to the published version of the manuscript.

Funding

This research was partly financed by the AGL2017-83325-C4-4R, AGL2017-83325-C4-2R, AGL2017-83325-C4-1R (Spanish Ministry of Science, Innovation and Universities and AEI/EU-FEDER funds) and the Intramural-CSIC projects (ref. 201840E002). Research of de Castro and F. Valencia-Gredilla were supported by the Juan de la Cierva-Incorporación Program and University of Lleida, respectively.

Acknowledgments

The authors thank CODORNÍU S.A. for allowing developing the field work and the UAV flights in the Raimat farm.

Conflicts of Interest

The authors declare no conflict of interest. The founding sponsors had no role in the design of the study; in the collection, analyses, or interpretation of data; in the writing of the manuscript, and in the decision to publish the results.

References

  1. Tey, Y.S.; Brindal, M. Factors influencing the adoption of precision agricultural technologies: A review for policy implications. Precis. Agric. 2012, 13, 713–730. [Google Scholar] [CrossRef]
  2. Arnó, J.; Casasnovas, J.A.M.; Dasi, M.R.; Rosell, J.R. Review. Precision viticulture. Research topics, challenges and opportunities in site-specific vineyard management. Span. J. Agric. Res. 2009, 7, 779–790. [Google Scholar] [CrossRef] [Green Version]
  3. De Castro, A.I.; Torres-Sánchez, J.; Peña, J.M.; Jiménez-Brenes, F.M.; Csillik, O.; López-Granados, F. An Automatic Random Forest-OBIA Algorithm for Early Weed Mapping between and within Crop Rows Using UAV Imagery. Remote Sens. 2018, 10, 285. [Google Scholar] [CrossRef] [Green Version]
  4. Shi, Y.; Thomasson, J.A.; Murray, S.C.; Pugh, N.A.; Rooney, W.L.; Shafian, S.; Rajan, N.; Rouze, G.; Morgan, C.L.S.; Neely, H.L.; et al. Unmanned Aerial Vehicles for High-Throughput Phenotyping and Agronomic Research. PLoS ONE 2016, 11, e0159781. [Google Scholar] [CrossRef] [Green Version]
  5. Pádua, L.; Marques, P.; Hruška, J.; Adão, T.; Peres, E.; Morais, R.; Sousa, J.J. Multi-Temporal Vineyard Monitoring through UAV-Based RGB Imagery. Remote Sens. 2018, 10, 1907. [Google Scholar] [CrossRef] [Green Version]
  6. Peña, J.M.; Torres-Sánchez, J.; de Castro, A.I.; Kelly, M.; López-Granados, F. Weed Mapping in Early-Season Maize Fields Using Object-Based Analysis of Unmanned Aerial Vehicle (UAV) Images. PLoS ONE 2013, 8, e77151. [Google Scholar] [CrossRef] [Green Version]
  7. Nex, F.; Remondino, F. UAV for 3D mapping applications: A review. Appl. Geomat. 2014, 6, 1–15. [Google Scholar] [CrossRef]
  8. Poblete-Echeverría, C.; Olmedo, G.F.; Ingram, B.; Bardeen, M. Detection and Segmentation of Vine Canopy in Ultra-High Spatial Resolution RGB Imagery Obtained from Unmanned Aerial Vehicle (UAV): A Case Study in a Commercial Vineyard. Remote Sens. 2017, 9, 268. [Google Scholar] [CrossRef] [Green Version]
  9. De Castro, A.I.; Jiménez-Brenes, F.M.; Torres-Sánchez, J.; Peña, J.M.; Borra-Serrano, I.; López-Granados, F. 3-D Characterization of Vineyards Using a Novel UAV Imagery-Based OBIA Procedure for Precision Viticulture Applications. Remote Sens. 2018, 10, 584. [Google Scholar] [CrossRef] [Green Version]
  10. Weiss, M.; Baret, F. Using 3D Point Clouds Derived from UAV RGB Imagery to Describe Vineyard 3D Macro-Structure. Remote Sens. 2017, 9, 111. [Google Scholar] [CrossRef] [Green Version]
  11. Albetis, J.; Duthoit, S.; Guttler, F.; Jacquin, A.; Goulard, M.; Poilvé, H.; Féret, J.-B.; Dedieu, G. Detection of Flavescence dorée Grapevine Disease Using Unmanned Aerial Vehicle (UAV) Multispectral Imagery. Remote Sens. 2017, 9, 308. [Google Scholar] [CrossRef] [Green Version]
  12. del-Campo-Sanchez, A.; Ballesteros, R.; Hernandez-Lopez, D.; Ortega, J.F.; Moreno, M.A.; on behalf of Agroforestry and Cartography Precision Research Group. Quantifying the effect of Jacobiasca lybica pest on vineyards with UAVs by combining geometric and computer vision techniques. PLoS ONE 2019, 14, e0215521. [Google Scholar] [CrossRef] [Green Version]
  13. Di Gennaro, S.F.; Battiston, E.; Marco, S.D.; Facini, O.; Matese, A.; Nocentini, M.; Palliotti, A.; Mugnai, L. Unmanned Aerial Vehicle (UAV)-Based Remote Sensing to Monitor Grapevine Leaf Stripe Disease within a Vineyard Affected by Esca Complex. Available online: https://link.galegroup.com/apps/doc/A533409412/AONE?sid=lms (accessed on 4 December 2019).
  14. Rey-Caramés, C.; Diago, M.P.; Martín, M.P.; Lobo, A.; Tardaguila, J. Using RPAS Multi-Spectral Imagery to Characterise Vigour, Leaf Development, Yield Components and Berry Composition Variability within a Vineyard. Remote Sens. 2015, 7, 14458–14481. [Google Scholar] [CrossRef] [Green Version]
  15. Matese, A.; Di Gennaro, S.F.; Santesteban, L.G. Methods to compare the spatial variability of UAV-based spectral and geometric information with ground autocorrelated data. A case of study for precision viticulture. Comput. Electron. Agric. 2019, 162, 931–940. [Google Scholar] [CrossRef]
  16. Pádua, L.; Marques, P.; Adão, T.; Guimarães, N.; Sousa, A.; Peres, E.; Sousa, J.J. Vineyard Variability Analysis through UAV-Based Vigour Maps to Assess Climate Change Impacts. Agronomy 2019, 9, 581. [Google Scholar] [CrossRef] [Green Version]
  17. Torres-Sánchez, J.; Marín, D.; De Castro, A.I.; Oria, I.; Jiménez-Brenes, F.M.; Miranda, C.; Santesteban, L.G.; López-Granados, F. Assessment of vineyard trimming and leaf removal using UAV photogrammetry. In Precision Agriculture’19; Wageningen Academic Publishers: Wageningen, The Netherlands, 2019; pp. 187–192. ISBN 978-9-08-686337-2. [Google Scholar]
  18. Baluja, J.; Diago, M.P.; Balda, P.; Zorer, R.; Meggio, F.; Morales, F.; Tardaguila, J. Assessment of vineyard water status variability by thermal and multispectral imagery using an unmanned aerial vehicle (UAV). Irrig. Sci. 2012, 30, 511–522. [Google Scholar] [CrossRef]
  19. Romero, M.; Luo, Y.; Su, B.; Fuentes, S. Vineyard water status estimation using multispectral imagery from an UAV platform and machine learning algorithms for irrigation scheduling management. Comput. Electron. Agric. 2018, 147, 109–117. [Google Scholar] [CrossRef]
  20. Santesteban, L.G.; Di Gennaro, S.F.; Herrero-Langreo, A.; Miranda, C.; Royo, J.B.; Matese, A. High-resolution UAV-based thermal imaging to estimate the instantaneous and seasonal variability of plant water status within a vineyard. Agric. Water Manag. 2017, 183, 49–59. [Google Scholar] [CrossRef]
  21. Campos, J.; Llop, J.; Gallart, M.; García-Ruiz, F.; Gras, A.; Salcedo, R.; Gil, E. Development of canopy vigour maps using UAV for site-specific management during vineyard spraying process. Precis. Agric. 2019, 20, 1136–1156. [Google Scholar] [CrossRef] [Green Version]
  22. Jiménez-Brenes, F.M.; López-Granados, F.; Torres-Sánchez, J.; Peña, J.M.; Ramírez, P.; Castillejo-González, I.L.; De Castro, A.I. Automatic UAV-based detection of Cynodon dactylon for site-specific vineyard management. PLoS ONE 2019, 14, e0218132. [Google Scholar] [CrossRef]
  23. Gago, P.; Cabaleiro, C.; Garcia, J. Preliminary study of the effect of soil management systems on the adventitious flora of a vineyard in northwestern Spain. Crop Prot. 2007, 26, 584–591. [Google Scholar] [CrossRef]
  24. Valencia, F.; Civit, J.; Esteve, J.; Recasens, J. Cover-crop management to control Cynodon dactylon in vineyards: Balance between efficiency and sustainability. In Proceedings of the 7th International Weed Science Conference, Prague, Czech Republic, 19–25 June 2016. [Google Scholar]
  25. Baumgartner, K.; Steenwerth, K.L.; Veilleux, L. Cover-Crop Systems Affect Weed Communities in a California Vineyard. Weed Sci. 2008, 56, 596–605. [Google Scholar] [CrossRef]
  26. Ingels, C.A.; Bugg, R.L.; McGourty, G.T.; Christensen, L.P. Cover Cropping in Vineyards: A Grower’s Handbook; University of California Cooperative Extension Amador County; Amador County Publication: Amador County, CA, USA, 1998. [Google Scholar]
  27. Hartwig, N.L.; Ammon, H.U. Cover crops and living mulches. Weed Sci. 2002, 50, 688–699. [Google Scholar] [CrossRef]
  28. Ripoche, A.; Metay, A.; Celette, F.; Gary, C. Changing the soil surface management in vineyards: Immediate and delayed effects on the growth and yield of grapevine. Plant Soil 2011, 339, 259–271. [Google Scholar] [CrossRef]
  29. Gómez, J.A.; Llewellyn, C.; Basch, G.; Sutton, P.B.; Dyson, J.S.; Jones, C.A. The effects of cover crops and conventional tillage on soil and runoff loss in vineyards and olive groves in several Mediterranean countries. Soil Use Manag. 2011, 27, 502–514. [Google Scholar] [CrossRef] [Green Version]
  30. Clark, A. Managing Cover Crops Profitably, Third Edition. Handbook Series Book 9; The Sustainable Agriculture Research and Education (SARE) Program; United Book Press, Inc.: Gwynn Oak, MD, USA, 2012. [Google Scholar]
  31. Recasens, J.; Cabrera, C.; Valencia, F.; de Castro, A.I.; Royo-Esnal, A.; Torres-Sánchez, J.; Civit, J.; Jiménez-Brenes, J.M.; López-Granados, F. Manejo, dinámica espacio-temporal y detección aérea de rodales de Cynodon dactylon en viñedos con cubierta vegetal. In Proceedings of the XVII Actas Congreso de la Sociedad Española de Malherbología, Vigo, Spain, 8–10 October 2019; pp. 231–236. [Google Scholar]
  32. Holm, L.R.G.; Plucknett, D.L.; Pancho, J.V.; Herberger, J.P. The World’s Worst Weeds. Distribution and Biology. Available online: https://www.cabi.org/isc/abstract/19776719958 (accessed on 31 October 2019).
  33. FAO Plant Production and Protection Division: Cynodon Dactylon. Available online: http://www.fao.org/agriculture/crops/thematic-sitemap/theme/biodiversity/weeds/listweeds/cyn-dac/en/ (accessed on 31 October 2019).
  34. Fontenot, D.P.; Griffin, J.L.; Bauerle, M.J. Bermudagrass (Cynodon dactylon) competition with sugarcane at planting. J. Am. Soc. Sugar Cane Technol. 2016, 36, 19–30. [Google Scholar]
  35. Judge, C.A.; Neal, J.C.; Derr, J.F. Response of Japanese Stiltgrass (Microstegium vimineum) to Application Timing, Rate, and Frequency of Postemergence Herbicides. Weed Technol. 2005, 19, 912–917. [Google Scholar] [CrossRef]
  36. Blaschke, T.; Hay, G.J.; Kelly, M.; Lang, S.; Hofmann, P.; Addink, E.; Queiroz-Feitosa, R.; van der Meer, F.; van der Werff, H.; van Coillie, F.; et al. Geographic Object-Based Image Analysis—Towards a new paradigm. ISPRS J. Photogramm. Remote Sens. 2014, 87, 180–191. [Google Scholar] [CrossRef] [Green Version]
  37. López-Granados, F.; Torres-Sánchez, J.; Serrano-Pérez, A.; de Castro, A.I.; Mesas-Carrascosa, F.-J.; Peña, J.-M. Early season weed mapping in sunflower using UAV technology: Variability of herbicide treatment maps against weed thresholds. Precis. Agric. 2016, 17, 183–199. [Google Scholar] [CrossRef]
  38. Torres-Sánchez, J.; López-Granados, F.; Serrano, N.; Arquero, O.; Peña, J.M. High-Throughput 3-D Monitoring of Agricultural-Tree Plantations with Unmanned Aerial Vehicle (UAV) Technology. PLoS ONE 2015, 10, e0130479. [Google Scholar] [CrossRef] [Green Version]
  39. De Castro, A.I.; Rallo, P.; Suárez, M.P.; Torres-Sánchez, J.; Casanova, L.; Jiménez-Brenes, F.M.; Morales-Sillero, A.; Jiménez, M.R.; López-Granados, F. High-Throughput System for the Early Quantification of Major Architectural Traits in Olive Breeding Trials Using UAV Images and OBIA Techniques. Front. Plant Sci. 2019, 10, 1472. [Google Scholar] [CrossRef] [PubMed] [Green Version]
  40. Yurtseven, H.; Akgul, M.; Coban, S.; Gulci, S. Determination and accuracy analysis of individual tree crown parameters using UAV based imagery and OBIA techniques. Measurement 2019, 145, 651–664. [Google Scholar] [CrossRef]
  41. Komárek, J.; Klouček, T.; Prošek, J. The potential of Unmanned Aerial Systems: A tool towards precision classification of hard-to-distinguish vegetation types? Int. J. Appl. Earth Obs. Geoinf. 2018, 71, 9–19. [Google Scholar] [CrossRef]
  42. Ostos-Garrido, F.J.; de Castro, A.I.; Torres-Sánchez, J.; Pistón, F.; Peña, J.M. High-Throughput Phenotyping of Bioethanol Potential in Cereals Using UAV-Based Multi-Spectral Imagery. Front. Plant Sci. 2019, 10, 948. [Google Scholar] [CrossRef] [Green Version]
  43. Koh, J.C.O.; Hayden, M.; Daetwyler, H.; Kant, S. Estimation of crop plant density at early mixed growth stages using UAV imagery. Plant Methods 2019, 15, 64. [Google Scholar] [CrossRef]
  44. Gao, J.; Liao, W.; Nuyttens, D.; Lootens, P.; Vangeyte, J.; Pižurica, A.; He, Y.; Pieters, J.G. Fusion of pixel and object-based features for weed mapping using unmanned aerial vehicle imagery. Int. J. Appl. Earth Obs. Geoinf. 2018, 67, 43–53. [Google Scholar] [CrossRef]
  45. Peña, J.M.; Torres-Sánchez, J.; Serrano-Pérez, A.; de Castro, A.I.; López-Granados, F. Quantifying Efficacy and Limits of Unmanned Aerial Vehicle (UAV) Technology for Weed Seedling Detection as Affected by Sensor Resolution. Sensors 2015, 15, 5609–5626. [Google Scholar] [CrossRef] [Green Version]
  46. López-Granados, F.; Torres-Sánchez, J.; de Castro, A.I.; Serrano-Pérez, A.; Mesas-Carrascosa, F.J.; Peña, J.M. Object-based early monitoring of a grass weed in a grass crop using high resolution UAV imagery. Agron. Sustain. Dev. 2016, 36, 67. [Google Scholar] [CrossRef]
  47. Blaschke, T. Object based image analysis for remote sensing. ISPRS J. Photogramm. Remote Sens. 2010, 65, 2–16. [Google Scholar] [CrossRef] [Green Version]
  48. Ma, L.; Fu, T.; Blaschke, T.; Li, M.; Tiede, D.; Zhou, Z.; Ma, X.; Chen, D. Evaluation of Feature Selection Methods for Object-Based Land Cover Mapping of Unmanned Aerial Vehicle Imagery Using Random Forest and Support Vector Machine Classifiers. ISPRS Int. J. Geo-Inf. 2017, 6, 51. [Google Scholar] [CrossRef]
  49. Pérez-Ortiz, M.; Peña, J.M.; Gutiérrez, P.A.; Torres-Sánchez, J.; Hervás-Martínez, C.; López-Granados, F. Selecting patterns and features for between- and within- crop-row weed mapping using UAV-imagery. Expert Syst. Appl. 2016, 47, 85–94. [Google Scholar] [CrossRef] [Green Version]
  50. Hung, C.; Xu, Z.; Sukkarieh, S. Feature Learning Based Approach for Weed Classification Using High Resolution Aerial Images from a Digital Camera Mounted on a UAV. Remote Sens. 2014, 6, 12037–12054. [Google Scholar] [CrossRef] [Green Version]
  51. Hamedianfar, A.; Shafri, H.Z.M. Integrated approach using data mining-based decision tree and object-based image analysis for high-resolution urban mapping of WorldView-2 satellite sensor data. J. Appl. Remote Sens. 2016, 10, 025001. [Google Scholar] [CrossRef]
  52. Laliberte, A.S.; Browning, D.M.; Rango, A. A comparison of three feature selection methods for object-based classification of sub-decimeter resolution UltraCam-L imagery. Int. J. Appl. Earth Obs. Geoinf. 2012, 15, 70–78. [Google Scholar] [CrossRef]
  53. De Castro, A.I.; Ehsani, R.; Ploetz, R.; Crane, J.H.; Abdulridha, J. Optimum spectral and geometric parameters for early detection of laurel wilt disease in avocado. Remote Sens. Environ. 2015, 171, 33–44. [Google Scholar] [CrossRef]
  54. Lu, J.; Ehsani, R.; Shi, Y.; Abdulridha, J.; de Castro, A.I.; Xu, Y. Field detection of anthracnose crown rot in strawberry using spectroscopy technology. Comput. Electron. Agric. 2017, 135, 289–299. [Google Scholar] [CrossRef]
  55. Lu, J.; Ehsani, R.; Shi, Y.; De Castro, A.I.; Wang, S. Detection of multi-tomato leaf diseases (late blight target and bacterial spots) in different stages by using a spectral-based sensor. Sci. Rep. 2018, 8, 2793. [Google Scholar] [CrossRef] [Green Version]
  56. Wang, Y.Y.; Li, J. Feature-selection ability of the decision-tree algorithm and the impact of feature-selection/extraction on decision-tree results based on hyperspectral data. Int. J. Remote Sens. 2008, 29, 2993–3010. [Google Scholar] [CrossRef]
  57. Peña-Barragán, J.M.; Ngugi, M.K.; Plant, R.E.; Six, J. Object-based crop identification using multiple vegetation indices, textural features and crop phenology. Remote Sens. Environ. 2011, 115, 1301–1316. [Google Scholar] [CrossRef]
  58. Vieira, M.A.; Formaggio, A.R.; Rennó, C.D.; Atzberger, C.; Aguiar, D.A.; Mello, M.P. Object Based Image Analysis and Data Mining applied to a remotely sensed Landsat time-series to map sugarcane over large areas. Remote Sens. Environ. 2012, 123, 553–562. [Google Scholar] [CrossRef]
  59. Laliberte, A.S.; Rango, A. Texture and Scale in Object-Based Analysis of Subdecimeter Resolution Unmanned Aerial Vehicle (UAV) Imagery. IEEE Trans. Geosci. Remote Sens. 2009, 47, 761–770. [Google Scholar] [CrossRef] [Green Version]
  60. Kalantar, B.; Mansor, S.B.; Sameen, M.I.; Pradhan, B.; Shafri, H.Z.M. Drone-based land-cover mapping using a fuzzy unordered rule induction algorithm integrated into object-based image analysis. Int. J. Remote Sens. 2017, 38, 2535–2556. [Google Scholar] [CrossRef]
  61. Sarron, J.; Malézieux, É.; Sané, C.A.B.; Faye, É. Mango Yield Mapping at the Orchard Scale Based on Tree Structure and Land Cover Assessed by UAV. Remote Sens. 2018, 10, 1900. [Google Scholar] [CrossRef] [Green Version]
  62. Torres-Sánchez, J.; López-Granados, F.; Borra-Serrano, I.; Peña, J.M. Assessing UAV-collected image overlap influence on computation time and digital surface model accuracy in olive orchards. Precis. Agric 2018, 19, 115–133. [Google Scholar] [CrossRef]
  63. McCoy, R.M. Field Methods in Remote Sensing; Canadian Geographer/Le Géographe Canadien; The Guilford Press: New York, NY, USA, 2005. [Google Scholar]
  64. Peña, J.M.; Gutiérrez, P.A.; Hervás-Martínez, C.; Six, J.; Plant, R.E.; López-Granados, F. Object-Based Image Classification of Summer Crops with Machine Learning Methods. Remote Sens. 2014, 6, 5019–5041. [Google Scholar] [CrossRef] [Green Version]
  65. Dorigo, W.; Lucieer, A.; Podobnikar, T.; Čarni, A. Mapping invasive Fallopia japonica by combined spectral, spatial, and temporal analysis of digital orthophotos. Int. J. Appl. Earth Obs. Geoinf. 2012, 19, 185–195. [Google Scholar] [CrossRef]
  66. De Castro, A.I.; Ehsani, R.; Ploetz, R.C.; Crane, J.H.; Buchanon, S. Detection of Laurel Wilt Disease in Avocado Using Low Altitude Aerial Imaging. PLoS ONE 2015, 10, e0124642. [Google Scholar] [CrossRef]
  67. eCognition Developer 9.2 User Guide; Trimble Geospatial: Munich, Germany, 2017.
  68. Girolamo-Neto, C.D.; Sanches, I.D.; Neves, A.K.; Prudente, V.H.R.; Körting, T.S.; Picoli, M.C.A.; De Aragão, L.E.O.e.C. Assessment of Texture Features for Bermudagrass (Cynodon dactylon) Detection in Sugarcane Plantations. Drones 2019, 3, 36. [Google Scholar] [CrossRef] [Green Version]
  69. Baraldi, A.; Parmiggiani, F. An investigation of the textural characteristics associated with gray level cooccurrence matrix statistical parameters. IEEE Trans. Geosci. Remote Sens. 1995, 33, 293–304. [Google Scholar] [CrossRef]
  70. Haralick, R.M.; Shanmugam, K.; Dinstein, I. Textural Features for Image Classification. IEEE Trans. Syst. Man Cybern. 1973, 3, 610–621. [Google Scholar] [CrossRef] [Green Version]
  71. Özdemir, T.; Eyduran, E. Comparison of Chi-Square and Likelihood Ratio Chi-Square Tests: Power of Test. J. Appl. Sci. Res. 2005, 1, 242–244. [Google Scholar]
  72. Rogan, J.; Franklin, J.; Roberts, D.A. A comparison of methods for monitoring multitemporal vegetation change using Thematic Mapper imagery. Remote Sens. Environ. 2002, 80, 143–156. [Google Scholar] [CrossRef]
  73. Whiteside, T.G.; Maier, S.W.; Boggs, G.S. Area-based and location-based validation of classified image objects. Int. J. Appl. Earth Obs. Geoinf. 2014, 28, 117–130. [Google Scholar] [CrossRef]
  74. Guijarro, M.; Pajares, G.; Riomoros, I.; Herrera, P.J.; Burgos-Artizzu, X.P.; Ribeiro, A. Automatic segmentation of relevant textures in agricultural images. Comput. Electron. Agric. 2011, 75, 75–83. [Google Scholar] [CrossRef] [Green Version]
  75. Swets, J.A. Measuring the accuracy of diagnostic systems. Science 1988, 240, 1285–1293. [Google Scholar] [CrossRef] [Green Version]
  76. Hall-Beyer, M. Practical guidelines for choosing GLCM textures to use in landscape classification tasks over a range of moderate spatial scales. Int. J. Remote Sens. 2017, 38, 1312–1338. [Google Scholar] [CrossRef]
  77. Otsu, N. A Threshold Selection Method from Gray-Level Histograms. IEEE Trans. Syst. Man Cybern. 1979, 9, 62–66. [Google Scholar] [CrossRef] [Green Version]
  78. Torres-Sánchez, J.; López-Granados, F.; Peña, J.M. An automatic object-based method for optimal thresholding in UAV images: Application for vegetation detection in herbaceous crops. Comput. Electron. Agric. 2015, 114, 43–52. [Google Scholar] [CrossRef]
  79. Thomlinson, J.R.; Bolstad, P.V.; Cohen, W.B. Coordinating methodologies for scaling landcover classifications from site-specific to global: Steps toward validating global map products. Remote Sens. Environ. 1999, 70, 16–28. [Google Scholar] [CrossRef]
  80. Yu, Q.; Gong, P.; Clinton, N.; Biging, G.; kelly, M.; Schirokauer, D. Object-based detailed vegetation classification with airborne high spatial resolution remote sensing imagery. Photogramm. Eng. Remote Sens. 2006, 72, 799–811. [Google Scholar] [CrossRef] [Green Version]
  81. De Castro, A.I.; López Granados, F.; Jurado-Expósito, M. Broad-scale cruciferous weed patch classification in winter wheat using QuickBird imagery for in-season site-specific control. Precis. Agric. 2013, 14, 392–413. [Google Scholar] [CrossRef] [Green Version]
  82. Moffett, K.B.; Gorelick, S.M. Distinguishing wetland vegetation and channel features with object-based image segmentation. Int. J. Remote Sens. 2012, 34, 1332–1354. [Google Scholar] [CrossRef]
  83. Chauhan, B.S.; Singh, R.G.; Mahajan, G. Ecology and management of weeds under conservation agriculture: A review. Crop Prot. 2012, 38, 57–65. [Google Scholar] [CrossRef]
Figure 1. General view of the four studied vineyard parcels: (a) B-16; (b) C-16; (c) A-16; (d) C-17. Circles shown in a red color represent Cynodon dactylon patches.
Remotesensing 12 00056 g001
Figure 2. (a) A partial view of the 3-D point cloud for the vineyard C-16 produced by the photogrammetric processing of the Unmanned Aerial Vehicle (UAV) images; (b) The corresponding orthomosaic.
Remotesensing 12 00056 g002aRemotesensing 12 00056 g002b
Figure 3. Field work images depicting (a) 1 × 1 m frame used in the ground-truth sampling covering Cynodon dactylon patches and cover crop plants in parcel C-16; (b) acquisition of Global Positioning System (GPS) coordinates and on-ground pictures of sampling frames in parcel B-16.
Remotesensing 12 00056 g003
Figure 4. Detail of a sampling frame of the A-16 vineyard: (a) on-ground picture; (b) manually classified frame where each color represents a studied class (grey-bare soil; yellow-C. dactylon and grey-cover crop).
Remotesensing 12 00056 g004
Figure 5. Decision tree scheme for feature selection and mapping of C. dactylon infesting the cover crops in vineyards. ExR: Excess red; VEG: Vegetative index.
Remotesensing 12 00056 g005
Figure 6. Flowchart of the object-based image analysis (OBIA) procedure for Cynodon dactylon classification in vineyards under a cover crops system.
Remotesensing 12 00056 g006
Figure 7. Classified maps developed by the OBIA algorithm for each validation parcel: (a) B-16 and (b) A-16.
Remotesensing 12 00056 g007
Table 1. Characteristics of the Study Vineyards.
FieldArea (m2)Plantation Vine YearCover Crop SpeciesFlight DatePurpose of Data
C-1636611988Hordeum vulgare1st February 2016Algorithm Training (Feature selection)
C-1739881988Hordeum vulgare24th January 2017Algorithm Training (Feature selection)
A-1626632015Festuca arundinacea1st February 2016Algorithm Validation
B-1638632015Hordeum vulgare1st February 2016Algorithm Validation
Vulpia ciliata
Bromus rubens
Bromus hordeaceus
Festuca arundinacea
Medicago rugosa
Table 2. Spectral and textural features performed in this research.
CategoryNameEquation aAdapted from
Object Spectral
Mean 1 # P O b j ( x , y ) P O b j c K ( x , y ) ---
SD 1 # P O b j ( x , y ) P O b j ( c K ( x , y ) 1 # P O b j ( x , y ) P O b j c K ( x , y ) ) 2 ---
ModeMost common value
Vegetation indices
Excess green E x G = 2 G R B [51]
Excess red E x R = 1.4 R G [52]
Excess green minus excess red E x G R = E x G 1.4 R G [53]
R-G R G [54]
Color index of vegetation C I V E = 0.441 R 0.811 G + 0.385 B + 18.78745 [55]
Green vegetation index VIgreen = G R G + R [56]
Vegetative V E G = G R a B ( 1 a ) [57]
Combination 1 C O M B   1 = 0.25 E x G + 0.3 E x G R + 0.33 C I V E + 0.12   V E G [58]
Textural features
GLCM Homogeneity G L C M   H o m = i , j = 0 N 1 P i , j 1 + ( i j ) 2 After [50]
GLCM Contrast G L C M   C o n t = i , j = 0 N 1 P i , j ( i j ) 2 After [50]
GLCM Dissimilarity G L C M   D i s s = i , j = 0 N 1 P i , j / i j / After [50]
GLCM Entropy G L C M   E n t = i , j = 0 N 1 P i , j ( lnP i , j ) After [50]
GLCM Ang. 2nd moment G L C M   A S M = i , j = 0 N 1 ( P i , j ) 2 After [50]
GLCM StdDev G L C M   S D = i , j = 0 N 1 P i , j ( i , j μ i , j ) After [50]
GLCM Correlation G L C M   C o r r = [ ( i , μ i ) ( j μ j ) ( σ i 2 ) ( σ i 2 ) ] After [50]
a Parameters: PObj = {(x, y):(x, y)∈Obj}; set of pixels of an image object. #PObj = total number of pixels contained in PObj. Ck(x, y) = image layer value at pixel (x, y); where (x, y) are pixel coordinates. R, G, B, represent object mean Red, Green and Blue value for all pixels forming the object. i = the row number of the co-occurrence matrix. j = the column number of the co-occurrence matrix. Pi,j = the normalized value in the cell i,j; P i , j = V i , j i , j = 0 N 1 V i , j where, Vi,j = the value in the cell i,j of the co-occurrence matrix. N = the number of rows or columns of the co-occurrence matrix. a = 0:667 as in its reference.
Table 3. Features contribution to the decision tree (DT) model.
Parcela C-16Parcela C-17
Fatures selected% G2% G2
ExR5992
VEG418
% G2: Contribution (%) to the total Likelihood-ratio chi-square statistic (G2) for the DT model.
Table 4. Accuracy results obtained by DT for Object-based Identification in the training Parcels.
VineyardAccuracy Statistics
GA * (%)CCCR (%)Area under the ROC CurveRMSE
C-1797.696.6BS: 0.98
CD: 0.98
CC: 0.95
0.16
C-1698.498.0BS: 0.99
CD: 0.99
CC: 0.99
0.12
* GA: Global Accuracy; CCCR: Correct Classification Cynodon dactylon Rate, ROC: Receiver Operating Characteristic (ROC); RMSE: root mean square error. BS: bare soil; CD: Cynodon dactylon; CC: cover crop.
Table 5. Classification statistics obtained in the confusion matrix for both validation parcels.
VineyardAccuracy Statistics
OA * (%)C. dactylon UA (%)
A-1689.8298.00
B-1684.0398.50
* OA: overall accuracy (%); UA: user accuracy (%).

