


Introduction
The United States Antarctic Program (USAP) relies on aircraft operating between Christchurch, New Zealand, and McMurdo Station, Antarctica, to provide nearly all personnel support and a considerable amount of cargo transport to the continent. The first flights of the season land on a skiway at Williams Field in late-August using specialized LC-130 Hercules (ski-wheel). In October, the main contingent of personnel flies to McMurdo in wheeled C-130 Hercules, C-141 Starlifter and C-5 Galaxy aircraft operating off a runway of first-year sea ice. This runway is abandoned in mid-December due to strength deterioration.
Until the 1992–93 season, the USAP was limited solely to ski-equipped aircraft (LC-130 Hercules) for all of its needs from the time the sea-ice runway closed throughout the remainder of the season. To alleviate this bottleneck, the USAP began development of a runw ay suitable for conventional aircraft use during the latter part of the austral (Southern Hemisphere) summer. Engineering studies began in 1989 and culminated in 1993 in a wheeled runway on the Ross Ice Shelf near McMurdo, specifically for use during the period after the sea ice was no longer usable (Reference Blaisdell, Lang, Crist, Kurtii, Harbin and FloraBlaisdell and others, 1994). The runway, located at the Pegasus site, was demonstrated in 1993 using an LC-130 aircraft (operating on wheels) and by a conventional C-130 Hercules. During subsequent field seasons, the Pegasus runway has been used extensively for wheeled operations of LC-130 and C-130 planes, in addition to a successful C-141 flight test followed by many operational C-141 flights.
Since the Pegasus runway was developed as a feasibility study, attention was focused on the primary engineering of the runway (producing an even, level surface with a strength capable of supporting heavy wheeled aircraft) and little thought was given to long-term snow management. Many factors were important in selecting the position and orientation of the Pegasus runway. Since only one runway was planned, a single orientation was required. Given the existing wind patterns (Fig. 1), the runway alignment was selected to coincide with the direction of the strong or storm winds. The prevailing wind, generally low speed, is a cross-wind with respect to the runway. This selection was based strictly on aircraft operational needs; the ramifications of snow drifting and accumulation were not considered. Also, the Pegasus site was selected because of the ideal glaciological conditions, within a transition between snow-accumulation and snow-ablation zones (Reference Klokov, Diemand, Elliot and BlaisdellKlokov and Diemand, 1995). It was feared that changing the natural balance of snow accumulation in the area, due to construction activities, would perhaps lead to unstable drift development, causing premature loss of the facility. There was also concern for the cost, difficulties and labor-intensive effort required to return the site to its original “steady-state” condition. An additional aspect of snow management at the site is the need to allow some snow accumulation in order to supply the required protective snow cover (between 15 November and 10 January) to prevent melting of the ice surface (Reference Lang and BlaisdellLang and Blaisdell, 1996).

Fig. 1. Wind rose for the “Pegasus South” automated weather station (AWS) using monthly average data for the period 1 January 1993 to 31 December 1994.
The goal of this study was to determine whether an innovative passive snow-manipulation technique could be applied at the Pegasus site to (a) remove or reduce significantly the berms created during construction, and (b) to assist in managing or avoiding snowdrift problems in the future. Studies indicate that implementing passive snow-control treatments may cost up to 100 times less than active measures (Reference TablerTabler, 1991). Passive snow-control measures are typically implemented to facilitate snow deposition in a preferential manner. In the case of the Pegasus site, our goal was to find a passive control device that would allow selective increase in snow scour, thereby encouraging snow movement out of the area of the runway. This paper describes a successful attempt at configuring a full-scale vortex generator to locally erode recently deposited snow and relocate this snow to the ablation zone west of the berm area or north from the runway.
Passive Snow-Removal Experiments
Snow-control devices have been studied for some time and have been successfully used in field applications for roads (Reference Zhonglong and Yuan.Wang Zhonglong and Chen Yuan, 1980) and on and around buildings (Reference WilliamsWilliams, 1989). Jet roofs (sometimes called blower fences) are commonly used for localized snow removal in alpine terrain (Reference Montagne, McPartland, Super and TownesMontagne and others, 1968). However, the jet-roof design has minimal potential to be constructed to orient itself into the wind and thus avoid cross-wind deposition.
To the best of our knowledge, the only previous tests of vortex fences were small-scale similitude experiments conducted by Reference Meroney and MeroneyMeroney and Meroney (1989). However, the positive results of these small-scale tests were encouraging. By design, a vortex fence produces longitudinally aligned vortices on the lee side of the fence. These vortices can endure for long distances before dissipating. This phenomenon, the production of vortices by a delta wing, can be physically observed during the landing of the space shuttle (seen in longitudinal axis dust swirls trailing the spacecraft wing tips). By creating locally increased air velocities over snow surfaces, snow movement can be produced. It is required that the threshold velocity be exceeded, enabling localized motion of surface particles due to the near-surface vortex velocities. When this occurs, snow is entrained in the vortex flow and snow is removed directly under the vortices.
The vortex fence can be easily adapted to accommodate a rotating head so that the natural pressure gradient surrounding the fence will cause it to self-orient. We constructed a full-scale vortex fence (Fig. 2), whose dimensions were based on our initial small-scale field-test results with fixed-orientation vortex generators, and on the scale-model test results of Reference Meroney and MeroneyMeroney and Meroney (1989). The planform of the fence is the top view or largest surface of the wing. The chord x of the wing is the distance from the apex of the leading edge toward the trailing edge; the span b(x) is the dimension of the wing perpendicular to the chord (Fig. 2). The aspect ratio AR of the wing is defined by

where θ is the sweep-back angle, or the angle measured from the leading edge of the wing to a plane perpendicular to the wind velocity (Reference McCormickMcCormick, 1995) (Fig. 2). For our fence, θ was chosen to be 60° for ease of construction, giving the wing an aspect ratio of 2.31. Once a vortex is generated by a wing, it should tend to decay very gradually by both turbulent and viscous diffusion. Downstream, the cross-section of the vortex core increases, which in turn decreases the maximum tangential velocity V
t, Vortex circulation Γ along the vortex core is defined as the product of the vortex circumference and the tangential velocity
![]() .
.
where r is the radial measure of the vortex, as shown in Figure 3. The strength of the vortex is measured by the swirl angle ζ which is defined relative to the tangential velocity to the free-stream (wind) velocity V as,

If the vortex strength is too high, an instability known as vortex-bursting may occur. The critical factor for the design of this type of wing for snow removal is to define an optimal geometry where vortex bursting (break-down) occurs as far downstream from the wing as possible (Reference McCormick, Tangler and SherriebMcCormick and others, 1968; Reference McCormickMcCormick, 1995). This phenomenon is similar to the well-known “hydraulic jump” when channel flow transitions from supercritical to sub-critical, resulting in a considerable energy loss. Experimentally, it has been determined that, if the angle of attack α is increased in excess of approximately 22¶, the leading-edge vortices become strong enough to cause vortex-bursting over the wing itself (Reference McCormickMcCormick, 1995). (An illustration of this undesirable flow instability is depicted in the lower part of Figure 3.) However, there is an inordinate amount of scatter in the data, suggesting that the burst point is not a sharply defined location that can be calculated for known wing-shape parameters and wind velocity. Hence, no empirical relationship has been derived to approximate the burst point as a function of velocity and wing shape. By choosing
![]() (i.e. less than the approximation of 22¶ for bursting over the wing) for our specific application, this energy loss in the generated vortices appears to have been avoided.
(i.e. less than the approximation of 22¶ for bursting over the wing) for our specific application, this energy loss in the generated vortices appears to have been avoided.

Fig. 2. Dimensions of the full-scale vortex fence.
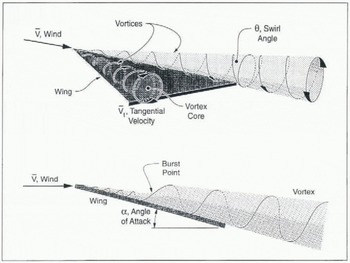
Fig. 3. Sketch of critical dimensions of vortex fence and vortex development.
The design of our fence also included a rotating head and, at the initiative of the fabricator, a fin on the lee side to assist in re-orientation. (The fin should not be necessary since the fence geometry will allow it to naturally orient into any wind direction.) The fence was constructed as a 2.7 m sided equilateral triangle (Fig. 2). Figure 4 is a photograph of the installed fence. Height above ground must also be a critical factor in vortex-fence performance; unfortunately, the small-scale tests of Reference Meroney and MeroneyMeroney and Meroney (1989) did not indicate an optimum height. Based on our experience, we recommend a fence height of less than twice the plan-form height (2.34 m for our design) of the wing. Our full-scale vortex fence was installed at a height of approximately 1.2 m from the snow surface.

Fig. 4. Photograph of the installed vortex generator at Pegasus runway.
A survey-target area for monitoring snow-surface changes was established around the fence (Fig. 5). A profile of the runway surface, berm areas and vortex-fence target area is depicted in Figure 6. It was expected that erosion would occur to the leeward side relative to both the storm wind and the prevailing wind. It was not expected that snow volumes would be reduced ill the windward areas of the fence (i.e. the fence could only affect snow loss on its leeward cone). The natural snow deposition-erosion pattern was not recorded since time was not available to establish a control survey area nearby. However, measurements from the outboard survey position at station 1 (virtually always upwind relative to the fence) should provide a “normal” reference point for the area. Stations 4 through 7 are the most desirable areas in which to move snow. The snow here was not well-sintered. Within the vortex-target area, the measured surface hardness (i.e. for the upper 10 cm of snow) ranged from 16 to 18 kg fand the densities ranged from 370–475 kg m−3. This snow should be removed from the immediate vicinity of the runway to avoid long-term build-up. Although this requires snow to be moved uphill over the west berm, if it could be done, the snow would be transported into the ablation area where it was likely to melt or evaporate.

Fig. 5. Survey-target area for the full-scale vortex fence.

Fig. 6. Berm profile and vortex-fence target area.
Erosion results for the full-scale vortex fence are encouraging (Table 1). As expected, accumulation during the austral autumn and into the winter (February through June) occurs at stations 1 and 2. Some accumulation is also seen at station 8, especially at the outermost post and minor accumulation is recorded at stations 6 and 7. We assume that the snow surface at the outermost survey point at station 1 is unaffected by the fence emplacement, since the vast majority of winds on site come from between 45¶ and 180¶ (true heading) so it is nearly always upwind of the fence (Fig. 1). Therefore, this survey point should represent a typical depositional pattern. If we also assume that the natural snow-deposition pattern in the entire target area can be represented by the results at outboard survey point at station 1, then it is possible to calculate the estimated net effect of the vortex fence on snow deposition in the area. This is shown in Table 2, where the total elevation change from Table 1 is modified to subtract the station 1 outboard survey-point elevations through time. This result indicates that the vortex fence had a positive effect (reduced snow accumulation) on the entire 1870 m2 target area except when approaching the outermost monitoring points at stations 2 and 8. At these stations, there are very slight increases in snow cover (Table 1; Fig. 7). That these two points show an increase is not surprising since they flank station 1 and are located in the quadrant from which we assume natural snow behav ior (i.e. no effect of the vortex fence). All other points within the target area show a significant loss (or reduced accumulation) over what would be the normal depositional pattern. It is interesting to compare the scour results (Fig. 7) with the wind diagram (derived from an AWS located less than 1 km away) for the same period (Fig. 8). As anticipated, there is a good correlation between the stations showing the most scour and the most frequent lee directions. More encouraging though is that, over time, scour is effective even in a direction that is leeward to the prevailing wind but windward to the storm wind (station 3). Net erosion also occurred at stations 6 and 7 that are leeward to the storm wind but windward of the prevailing wind.

Fig. 7. Perspective map of snow-surface elevation change between 7 February and 28 June 1995, relative to the outboard survey point at station 1 ( where no change in natural patterns was assumed). Outermost survey-target positions shown as solid diamonds.

Fig. 8. Wind rose for the “Pegasus South” automated weather station (AWS) using 10-minute readings for the period 8 February to 28 June 1995. The raw data were screened and 17% of the values werefound to be spurious and have been removed for this diagram. Compass orientation of survey-target positions shown as solid diamonds.
Table 1. Surveyed elevation changes at selected dates in 1995 at each station in the vortex fence target area.

Table 2. Surveyed elevation changes caused by vortex fence referenced to assumed natural deposition (at outermost survey point at Station 1) in the target area.

In our test, the average reduction in surface elevation within the target area was 0.17 m. Thus, within this 1870 m2 area, the fence (with a surface area of only 3.25 m2) was able to scour approximately 320 m3 of snow during a 5 month period. This suggests that vortex fences can be a very effective tool for scouring snow. Given the capability to deploy selectively or remove the vortex fence depending on prevailing winds and desired direction of snow scour, a vortex fence could be even more effective.
Conclusions
The vortices generated by a vortex fence do not seem to dissipate rapidly, providing effective, sustained erosion. A further advantage of the vortex-fence design is that it lends itself well to a rotating head, which allows the fence to be self-orienting into the wind.
It was shown that a full-scale vortex fence can produce local wind-velocity increases adequate for scouring significant areas of moderately bonded snow surfaces. These tests demonstrated significant snow scour (320 m3 during a 5 month period) over an 1870 m2 area using a relatively small vortex fence (surface area of 3.25 m2). In some cases, the vortices were able to move snow upslope.
The vortex fence was placed essentially as a permanent fixture. It is likely that even greater scour could be achieved by judicious deployment and removal of the fence as a function of periods of favorable winds. This would obviously require closer monitoring and the ability to retrieve efficiently and replace the fence depending on existing and forecast winds. This seems like a reasonable trade-off in the light of the potential for greatly increased erosion.
Our full-scale vortex-fence design and installation were based only on rough estimates of the optimum size, height, angle of attack and the extent of propagated longitudinal vortices. Mathematical models of wake turbulence exist and are used routinely in the aircraft industry; these models should be used to determine the most effective arrangement of a vortex fence to achieve snow scour. Further studies should include the determination of the most effective angle of attack and sweep-back angle for the fence, the optimum planform dimensions and height above the snow surface by measuring the velocity distribution leeward of the fence designs.
At the Pegasus site, the annual snow accumulation associated with natural drifting around the construction berms, and mechanically removed runway snow, can be managed with vortex fences. By optimizing the fence spacing based on wake-turbulence models, and employing them only during periods of favorable winds, runway maintenance personnel could elliciently and permanently remove large quantities of unwanted snow with minimal cost, effort and environ¬mental impact.
Acknowledgements
We are very grateful to J. Sale, who performed all of the surveying for this study, and to many other employees of Antarctic Support Associates (Englewood CO), who assisted in providing site data and in fabricating, installing and monitoring our fences. This work was sponsored by the U.S. National Science Foundation, Office of Polar Programs, Operations Section.


