Comparison of Same Carbon Chain Length Cationic and Anionic Surfactant Adsorption on Silica


1
Department of Hydraulic Engineering, Tsinghua University, Beijing 100084, China
2
CCTEG China Coal Research Institute, Beijing 100013, China
3
Laboratory of Soil Conservation, Research Faculty of Agriculture, Hokkaido University, Sapporo 060-8589, Japan
*
Author to whom correspondence should be addressed.
Colloids Interfaces 2020, 4(3), 34; https://doi.org/10.3390/colloids4030034
Submission received: 21 June 2020
/
Revised: 30 July 2020
/
Accepted: 10 August 2020
/
Published: 20 August 2020
Abstract
:Adsorption of a cationic surfactant dodecyl pyridinium chloride (DPC) on silica was studied to show a comparison with the adsorption of an anionic surfactant sodium dodecyl sulfate (SDS), whose carbon chain length is the same and on the same silica. Results provided a better understanding of the adsorption mechanism of cationic and anionic surfactant on negatively charged silica. The experiment covered different electrolyte concentrations and pH values. Results indicated that at the same pH, the DPC adsorption amounts are higher when the electrolyte concentration is higher; at a higher DPC equilibrium concentration, the adsorption amount difference is larger than that at low DPC equilibrium concentration, and when DPC equilibrium concentration is lower than 0.1 mmol/L, the adsorption amount difference cannot be observed. At charge compensation point (CCP, 0 zeta potential), the negative surface charge of silica was compensated by DP+, a continuous increasing zeta potential indicated a bilayer adsorption of DPC on silica. The adsorption amount increased with increasing pH. The calculated lines by Gu and Zhu model show a two-step property, including a bilayer and hemi-micelle adsorption. DPC adsorbed more strongly on silica than SDS due to the combination of electrostatic and hydrophobic attraction.
1. Introduction
Surfactant is a commonly used raw material in our life and industry. Based on its amphipathy, it can be adsorbed on the surface of clay minerals, polymers, sediments, humic acid and soil [1]. Silica is typically negatively charged and the most commonly seen mineral in the soil environment.
The fate of surfactant on the solid–liquid interface was studied in recent years [2,3], most reports among them were focused on the adsorption between the oppositely charged adsorbent and adsorbate whose interaction is electrostatic attraction [4,5,6,7,8,9], because of the relatively strong electrostatic repulsion between anionic species on anionic substrates, a few studies have focused on this theme. Nevskaia et al. [10] showed that only little amounts of anionic surfactants were adsorbed on a silica quartz and the amount increased with the increase in salt concentration. However, they only showed the surfactant adsorption at no NaCl addition and at 1 g NaCl/L; precise data for the influence of electrolyte were lacking and the pH influence were not observed. Huang et al. [11] and Somasundaran et al. [12] found that the silica gel could adsorb an anionic surfactant when it was mixed with a cationic surfactant, although the anionic surfactant could not be easily adsorbed on the silica surface directly. Ahmed and Ishiguro [13] indicated the impact of electric repulsive potential on adsorption of anionic surfactant on negatively charged humic soil. Ishiguro and Koopal [14] reviewed surfactant adsorption to soil components and soils, mainly about oppositely charged adsorbent and adsorbate, but the same negatively charged materials were also reviewed. Gao et al. [15] found that the Gemini C6 shows a stronger ability towards hydrophobic modification at a quartz surface than C3, demonstrating the contribution of the longer methylene spacer to the hydrophobic modification of the quartz surface. Atkin et al. [16] summarized the mechanism of cationic surfactant adsorption at the solid–aqueous interface systematically. Li and Ishiguro [17] originally conducted adsorption experiment of anionic surfactant sodium dodecyl sulfate (SDS) on negatively charged silica surface. They indicated that adsorption happened with hydrophobic interaction although electrostatic repulsion generated between SDS and silica surface by using 1-pK basic Stern model. However, it is noteworthy that although there is considerable adsorption amount of SDS on negatively charged silica, it is difficult to conclude that the adsorption interaction between same charged adsorbent and adsorbate is ubiquitous or stable without any comparison to other adsorbate under the same experimental conditions.
Therefore, in order to get an integrated knowledge about anionic surfactant adsorption on negatively charged porous silica, based on the research of Li and Ishiguro [17], the adsorption of cationic surfactant dodecyl pyridinium chloride (DPC) which has the same carbon chain length as SDS was shown in this article; the experiment conditions are also the same.
The adsorption of cationic surfactant, especially DPC, on negatively charged minerals such as silica and rutile, was reported in quantity. Goloub et al. [4] and Koopal et al. [18] systematically investigated cetyl pyridinium chloride (CPC) and DPC adsorption on silica surface, compared the experiments with theory, and clarified the effective of cationic surfactant adsorption on the wetting, colloid stability and flotation on silica. However, the silica used was fumed and non-porous, and hence has a small specific surface area (around 50 m2/g), Aerosil OX50, which is quite different from this study; therefore, by using the same silica (porous and surface area of 414 m2/g) with Li and Ishiguro [17], DPC adsorption was conducted and the result was compared with SDS.
2. Materials and Method
2.1. Surfactant
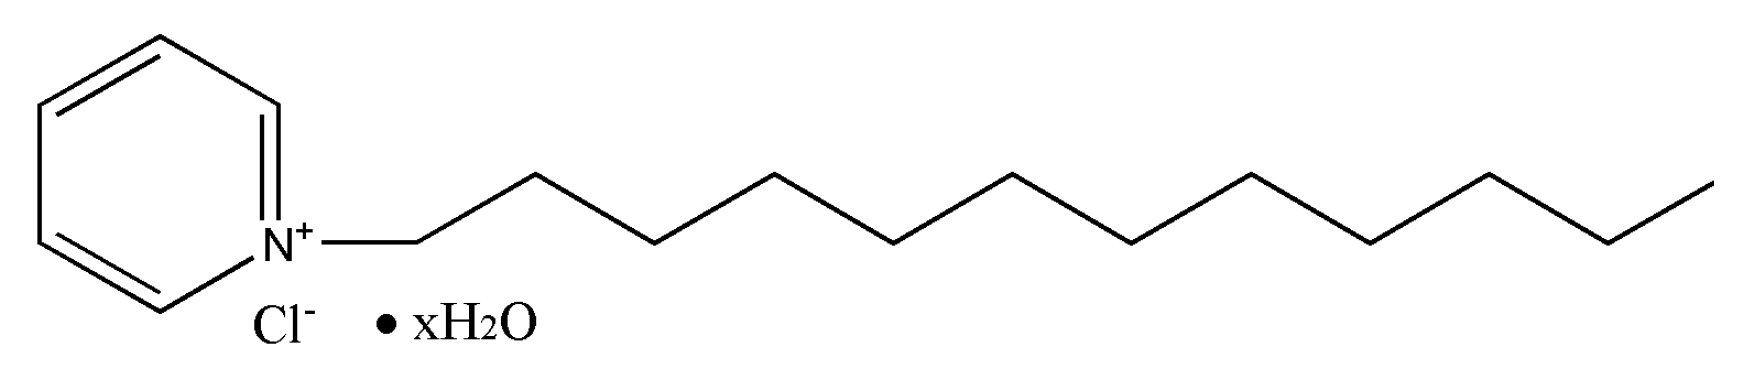
Cationic surfactant, dodecyl pyridinium chloride (DPC) with purity of >98% was purchased from Tokyo chemical industry Co., LTD, Japan. A structure of C17H33ClN (as Figure 1 shows) with a molecular weight of 238.88 g/mol.
2.2. Silica
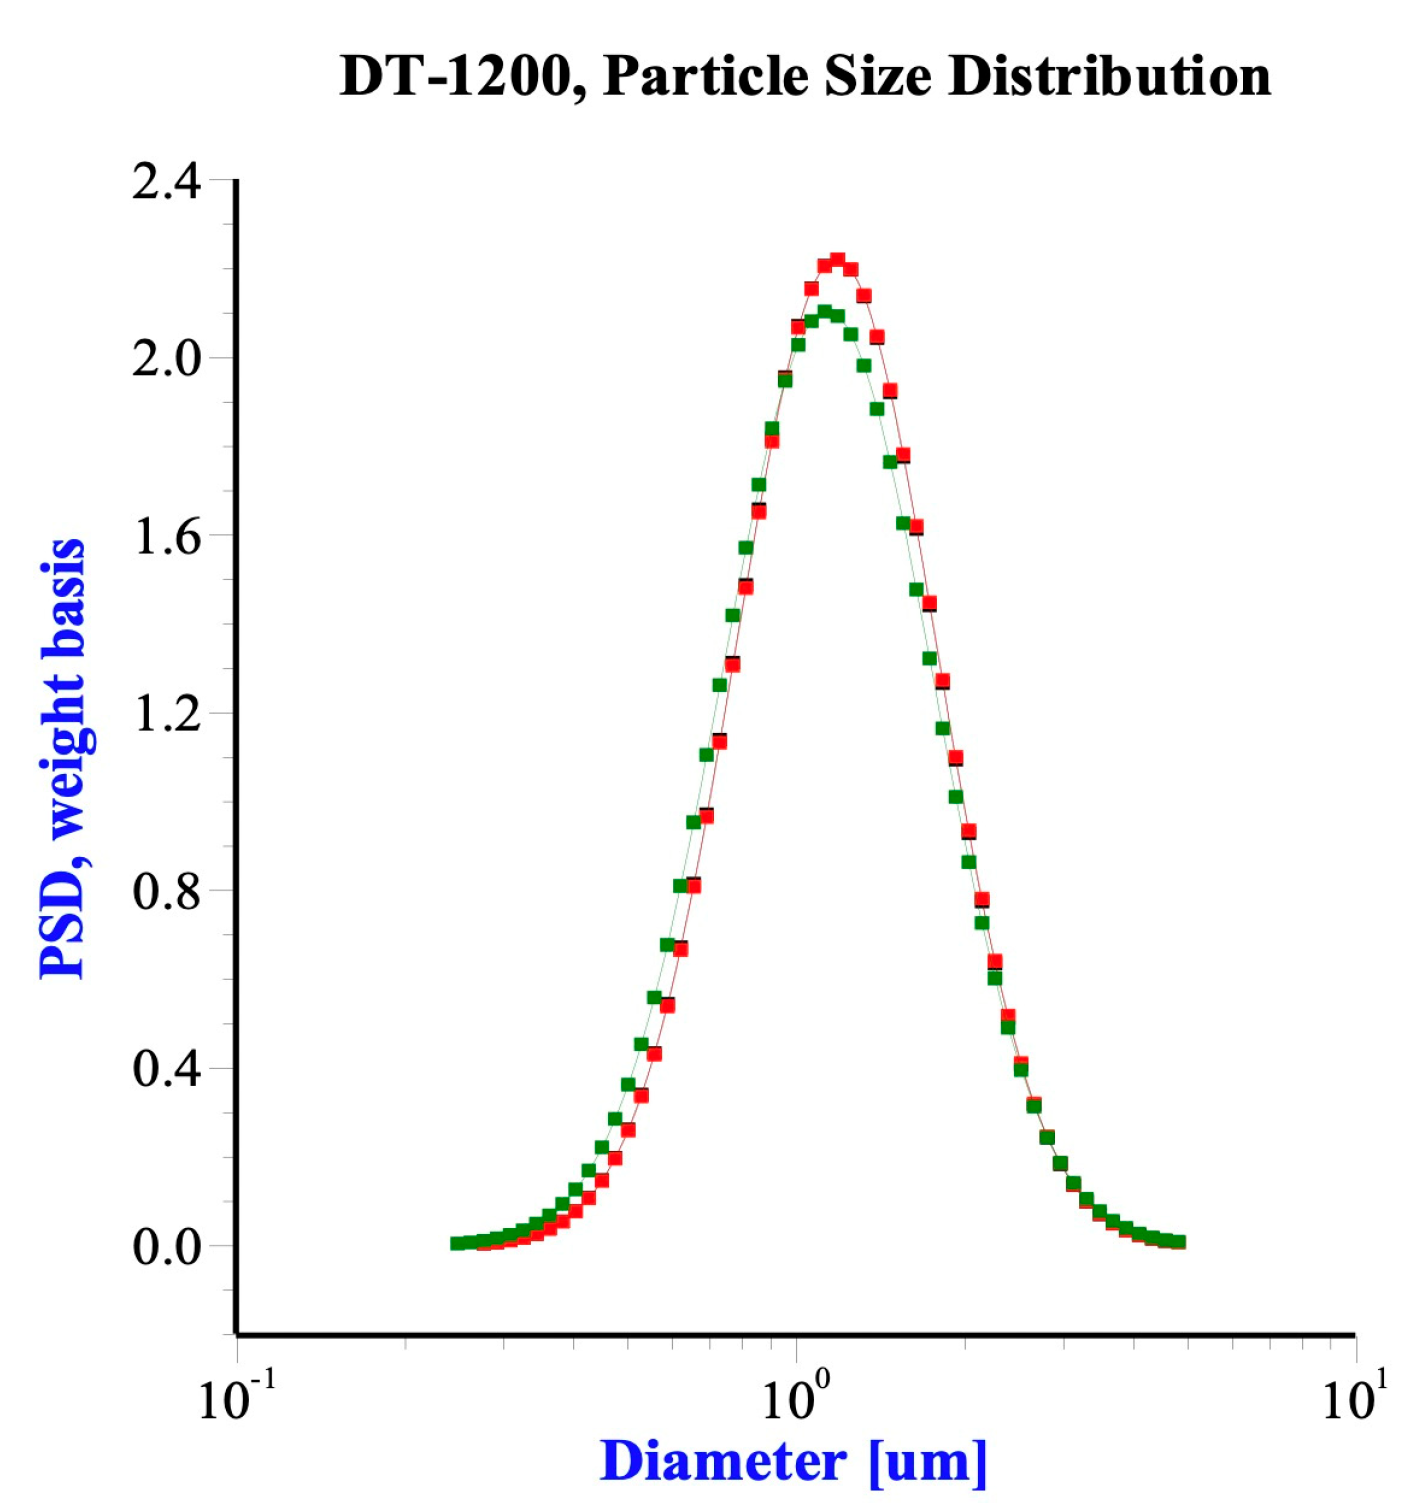
Porous silicon dioxide powder gels (Silica, SiO2) with a purity of 99.5% were purchased from Sigma-Aldrich Co. LLC. USA. The specific surface area was 414 m2/g, total pore volume was 0.87 mL/g obtained by the BET method with BECKMAN COULTER SA 3100 Surface Area and Pore Size Analyzer. The mean diameter was 1.2 μm, measured by ultrasonic attenuation spectroscopy with Acoustic Electroacoustic Spectrometer (Dispersion Technology Model 1200), as Figure 2 shows.
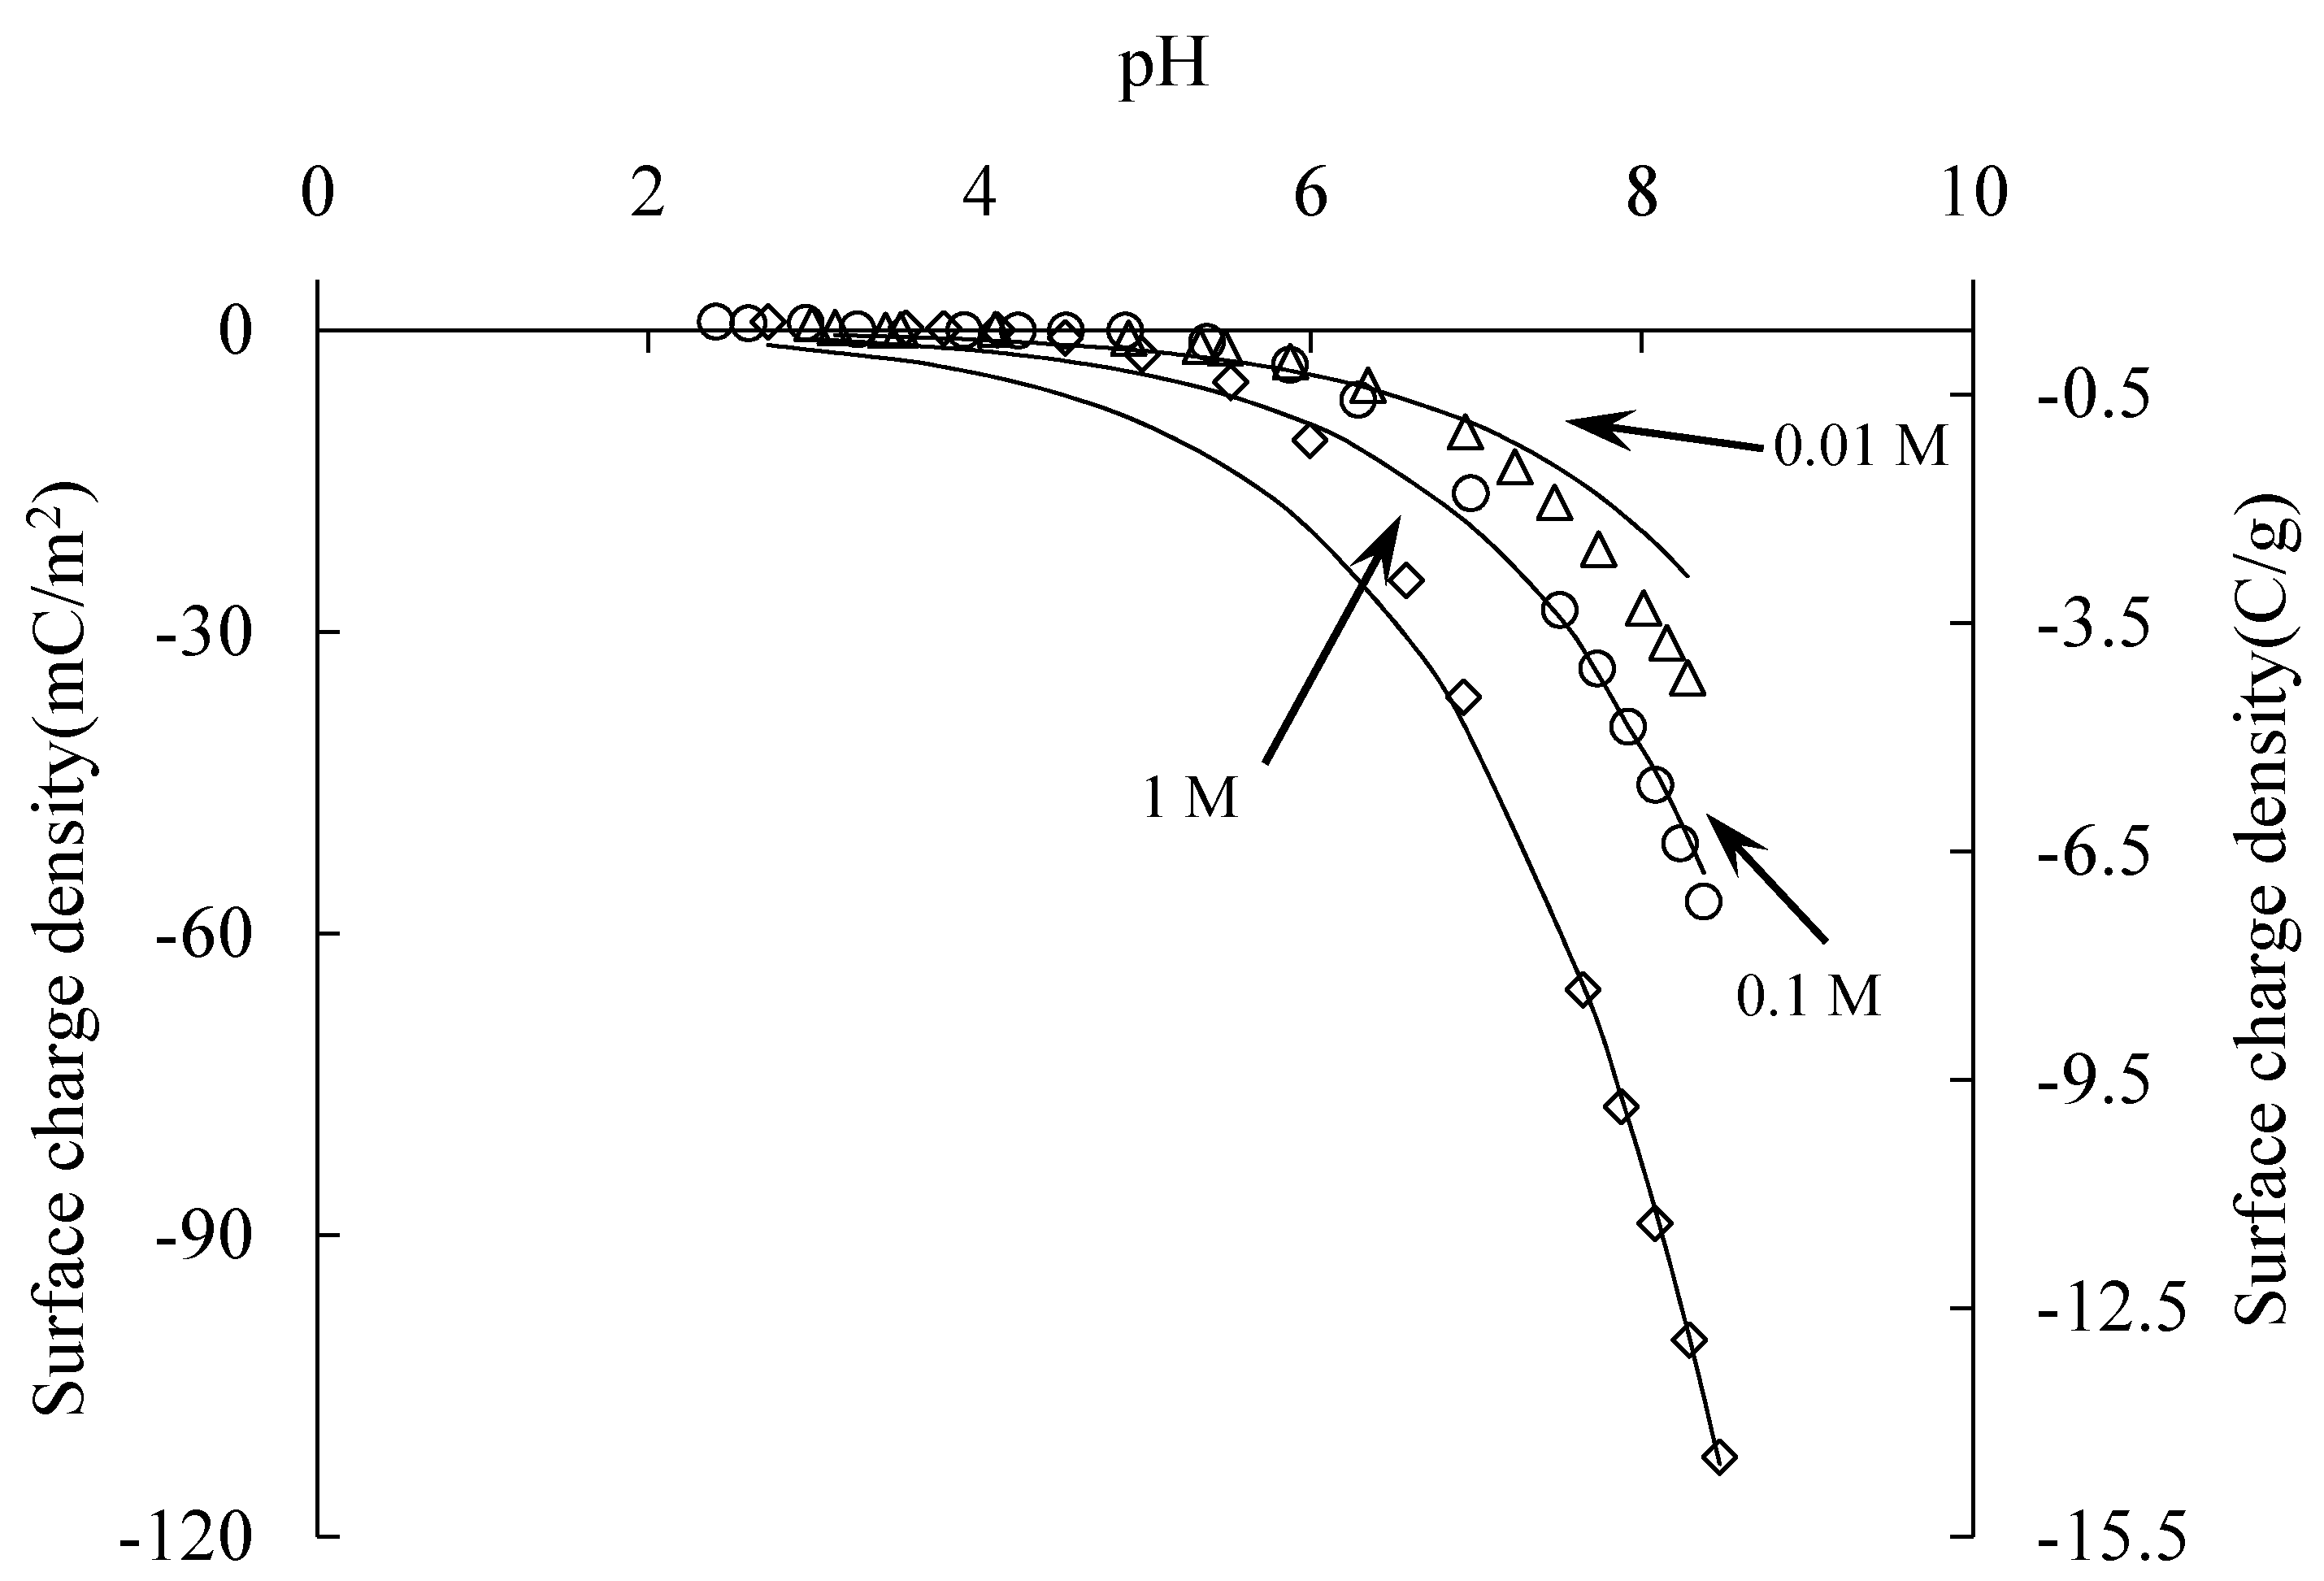
The surface charge density of silica samples at different electrolyte concentrations was measured by acid base titration at 25 ± 1 °C with a pH meter. At pH 4, the surface was saturated with hydroxyl groups. The pH here is the charge compensation point (CCP), as Figure 3 shows.
2.3. Adsorption Isotherms and Zeta Potential Measurement
Adsorption isotherms were obtained by a batch method at different conditions to investigate the influence of electrolyte concentration and pH on the DPC adsorption on silica. The silica was washed by 0.1 mol/L hydrochloric acid (HCl) three times to remove impurity and saturate the silica surface with H+. Adsorption isotherms were obtained by a batch method at different conditions: 0.1 mol/L NaCl at pH 3, 5 and 7, and, additionally, a pH 5 of 0.01 mol/L NaCl was also conducted at 25 ± 1 °C.
The procedure of DPC adsorption, zeta potential, and stability measurements is shown as follows:
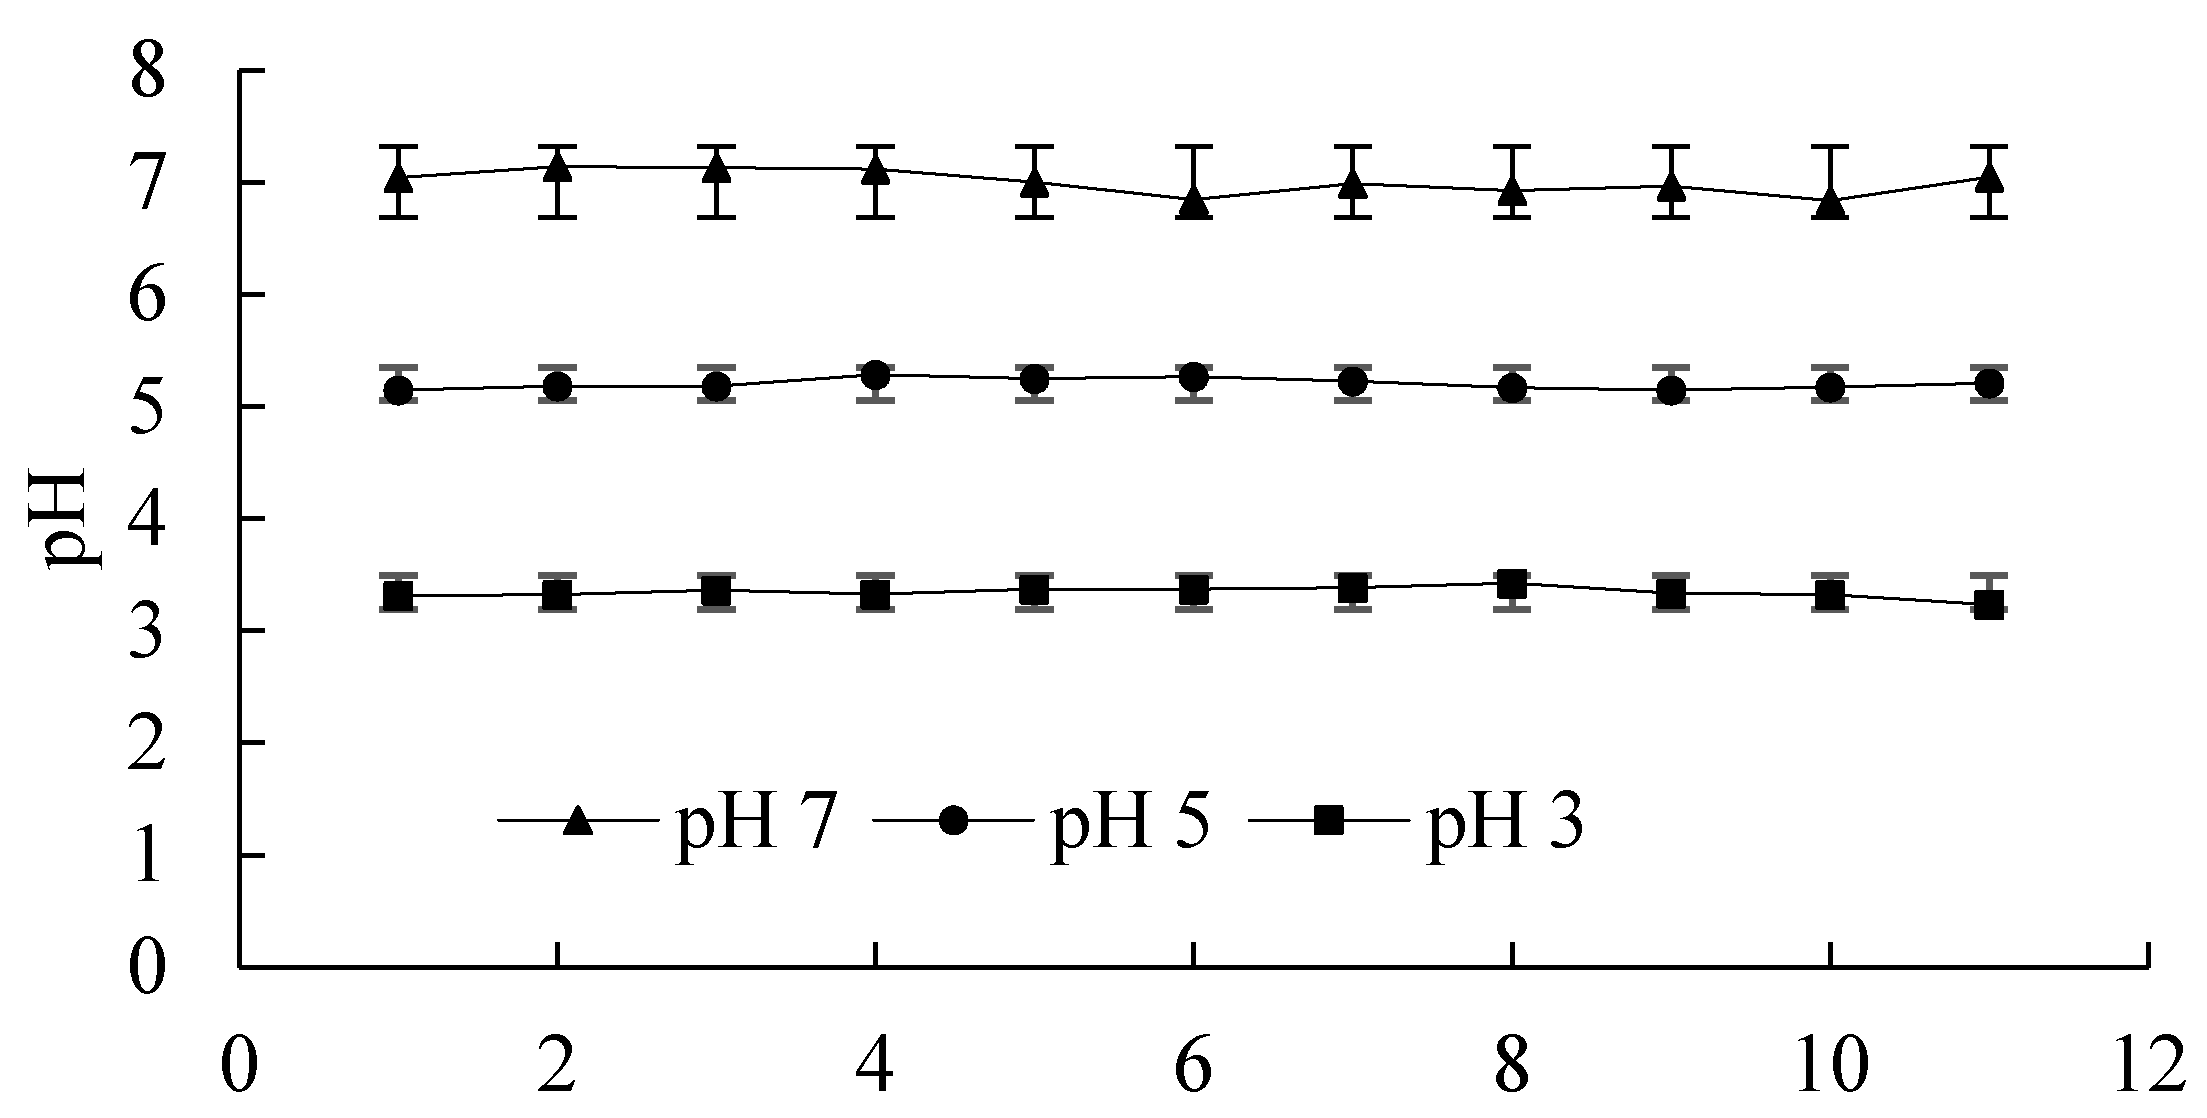
(1) 0.1 g of silica (dry weight basis) was placed in a 40 mL centrifuge tube and equilibrated, lasting for 5 min, with NaCl solutions 20 mL at different concentrations, as mentioned above. Dilute HCl or NaOH solution was used to adjust the pH of silica colloidal suspension during the equilibration. The silica sample was centrifuged and the supernatant was discarded. The washing and centrifuging recycling was repeated until the pH and electrolyte EC of the silica suspension were stable, Figure 4 shows the adjusted pH values and their standard deviation, then the samples were thought to be ready for the adsorption experiment;
(2) The adsorption experiment was conducted in TOA AUT5-01 titration system at room temperature. Silica suspensions of 20 mL were transferred into a 50 mL baker, and precisely 10 mL of DPC solutions (concentrations ranging from 0.1 to 100 mmol/L) at the same NaCl concentrations as those of the former equilibration solutions were added into the silica colloidal suspension, respectively, and were stirred for 5 min. During the equilibration, the pH of the mixture was detected all through; dilute HCl or NaOH solution were used to adjust the pH if there was any change, to guarantee the pH was always fixed;
(3) A total of 0.1 mL of the equilibration mixture was placed into a stock bottle to measure zeta potential;
(4) The equilibration mixture was transferred to a transparent tube. Then, it was shaken well and stood to precipitate the silica particles. Forty-five minutes later, 3 mL of the mixture under the liquid level of 2 cm was moved into the UV-absorbance cell by pipette to test the stability of the silica suspension with adsorption of DPC;
(5) The suspension in Step 4 was recycled back to the centrifuge tube and centrifuged for 10 min at 7000 rpm in a HITACHI CR 20GIII centrifuge at room temperature for 15 min. The pyridinium ion concentration of the supernatant was measured by SHIMADZU UV mini 1240 at 255 nm;
(6) The equilibration mixture in Step 3 was diluted by using the supernatant from Step 5 at a ratio of silica to solution in weight was set at about 1:20,000 by BECKMAN COULTER Delsa Nano Particle Analyzer at 658 nm. The zeta potential was calculated with the Helmholtz–Smoluchowski equation;
(7) The mixture was washed (shake and centrifuge) several times with pure water to remove the adsorbed DPC, and then the silica samples in Step 5 were oven-dried, and the weight was measured. The error from Step 3 was omitted because the amount was not large enough to impact the result. Finally, DPC adsorption was calculated by the following equation
where, added is the amount of added surfactant, conc. is the measured surfactant concentration of the supernatant, volume is the solution volume and w is the measured dry soil weight.
2.4. Modeling of Adsorption Isotherms
The adsorption isotherms were evaluated with the Gu and Zhu model [19]: the adsorption of surfactants on the solid–liquid interface was assumed to be occurring in two steps. Surfactant monomers adsorb on the solid surface through electrostatic attraction (in case of ionic surfactants) or Van der Waals’ interaction at a low concentration below the critical aggregation concentration (CAC) or hemi-micelle concentration (HMC) in the first step, thus, no aggregates form.
Site + Monomer ⇄ Adsorbed Monomer
The equilibrium constant at the first layer is given by
where a is the activity of surfactant monomers in solutions, and a1 and as are the activities of adsorbed monomers and surface sites, respectively.
In the second step, the adsorption amount increases significantly because of the presence of hemi-micelle
(n − 1) Monomers + Adsorbed Monomers ⇄ Hemi-micelle
In this case, the equilibrium constant at the second layer is
where ahm is the activity of hemi-micelle and n is the aggregation number of hemi-micelle. As an approximation for dilute solutions, one can use a = C (C is surfactant monomer concentration), the amount of adsorbed monomer Γ1, the amount of hemi-micelle Γhm, and the number of sites Γs instead of a1, ahm, and as, respectively. Thus, Equations (2) and (3) become
respectively.
The general surfactant adsorption isotherm equation can be derived from the combination of Equations (4) and (5) and the following two additional equations, (6) and (7)
The general isotherm equation is
where Γ is the adsorption amount at concentration C, and Γmax is the maximum adsorption amount; both of them can be measured from adsorption experiments.
As the surfactant concentration near the adsorbed layer is affected by the electric potential, ψ, the following concentration C is used in the calculation of Equation (8)
where Cb is the surfactant concentration in the bulk solution, ν is the valency of the surfactant ion including its sign, e is the elementary charge, k is Boltzmann’s constant and T is the absolute temperature. Zeta potential is used for ψ in the calculation.
3. Result
3.1. DPC Adsorption Isotherms and Isotherms Modeling
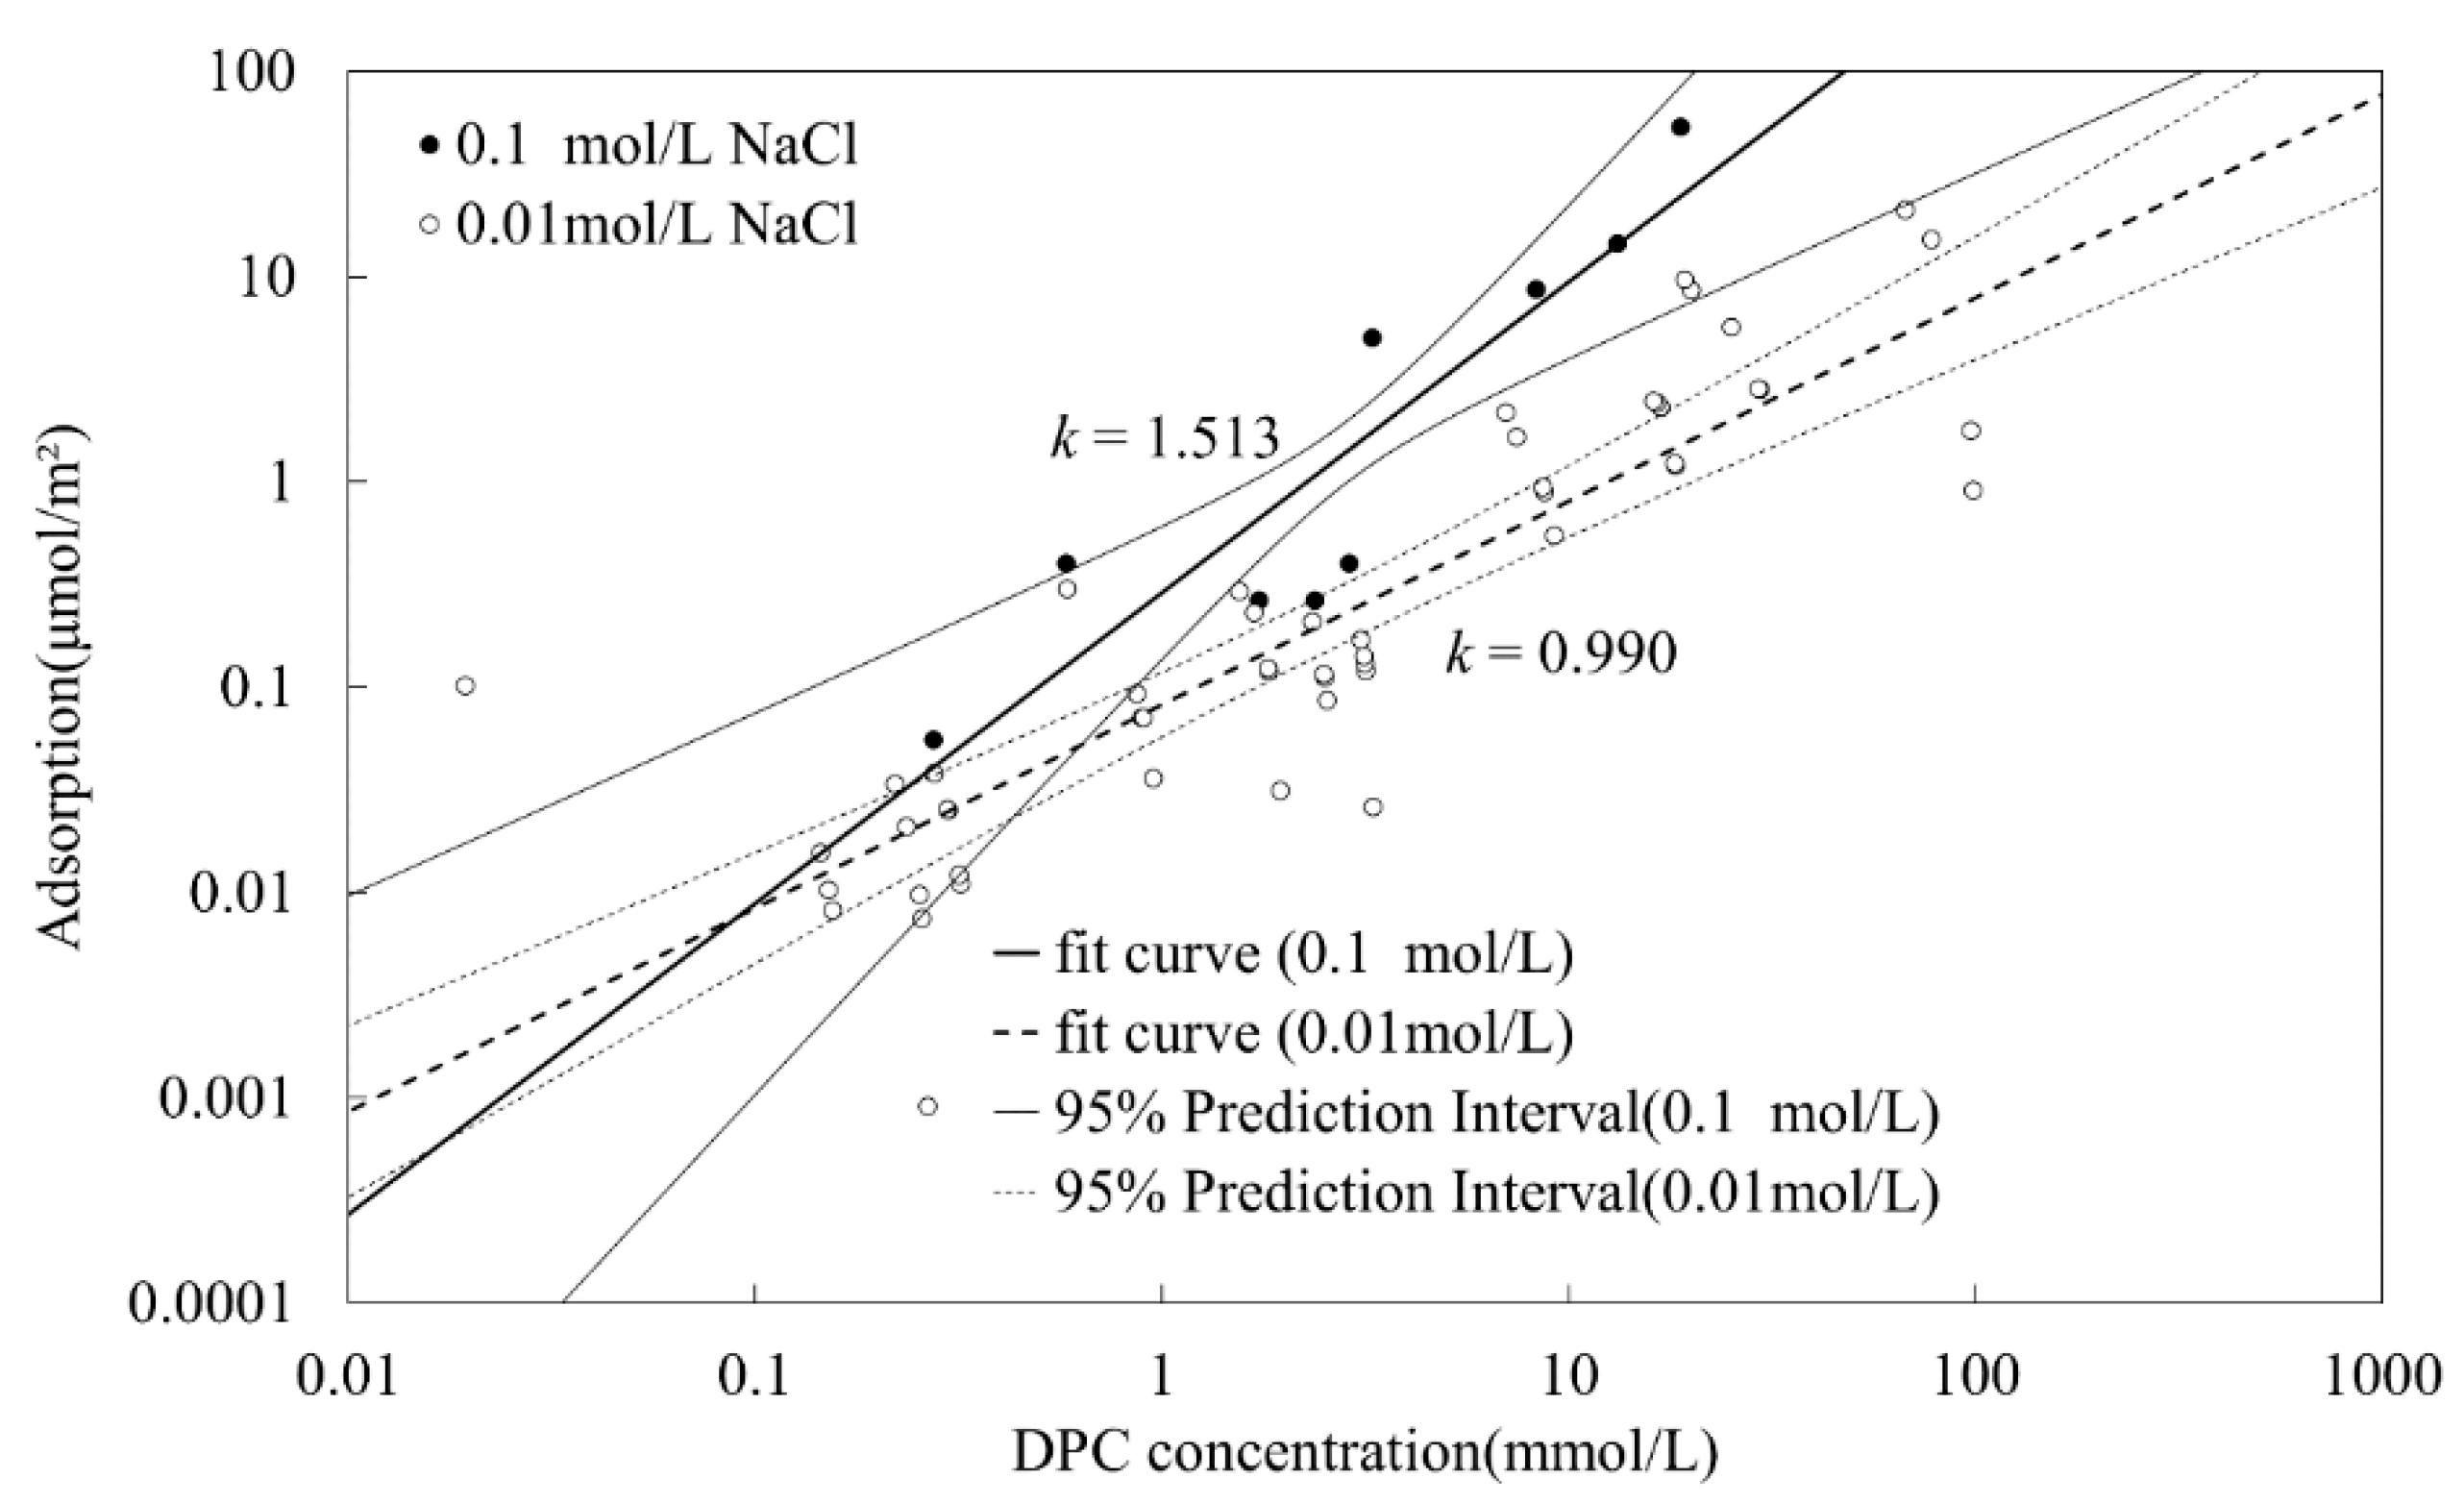
The adsorption isotherms of DPC on silica at pH 5 and different electrolyte concentrations (0.1 mol/L and 0.01 mol/L NaCl) are shown in Figure 5.
In Figure 5, a double log scale is presented in the coordinates. Filled circles sum to 10 present adsorption amounts at NaCl concentration of 0.1 mol/L, while empty circles sum to 52 are at 0.01 mol/L of NaCl, covering four repetitions. The linear regression under the logarithmic scale was conducted by Python, NaCl concentrations of 0.1 mmol/L and 0.01 mol/L are presented by solid and dotted lines respectively. The confidence interval with a confidence level of 95% is given. Figure 5 shows that it is much possible to have an intersection point for isotherms of different electrolyte concentrations only at very low DPC equilibrium concentration. This result corresponds with Goloub and Koopal [4].
Isotherms of DPC adsorption at 0.1 mol/L NaCl and different pHs are shown in Figure 6. The adsorption amount increased with increasing pH.
Notice that the adsorption amounts in this study are notably larger than that of Goloub and Koopal’s [4] study. For instance, at pH 7 and 0.1 mmol/L electrolyte concentration, the adsorption amounts of DPC on silica are 0.1 and 3 μmol/m2, respectively, at 0.001 and 0.01 mol/L of the DPC equilibrium concentration, while, in this study, the values are 6 and 9, respectively. The silica used in Goloub and Koopal [4] has a small specific surface area of 50 m2/g, and non-porous, while in this study, used silica is porous and has a 414 m2/g surface area. A larger surface area could provide much more adsorption sites for surfactant.
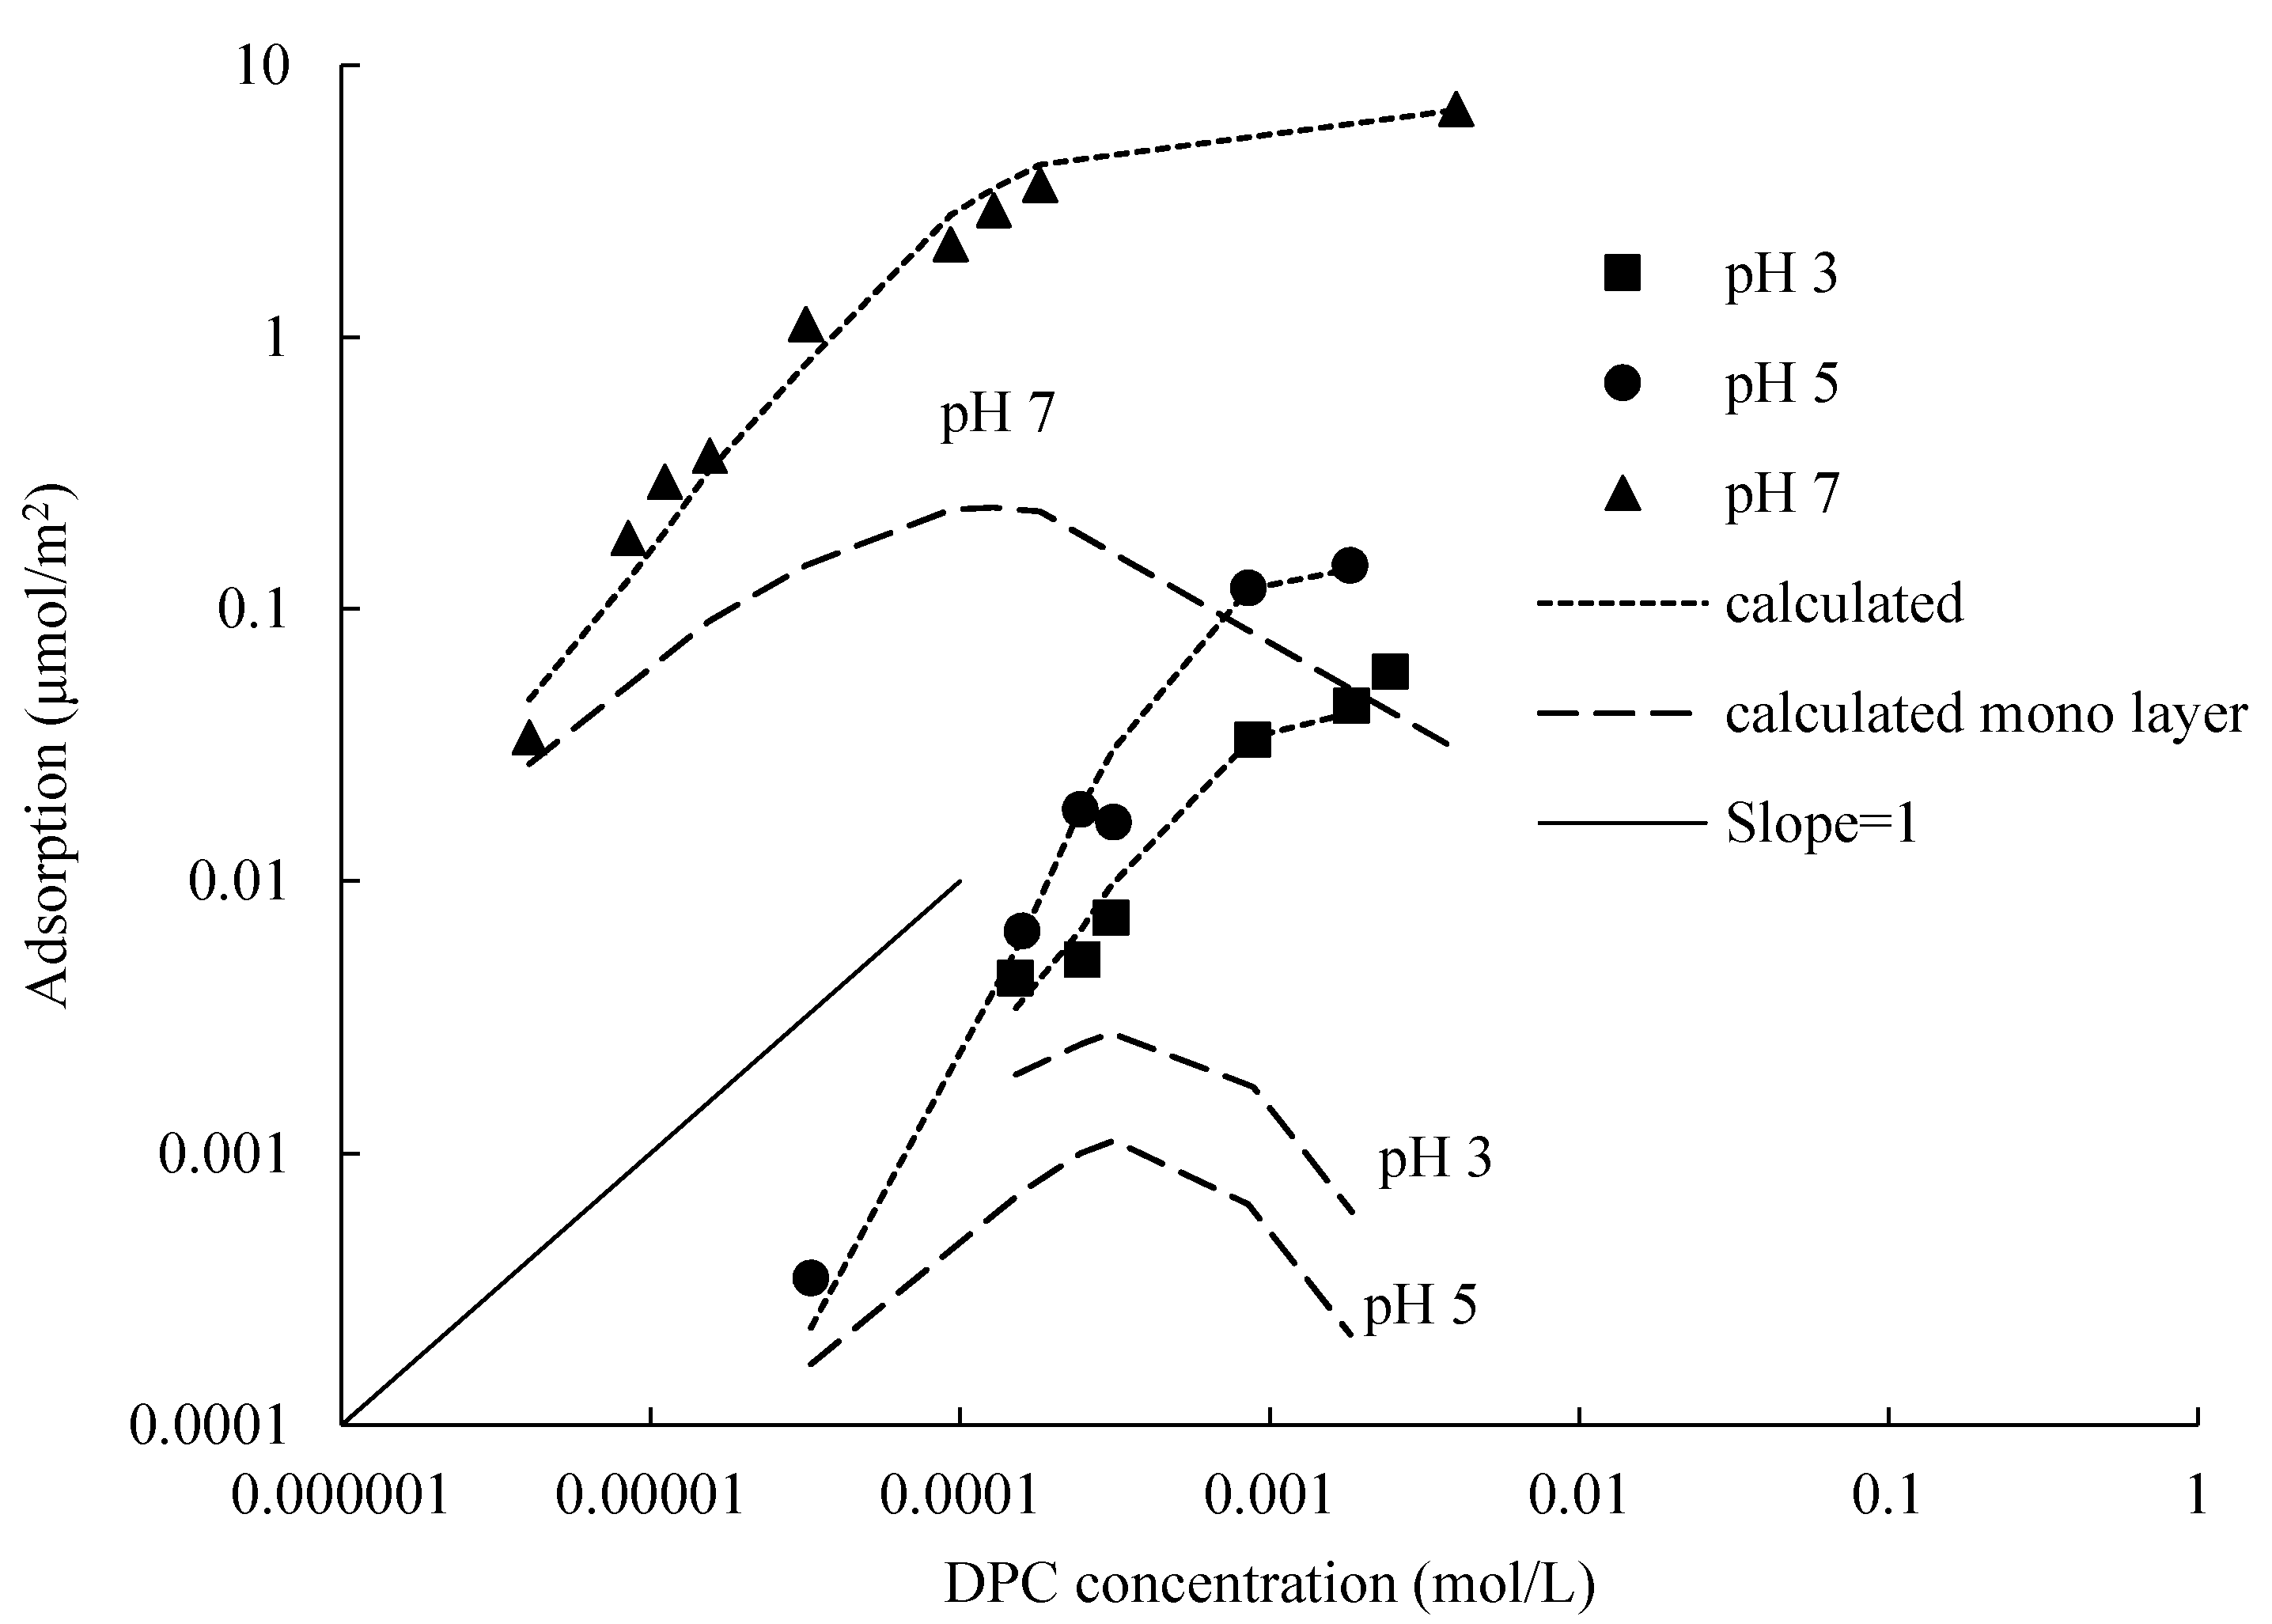
The modeling of DPC adsorption isotherms of different pH at 0.1 mol/L electrolyte concentrations by Gu and Zhu model is shown in Figure 7; calculated values are expressed by the dotted lines. Bilayer adsorption calculated lines are well fitted with the measured values. A linear increase with a slope of 1 is followed by another increase with a smaller slope. For monolayer calculated lines, a linear increase with a slope of 1 is also presented, as the DPC concentration increased, adsorption sites were saturated, monolayer adsorption completed, the equation cannot describe the subsequent adsorption any more.
3.2. Silica Particle Stability with Adsorption of DPC
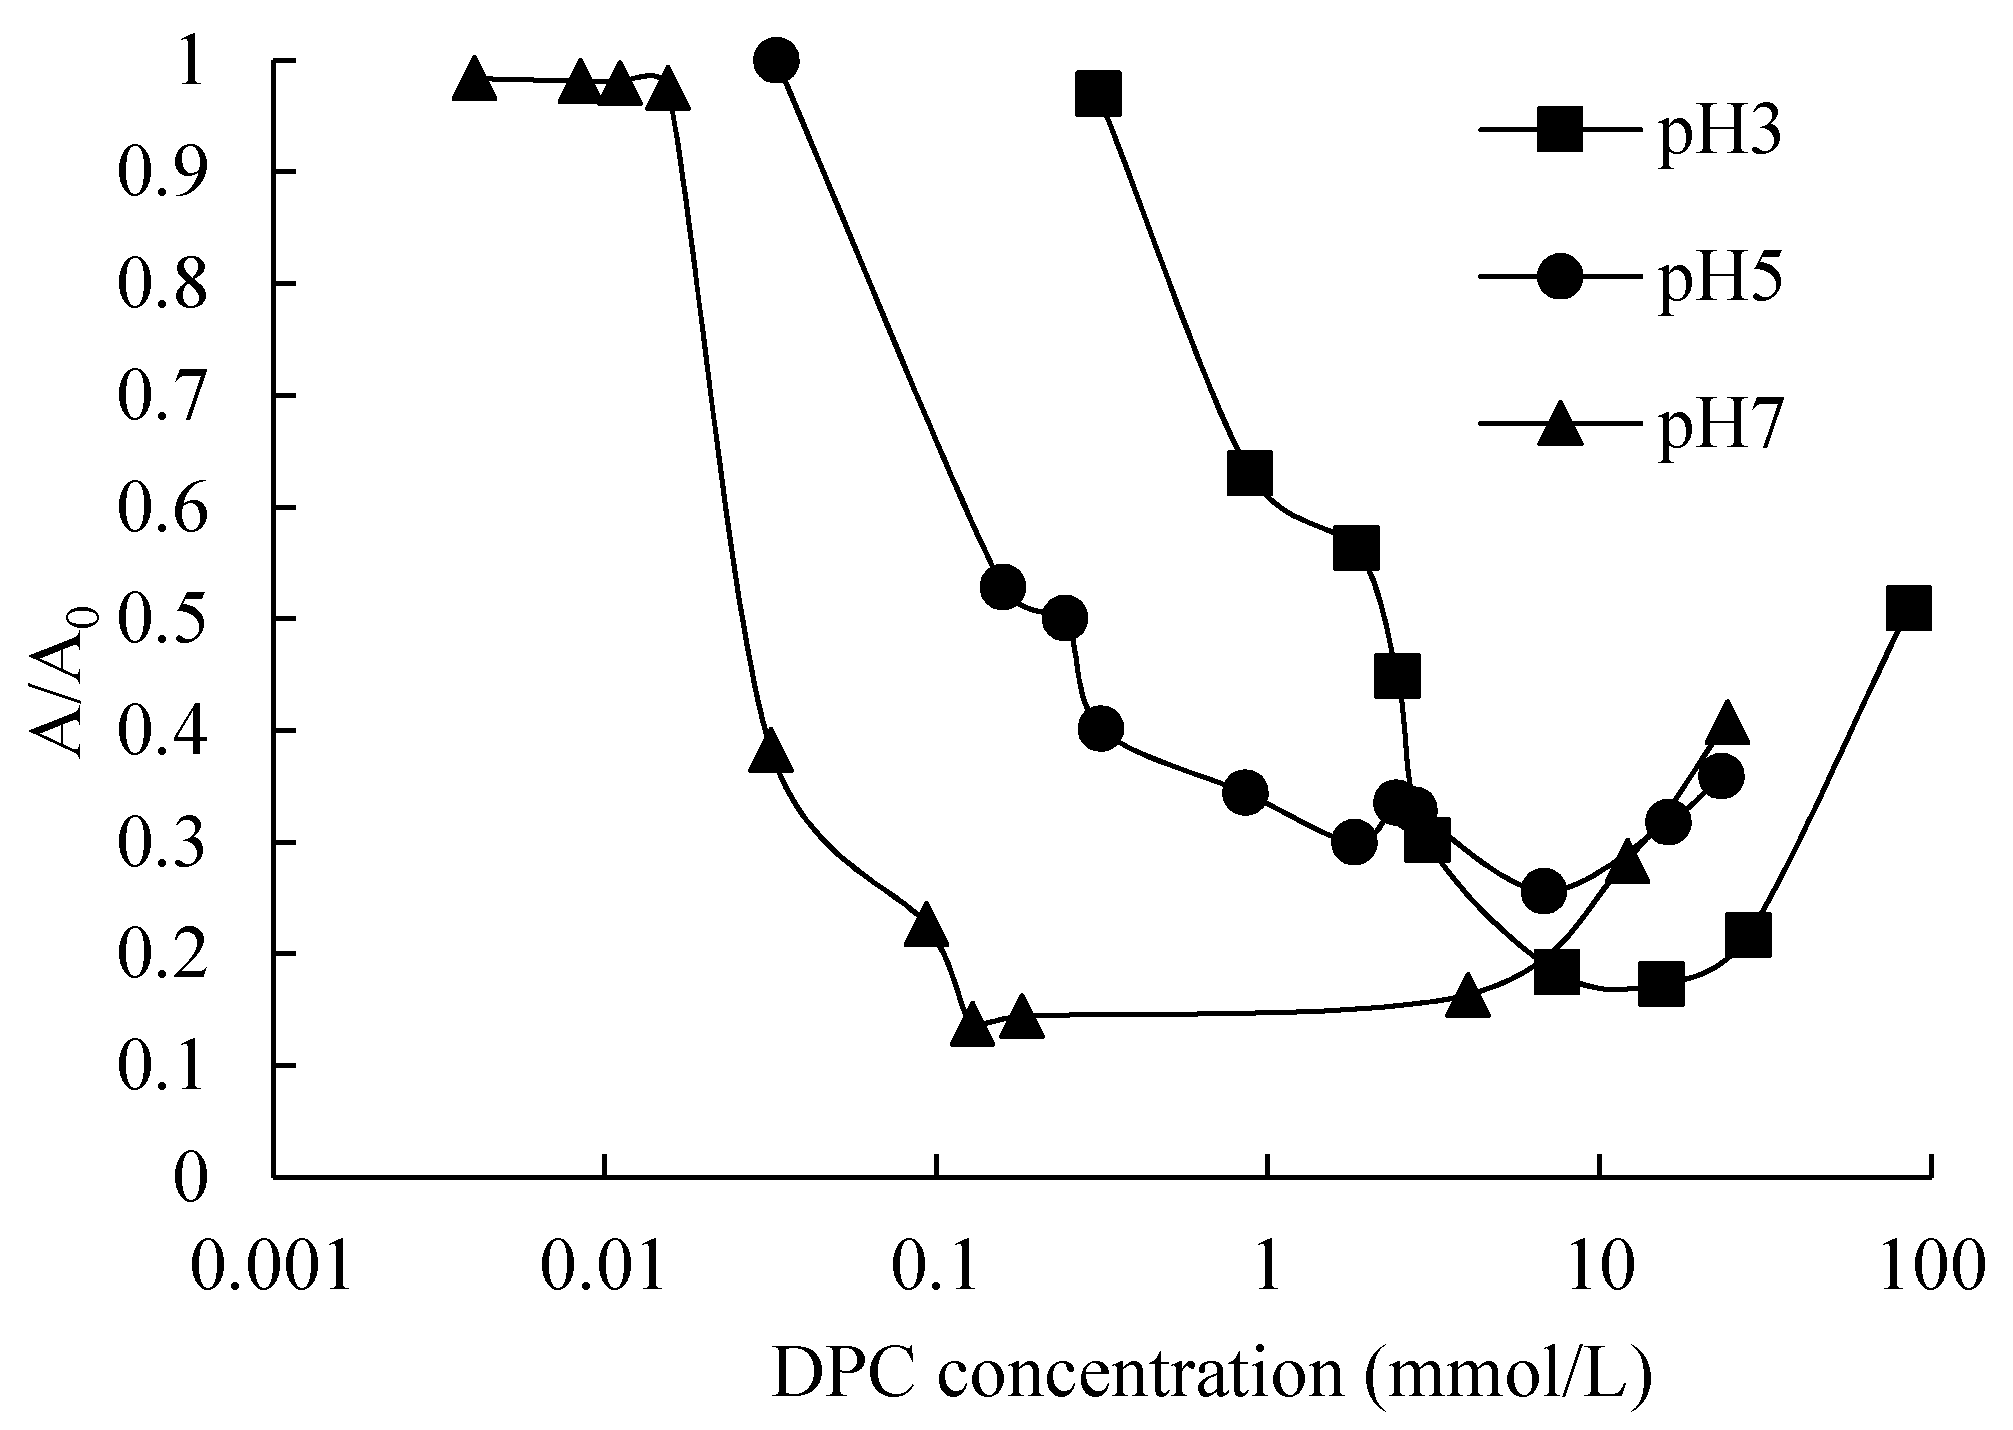
The rate of absorbance (A) of the mixture of silica colloidal suspension and DPC solution after sediment for 45 min and corresponding blank dispersion (A0), A/A0 as a function of DPC equilibrium concentration at 0.1 mol/L NaCl concentration and different pH was plotted in Figure 8.
A/A0 represents the turbidity of the suspension. When silica particles flocculate, the water becomes transparent and the turbidity decreases. Therefore, the A/A0 becomes larger when silica particles remain in dispersed condition. The A/A0 value without surfactant was measured initially: the value is almost 1, indicating a sufficient electrostatic repulsion between particles to overcome the Van der Waals’ interaction, which is corresponded to Koopal et al. [18]. As can be observed in the figure, for each pH value, the suspensions were stable in lower DPC concentrations, and there was a nearly completed flocculation of silica dispersion around the CCP; after passing the CCP, the stability increases again. A higher pH led to a lower stability, as the figure shows.
3.3. Zeta Potential with Adsorption of DPC
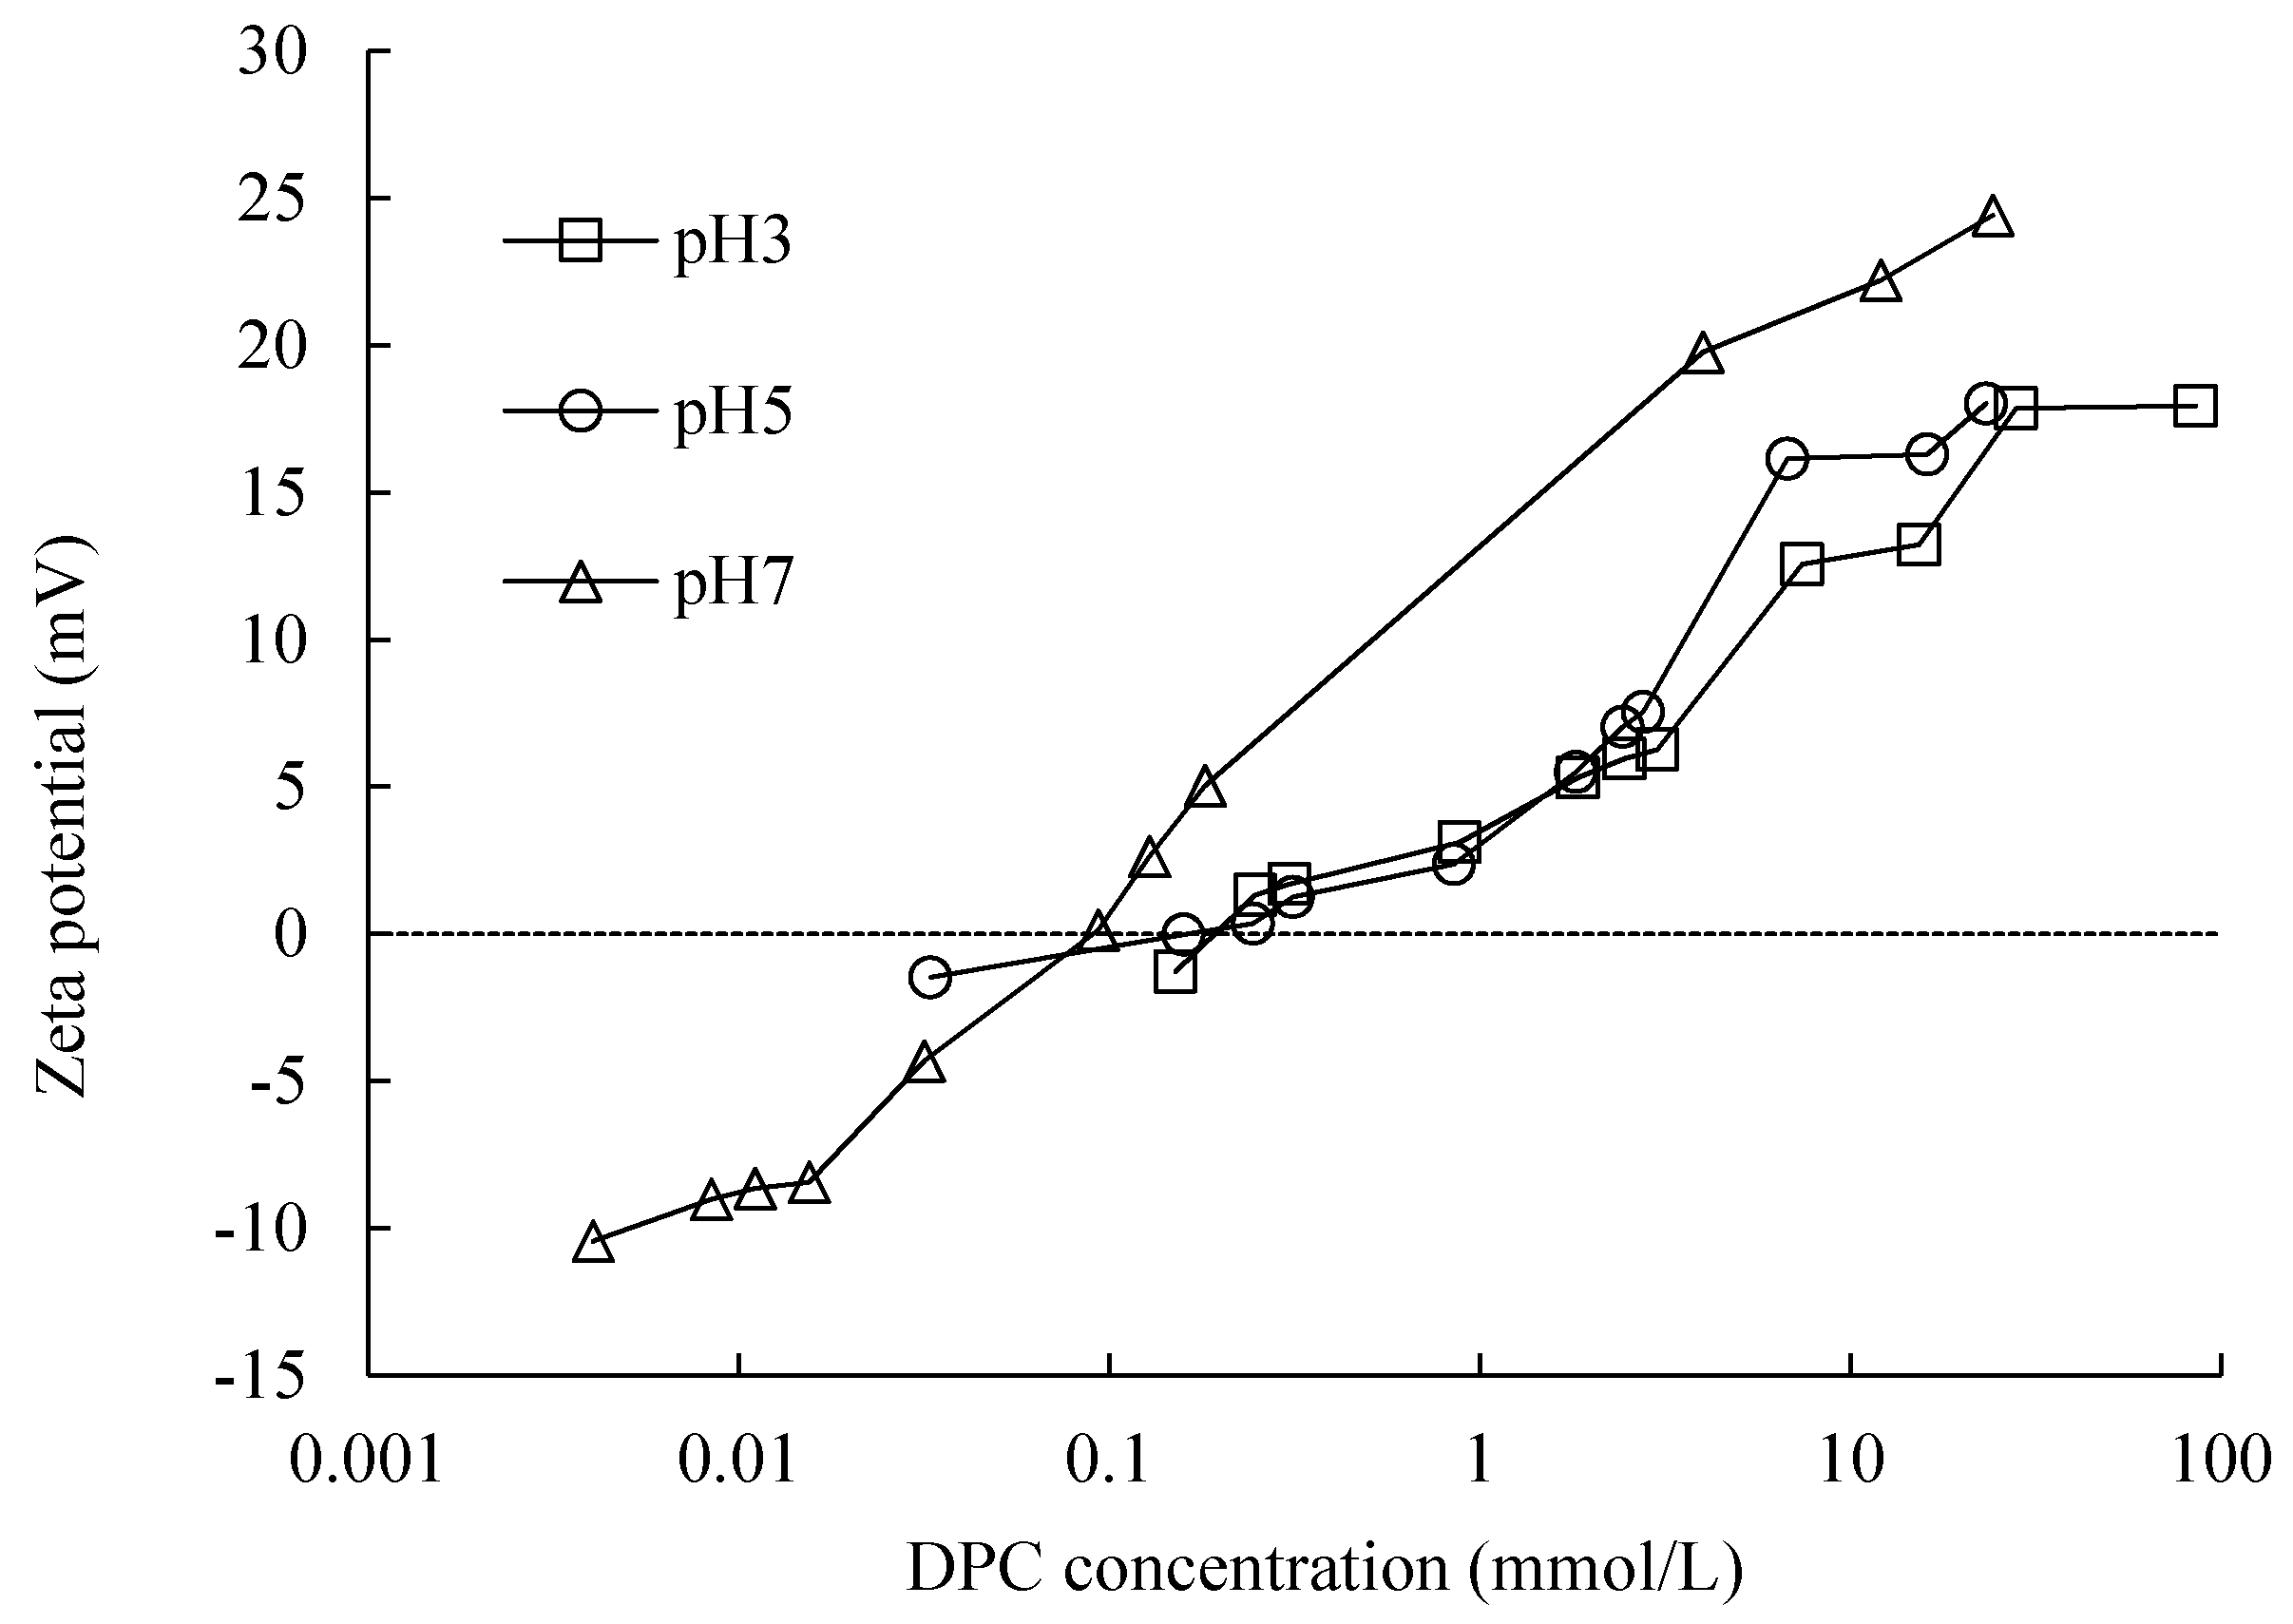
Zeta potential as a function of pH under different electrolyte concentrations without surfactant is presented in Figure 9; adsorption equilibrium concentration of DPC at 0.1 mol/L and a series of pH are presented in Figure 10.
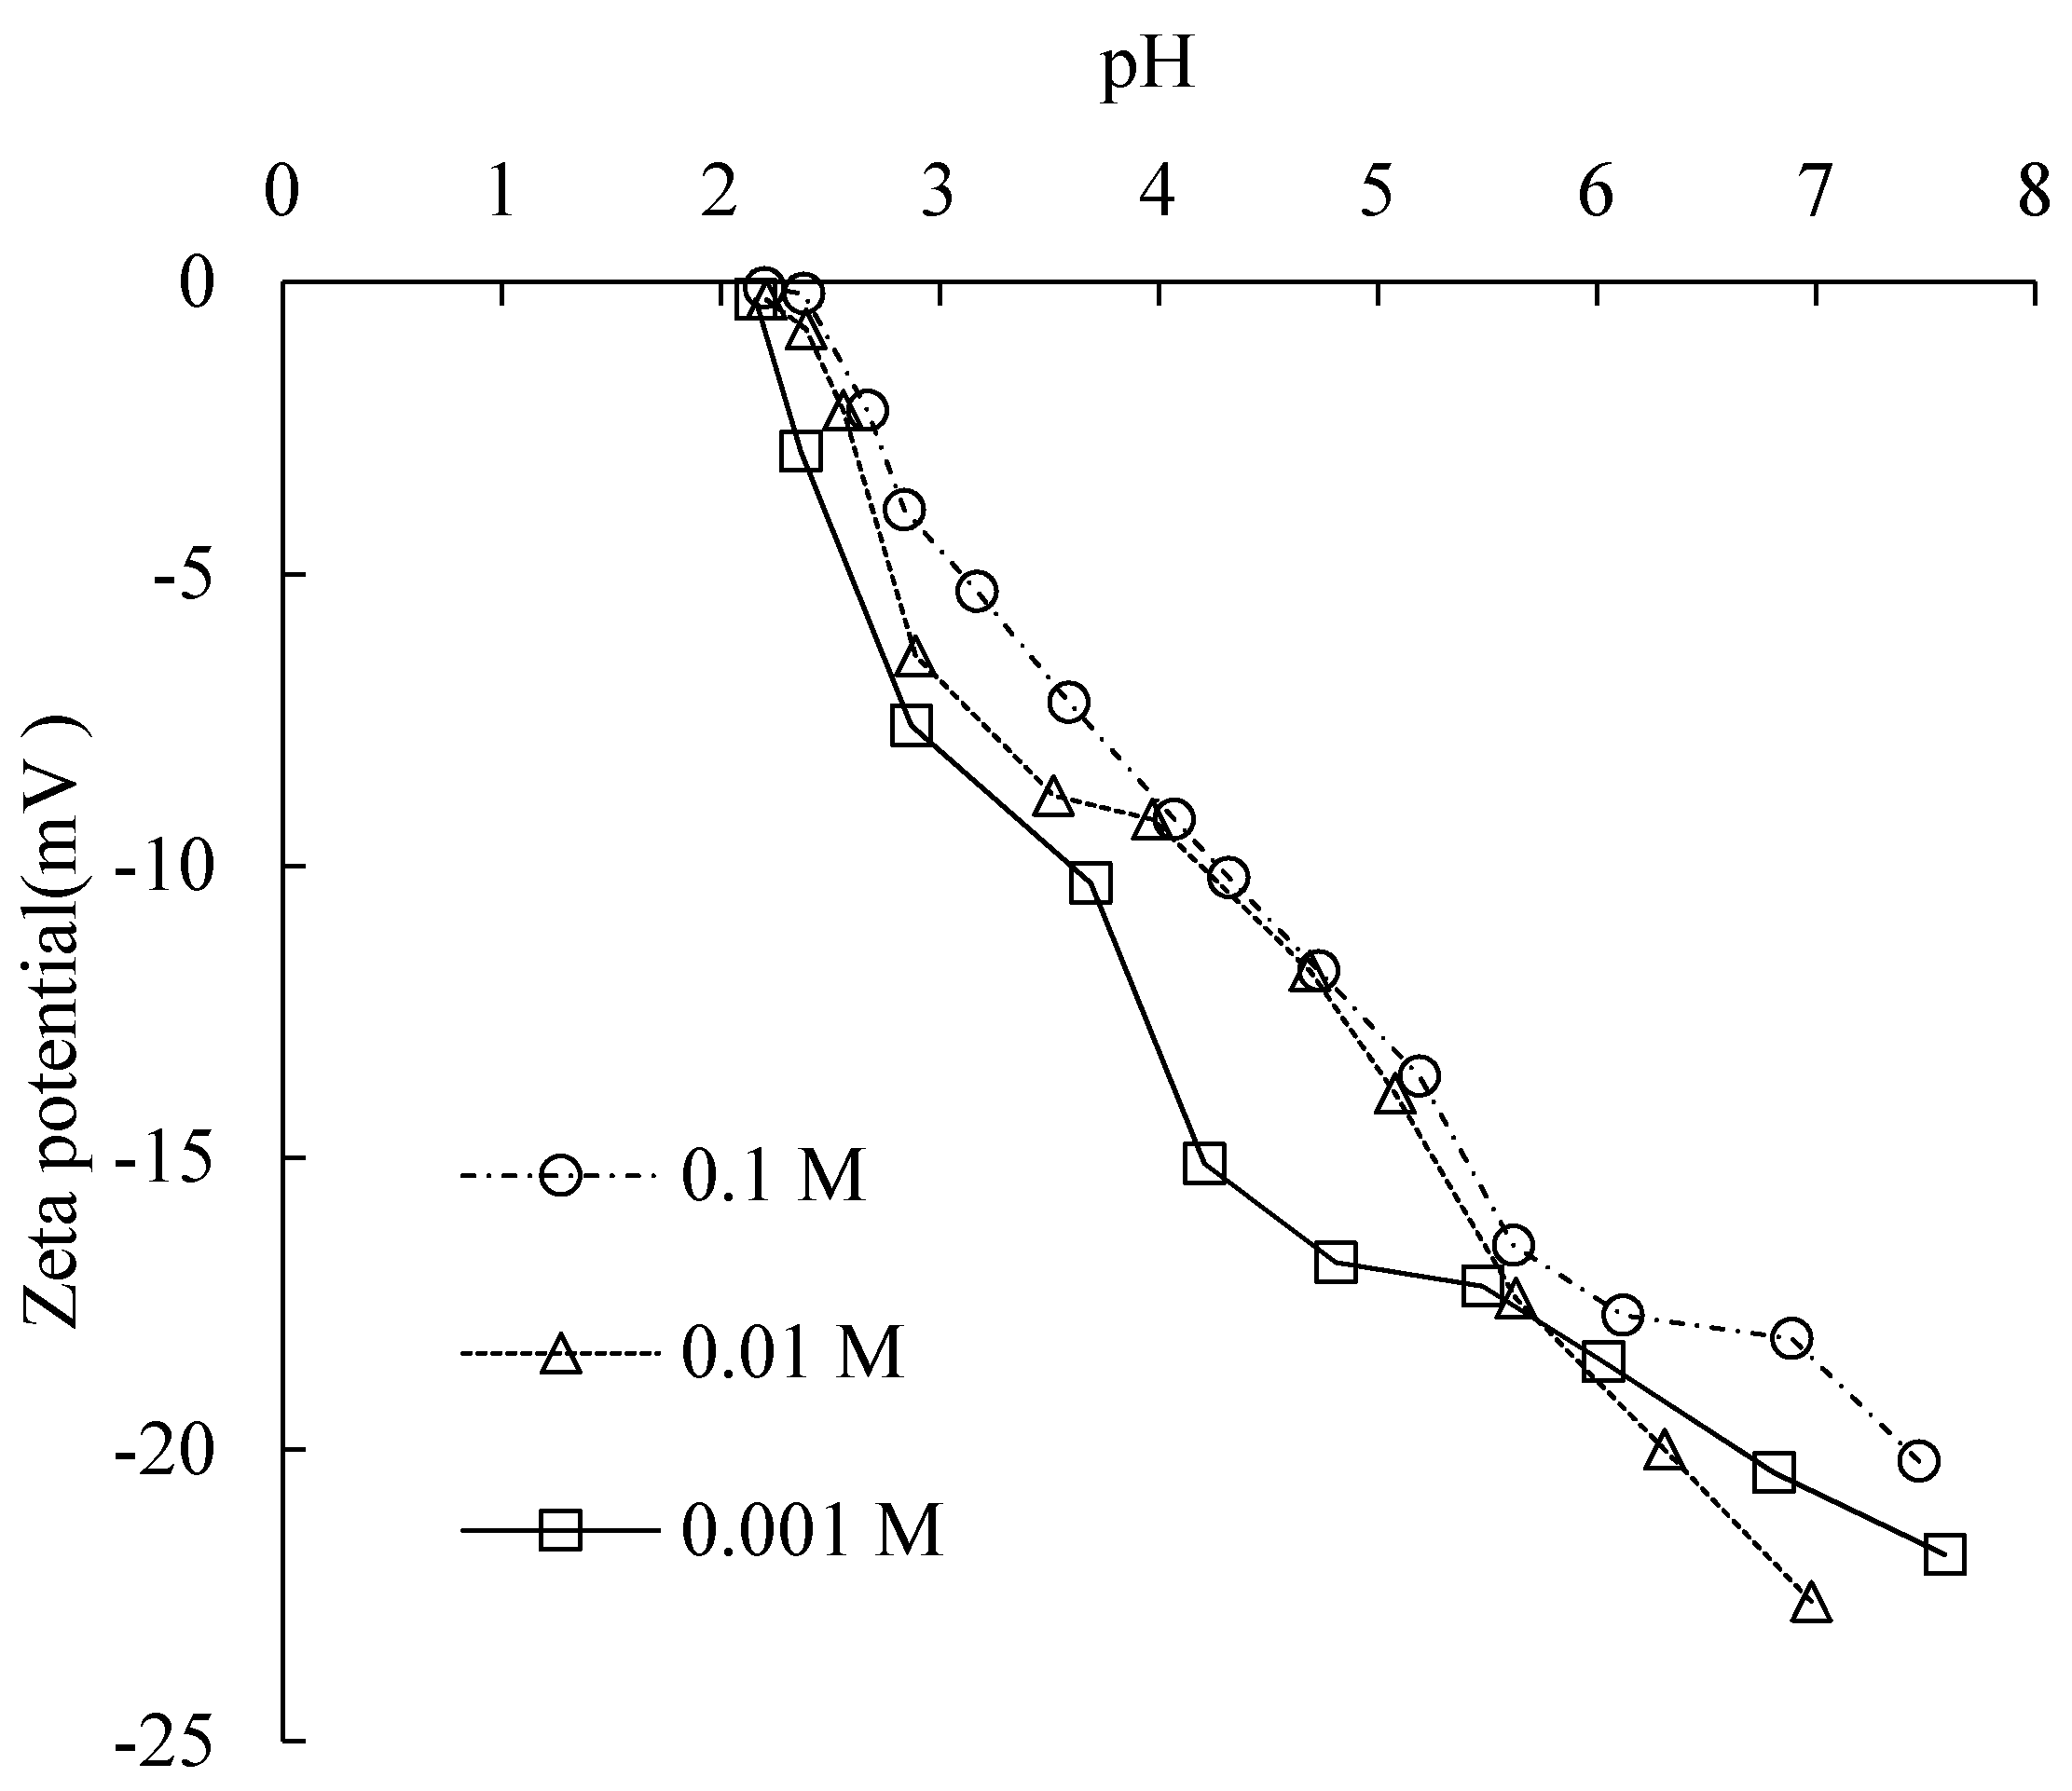
The isoelectric point was at around pH 2.2. At a higher pH than this, the zeta potentials were all negative. With the increase in pH value, the magnitude of zeta potential increased, and was larger with decreasing electrolyte concentration as a trend.
As one can see in Figure 10, with the adsorption of cationic surfactant DPC on silica surface, the magnitude of zeta potential became smaller, getting closer to zero, as a charge compensation process was happening. For pH 3, 5 and 7, at around the CCP, 0.5, 0.3 and 0.1 mmol/L of DPC equilibrium concentration, respectively, the zeta potential became 0; at this point, the surface charge of silica was neutralized by DP+. As the adsorption amount increases sequentially, the magnitude of zeta potential increased, becoming more and more positive until about 17 mV for pH 3 and 5, 30 mV for pH 7. A higher pH means a lower CCP value; this corresponded with Goloub and Koopal [4]. The sequentially increased zeta potential after CCP indicated that the surface became positively charged by DP+; bilayer adsorption was proved by this phenomenon.
3.4. Comparison of SDS and DPC Adsorption
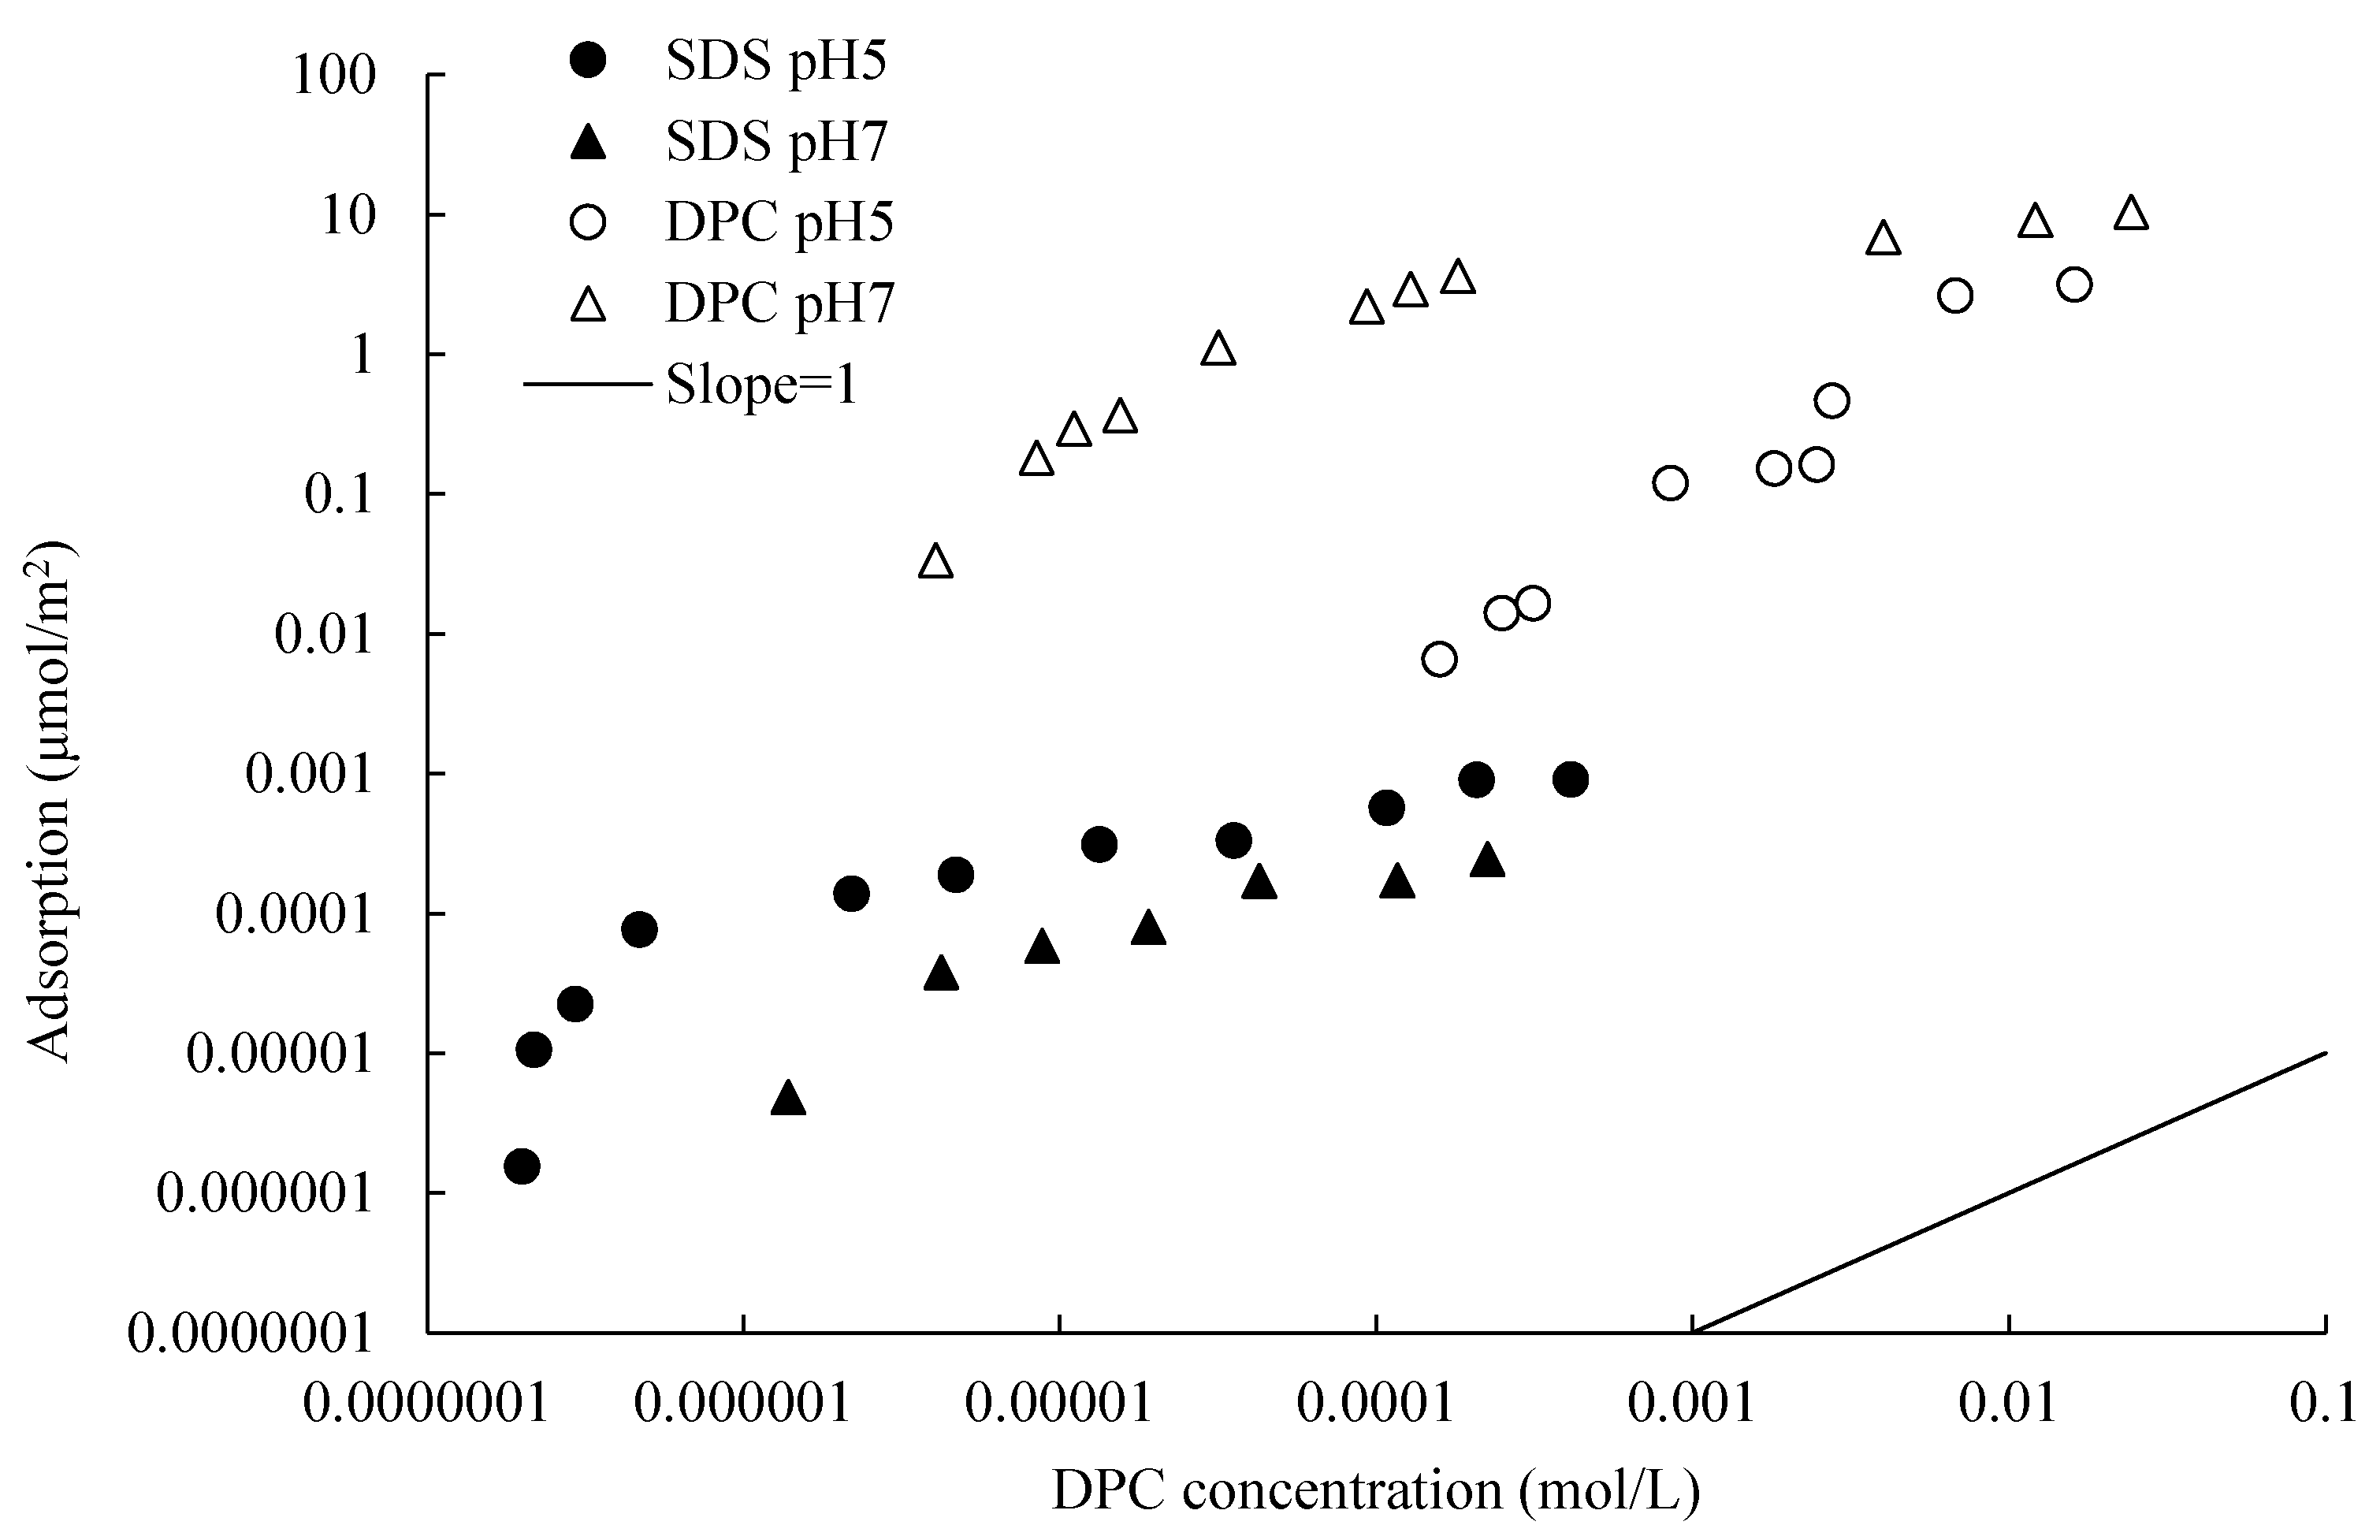
Figure 11 shows the comparison of SDS [17] and DPC adsorption isotherms at 0.1 mol/L NaCl and different pH values.
Clearly, one can see that, although cooperative adsorption was detected when SDS equilibrium concentration was low, the adsorption of cationic surfactant DPC is dramatically larger than that of anionic surfactant SDS. SDS adsorption is motivated by hydrophobic attraction; the negatively charged head is towards the solution, and in this condition, bilayer adsorption cannot be formed. The impact of pH on the adsorption of SDS and DPC on the same silica surface is the inverse. Higher pH resulted in a smaller adsorption amount for SDS, while it resulted in a larger amount for DPC.
4. Discussion
DPC adsorbed strongly on silica due to the combination of electrostatic and hydrophobic attraction. The adsorption amount is larger at a high pH due to the relatively high potential in this condition. The zeta potential of silica changed from negative to positive with the adsorption of DPC, indicating the occurrence of bilayer adsorption. The silica particles dispersed well without DPC adsorption, and also when bilayer adsorption happened, because, in these two conditions, all the silica particles are charged. The same silica adsorbed a comparatively larger amount of DPC than that of SDS at the same equilibrium concentration, pH and electrolyte concentration.
At the same pH, a higher electrolyte concentration resulted in higher DPC adsorption amounts, the adsorption amount difference is larger at a higher DPC equilibrium concentration than that at a low DPC equilibrium concentration, and when the DPC concentration is larger, bilayer adsorption happened and hemi-micelle is generated by hydrophobic tails of DPC molecules. In this case, lots of Cl− (high electrolyte concentration) plays an important role in the gathering of the DPC positively charged heads; as a result, the adsorption amount and adsorption amount difference are larger. When DPC concentration is low, a large amount of Na+ (high electrolyte concentration) occupied the adsorption sites before DP+ comes; this made a narrow space for DP+ to adsorb on silica surface, resulting in a smaller adsorption amount. However, in this study, one could hardly see this phenomenon from the experimental dots in Figure 5, but only by the crossed fit lines due to the structural difference of silica. Porous silica provides more adsorption sites, which weaken this impact. The schematic diagram is illustrated in the bottom in Figure 5. The adsorption amount difference can hardly be observed when DPC equilibrium concentration is lower than 0.1 mmol/L.
However, by Figure 5, four-region property [2] could hardly be seen in the isotherms. Instead, only a steeper increase was observed after the CCP. Compared with other research [4,20], these differences may come from the structural differences in silica; the silica used in this research is very porous, which may strongly affect the adsorption.
High pH resulted in a high adsorption amount and capacity (Figure 6), and at a low pH, the large number of H+ would occupy the negative adsorption sites on the silica surface in advance.
The Gu and Zhu model is useful to evaluate the two-step isotherms. As can be seen in Figure 7, calculated lines can reasonably represent experimental data by using appropriate parameters; they are well fitted with the measured values, and performed two-step property at three different pH values and the same electrolyte concentration, which include the first layer, bilayer and hemi-micelle adsorptions. The first step adsorption happened before CMC, CMCs are: 13.6 mmol/L at 0.01 mol/L NaCl and 5.3 mmol/L at 0.1 mol/L [21]. The calculated lines show a slope of nearly 1, the adsorption amount is proportional to the DPC concentration, the number of adsorption sites on silica surface is sufficient to support a linear increase with a slope of 1, and the linear bilayer adsorption is completed in this step. When the DPC equilibrium concentration is larger than CMC, adsorption sites are saturated by two layers of DPC molecules; only a small amount of DPC molecules adsorbed at the edge of silica surface by a form of hemi-micelle, at the same time, DPC molecules in the bulk solution also formed micelles; they cannot adsorb on the silica surface any more [22].
The monolayer calculated lines by using fit parameters shown in Figure 7; one could notice that the lines also performed a linear increase with a slope of 1, and then dropped down at the adsorption amount of half values of the bilayer adsorption.
Adsorption of SDS on silica happens in spite of the existence of electrostatic repulsion. SDS molecules are adsorbed by hydrophobic siloxane groups, ≡Si-O-Si≡ [23,24], towards the silica surface, and negatively charged heads are in the bulk solution, thus the second layer adsorption is hardly formed, while DPC adsorbed on silica surface with a bilayer pattern and even hemi-micelle. DPC adsorbed more strongly on silica than SDS due to the combination of electrostatic and hydrophobic attraction. At CCP, the negative surface charge of silica was compensated by DP+, a continuously increasing zeta potential indicated a bilayer adsorption of DPC. The adsorption amount increased with increasing pH. The totally different adsorption mechanism resulted in a huge difference in adsorption amount and an inverse impact of pH to the adsorption between SDS and DPC.
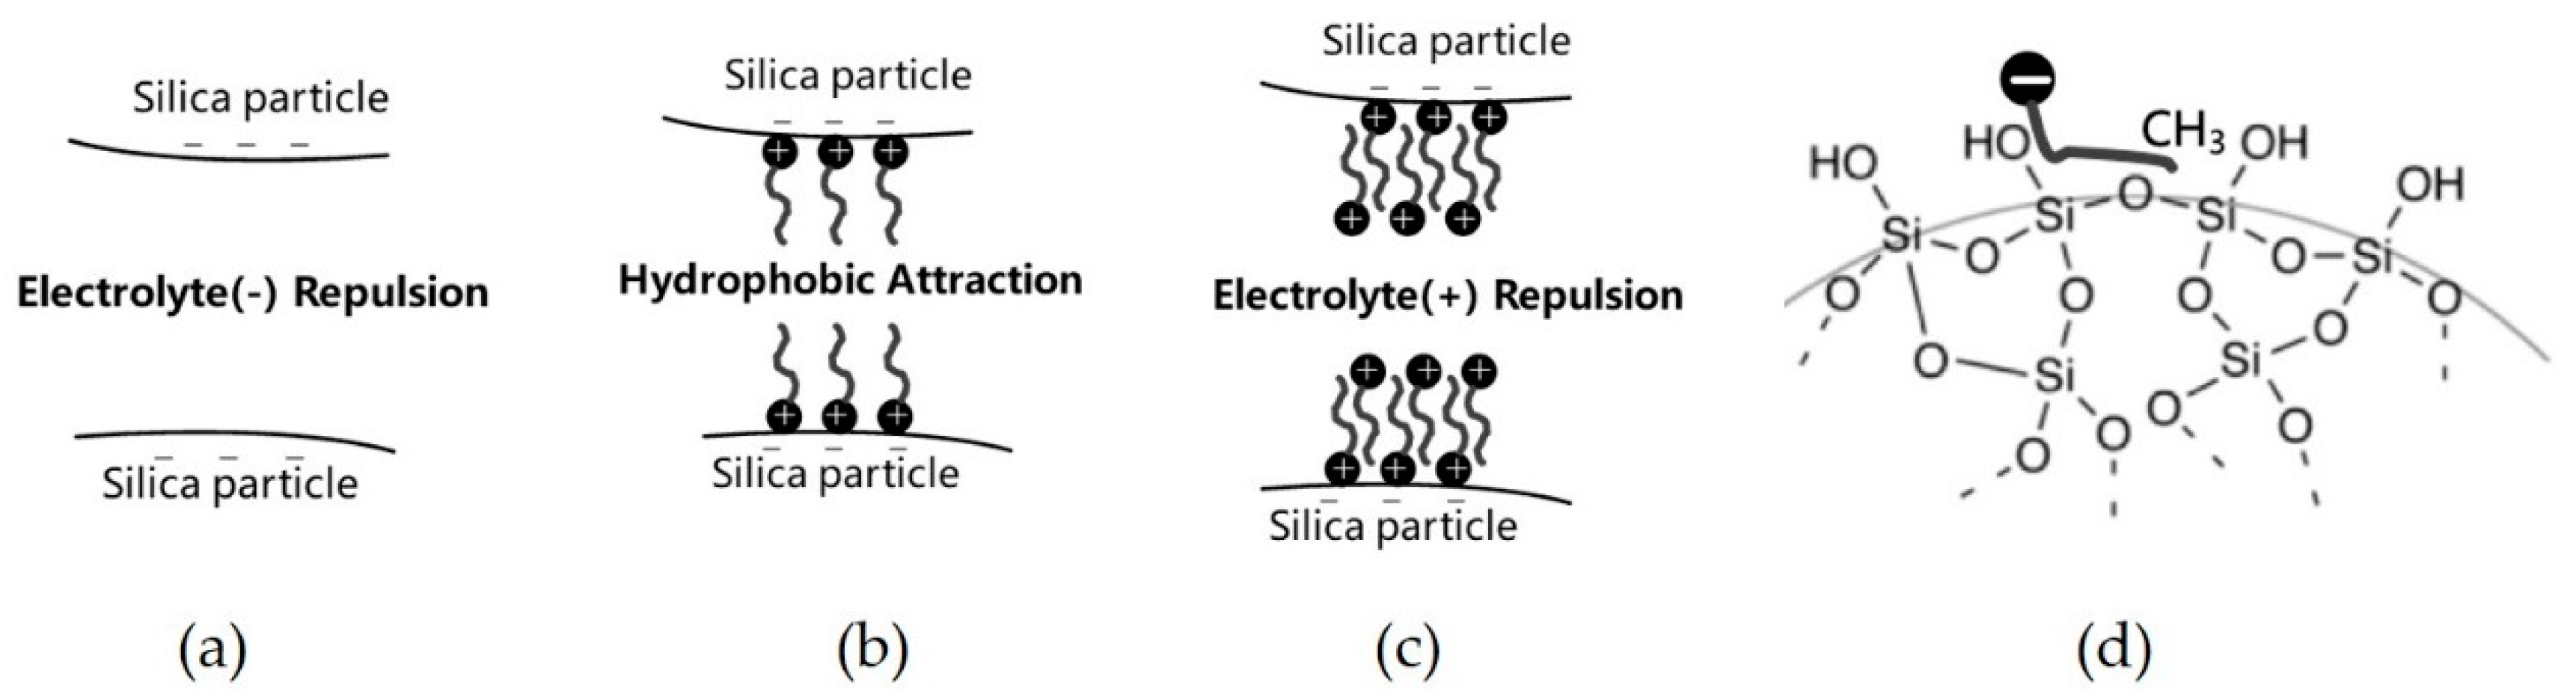
Different interactions were generated between two silica particles in different adsorption stages, which resulted in a dispersive or flocculated silica suspension. We represent this by turbidity in Figure 8. Figure 12a shows that the silica particles are repulsed by each other without any adsorption of DPC due to the relatively large electrolyte repulsion and small Van der Waals’ force, the suspension is well dispersed. At CCP, the first layer adsorption of DPC saturated the silica surface, and hydrophobic attraction made the particles flocculated. In this stage, Van der Waals’ force also contributed to the flocculation; see Figure 12b. In the last stage, bilayer adsorption makes the surfaces of silica particles electropositive, hence the suspension became dispersive again, see Figure 12c. This corresponded with Figure 8.
Figure 12d shows the adsorption mechanism of anionic surfactant on silica surface by hydrophobic interaction between surfactant tails and hydrophobic siloxane groups on the silica surface.
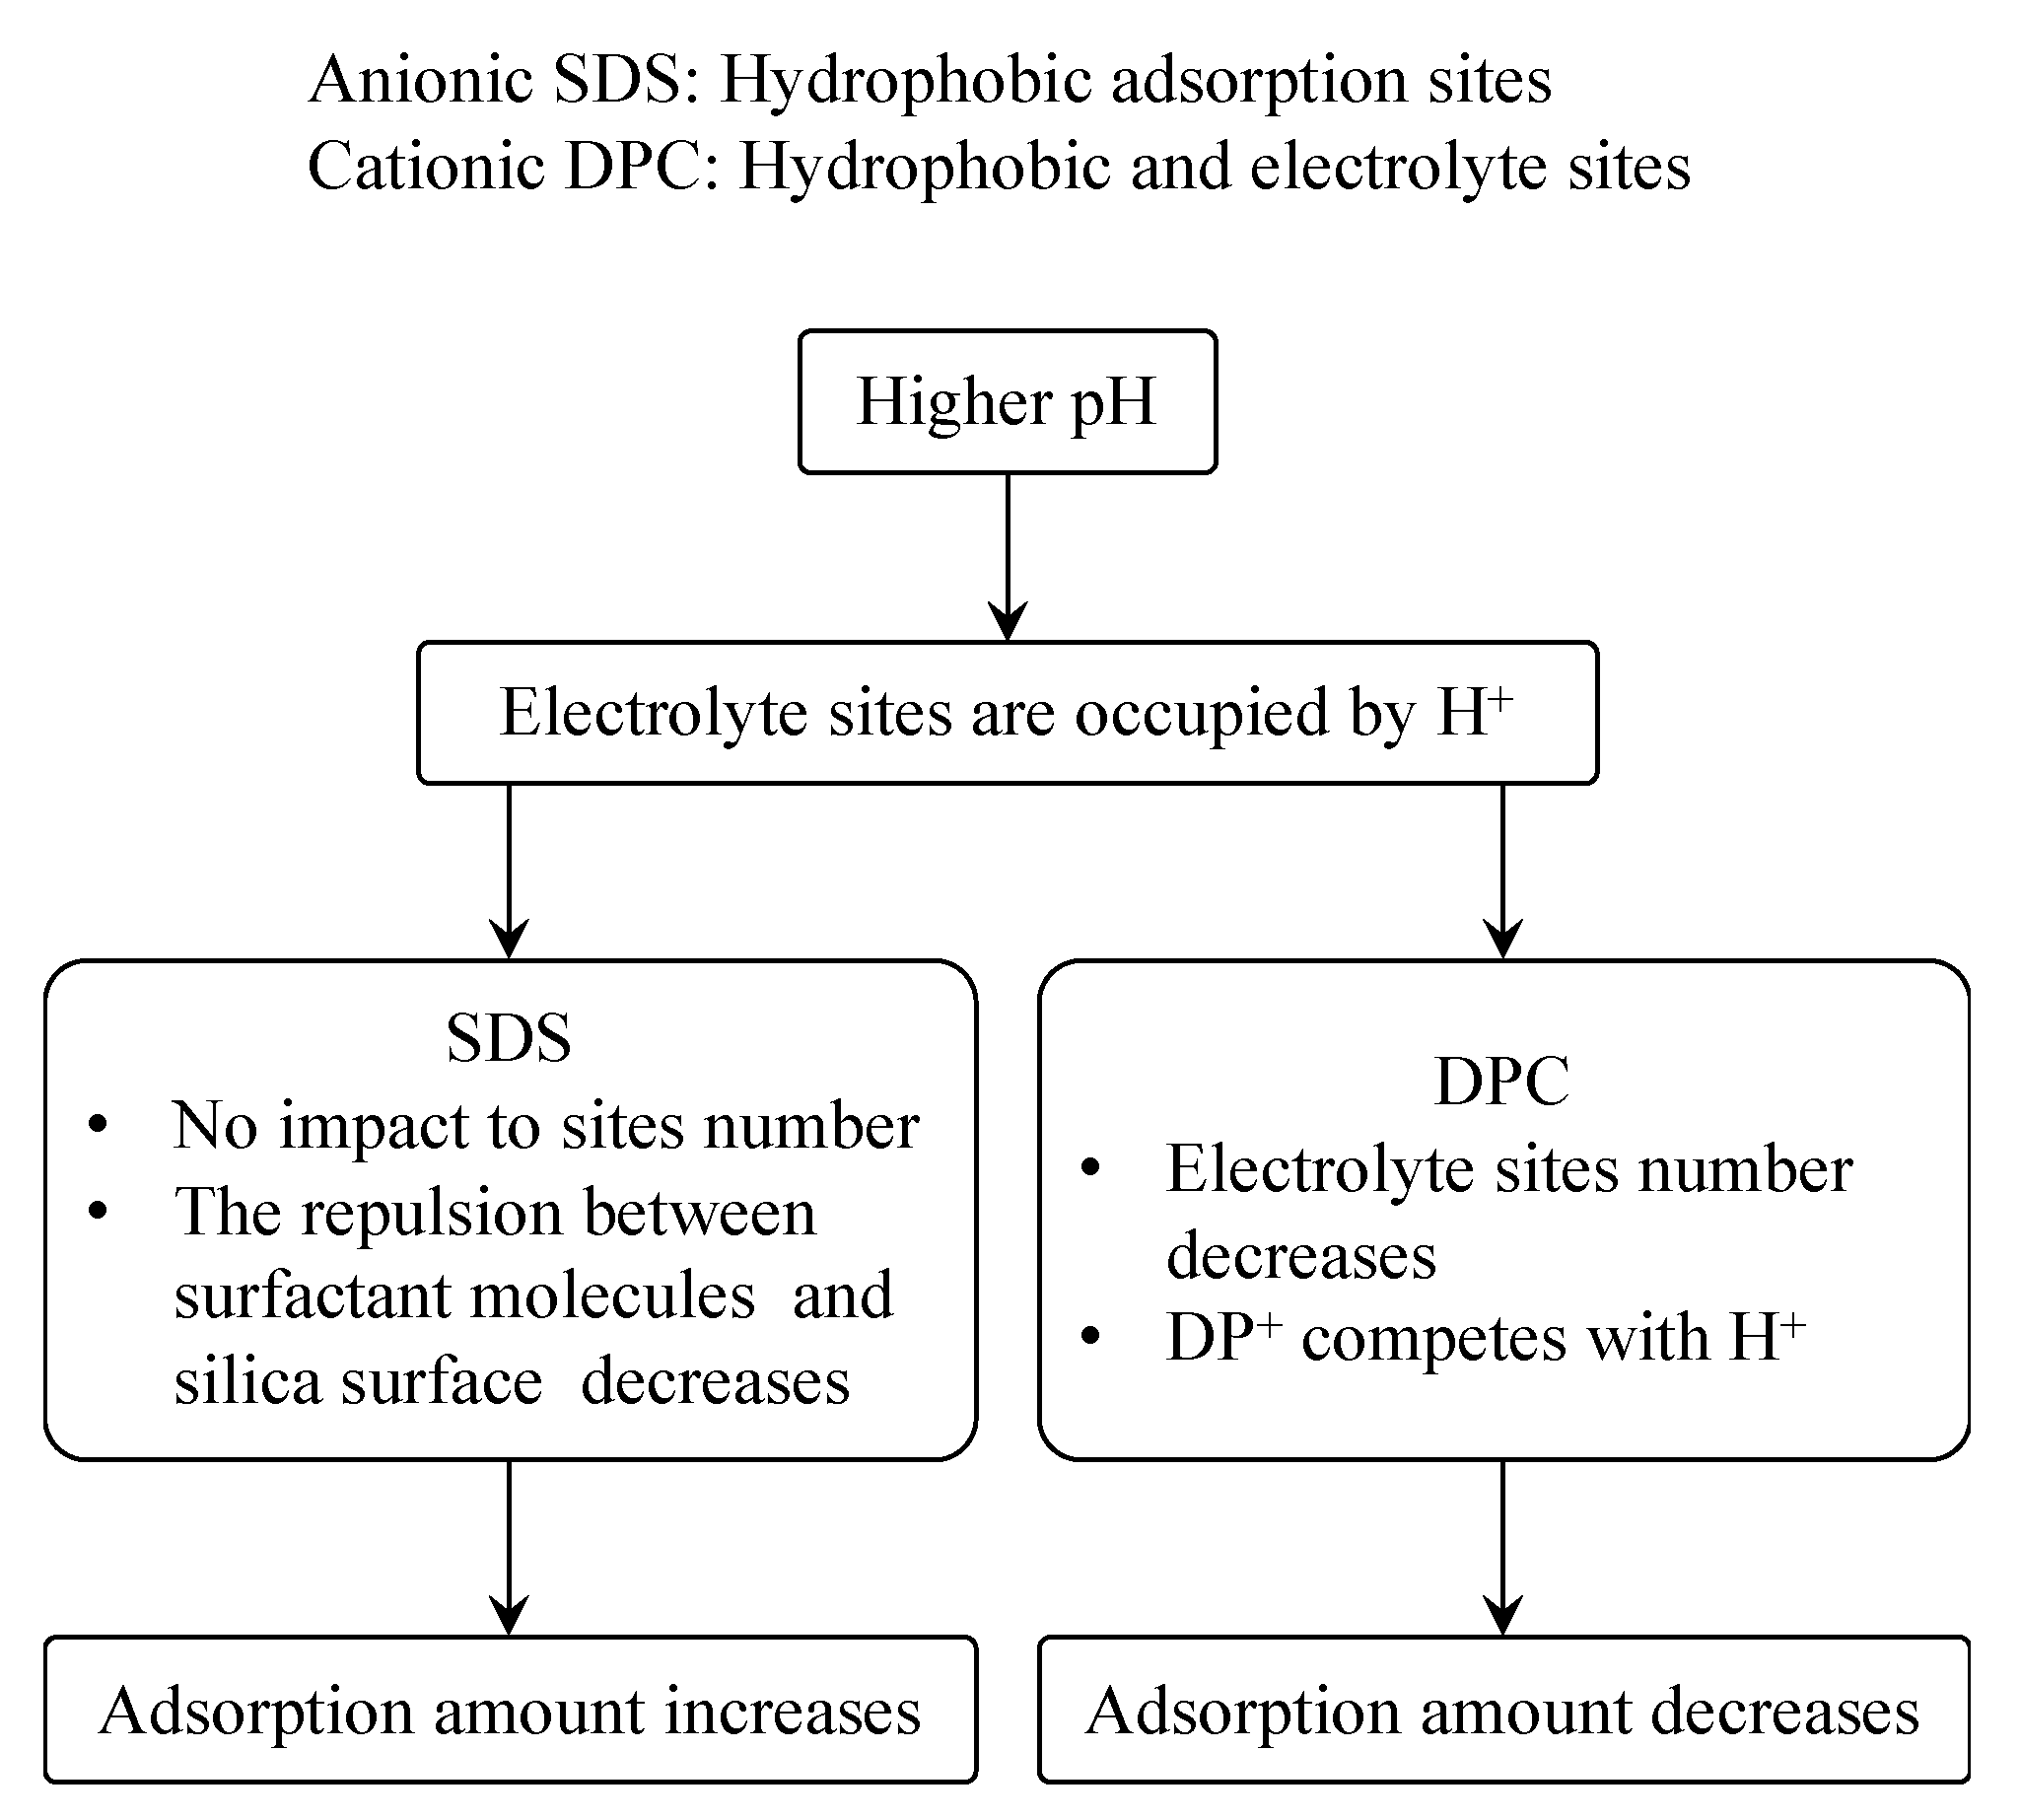
Figure 13 shows the different impact of pH to the adsorption of SDS and DPC on silica. In the SDS case, adsorption happened only on the hydrophobic sites siloxane groups, while DPC can adsorb not only on hydrophobic sites but also on electrolyte sites; when pH is high, a large number of H+ occupied the electronegative sites on silica surface; the repulsion between SDS and silica surface decreases but hydrophobic sites still remain, and the adsorption amount hence increases. For DPC, H+ and DP+ are both positive, therefore they will compete when adsorbing on the negative sites on silica surface, and thus the adsorption amount decreases.
The adsorption amount of cationic surfactant is much larger than that of anionic surfactant, whose carbon chain lengths are the same, especially on the electronegative and porous silica surface. The DPC adsorption isotherms did not show a “four-region” property; this may due to the large specific surface area and the existence of pores on silica surface. The exact mechanism could be studied in the future research by advanced methods.
5. Conclusions
At the same pH, the DPC adsorption amounts are higher when the electrolyte concentration is higher; at higher DPC equilibrium concentrations, the adsorption amount difference is larger than that at low DPC equilibrium concentrations, and when DPC equilibrium concentration is lower than 0.1 mmol/L, the adsorption amount difference cannot be observed.
At CCP, the negative surface charge of silica was compensated by DP+; a continuous increasing zeta potential indicated a bilayer adsorption of DPC on silica. The adsorption amount increased with increasing pH. Calculated lines by Gu and Zhu model show a two-step property, including a bilayer and hemi-micelle adsorption. DPC adsorbed more strongly on silica than SDS due to the combination of electrostatic and hydrophobic attraction.
This result is also useful when considering the effect of hydrophobic interaction in surfactant adsorption on silica. Hydrophobic interactions between surfactant carbon chains themselves or silica surface is a kind of helpful interaction; the essence of hydrophobic interaction comes from entropy force. The equilibrium state of an isolated system is the best compromise between entropy and energy. In an electrolyte repulsion environment, despite the electrostatic repulsion between negatively charged SDS and the silica surface, adsorption happens, and silica adsorbs SDS because it has a hydrophobic surface on siloxane. Hydrophobic interaction also acts as a main role in adsorption, while in electrolyte attraction environment (DPC adsorption on silica), it helps the surface adsorb more DPC by a bilayer adsorption.
Author Contributions
Conceptualization, P.L. and M.I.; methodology, P.L.; result analysis and figures, P.L., T.L. and Y.S.; investigation, resources, data curation, writing—original draft preparation, P.L., writing—review and editing, P.L. and T.L.; visualization, P.L. and Y.S. All authors have read and agreed to the published version of the manuscript.
Funding
This research was funded by National Key R&D Program of China, grant numbers 2016YFE0201900 and 2017YFC0403600.
Acknowledgments
We acknowledge colleagues from Tsinghua University and Hokkaido University who supported our work.
Conflicts of Interest
The authors declare no conflict of interest.
References
- Holmberg, K.; Jönsson, B.; Kronberg, B.; Lindman, B. Surfactants and Polymers in Aqueous Solution, 2nd ed.; John Wiley & Sons, Ltd.: Hoboken, NJ, USA, 2002; pp. 28–37. [Google Scholar]
- Hough, D.B.; Rendall, H.M. Adsorption from Solution at the Solid/Liquid Interface; Academic Press: London, UK; New York, NY, USA, 1983; Chapter 6; pp. 15–21. [Google Scholar]
- Koopal, L.K.; Lee, E.M.; Böhmer, M.R. Adsorption of cationic and anionic surfactants on charged metal oxide surfaces. J. Colliod Interface Sci. 1995, 170, 85–97. [Google Scholar] [CrossRef]
- Goloub, T.P.; Koopal, L.K.; Bijsterbosch, B.H.; Sidorova, M.P. Adsorption of cationic surfactants on silica. Surface charge effects. Langmuir 1996, 12, 3188–3194. [Google Scholar] [CrossRef]
- Wängnerud, P.; Olofsson, G. Adsorption isotherms for cationic surfactants on silica determined by in situ ellipsometry. Adv. Colloid Interface Sci. 1992, 153, 392–398. [Google Scholar] [CrossRef]
- Koopal, L.K.; Goloub, T.P.; Davis, T.A. Binding of ionic surfactants to purified humic acid. J. Colliod Interface Sci. 2004, 275, 360–367. [Google Scholar] [CrossRef] [PubMed]
- Ishiguro, M.; Tan, W.; Koopal, L.K. Binding of cationic surfactants to humic substances. Colloid Surf. A Physicochem. Eng. Asp. 2007, 306, 29–39. [Google Scholar] [CrossRef]
- Ishiguro, M.; Koopal, L.K. Binding of alkylpyridinium chloride surfactants to sodium polystyrene sulfonate. Colloid Surf. A Physicochem. Eng. Asp. 2009, 347, 69–75. [Google Scholar] [CrossRef]
- Ishiguro, M.; Koopal, L.K. Predictive model of cationic surfactant binding to humic substances. Colloid Surf. A Physicochem. Eng. Asp. 2011, 379, 70–78. [Google Scholar] [CrossRef]
- Nevskaia, D.M.; Guerrero-Ruız, A.; López-González, J.D. Adsorption of polyoxyethylenic nonionic and anionic surfactants from aqueous solution: Effects induced by the addition of NaCl and CaCl2. Adv. Colloid Interface Sci. 1998, 205, 97–105. [Google Scholar] [CrossRef] [PubMed]
- Huang, Z.; Yan, Z.; Gu, T. Mixed adsorption of cationic and anionic surfactants from aqueous solution on silica gel. Colloids Surf. 1989, 3, 353–358. [Google Scholar] [CrossRef]
- Somasundaran, P.; Snell, E.D.; Fu, E.; Xue, Q. Effect of adsorption of non-ionic surfactant and non-ionic—Anionic surfactant mixtures on silica—Liquid interfacial properties. Colloids Surf. 1992, 63, 49–54. [Google Scholar] [CrossRef]
- Ahmed, F.; Ishiguro, M. Effect of adsorption site potential on adsorption of sodium dodecylbenzenesulfonate in highly humic volcanic ash soil. Soil Sci. Plant Nutr. 2015, 61, 432–439. [Google Scholar] [CrossRef]
- Ishiguro, M.; Koopal, L.K. Surfactant adsorption to soil components and soils. Adv. Colloid Interface Sci. 2016, 231, 59–102. [Google Scholar] [CrossRef]
- Gao, M.; Wang, X.G.; Lv, W.F. Adsorption behaviors of branched cationic gemini surfactants and wettability in quartz–solution–air systems. Soft Matter 2020, 16, 5450–5457. [Google Scholar] [CrossRef] [PubMed]
- Atkin, R.; Craig, V.S.J.; Wanless, E.J. Mechanism of cationic surfactant adsorption at the solid–aqueous interface. Adv. Colloid Interface Sci. 2003, 103, 219–304. [Google Scholar] [CrossRef]
- Li, P.; Ishiguro, M. Adsorption of anionic surfactant (sodium dodecyl sulfate) on silica. Soil Sci. Plant Nutr. 2016, 62, 223–229. [Google Scholar] [CrossRef] [Green Version]
- Koopal, L.K.; Goloub, T.; Keizer, A.; Sidorova, M.P. The effect of cationic surfactants on wetting, colloid stability and flotation of silica. Colloid Surf. A Physicochem. Eng. Asp. 1999, 151, 15–25. [Google Scholar] [CrossRef]
- Zhu, B.Y.; Gu, T.N. Interfacial film of surfactant adsorbed at a solid/liquid interface. J. Chem. Soc. Faraday Trans. 1991, 87, 2745–2748. [Google Scholar] [CrossRef]
- Goloub, T.P.; Koopal, L.K. Adsorption of cationic surfactants on silica. Comparison of experiment and theory. Langmuir 1997, 13, 673–681. [Google Scholar] [CrossRef]
- Rosen, M.J.; Kunjappu, J.T. Surfactants and Interfacial Phenomena, 4th ed.; John Wiley & Sons Ltd.: New York, NY, USA, 2012; Chapter 3; pp. 123–201. [Google Scholar]
- Kobayashi, M.; Skarba, M.; Galletto, P.; Cakara, D.; Borkovec, M. Effects of heat treatment on the aggregation and charging of Stöber-type silica. J. Colloid Interface Sci. 2005, 292, 139–147. [Google Scholar] [CrossRef] [PubMed]
- Hofmann, U.; Endell, K.; Wilm, D. Röntgenographische und kolloidchemische Untersuchungen über Ton. Angew. Chem. 1934, 47, 539–547. [Google Scholar] [CrossRef]
- Laskorin, B.N.; Strelko, V.V.; Strazhesko, D.N.; Denisov, V.I. Sorbentsbased on Silica Gel in Radiochemistry; Atomizdat: Moscow, Russia, 1977; pp. 82–89. [Google Scholar]
Figure 1.
Chemical construction of DPC.

Figure 2.
Size distribution of the silica measured by ultrasonic attenuation spectroscopy (Colour difference means repetition).
Figure 2.
Size distribution of the silica measured by ultrasonic attenuation spectroscopy (Colour difference means repetition).

Figure 3.
Surface charge density of silica. Symbols are measured values and the solid lines are calculated values by 1-pK basic Stern model.
Figure 3.
Surface charge density of silica. Symbols are measured values and the solid lines are calculated values by 1-pK basic Stern model.

Figure 4.
Adjusted pH values and their standard deviation. (The x-axis means the adsorption points corresponding to the adsorption isotherms).
Figure 4.
Adjusted pH values and their standard deviation. (The x-axis means the adsorption points corresponding to the adsorption isotherms).

Figure 5.
Dodecyl pyridinium chloride (DPC) adsorption amounts on silica under different DPC and electrolyte concentrations at pH 5, with linear regression line and confidence interval for each electrolyte concentration.
Figure 5.
Dodecyl pyridinium chloride (DPC) adsorption amounts on silica under different DPC and electrolyte concentrations at pH 5, with linear regression line and confidence interval for each electrolyte concentration.

Figure 6.
Isotherms of DPC adsorption on silica at 0.1 mol/L electrolyte concentration and different pHs. Dotted vertical line shows the CMC (Critical Micelle Concentration) of DPC at this electrolyte concentration.
Figure 6.
Isotherms of DPC adsorption on silica at 0.1 mol/L electrolyte concentration and different pHs. Dotted vertical line shows the CMC (Critical Micelle Concentration) of DPC at this electrolyte concentration.

Figure 7.
Isotherms modeling of DPC adsorption on silica at 0.1 mol/L electrolyte concentration and different pH.
Figure 7.
Isotherms modeling of DPC adsorption on silica at 0.1 mol/L electrolyte concentration and different pH.

Figure 8.
Silica particle stability with adsorption of DPC.

Figure 9.
Zeta potential as a function of pH under different electrolyte concentrations.

Figure 10.
Zeta potential as a function of adsorption equilibrium concentration of DPC.

Figure 11.
Isotherms of SDS and DPC adsorption on silica at 0.1 mol/L of NaCl solution and different pH. SDS adsorption isotherm comes from Li and Ishiguro (2016).
Figure 11.
Isotherms of SDS and DPC adsorption on silica at 0.1 mol/L of NaCl solution and different pH. SDS adsorption isotherm comes from Li and Ishiguro (2016).

Figure 12.
Microcosmic behaviors of two silica particles in the different adsorption regions for DPC adsorption and SDS adsorption mechanism. (a) the silica particles are repulsed by each other without any adsorption; (b) hydrophobic attraction generated in case of monolayer adsorption; (c) electrolyte repulsion generated in case of bilayer adsorption; (d) SDS adsorption mechanism.

Figure 13.
Comparison of adsorption mechanism and pH impact between SDS and DPC.

© 2020 by the authors. Licensee MDPI, Basel, Switzerland. This article is an open access article distributed under the terms and conditions of the Creative Commons Attribution (CC BY) license (http://creativecommons.org/licenses/by/4.0/).
Share and Cite
MDPI and ACS Style
Li, P.; Li, T.; Ishiguro, M.; Su, Y. Comparison of Same Carbon Chain Length Cationic and Anionic Surfactant Adsorption on Silica. Colloids Interfaces 2020, 4, 34. https://doi.org/10.3390/colloids4030034
AMA Style
Li P, Li T, Ishiguro M, Su Y. Comparison of Same Carbon Chain Length Cationic and Anionic Surfactant Adsorption on Silica. Colloids and Interfaces. 2020; 4(3):34. https://doi.org/10.3390/colloids4030034
Chicago/Turabian StyleLi, Pengxiang, Tiejian Li, Munehide Ishiguro, and Yang Su. 2020. "Comparison of Same Carbon Chain Length Cationic and Anionic Surfactant Adsorption on Silica" Colloids and Interfaces 4, no. 3: 34. https://doi.org/10.3390/colloids4030034