Energy Efficiency in Industry 4.0: The Case of Batch Production Processes


1
Department of Business Sciences—Management & Innovation Systems (DISA-MIS), University of Salerno, 84084 Fisciano, Italy
2
CMS Group, 84084 Fisciano, Italy
3
Faculty of Basic Sciences and Engineering, Catholic University of Pereira, Pereira 660001, Colombia
*
Author to whom correspondence should be addressed.
Sustainability 2020, 12(16), 6631; https://doi.org/10.3390/su12166631
Submission received: 13 July 2020
/
Revised: 10 August 2020
/
Accepted: 12 August 2020
/
Published: 17 August 2020
(This article belongs to the Special Issue Sustainable Value Co-Creation)
Abstract
:We derived a promising approach to reducing the energy consumption necessary in manufacturing processes from the combination of management methodologies and Industry 4.0 technologies. Based on a literature review and experts’ opinions, this work contributes to the efficient use of energy in batch production processes combining the analysis of the overall equipment effectiveness with the study of variables managed by cyber-physical production systems. Starting from the analysis of loss cause identification, we propose a method that obtains quantitative data about energy losses during the execution of batch processes. The contributions of this research include the acquisition of precise information about energy losses and the improvement of value co-creation practices so that energy consumption can be reduced in manufacturing processes. Decision-makers can use the findings to start a virtuous process aiming at carbon footprint and energy costs reductions while ensuring production goals are met.
1. Introduction
Sustainability is an important topic for people, industry, and government, so a key objective in human development is ensuring sustainable development due to social, economic, and environmental concerns. Sustainable development is increasingly becoming a goal to which numerous countries throughout the world aspire [1]. Making development sustainable is, in general, a challenging and complex undertaking, involving factors such as technology and engineering, economics, environmental stewardship, health, and welfare [2] of people and the communities in which they live and work, social desires, and government strategies, and procedures and policies [3]. In this sense, organizations like the European Union (EU) have implemented several policies, strategies, and actions toward achieving a sustainable economy in fields like energy efficiency and renewable resources [4]. According to the literature, sustainability has been applied to many fields, including engineering, manufacturing, and design [2]. Overall, sustainability has been defined in many ways and is often considered as having three distinct components: environmental sustainability, economic sustainability, and social sustainability [1,5].
An important facet of sustainability is energy management, being one of the fields that has an important impact on the sustainability of countries as it is closely related with the economy, the environment, and society. An energy system that reduces the side effects on the environment to a level within its assimilative capacity and provides opportunities for economic and social development, taking a longer-term perspective, forms the basis of the concept of energy sustainability [6].
A promising approach to reducing the energy consumption [7] necessary for manufacturing production [8] is derived from the combination of management methodologies and Industry 4.0 technologies [9,10]. The optimization of a production process [11] can be studied by deepening the analysis of the most frequently used indicator of manufacturing performance [12]. Overall equipment effectiveness (OEE) is a key performance measure in mass-production environments and has become a common approach for measuring production equipment efficiency [13]. In this study, the OEE indicator was examined from the point of view of energy efficiency in production.
The contribution of Industry 4.0 technologies to the problem of energy saving can be considered an opportunity to improve the performance of the manufacturing process and to reduce the energy consumption [14,15] together with the emissions of into the atmosphere. In this new scenario, decision-makers can identify possible improvements in energy use and reductions in manufacturing costs [16,17].
One of the key characteristics of Industry 4.0 is the digitization of manufacturing processes. This transformation can offer solutions for energy saving, for example, through the optimization or replacement of specific technologies and the application of new software tools that also offer energy optimization functionality or adaptations in the business processes [18]. From this point of view, the Industry 4.0 concept appears appealing with regard to potentially providing a more streamlined flow of information (and thus better planning and control processes) [19], which, for the case at hand, is related to energy consumption and energy saving in the manufacturing industry. However, combining the two trends, sustainable energy and Industry 4.0, is a rather new approach that has not yet attracted much attention in research. Therefore, there are a number of opportunities to incorporate sustainable energy concepts into a digital factory [18].
We focused on energy efficiency in the context of mechanical industries, considering the contribution of OEE analysis, Internet of Things (IoT), and cyber-physical production systems (CPPSs) to achieve energy savings. Our approach combines the analysis of OEE together with the study of measured variables managed by the CPPS such as process cycle time and energy consumption. Starting from the standard OEE analysis that aims the loss cause identification, we propose a method that obtains quantitative data about energy losses during the execution of batch processes. The paper is structured as follows: After some preliminary definitions concerning the manufacturing system organization, the OEE indicator, and the machine tool model, Section 3 discusses the research methodology together with the adopted multi-disciplinary analysis. Section 4 presents the investigation results and Section 5 describes a case study in the automotive industry in which the concepts mentioned in the previous sections are applied. Finally, the discussion about the findings and future work closes the paper.
2. Preliminary Definitions
2.1. Manufacturing System Organization
Manufacturing activities can be considered as being composed of multiple levels, from the level of the individual devices where unit processes occur, through to that of the enterprise, incorporating all the activities in the manufacturing system, including supply chain externalities [20]. From this perspective, [21] the organization of the system is structured in five levels:
- Device/unit process: Individual device or machine tool in the manufacturing system that is performing a unit process. Support equipment of the unit process is included here [22].
- Line/cell/multi-machine system: A grouping of machines organized in a line layout (multiple workstations arranged in sequence, and the parts or assemblies are physically moved through the sequence to complete the product) or cellular layout (consisting of several workstations or machines designed to produce a limited variety of part configurations, specializing in the production of a given set of similar parts or products) [23].
- Facility: The relative location of equipment and/or work centers on the factory floor [24].
- Multi-factory system: Different facilities whose proximity to one another allows them to use of possible synergies in terms of reuse of waste and lost energy streams [21].
- Enterprise/global supply chain: The flow and transformation of goods (as well as the flow of the associated information) from the raw materials stage to the end user, including the supplier’s supplier and the customer’s customer. This flow of goods and information may encompass several different facilities (plants, warehouses, sales, and distribution centers) belonging to several different business entities located in various parts of the globe [24].
With regards to the production methods, we refer here to the batch production defined in ISA 88 standard as “a process that leads to the production of finite quantities of material by subjecting quantities of input materials to an ordered set of processing activities over a finite period of time using one or more pieces of equipment” [25].
With regards the type of batch production, in the case study, we refer to a scenario immersed in the discrete manufacturing industries, in which “a batch is a certain quantity of work units, and the work units are usually processed one at a time rather than all together at once” [23].
To study the joint contribution of the OEE and cyber-physical systems (IoT) to the problem of energy efficiency, some fundamental definitions and a machine tool reference model in the literature are reported.
2.2. Overall Equipment Effectiveness (OEE)
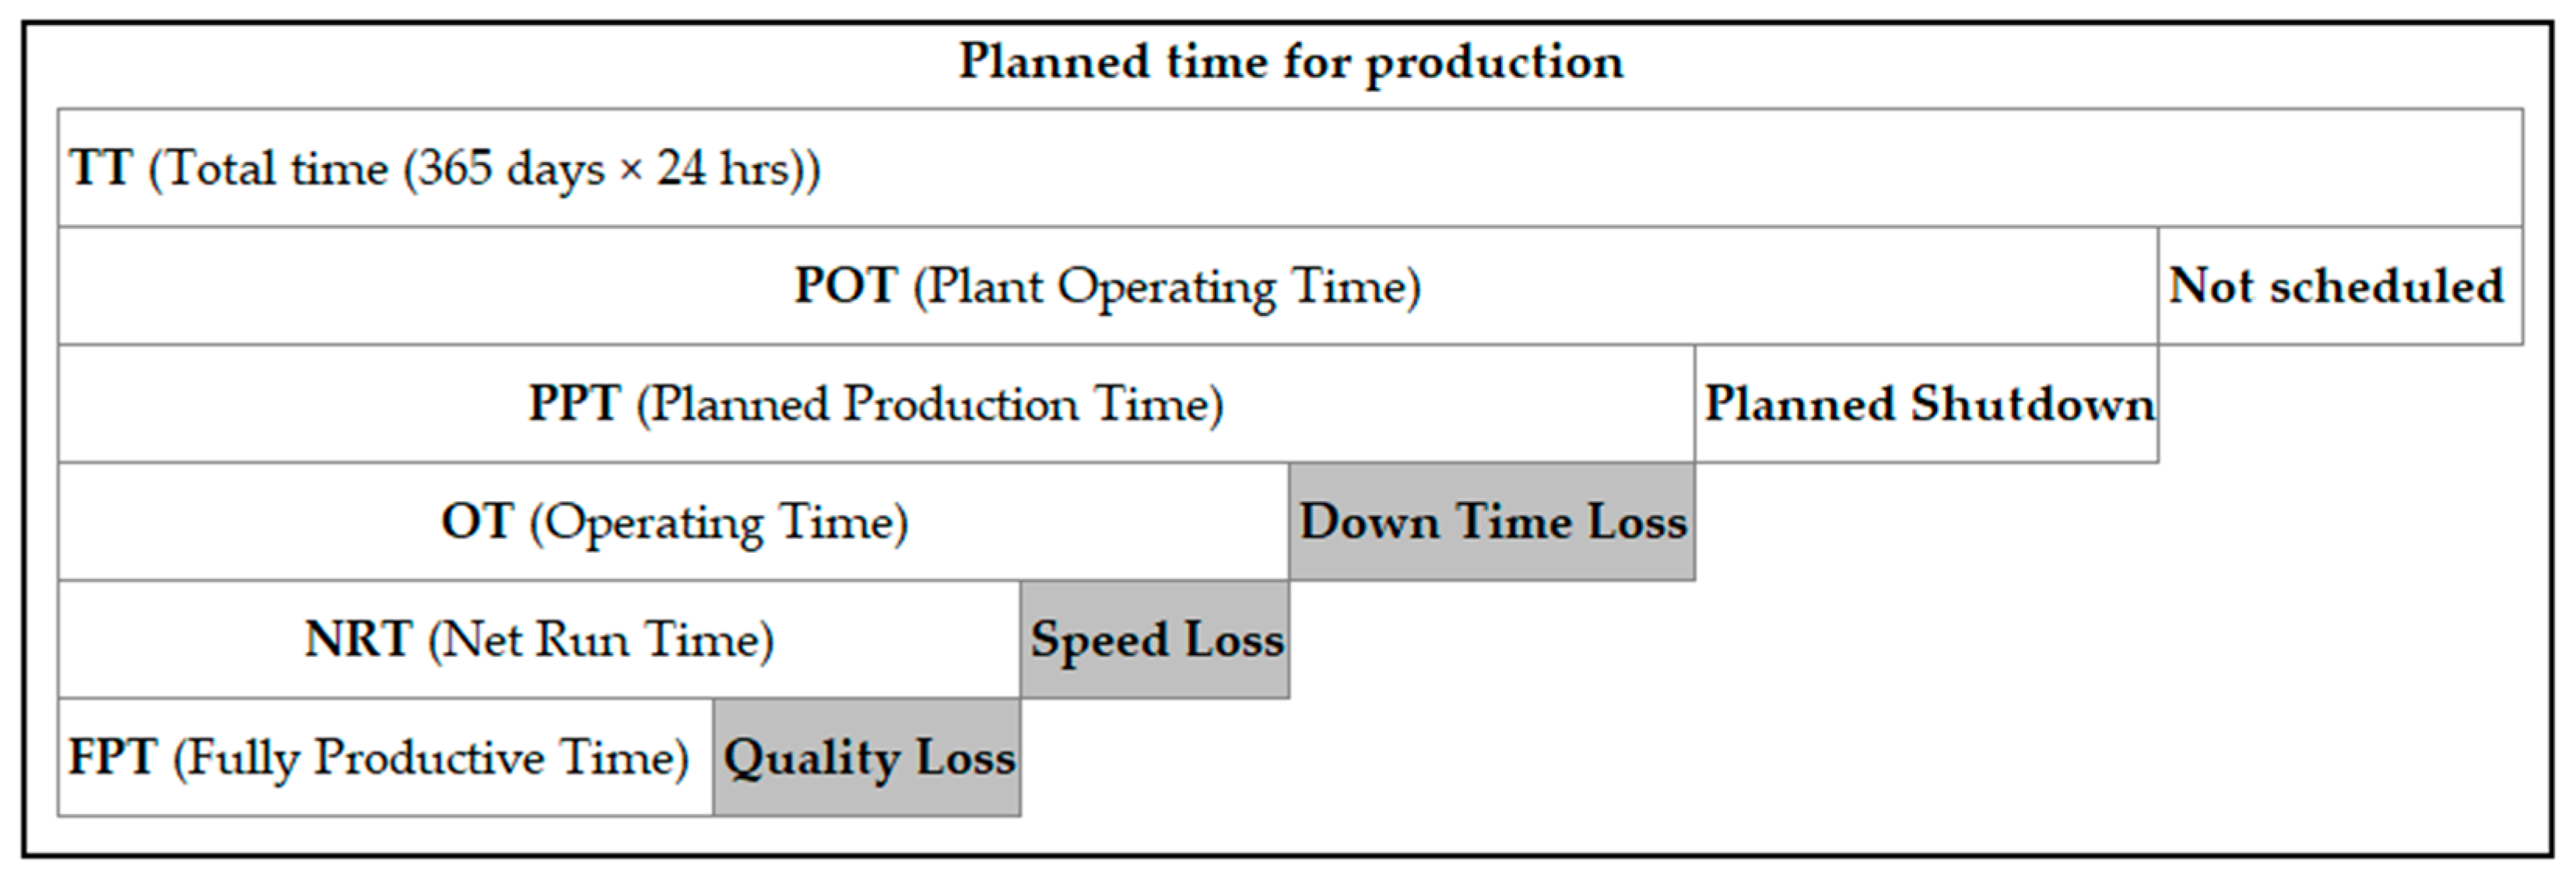
OEE is “the gold standard for measuring manufacturing productivity” [26]. It identifies the percentage of manufacturing time that is truly productive. An OEE score of 100% means only good parts are being manufactured, as fast as possible, with no stop time. In OEE language, that means 100% quality (only good parts), 100% performance (as fast as possible), and 100% availability (no stop time).
OEE was introduced by Nakajima [11] within the context of total productivity maintenance (TPM) and is directed to equipment/machines [13]. Figure 1 shows the time intervals for the computation of OEE.
Considering OEE as an index that measures the production efficiency of the machine in the established time, it can be used to determine time losses. OEE is a measuring tool used to determine the effectiveness of the machine as a whole. It is obtained by the multiplication of availability (A), performance efficiency (P), and quality (Q) [27]:
2.2.1. Availability
Availability is the fraction of the total time that the equipment is in a condition to perform its intended function [12].
2.2.2. Performance
The fraction of equipment uptime is when the equipment is processing actual units at theoretically efficient rates [12]. The theoretical cycle time, also known as ideal cycle time, is the minimum time to complete processing on one unit of production, assuming no efficiency losses are present, which is expressed as :
2.2.3. Quality
The rate of quality was defined by Nakajima [11] as the ratio between the number of good pieces and the number of pieces produced. For the purposes of this work, we use the definition of quality efficiency (Q) [12], which is given by the ratio between the time necessary to produce elements that are not wasted and the net run time in which good parts and defective parts are produced.
2.3. Machine Tool Model
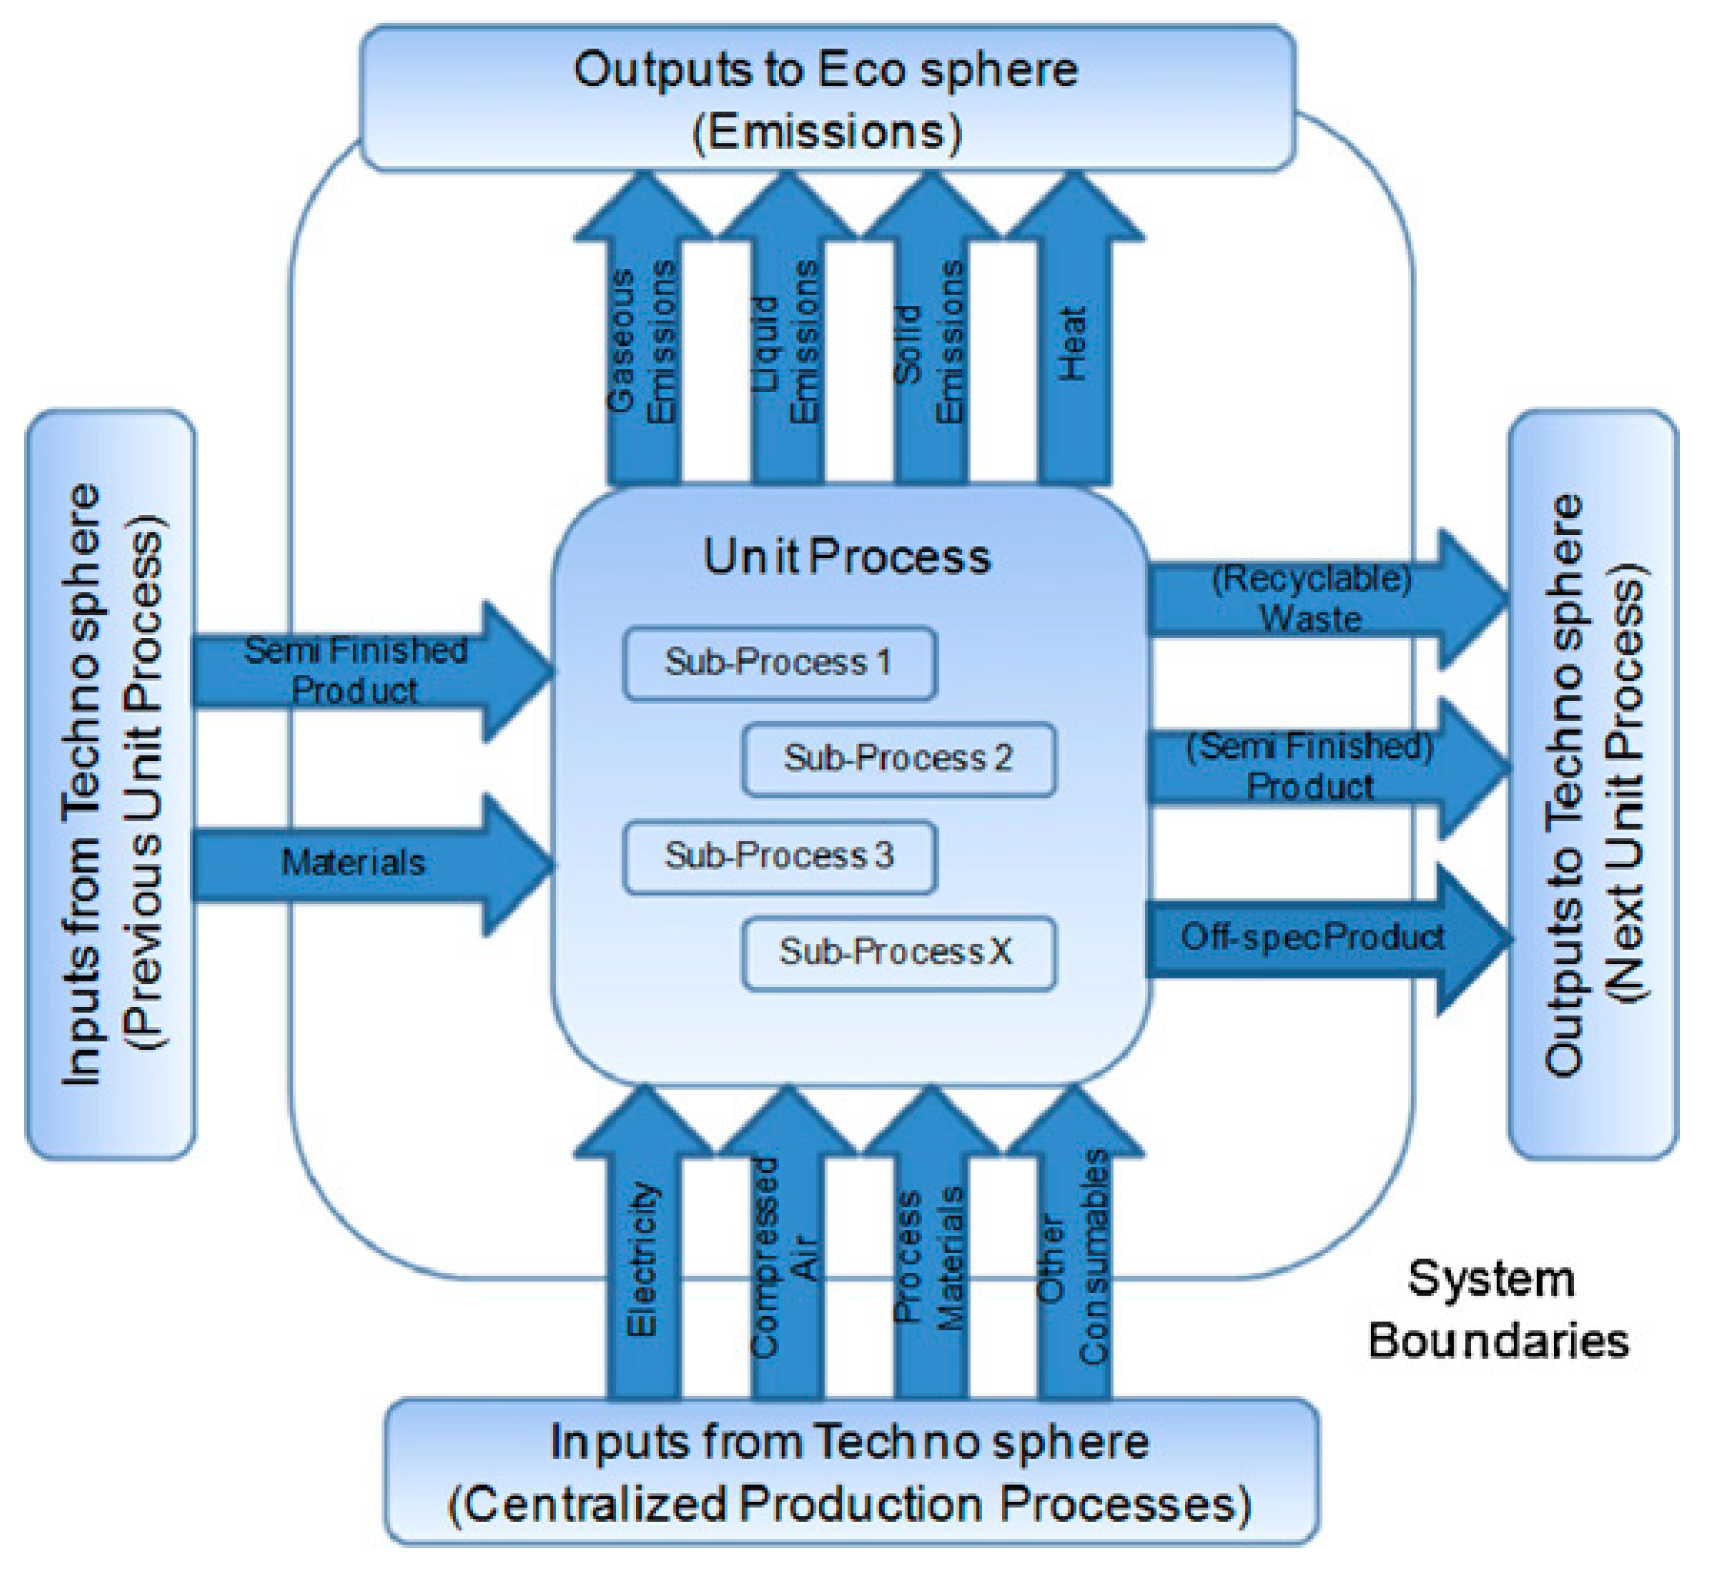
According to Schmidt et al. [28], four different levels (factory, process line, machine, and product) should be distinguished during the indicators design process to track a company’s performance in the respective area of focus. In relation to the unit process, Duflou et al. [21] stated that it typically coincides with individual machine tools as the smallest unit of which production systems are composed. In this approach, hybrid workstations, combining multiple processes on a single machine structure, can be considered as the sum of multiple individual unit processes that can be analyzed separately, as shown in Figure 2.
Figure 2 shows that to execute a unit process such as a piece transformation using a single machine, raw material or a semi-finished product form the inputs from the environment. Technical inputs like energy and other consumables are required. During the execution of the process, different types of emissions (gaseous, liquid, solid, and heat) are produced as outputs in addition to the product and recyclable waste. According to some preliminary environmental studies for machine tools in material removal processes [30], when the process is executed, more than 90% of the environmental impact is due to the consumption of electrical energy.
Abele et al. [31] described a method for life cycle inventory analysis of production processes using theoretic equations to calculate the energy and resource consumption as well as waste and process emissions. The general formula for the total energy demand during production is
where is the active energy theoretically needed to obtain the physical process effect and represents the minimum energy demand of the production process, and and are the additional energy demands of the machine tool (e.g., energy to cover efficiency losses or energy for machine functions such as central control) and peripherals (e.g., cutting fluid pump), respectively.
3. Literature Review
With the objectives of determining how the OEE indicator has been used in the manufacturing industry, in which factory layout it has been implemented, how this is related to Industry 4.0, IoT, or cyber-physical systems (CPSs), and the contribution of these elements to the value co-creation in this industry, we reviewed the literature. Based on these questions, a set of keywords was defined (Table A1, Appendix A) to perform the search on different databases like Elsevier, Emerald, IEEE, Springer, and Taylor and Francis, among others. The scope of the search was limited to “Article” published, written in “English” between 2015 and 2020, and belonging to fields of study related to industry and engineering. Similarly, only articles with more than 20 citations were considered. We used the article title, keywords, and abstract search fields. The number of results was refined after eliminating duplicates and excluding articles that only mentioned the term but did not deepen its use or that did not refer to the problem of energy consumption and saving in the industry.
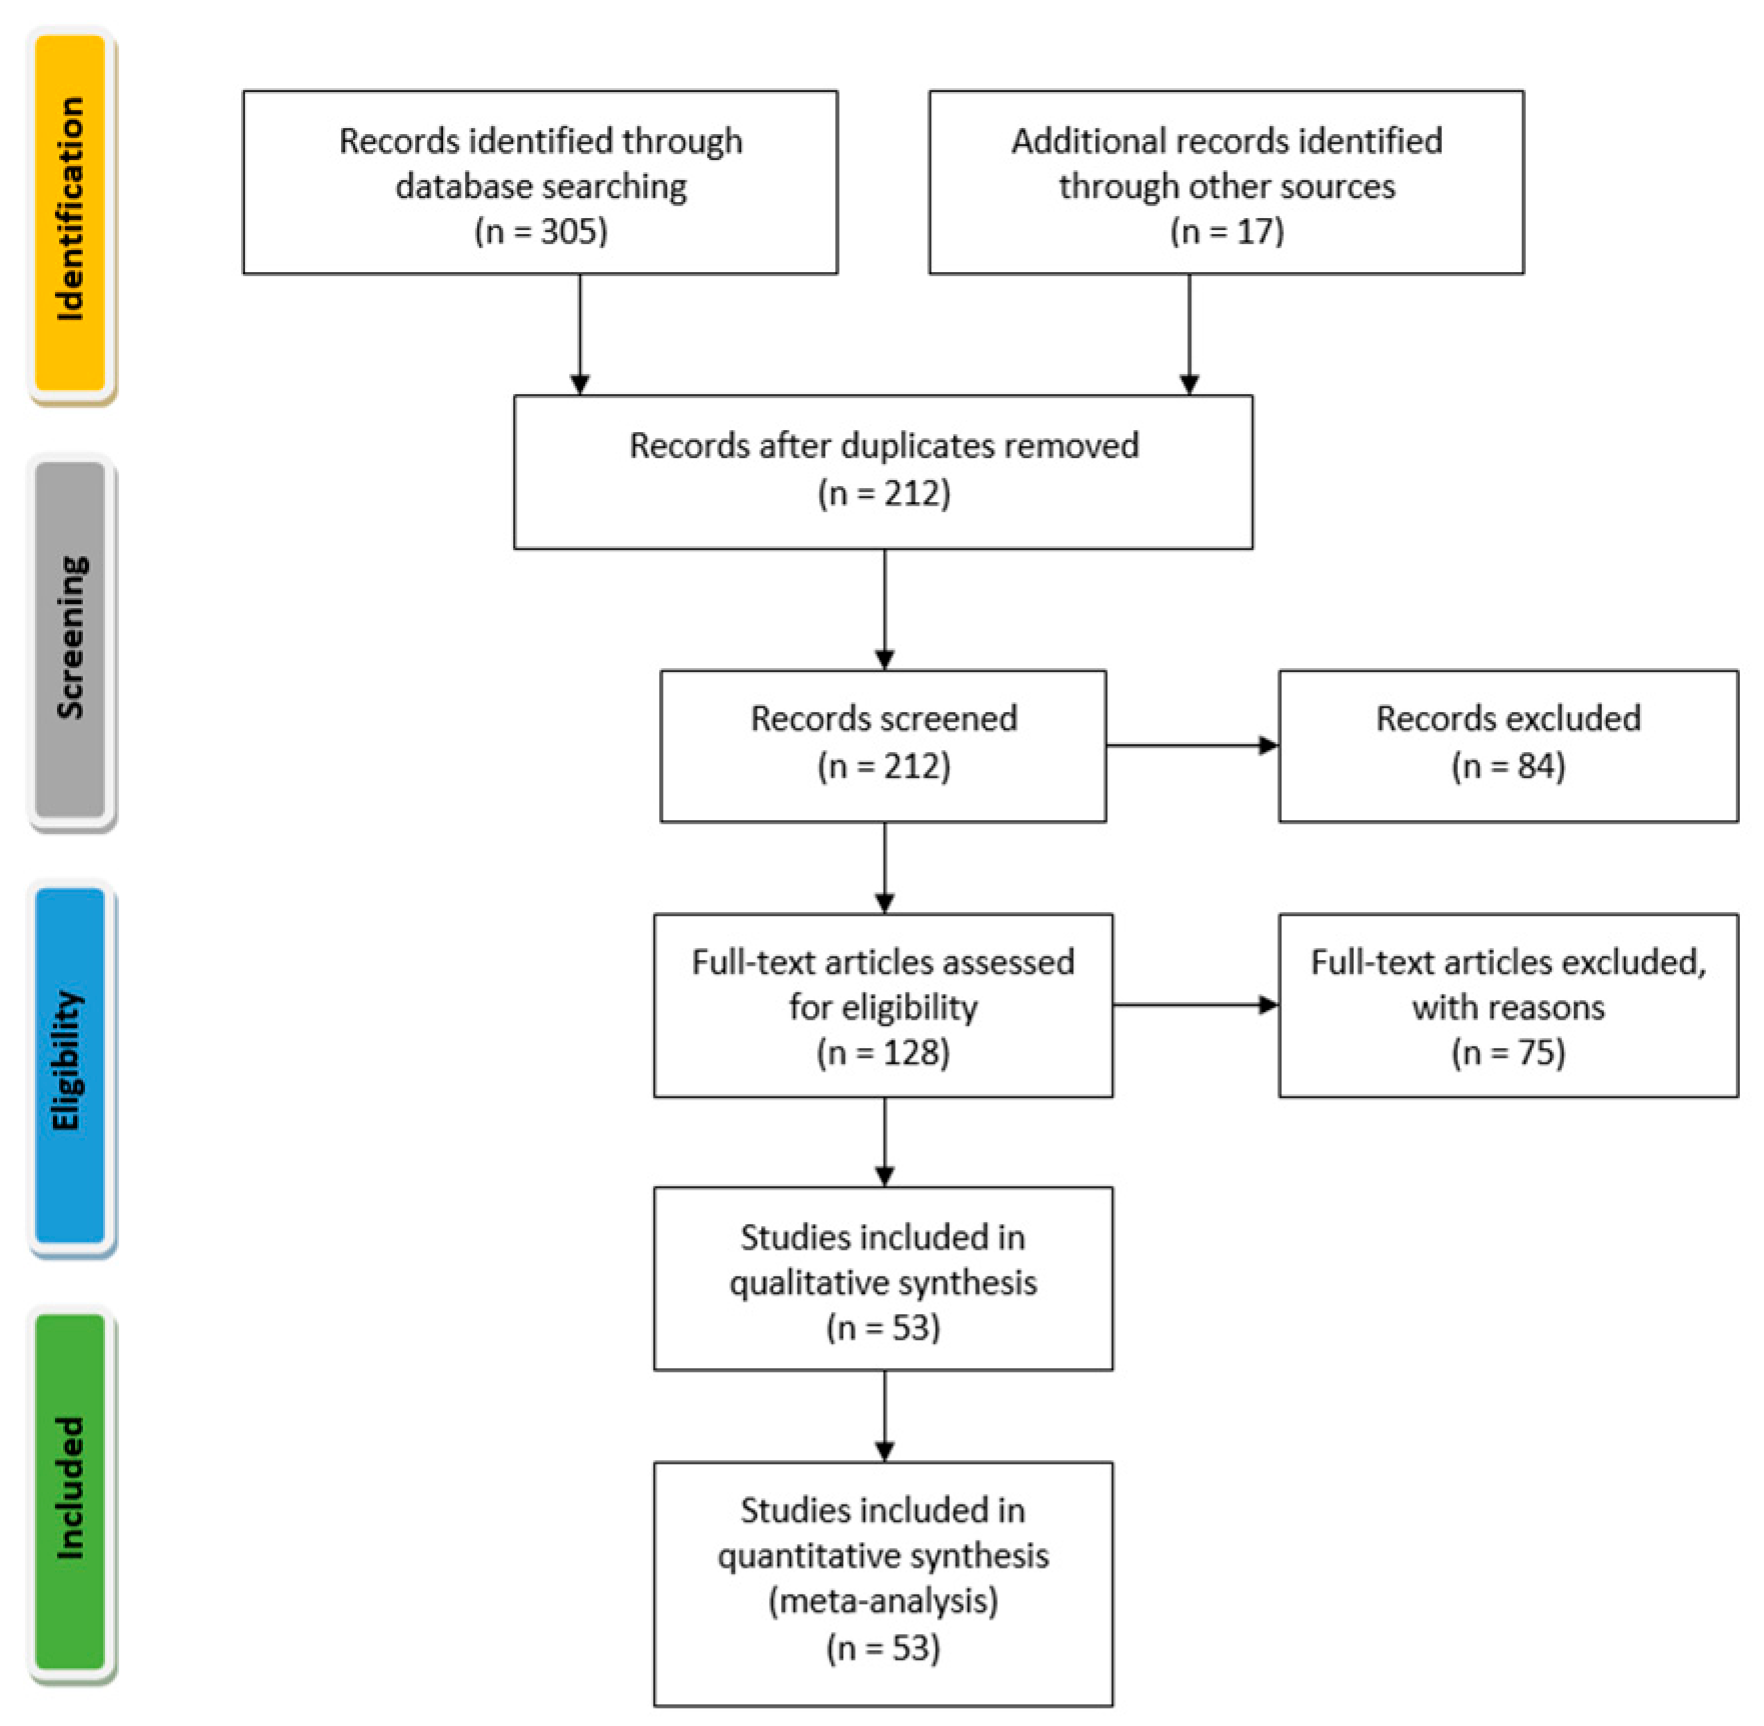
The PRISMA [32] method (Figure 3) was used to ensure a systematic review. Figure 3 shows that 212 records were obtained after duplicates removed, 84 of which were excluded after reviewing their abstract and general structure, including 7 without open access and the others because, although they matched the search terms, the meaning of the terms referred to topics other than the focus of our study. For example, the “OEE” search term, which in our case of interest means “overall equipment effectiveness,” may also correspond to “open-ended evolution,” “output Euler equation,” “oxygen evolving enzyme,” “oil extraction efficiency,” “operational efficiency and effectiveness,” and “enterprise energy observatory,” among others. Likewise, 75 articles were excluded after full-text access since they mentioned the search term but did not develop it in greater depth in the content or did not refer to the industry problem dealt with in the investigation.
Once the literature search was complete, the papers were classified into three macro-categories (Appendix B): management (Table A2), technology (Table A3), and value co-creation (Table A4). The content analysis of the cited papers confirmed that there is a research need for the area that combines standard methods such as OEE with technological development, especially concerning the usage of cyber-physical systems. Our research proposal addresses a subject that is not sufficiently covered in the industry literature: improving energy efficiency in batch production systems.
3.1. OEE for Energy Management
OEE for energy management of devices, machines, or unit process was previously studied [33,34]. In Bougain et al. [33], an OEE analysis was performed to set energy demands of machining tool processes with other resources, such as personnel available, as a planning factor for production planning software. The purpose was to construct energy management strategies for minimizing the energy consumption and the energy costs of the production for each machine by implementing manufacturing execution system (MES) software. An improvement in the OEE and a reduction in the energy consumption in the non-ferrous diecasting industry were achieved by Müller et al. [34]. OEE analysis was used to identify the machines with below-average availability and the most common causes of malfunction. These considerations were also presented for the factory level.
For facility, shop floor, and plant layout [35], different types of Key Performance Indicators (KPIs) were studied that measure energy, raw material, maintenance, and control performance, among other sectors, in the industry. The OEE analysis, as the main KPI, was used to propose a method that improves the performance of the industry.
Regarding enterprise and global supply chain layout, Domingo et al. [36] proposed a new metric describing the sustainability improvements achieved relative to a company’s initial situation after implementing a lean and green manufacturing system. In addition to the availability, quality, and performance covered by the OEE, the overall environmental equipment effectiveness (OEEE) incorporates the concept of sustainability based on the calculated environmental impact of the complete product life cycle, allowing sustainability to be integrated into business decisions.
3.2. Optimization Process in Manufacturing Management
The optimization process in manufacturing at the device, machine, or unit process level is where we found the largest number of articles in the literature. For this part of the literature, energy saving is one of the possible benefits, as more efficient processes consume fewer resources with the same output produced. Some studies focused on the fundamental conception of Industry 4.0 and the state of current manufacturing systems. The research gaps between current manufacturing systems and Industry 4.0 requirements were identified in Lourenço et al. [37]. Concerning the measure of energy consumption and optimization of production processes, Rehe et al. [38] showed an automated OEE calculation through a CPS used for interpreting and transmitting the actual machine status from sensors to an MES.
Yazdi et al. [39] studied the implementation of a sustainable and intelligent material handling system for material distribution considering the energy intensity management. To do this, OEE was evaluated to identify the matters that need to be resolved and optimized to increase the OEE percentage considering the sustainability of the system. In addition, the study aimed to recognize and analyze effective factors on the sustainability of improved processes. Yazdi et al. [40] provided information about the development of an intelligent material handling system (MHS) for automobile parts distribution. The OEE approach was applied to evaluate the system performance and provide some solutions for its optimization.
Durán et al. [41] proposed a technique based on OEE analysis to establish maintenance priorities on a set of physical assets, as equipment that forms a production system, considering the impact on the overall throughput of the production system. The intention was to measure the effects of maintenance decisions and actions (availability), as well as the operational implications (productivity and use).
De Ron et al. [13] evaluated OEE and effectiveness (E), investigating the influences of use, downtime, and rework, as well as the sub-metrics availability, efficiency, and performance efficiency, also pointing to the optimization process in manufacturing management. As a result, they explained that the main difference between OEE and E is the use of an equipment: integrated with other structures or stand-alone. This means that OEE measures the effectiveness of equipment including effects from other equipment in front of and at the end of the equipment of interest, whereas E just measures the effectiveness of stand-alone equipment.
Regarding OEE into production lines, Creutznacher et al. [42] investigated the risk faced by companies after using automation on the production line when dealing with machine breakdown, concluding that OEE is one of the best measurement methods for managing automation since it facilitates the planning of strategies that ensure automation of the production line without a decrease in performance of productivity and quality.
For the facility, shop floor, and plant levels, Durán et al. [41] performed an OEE analysis of the production planning to change production volumes and optimize material flow, Graham et al. [43] proposed incorporating OEE aspects together with an indicator of environmental performance at the factory level. These analyses confirmed the significant savings potential in energy consumption and OEE losses for the given target capacity.
OEE for optimization in enterprise and global supply chain levels were studied [39] as an energy consumption indicator (production engineering KPI) to evaluate how effectively a manufacturing operation is used. Equally, Yazdi et al. [40] used OEE for measurement and optimizing of manufacturing system performance in Small and Medium Enterprises (SMEs), to create competitive advantages as a result of reducing unsustainability.
Similarly, Domingo et al. [36] evolved the OEE concept to OEEE to evaluate the environmental impacts of the production process regarding green and lean manufacturing. The OEEE allows sustainability to be integrated into business decisions, and compares the environmental impact by identifying the improvements undertaken in the company’s processes.
3.3. Asset Management in Operations and Logistics
For the device/machine/unit process level, Lourenço et al. [37] used Multi-layer stream mapping to assess the overall efficiency and waste of a production system through OEE to increase the resource efficiency and operational production efficiency. Kuznetsov et al. [44] analyzed the equivalence assessment method to determine the resource efficiency of equipment, technologies, and production systems through an OEE indicator, considering energy efficiency and productivity of equipment and production systems. Along the same line, Durán et al. [41] proposed a technique to prioritize maintenance actions and production sustainability on a set of equipment (physical assets) that form a production system based on OEE analysis. Adolph et al. [9] performed a systematic identification of value-added shares in material supply, considering the human factor, starting from OEE to overall commissioning effectiveness analysis.
For multi-factory systems, a CPS and Industrial Internet of Things (IIoT) for self-organizing configuration for collaborative production logistics were proposed by Segura et al. [45] and supported by Zhang et al. [46], considering the intelligent modeling of manufacturing resources in the infrastructure layer and the self-organizing configuration of smart manufacturing service groups.
3.4. Facilities Management, Materials, and Equipment Management
Focusing on device, machine, and unit processes, other authors [39,40] mentioned above conducted related studies, mainly aimed at improving the energy efficiency of equipment and manufacturing systems to achieve more effective control and fostering continuous improvement of manufacturing performance [47]. In addition, Creutznacher et al. [42] investigated the relationship between energy consumption and OEE for improving manufacturing systems’ productivity, by analyzing material and capacity planning, to change production volumes and ensure optimal operation. Thiede et al. [48] presented learning factory strategies for the efficient automation of industrial processes, helped by CPS for monitoring and control of workshop, shop-floor, and supply chain levels. Purba et al. [27] investigated OEE from the analysis of six big losses in a manufacturing company based on the total productive maintenance method to solve problems related to the effectiveness of the equipment. For facility management in multi-factory systems, some IoT and CPS solutions were presented [49] for planning, monitoring, and optimizing production processes and logistics in manufacturing facilities.
3.5. Energy Management
For the energy management problem, Shrouf et al. [50] proposed a generic method for energy-efficient and energy-cost-effective production at the unit process level, to conduct energy-cost-aware job scheduling on a machine. Zhang et al. [51] outlined the use of IoT for energy management in production (planning, monitoring, and control) at device, machine, and production line levels.
At the facility/shop floor/plant level, Zhong et al. [52] studied the implications of IoT and CPS on the sustainable energy management. Along the same line, a big data-driven analytical framework was proposed [16] to reduce the energy consumption and emission for energy-intensive manufacturing industries through IoT and CPS, just like Bonilla et al. [53] who proposed IoT solutions for manufacturing shop floor optimization and scheduling to improve energy and production efficiency.
For the enterprise/global supply chain, a framework of the Industry 4.0 intelligent manufacturing systems (smart design, smart machines, smart monitoring, smart control, smart scheduling) was presented [50], as well as the benefits of its implementation for energy management.
3.6. IoT Contribution (Monitoring, Control, Energy Management)
IoT for energy management in production (planning, monitoring, optimization) for device, machine, production lines [51], facility/shop floor/plant, and multi-factory systems levels has been further studied [52,53,54]. IoT and CPS contribute to the product value chain and business strategies [55] or product life-cycle energy management applications that seek to contribute to better energy management in different phases [56], as also studied [57] for enterprise/global supply chain levels.
3.7. CPS Contribution (Planning, Optimization, Energy Management)
Cyber-physical systems have considerably contributed to industry. Some of those included in this literature review focused on new methodologies implemented in a software platform to support the design of hybrid assembly lines in the automotive industry [58]. At the machine level, [59] for example, energy measurement as a KPI and software developments [60] were used to optimize design production lines; simulation-based decision support systems were introduced for supporting the disruption management process in cyber-physical production systems [61]. CPS and IoT devices were used as sensors to monitor material flow [62] and failures at the machine level for energy management, monitoring [63], and control of vibrations [48].
For line/cell/multi-machine systems, Liu et al. [64] considered the implementation of cyber-physical production systems (CPPSs) in a production line for energy demand management, Nagy et al. [55], the contribution of IoT and CPS was related to the product value chain. Contributions at the facility/shop floor/plant, and multi-factory supply chain levels, related to remote monitoring [49], energy consumption [65], facility management [66], and intelligent manufacturing were also provided [57]. CPS for production planning and control in the manufacturing [67], assembly, and logistic processes were studied [57,68] in both industrial and academic scenarios.
3.8. Value Co-Creation
Co-creation was developed in the early 2000s as a management paradigm to allow companies and customers to create value through interaction [69]. According to Prahalad et al. [70,71,72] and Vargo et al. [73] who started with the seminal works in this field in capitalist economies, “value is usually determined before a market exchange takes place.” From the co-creation perspective, suppliers and customers are, conversely, no longer on opposite sides, but interact with each other for the development of new business opportunities [69].
Mele et al. [74] stated that resources and learning processes are thus the foundation for the value-creation processes of service systems, and identified four key dimensions in the resources that enable such learning processes: (i) customers, (ii) people, (iii) information, and (iv) technology. They further argued that these four key dimensions interact in a network of relationships that co-create value through the integration of resources.
Regarding value co-creation and sustainability, Brozović et al. [75] presented an analytical framework based on a review of the literature combining value creation in service-dominant logic and sustainability to chart the value creation process of firms excelling in sustainability. According to the author, value is associated mainly with actors as the recipients of sustainable development initiatives [76] and business activities focused not only on financial issues but also on including other aspects of value, such as social value [77] and environmental value [78].
Ueda et al. [79] considered the value-creation as classes associated with service, product, process, and organization management as part of a model. At the process level, problem-solving can be performed smoothly by Kaizen [80], Just-In-Time (JIT) [81], and the like, due to the implicit knowledge and the collective cooperation principle in the workplace without scientific theorization of the problems, which also contributes to a co-creative decision-making process through mutual interaction between varieties of agents (human, artifact, organization, etc.). This aspect was also addressed by Uhlmann et al. [82].
Driven by sustainability-oriented purposes, value co-creation in manufacturing scenarios has been studied from different perspectives, such as decision-making [79]; information technologies [83] principally supported by IoT, CPS, and cloud computing; and resource integration [82] as one solution to decrease negative sustainability impacts of manufacturing equipment, by reducing energy consumption, material consumption, and logistics costs.
In addition, value co-creation for optimization [84] has been considered to produce further streamlined efficiency and effectiveness in data management flow, problem-solving [85], and performance [86], creating robust and relevant applied professional knowledge and competence [87], procedures, facilities, and equipment [88].
4. Results
4.1. Impact Variation in Industrial Production
Industrial production involves the transformation of raw materials into a different product using resources from the environment. To make industrial production sustainable, it is necessary to consider the impact of transformation on the environment. Once the production volume has been established in a given period, a theoretical environmental impact () of the production of a good can be defined as the minimum amount of resources needed to produce it. There may be factors that increase its value, leading to an actual impact (); therefore, it is possible to define the impact variation () as
If the process is the transformation of raw material into a product with machines, it is possible to use an already known indicator for the evaluation of inefficiencies and correlate it to the factors that increase the environmental impact. Equation (6) can be applied to whatever is being considered: loss of material, energy, or consumables. However, in the following, we focus on energy consumption. From this point of view, we analyzed the OEE indicator.
4.2. OEE and Impact Variation of Energy Consumption
The scope of this study was that of discrete manufacturing industries. In particular, we focused on the batch production that occurs when the materials are processed in finite amounts. In this kind of discrete production, the changeover time between two batch types takes time due to the necessity of changing tooling, and setting up and reprograming the machinery.
To analyze the energy losses in industrial production starting from the OEE, the impact variation can be defined as a function of OEE:
Then, the possible loss causes, as identified by Nakajima [11], are analyzed from the point of view of time losses. Starting from the causes of loss, it is possible to identify the unproductive times and the corresponding impact variations, as shown in Table 1.
As a consequence of the analysis on the causes of loss in Table 1, Equation (7) can be rewritten as follows, where the losses of availability, performance, and quality are considered by the functions g, h, and i, respectively.
4.3. Environmental Impact Variation Functions
Once the time losses are associated with the respective loss causes, the individual impact variations must be defined, linking them to the times identified in Table 1. In a batch production context, the loss of time due to the production type change is significant. First, we analyze the equation
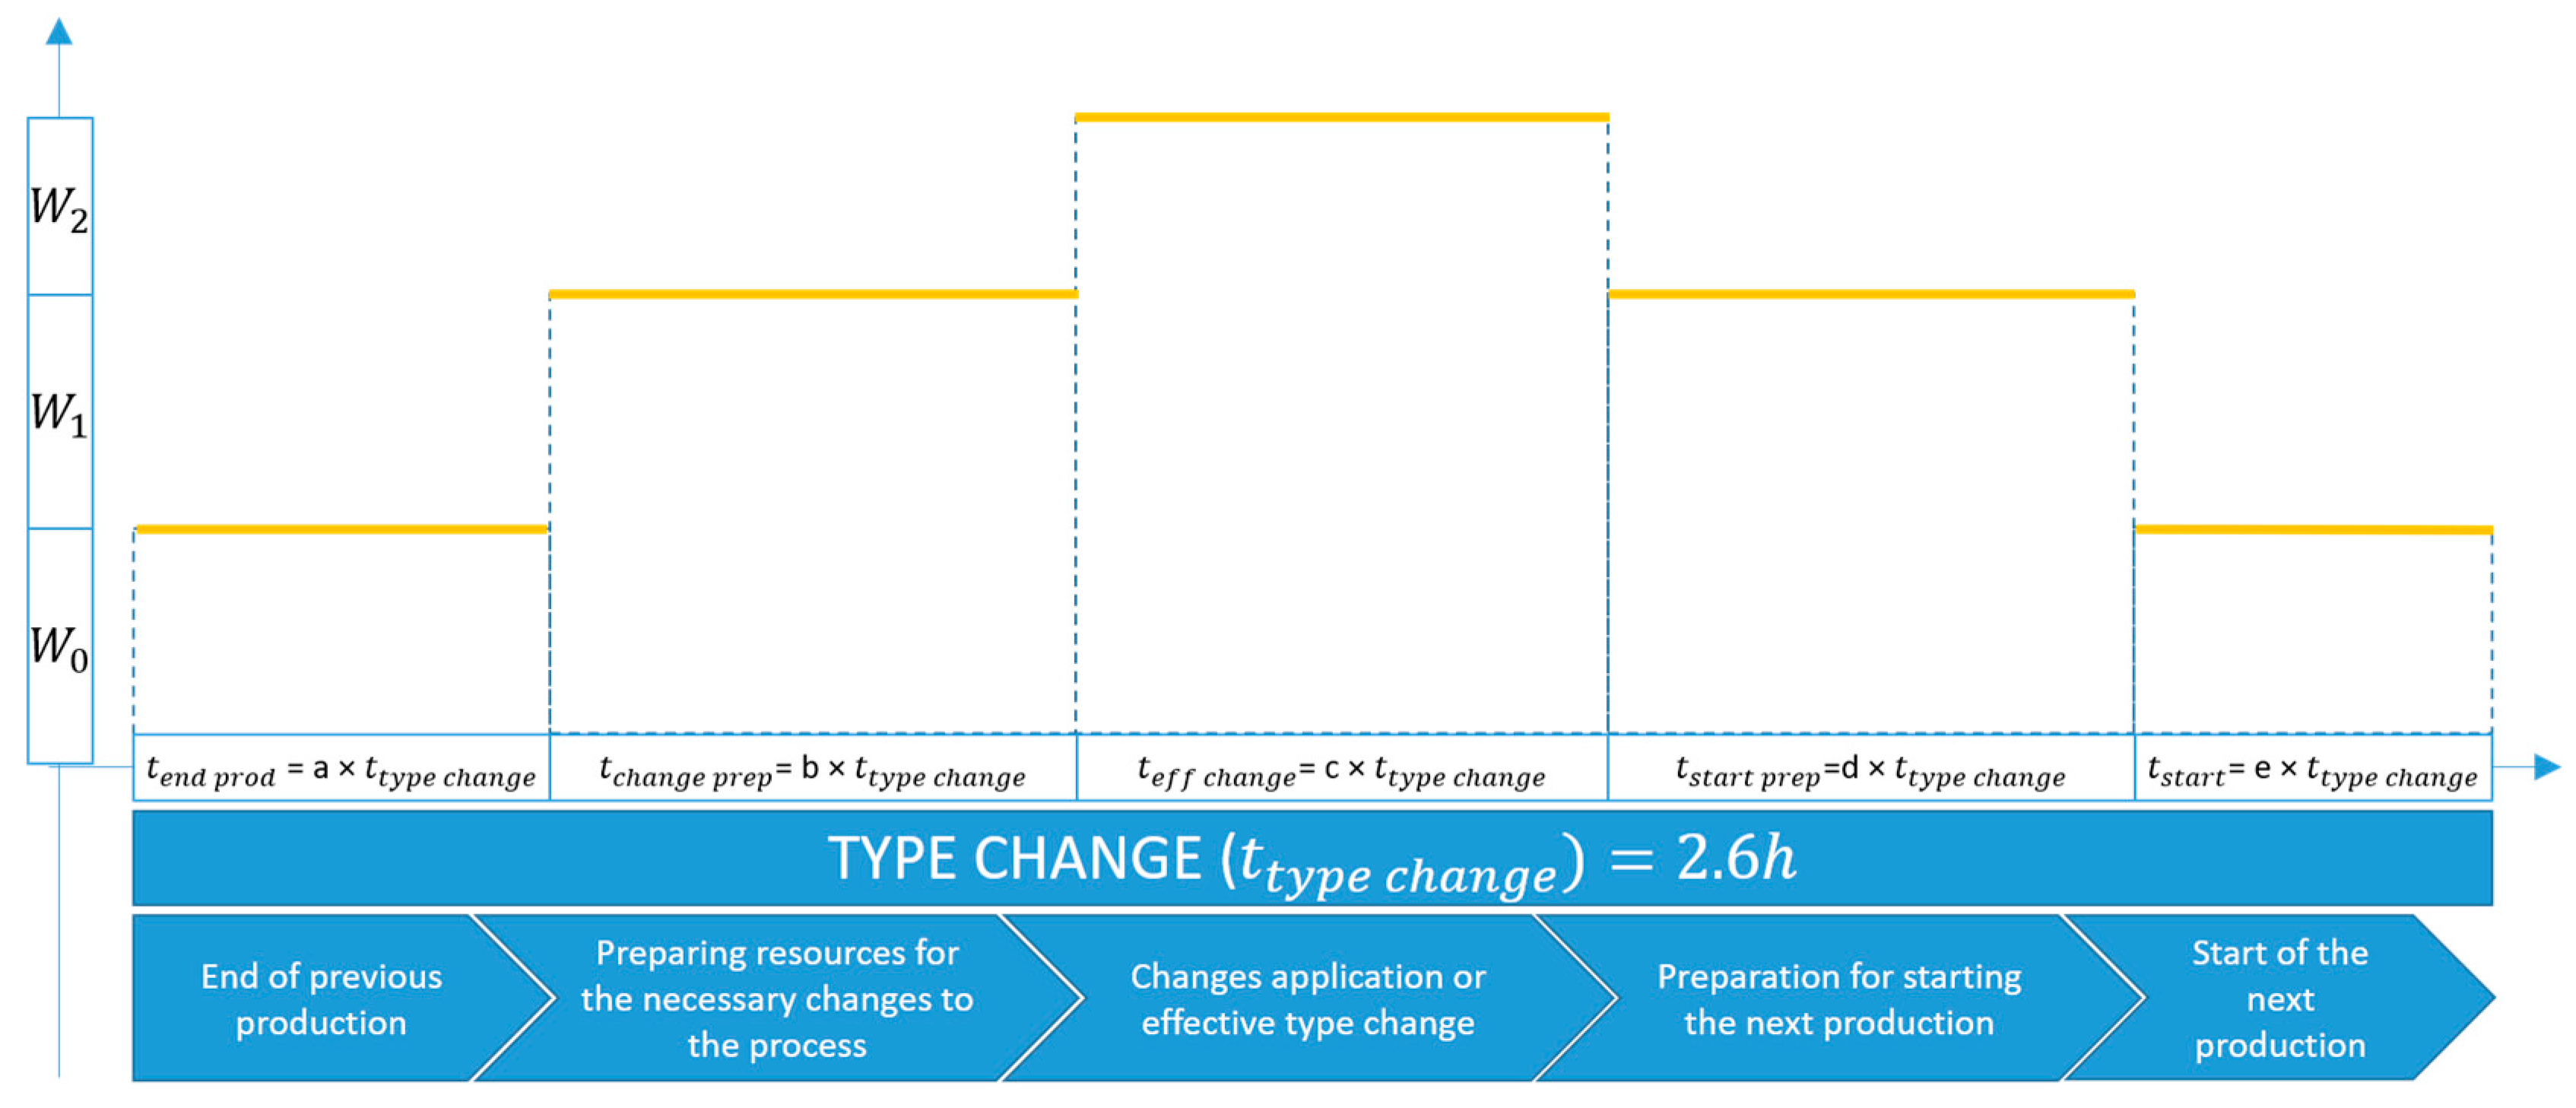
Considering the type change from one batch production to another, the required time , usually expressed in hours, is the sum of five time intervals. These time resources are required to perform several operations to stop the previous production, prepare the new batch, and start the next production:
- (1).
- : End of the previous production. It is considered a loss because when the machine stops the previous production, it continues to run, consuming energy without generating added value.
- (2).
- : Preparation of resources for the necessary changes to the process. To carry out the type change, the required tools and materials must be transported near the point where the work is to be completed (consider in Equation (5)). These movements represent energy consumption, in some cases, even of machines with high consumption such as bridge cranes, wheelbarrows, and lifting systems, among others.
- (3).
- : Application of changes or actual type change. To dismantle the previous mold and assemble the next, lifting systems and work equipment that consume energy are used.
- (4).
- : Preparation for starting the next production. After making the type change, it is necessary to transport the tools and materials to their place to free the work area. Therefore, the energy loss is represented in the displacements required to perform this operation.
- (5).
- : Start of subsequent production. Before the machine resumes production, it continues to operate and, therefore, consumes energy that does not represent any generation of value for the production process.
Notably, during the five time intervals considered to carry out the type change in which the production line does not produce value, the machines still remain in operation and consume energy, which is why these energy losses must be considered. The following diagram shows the contribution of each time interval to the type change. Their length is a percentage of ; for example, = a , where 0 ≤ a ≤ 1. The assessment of each percentage helps the analyst and the decision-maker to focus their attention first on the activities responsible for the greater energy consumption during the type change. Figure 4 must be understood as a pattern that can be applied to various contexts, as will be shown in the case study in Section 5.
Analysis of Individual Blocks
Type change times are presented when an operation change is required on the machine, generally to produce a different type of piece from that being manufactured. This process, which is exemplified in Figure 4, comprises five different time intervals that occur sequentially from the moment the previous production ends (). The necessary resources are prepared for the respective change operation of the machine (), the change is made (), the start of the new operation is prepared (), and, effectively, it starts with the next production (). Therefore, each time interval represents a percentage (a, b, c, d, e) of the time required to make the type change. During this process, the machine is steady in the ON state, consuming energy even if no processing is performed by the machine. To calculate the respective energy consumption by each time interval (Table 2), it is necessary to consider that:
- (1)
- is the energy consumption per unit of time with the system still active without production activity;
- (2)
- is the energy consumption per unit of time used for the necessary movements; and
- (3)
- is the energy consumption per unit of time used to apply the changes.
Finally, to obtain the energy consumption corresponding to the complete process of type change, it is enough to calculate the equations presented in Table 2.
4.4. Cyber Physical Production System Model
In manufacturing, the application of Industry 4.0 technologies aims to reach several goals such as the efficiency of production processes, costs reduction, and quality of services to customers. The following definition summarizes the new paradigm for modelling and creating intelligent production systems:
Industry 4.0 is a collective term for technologies and concepts of value chain organization. Within the modular structured Smart Factories of Industry 4.0, Cyber-physical systems (CPS) monitor physical processes, create a virtual copy of the physical world, and make decentralized decisions. Over the IoT, CPS communicate and cooperate with humans and in real-time. Via the Internet of Services (IoS), both internal and cross-organizational services are offered and utilized by participants of the value chain [89].
A key role in the previous definition is played by the CPS, IoT, and IoS technologies.
In relation to the problem of energy efficiency in the manufacturing industry, Dubey et al. [90] stated that to achieve intelligent energy-consumption decision-making, an energy cyber-physical ecosystem [91] should be developed to monitor and manage the interactions and influences of energy usage among various production stages. Data on these interactions can be delivered to cyberspaces to achieve real-time monitoring and dynamic optimization of energy efficiency. Likewise, Gerbert et al. [91] showed that the energy consumption of the manufacturing system can be minimized throughout the production planning by system design.
Many definitions of CPS can be found in the literature; a useful review was presented [92]. The following definition of cyber-physical production system was introduced as a specialization of the definition of CPS in the manufacturing field, and is suitable for the purposes of this work, “Cyber-Physical Production Systems (CPPS) comprise smart machines, warehousing systems, and production facilities that have been developed digitally and feature end-to-end ICT-based integration, from inbound logistics to production, marketing, outbound logistics, and service” [93].
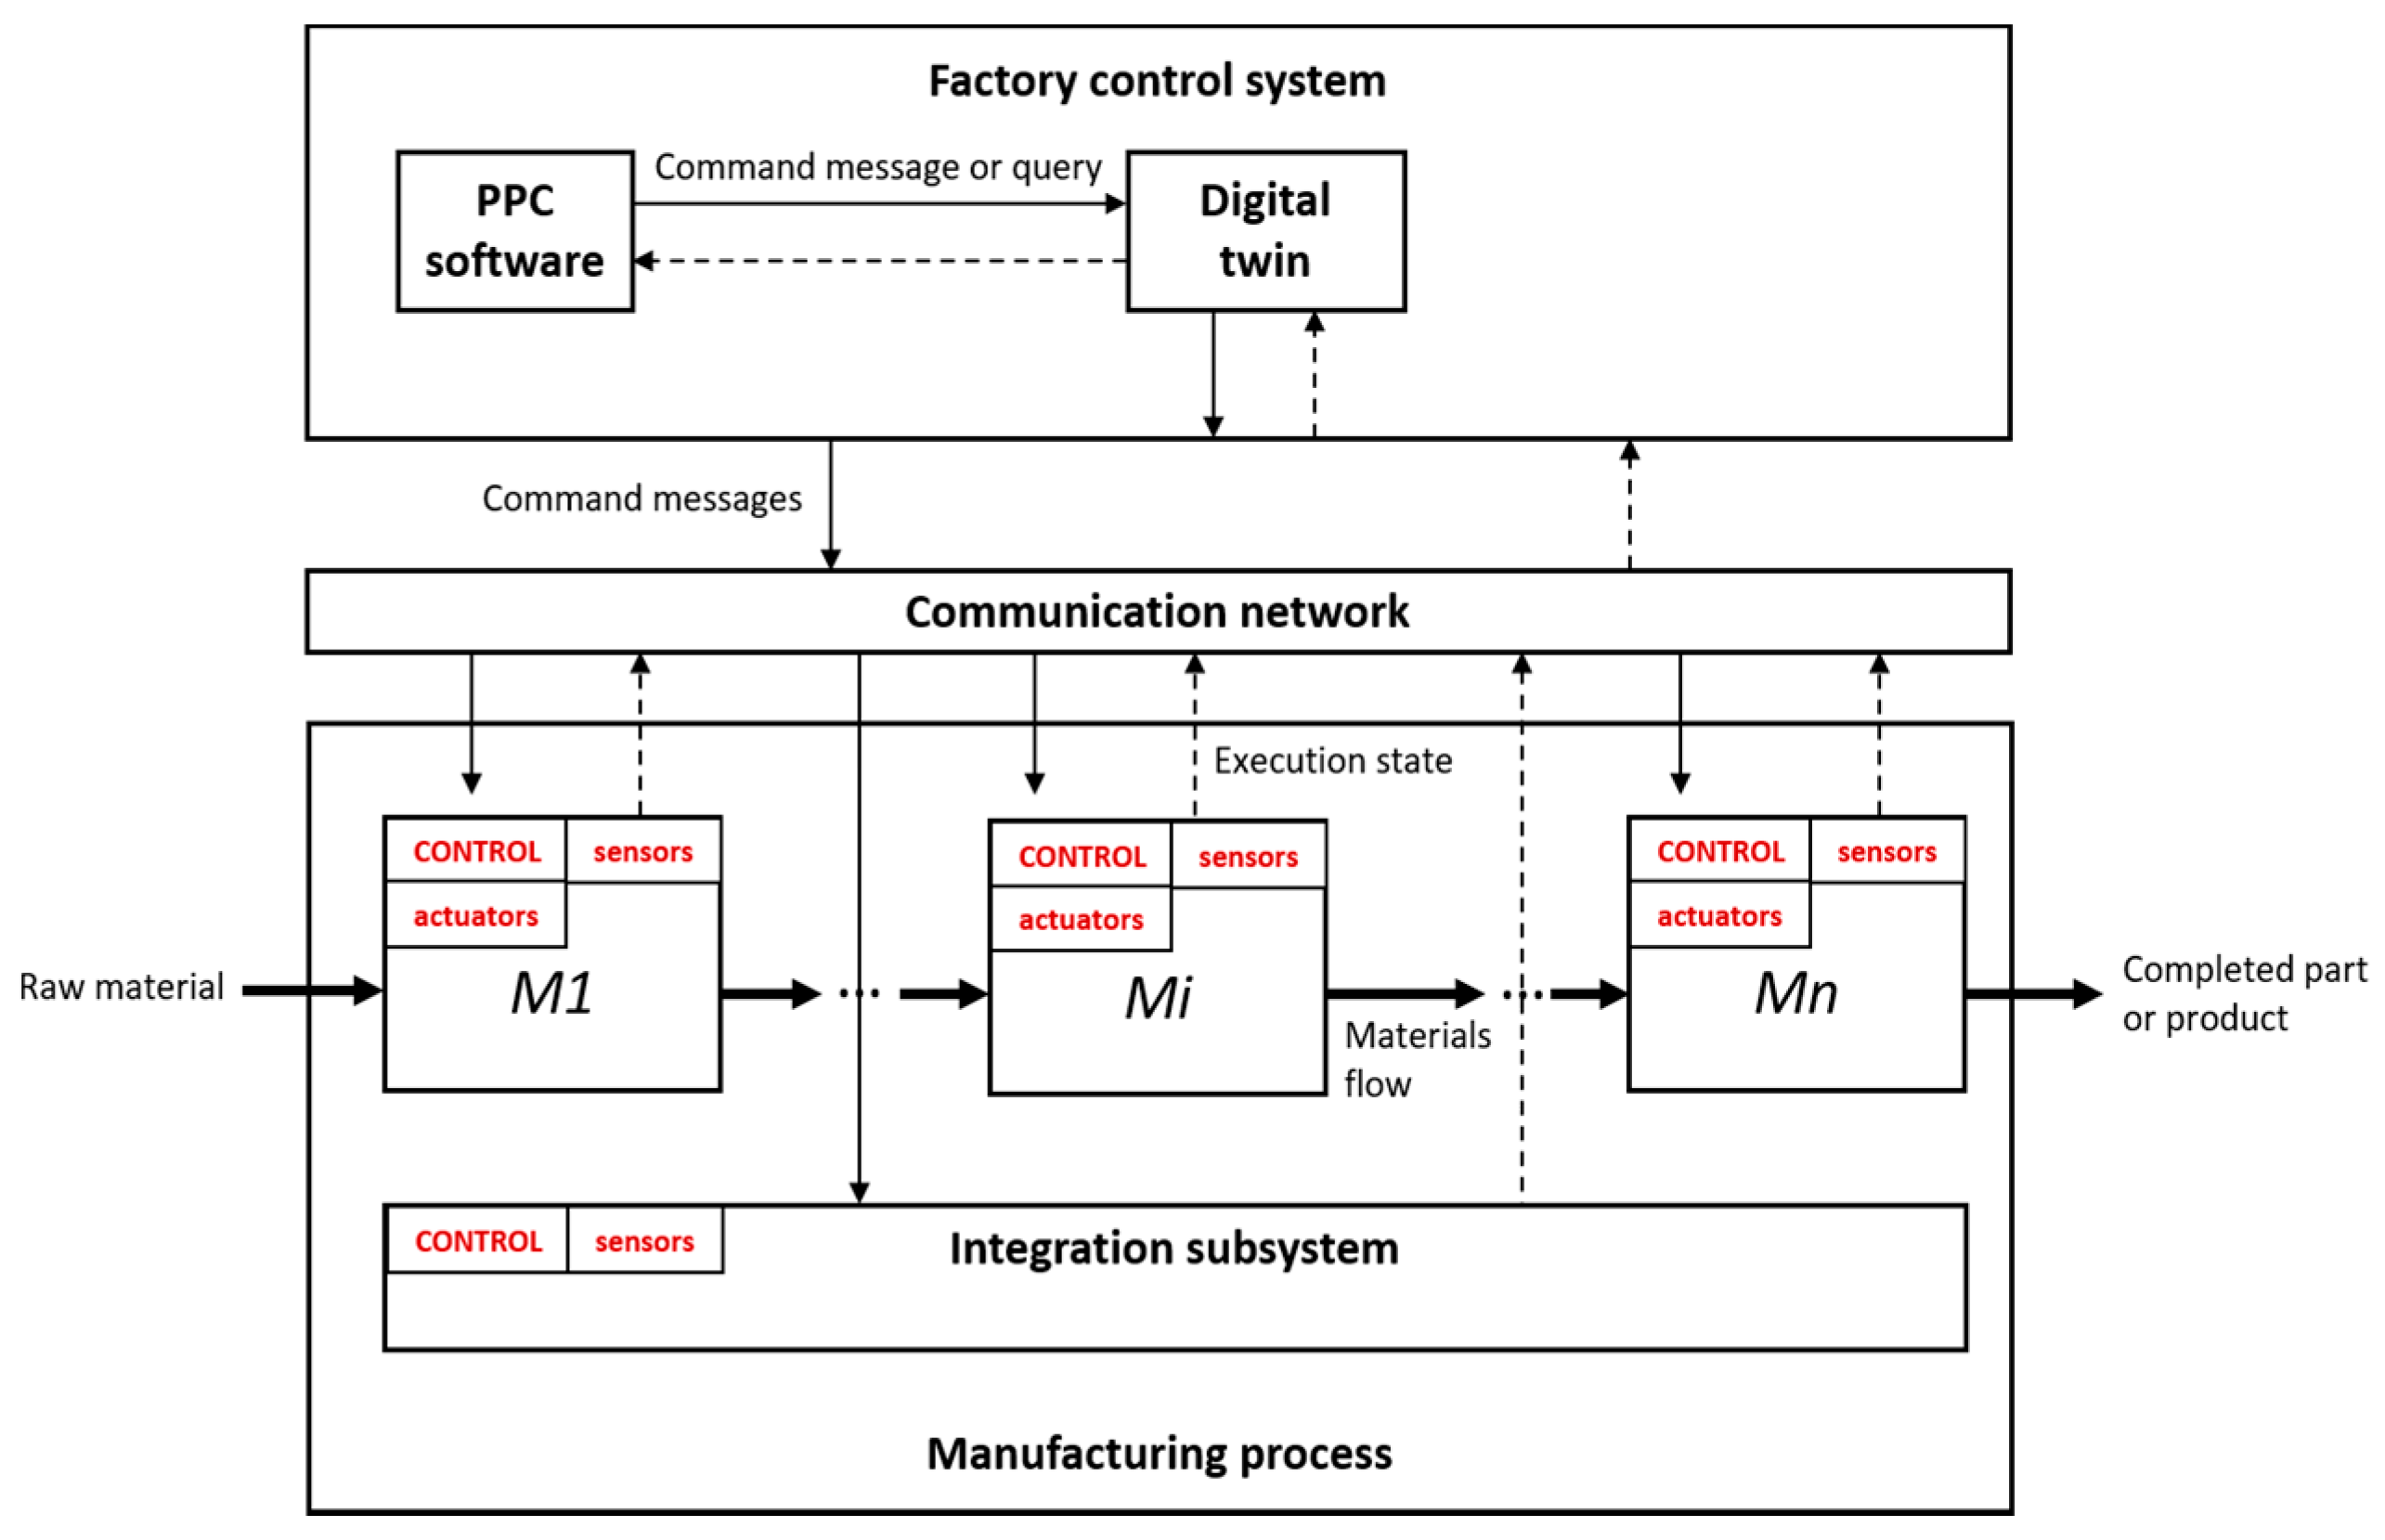
From these ideas, Figure 5 proposes a high-level model for the creation of an integrated system consisting of CPPS, IoT, digital twin, and Production Planning and Control (PPC) software.
The model provides the bases for a set of indicators whose goal is to track the progress of units, subsystems, orders, and industry operating processes. Assuming that the production process involves the machines M1, M2, Mn, the CONTROL subsystem of each machine is in charge of the part program execution (the set of instructions that drive the actuators to perform a job on a part or a product). At the same time, a set of sensors collect execution data, such as machine operating status, number of pieces processed, number of good pieces, etc., that provide information about the execution state of the production process. Finally, the integration subsystem acts as a supervisor and coordinates the work of other subsystems in the CPPS. In the model, the digital twin module plays the role of a virtual copy of the underlying CPPS acting as a broker between the PPC software and the machines. It is a faithful replica of the real world made of machines, their relationships, the related subsystems, and the tools employed during the production process. This produces a clear separation of responsibilities for pursuing an easier software decomposition logic while obtaining the real-time characteristics and simulation capabilities. An example of information flow is the following:
- The Computer-Aided Design (CAD) engineer produces a part program and plans its execution for a generic machine. It is a high-level message command that flows from the PPC software to the digital twin.
- At the planned starting time, the digital twin uploads the part program to the CONTROL subsystem via the communication network.
- The machine executes the part program; in the meanwhile, the sensors collect execution data, returning them to the digital twin.
As for energy efficiency, snapshots of the actual energy consumption can be captured for both the individual machine and the line. It is also possible to obtain consumption trends for individual machines to obtain valuable indications for predictive maintenance of machinery. The next section provides the details of the real-time computational method made possible by the implementation of a cyber-physical system for a production line. The data collection system integrates the digital twin and an IoT monitoring system to instantly know the state of health of the machine or the entire production line, considering energy as well as other resources’ efficiency.
5. Case Study
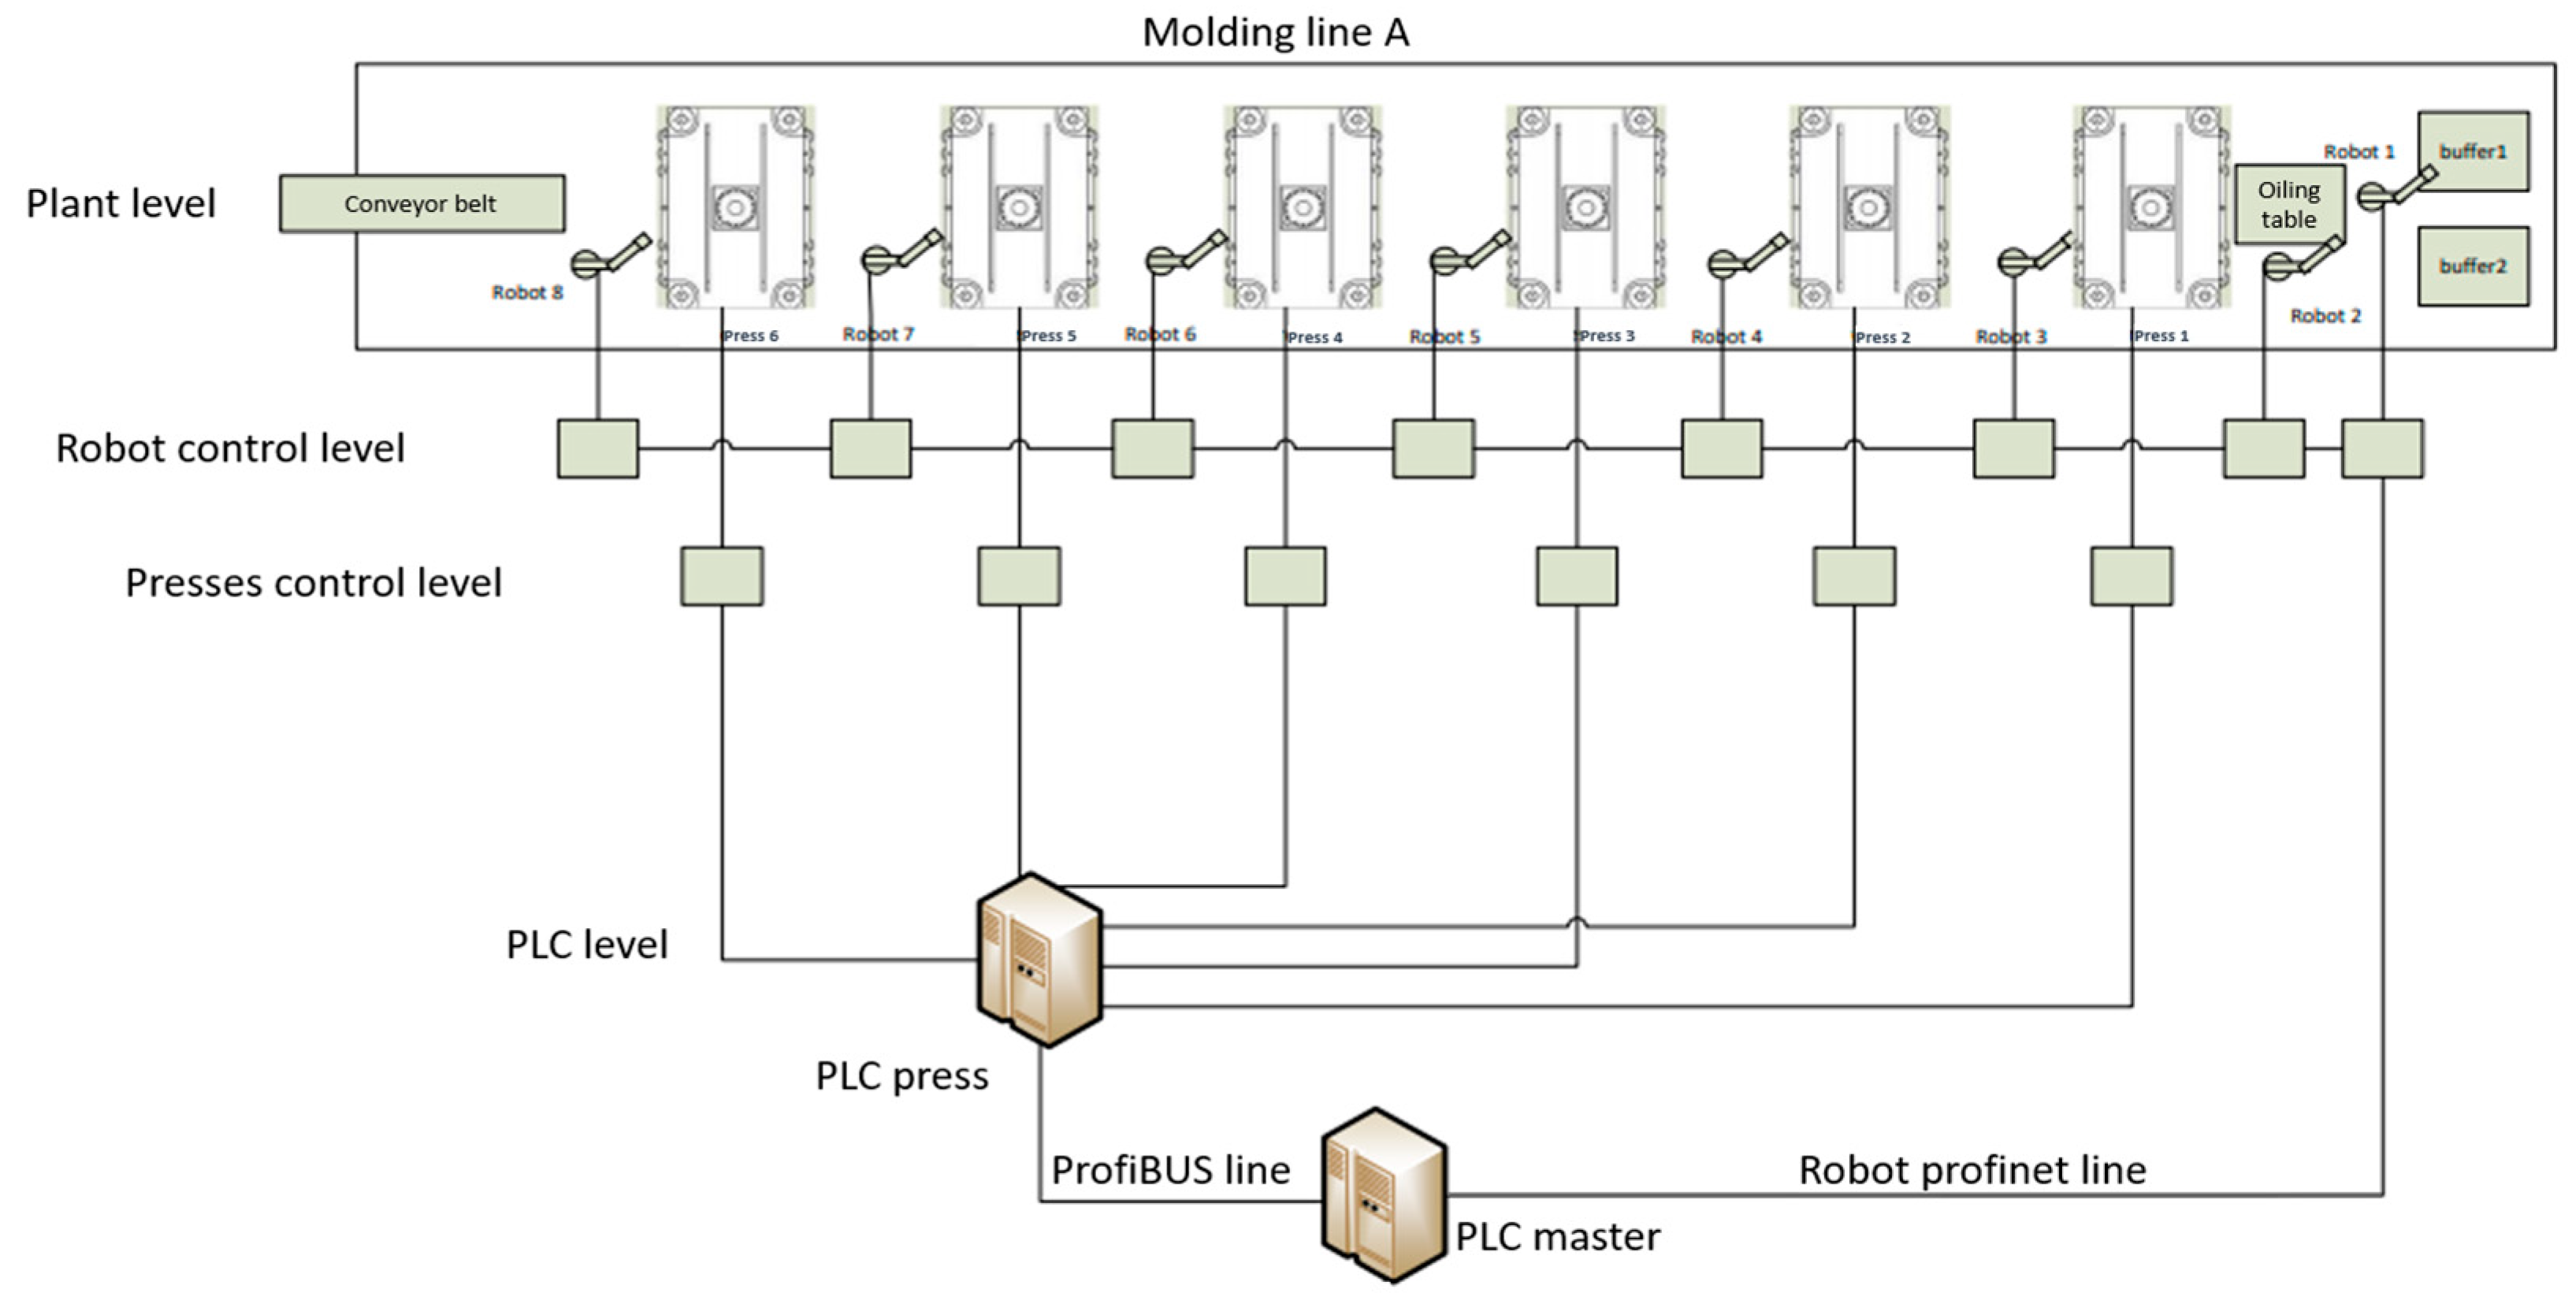
In the following, the application of OEE to an automotive manufacturing industry is illustrated to determine the causes and amounts of energy waste in a production line based on the models proposed in the previous section. The considered process assumes that the sheet metal strip is cut, drawn, and deformed to produce the desired finished shape. To obtain the result, it is necessary to carry out six operations for each product with different molds. To perform the operations, the system consists of 6 presses in sequence. Reading the model of Figure 6 from right to left, a robot picks up the strips from the container positioned at the beginning of the line and places them on the oiling table. The loading of the oiling table, the transfers from one press to the next, and unloading from the last press to the output conveyor belt, are performed by 8 robots. Even if the system has the structure of a line, from the point of view of energy consumption, it can be considered a unique “machine” because the line is completely automated and the different components (robots, presses, control logic) are tightly coupled. This allowed us to apply the model in Figure 5.
First, consider the data in Table 3, which correspond to the daily planned time in the manufacturing industry for a given period. Total time is used as a time base, which is defined as all time (at the rate of 24 h per day, 7 days per week), during the period being measured.
The data values collected in the following tables refer to a two-month observation period. The data were collected day by day while the values in tables are average values. Table 4 shows the average values of loss causes C1, C2, and C3, from which we can calculate the availability.
The availability of the machine during the considered day does not reach the target according to the Total Productive Maintenance (TPM) standard [11,13], which establishes that the ideal condition is greater than 90%. This is mainly due to the excessive time used to make type changes (C1) and plant failures (C2). These are activities that represent opportunities for improvement since they can be susceptible to optimization processes.
The performance rate is calculated below, considering the corresponding speed losses. The average cycle time in Table 5 is the duration of the time interval from picking the sheet metal strip from the input buffer to the unloading on the output conveyor belt; 20 s is the average cycle time for all productions that occurred over the stated observation period.
In this scenario, the performance rate is also below ideal conditions, since the ideal theoretical value must be greater than 95% according to the TPM standard [11].
The quality calculation according to the time loss causes is presented in Table 6.
The quality reaches a value that allows it to be in ideal conditions, theoretically established by Nakajima et al. [11] at values greater than 98%.
Finally, by substituting the before values in Equation (1), we obtain
As mentioned by De Ron et al. [13], the objective of the OEE is to have a metric showing the performance of equipment. However, OEE is not directed only at the equipment but also includes the effects of the environment of equipment. This is caused by the time losses expressed previously. For this reason and considering the results obtained before, below, we present a more in-depth analysis of the loss causes corresponding to availability, performance, and quality.
- C1. Type Change Analysis
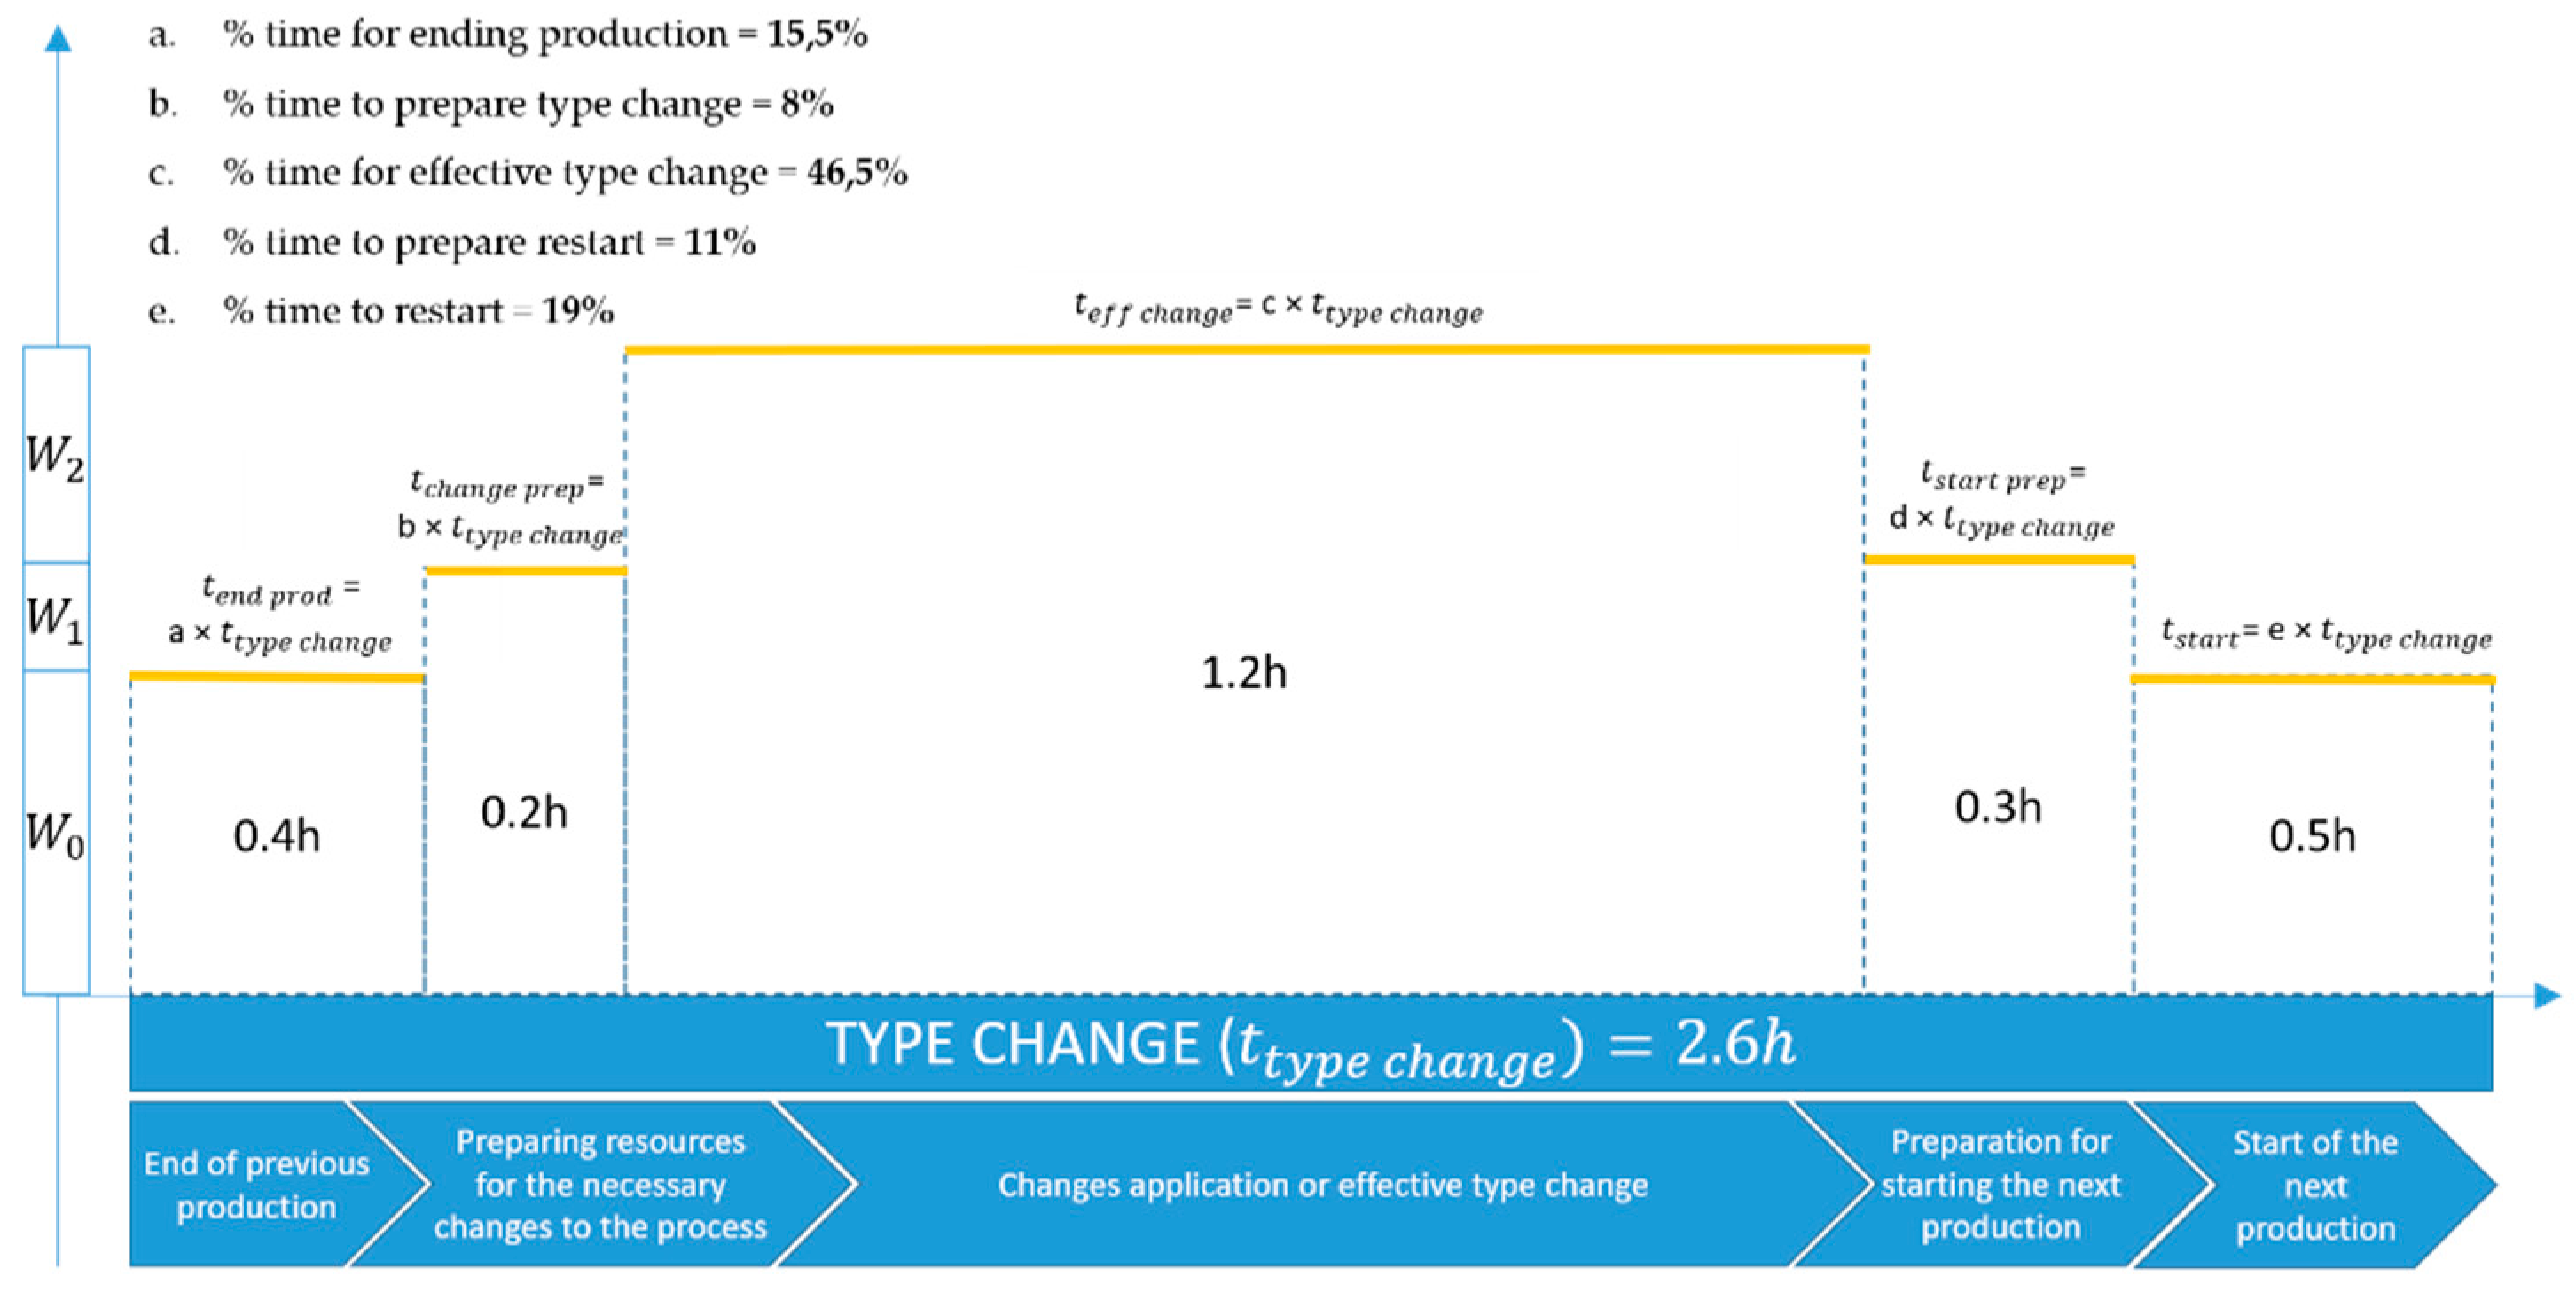
During the type change, maintenance, or other activities that do not require production to be active, the production line may be off and have zero consumption. The situation where some systems, more or less energy-consuming, must remain in operation frequently occurs because keeping the line running has lower consumptions than switching off and on. For example, a hydraulic system of a press that must be returned to the working pressure when restarting uses time and consumes more energy than to keep it under pressure. In some cases, breakages due to the discharge transients and reloading of the circuits can be generated.
Considering the values of consumed energy power of (standby power), (average power to support), and (average power in use), it is possible to know the change in energy consumption of each type change for an individual block, as shown in Figure 7. Those values correspond to the average values measured every day during the observation period (two months) and were considered a reasonable approximation for the daily energy consumption of the line on a 24 h basis.
According to International Energy Agency (IEA) [94], the emission of per kWh of electricity generated using the electricity-specific method and the composite electricity/heat factors from the International Energy Agency (IEA) in Italy in 2018 is 0.4 kg/kWh. Multiplying this value by the total of generated by the type change, we can calculate the equivalent in emissions to the environment. The total value obtained corresponds to the environmental impact generated by the energy loss during the type change process.
Finally, the impact variation is converted into equivalent consumption of . At this point, with the variation in time, the environmental impact gradient can be evaluated.
As can be seen in Table 7, the environmental impact corresponding to the energy loss derived from type change operations is equivalent to the average emission of 47.5 kg of per day. Therefore, an eventual improvement activity that involves the reduction of the time of change of production type leads to a direct reduction of .
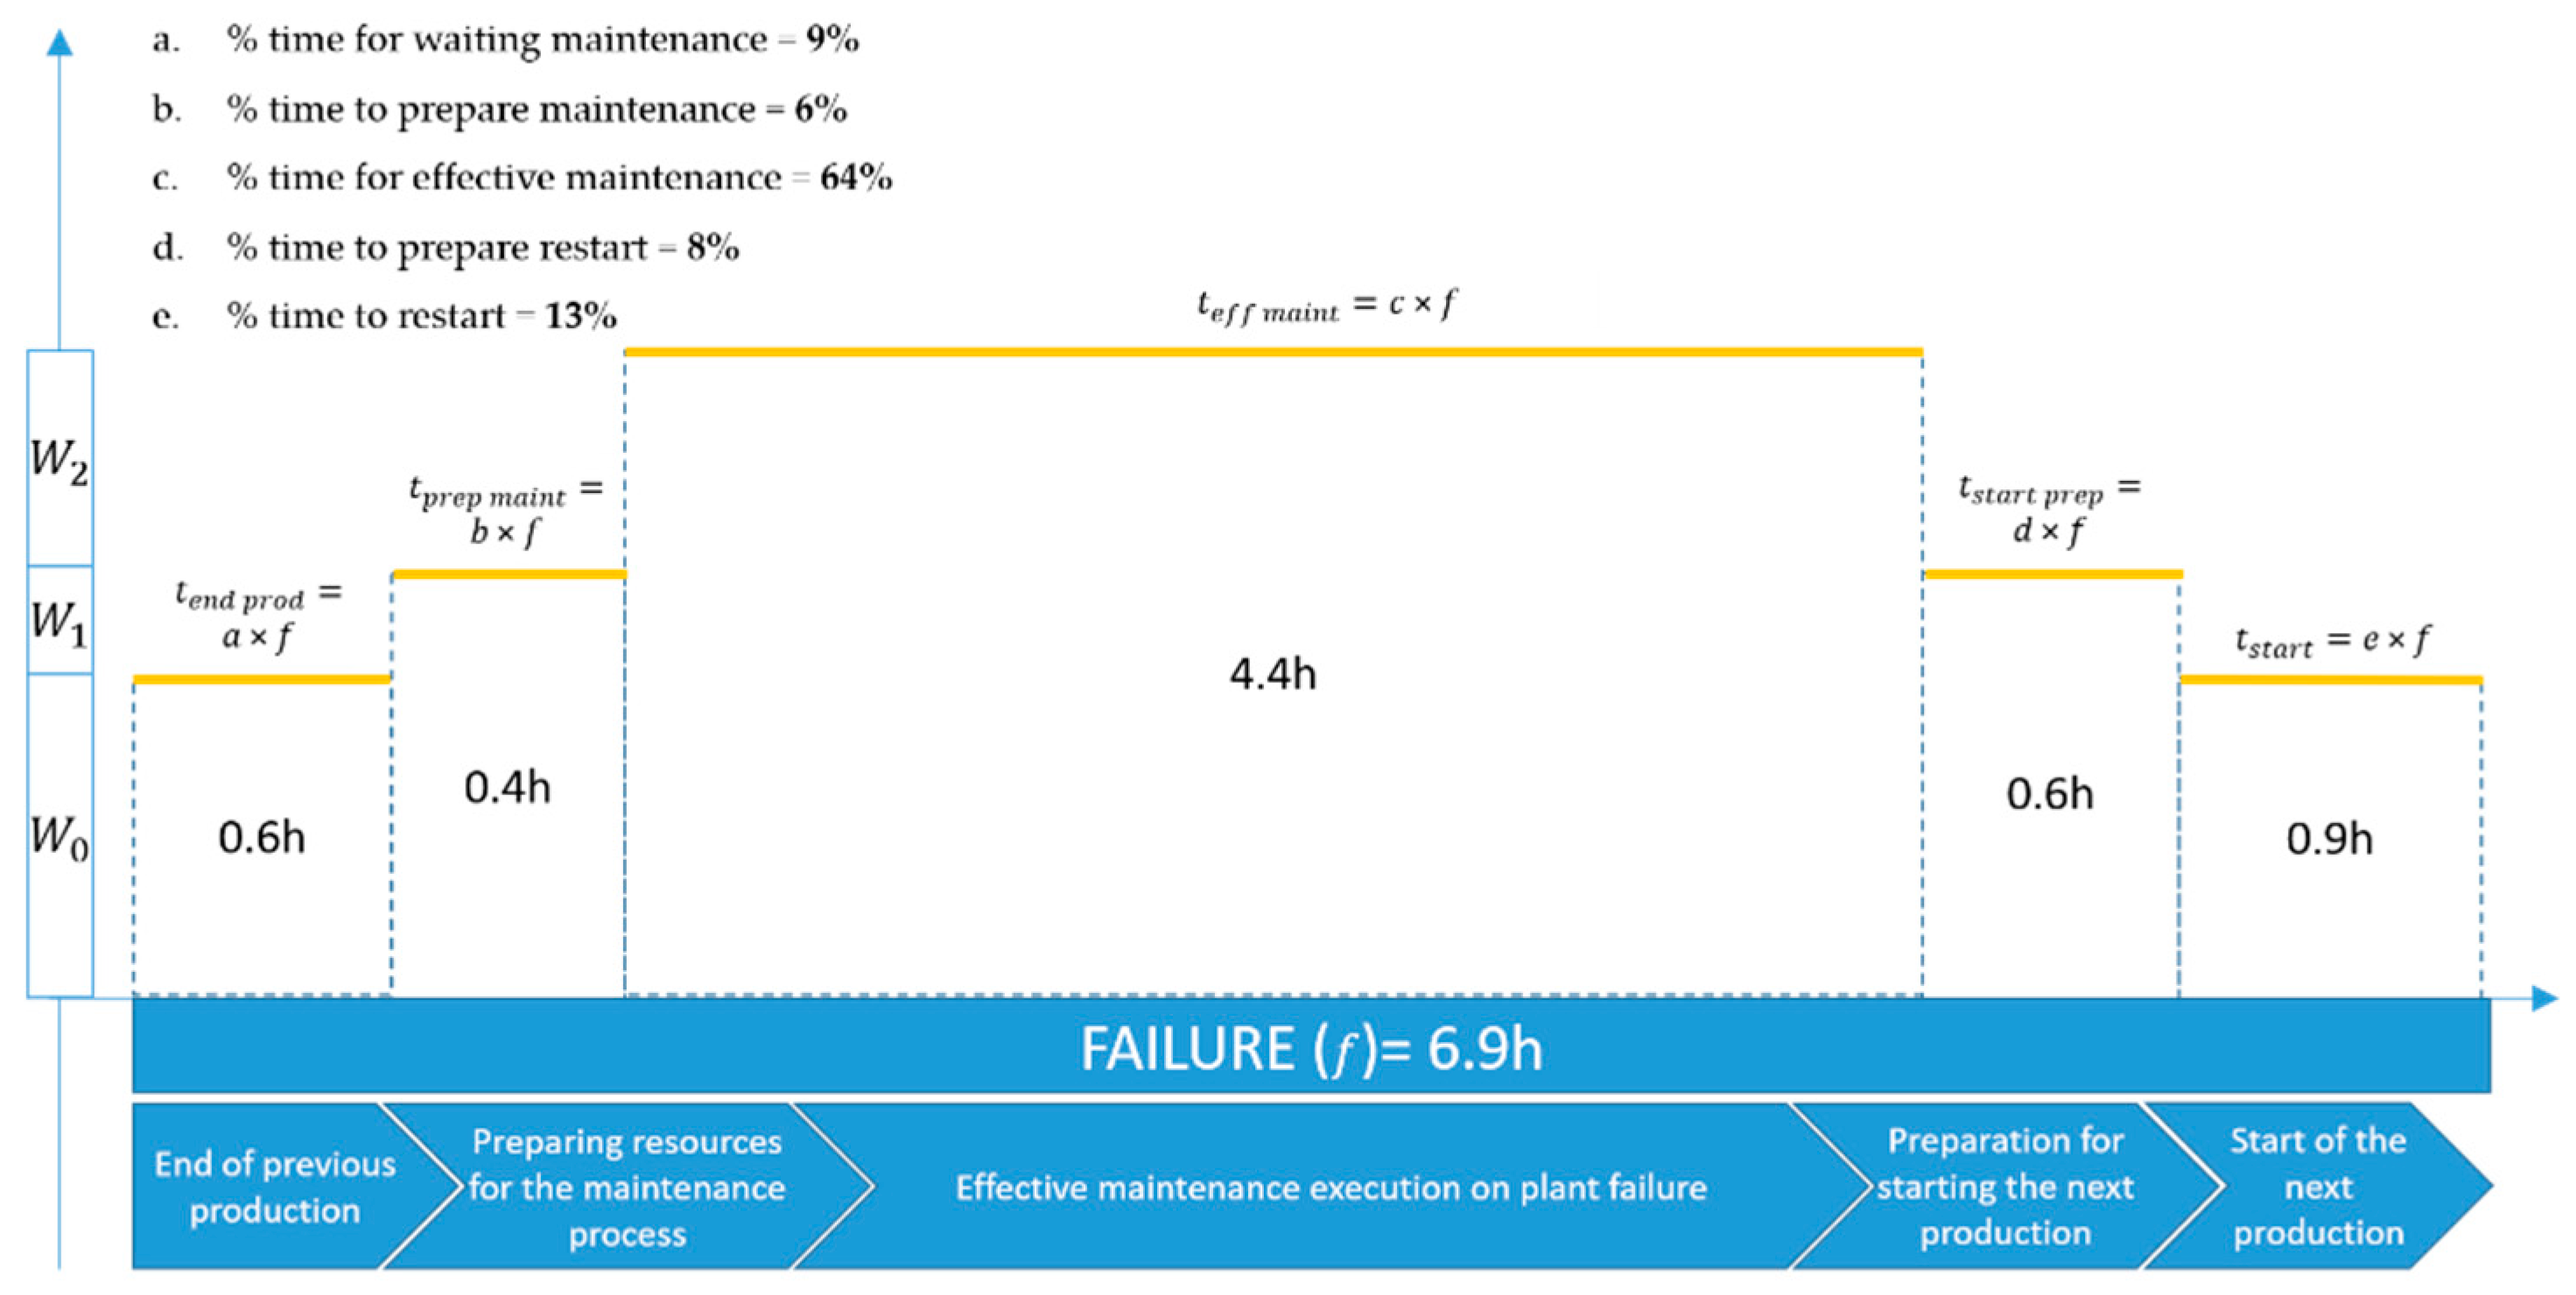
- C2. Failure Analysis
For failure analysis, consider the data presented in Figure 8, which are related to the percentages of average daily time spent in the maintenance process of a production line during the observation period.
Considering the same values of consumed energy power presented above (, standby power; , average power to support; and , average power in use) the change in energy consumption of each plant failure individual block is calculated.
To convert the change in energy consumption into equivalent consumption of and evaluate the environmental impact gradient due to energy loss in the process of maintenance to fix a plant failure, the procedure in Table 8 is performed. The total value obtained represents the environmental impact generated by the energy loss related to line failure.
This means that the total emissions to the environment corresponding to the energy losses derived from plant failure in January and February 2020 are equivalent to 139.7 kg.
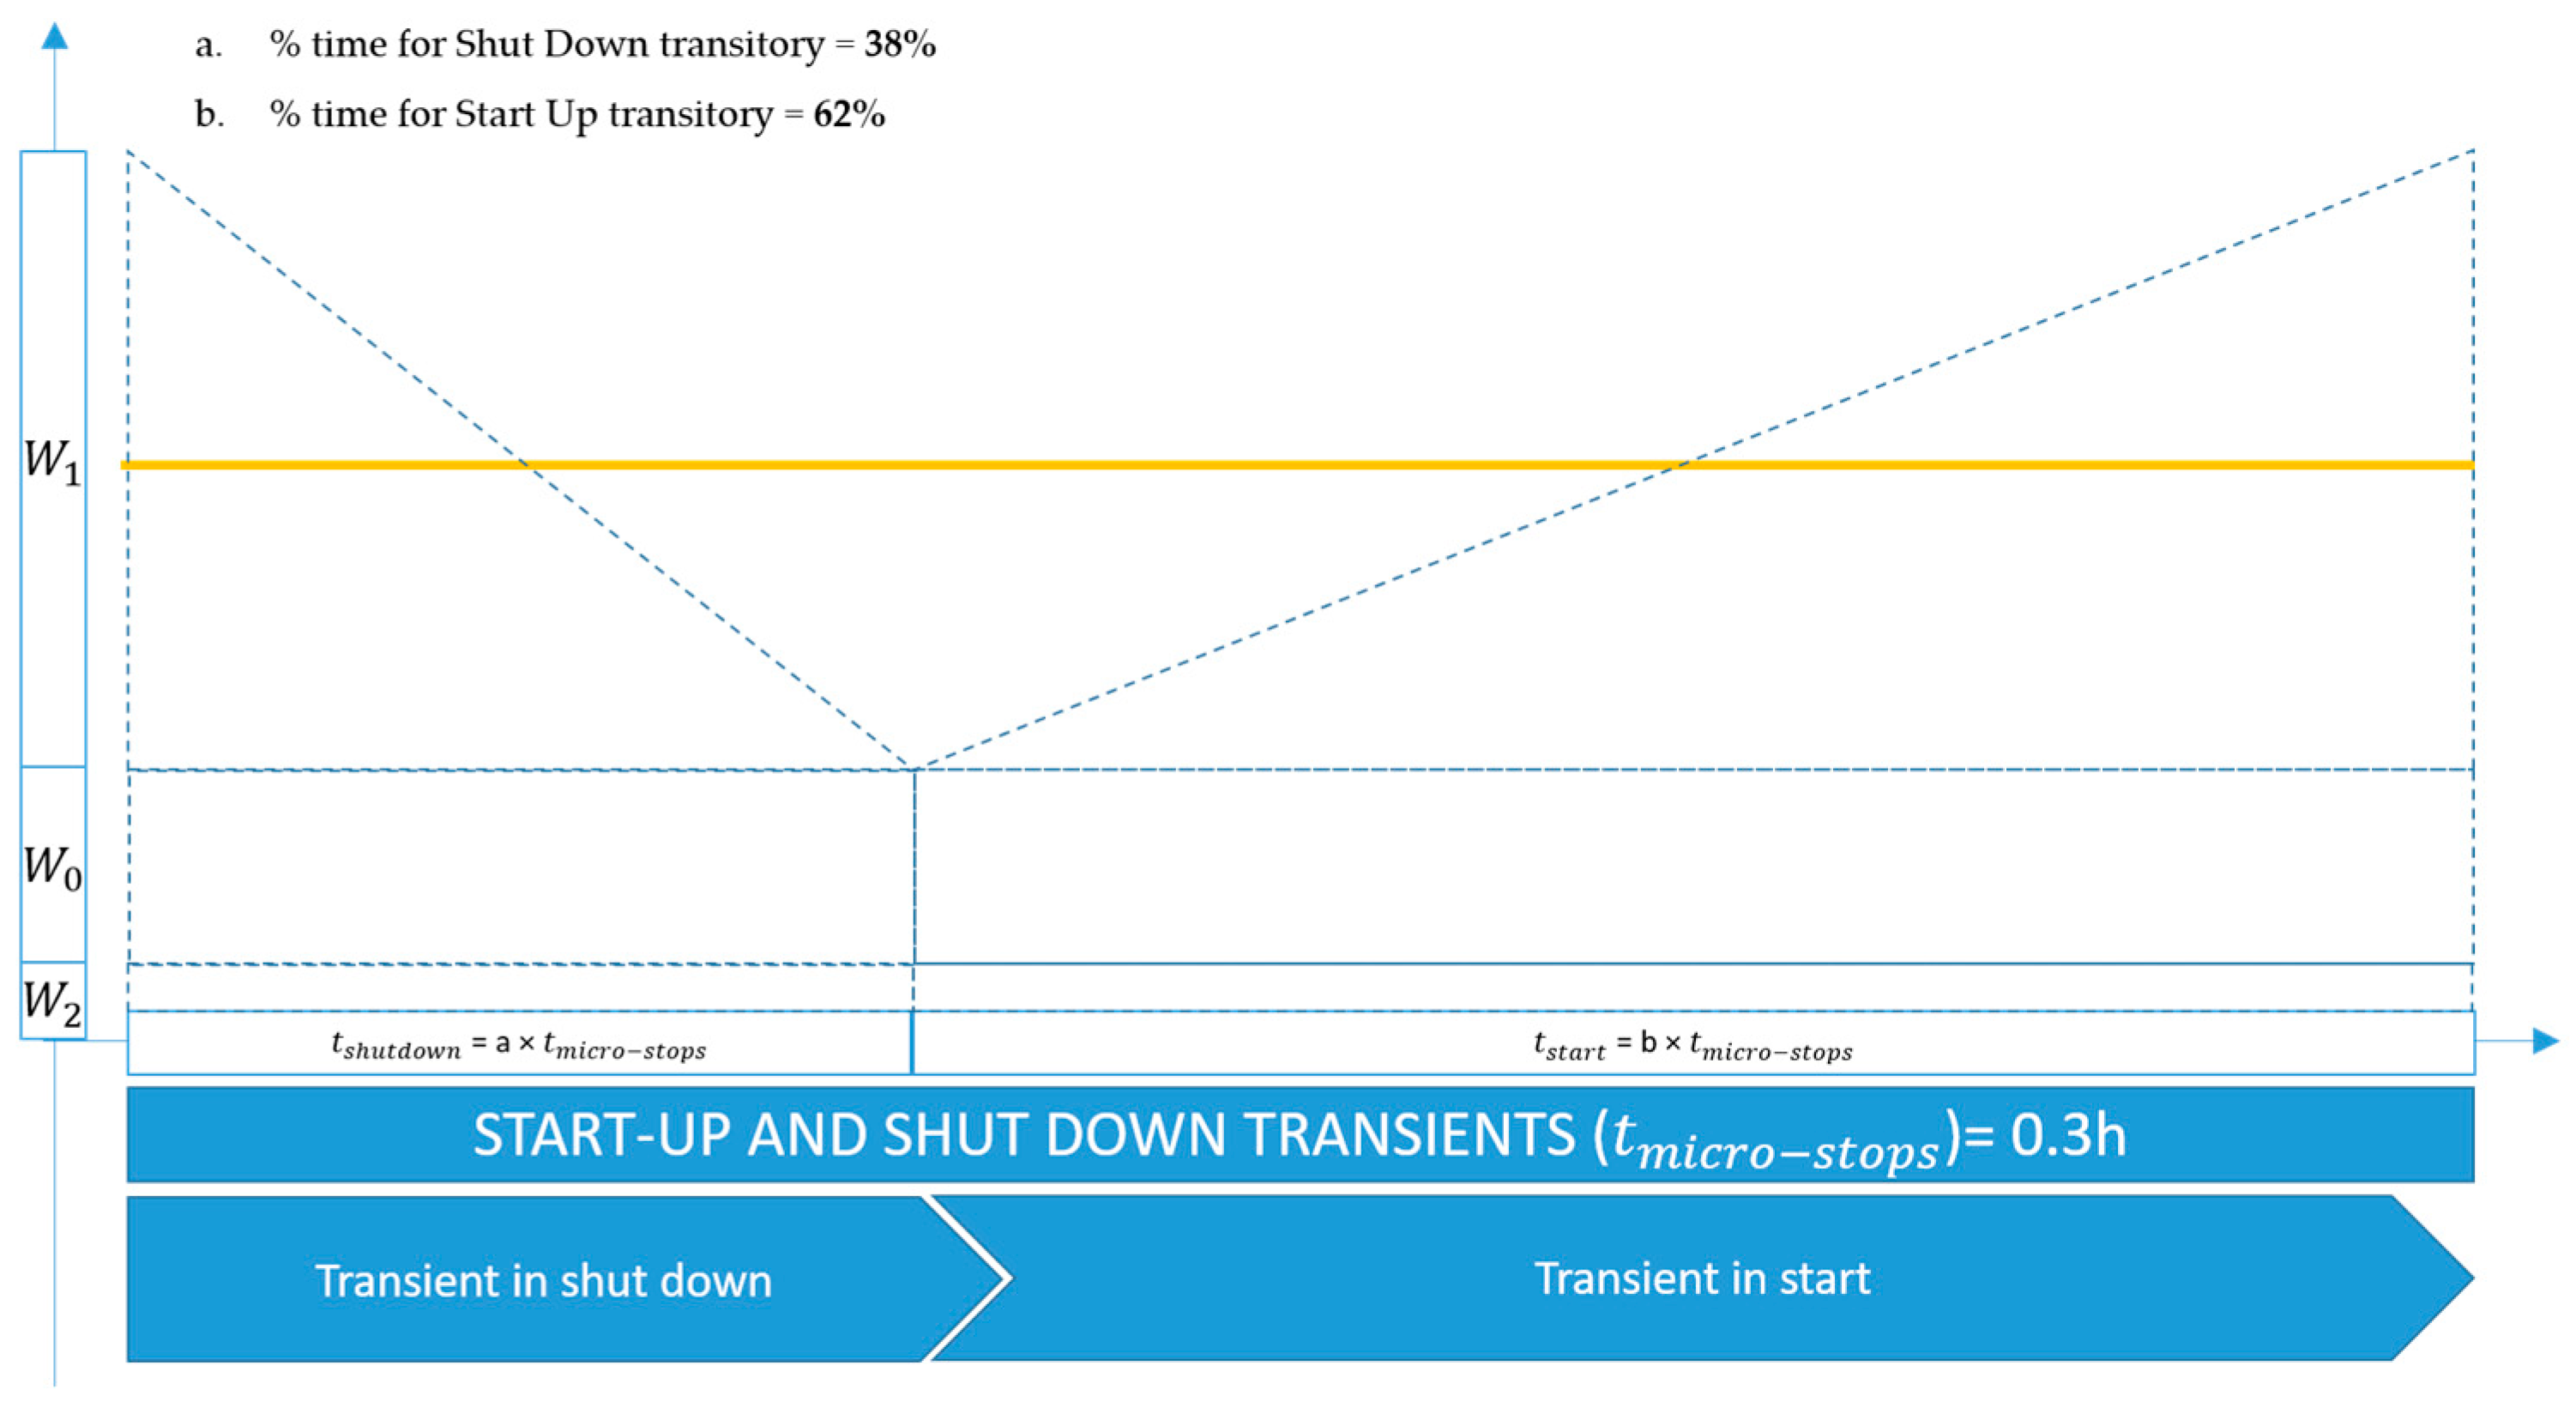
- C3. Transients at the Start and End of Production
The transient analysis (Figure 9) is performed because during start up and shut down operations, the line continues to consume energy. Although these quantities are less than those required by the line during its part manufacturing process, they are considered energy losses because they do not represent value generation. Similarly, they must be analyzed because they take a certain amount of time before the line can start working correctly again. To do this, consider the values in Table 9.
The values of consumed energy power correspond to (line power on standby), (power difference on the line running), and (average power in use). Therefore, the change in energy consumption due to transients at the start and end of production as well as the environmental impact are presented in Table 10.
Therefore, the 19.2 kg of emitted to the environment correspond to the energy losses caused by the transients at the start and end of production. The linear behavior shown in Figure 9 is an approximation of non-linear behavior that was considered a reasonable simplification since the contribution of C3 to energy consumption is lower compared to the other causes of loss.
- C4. Stops Not Attributable to Faults
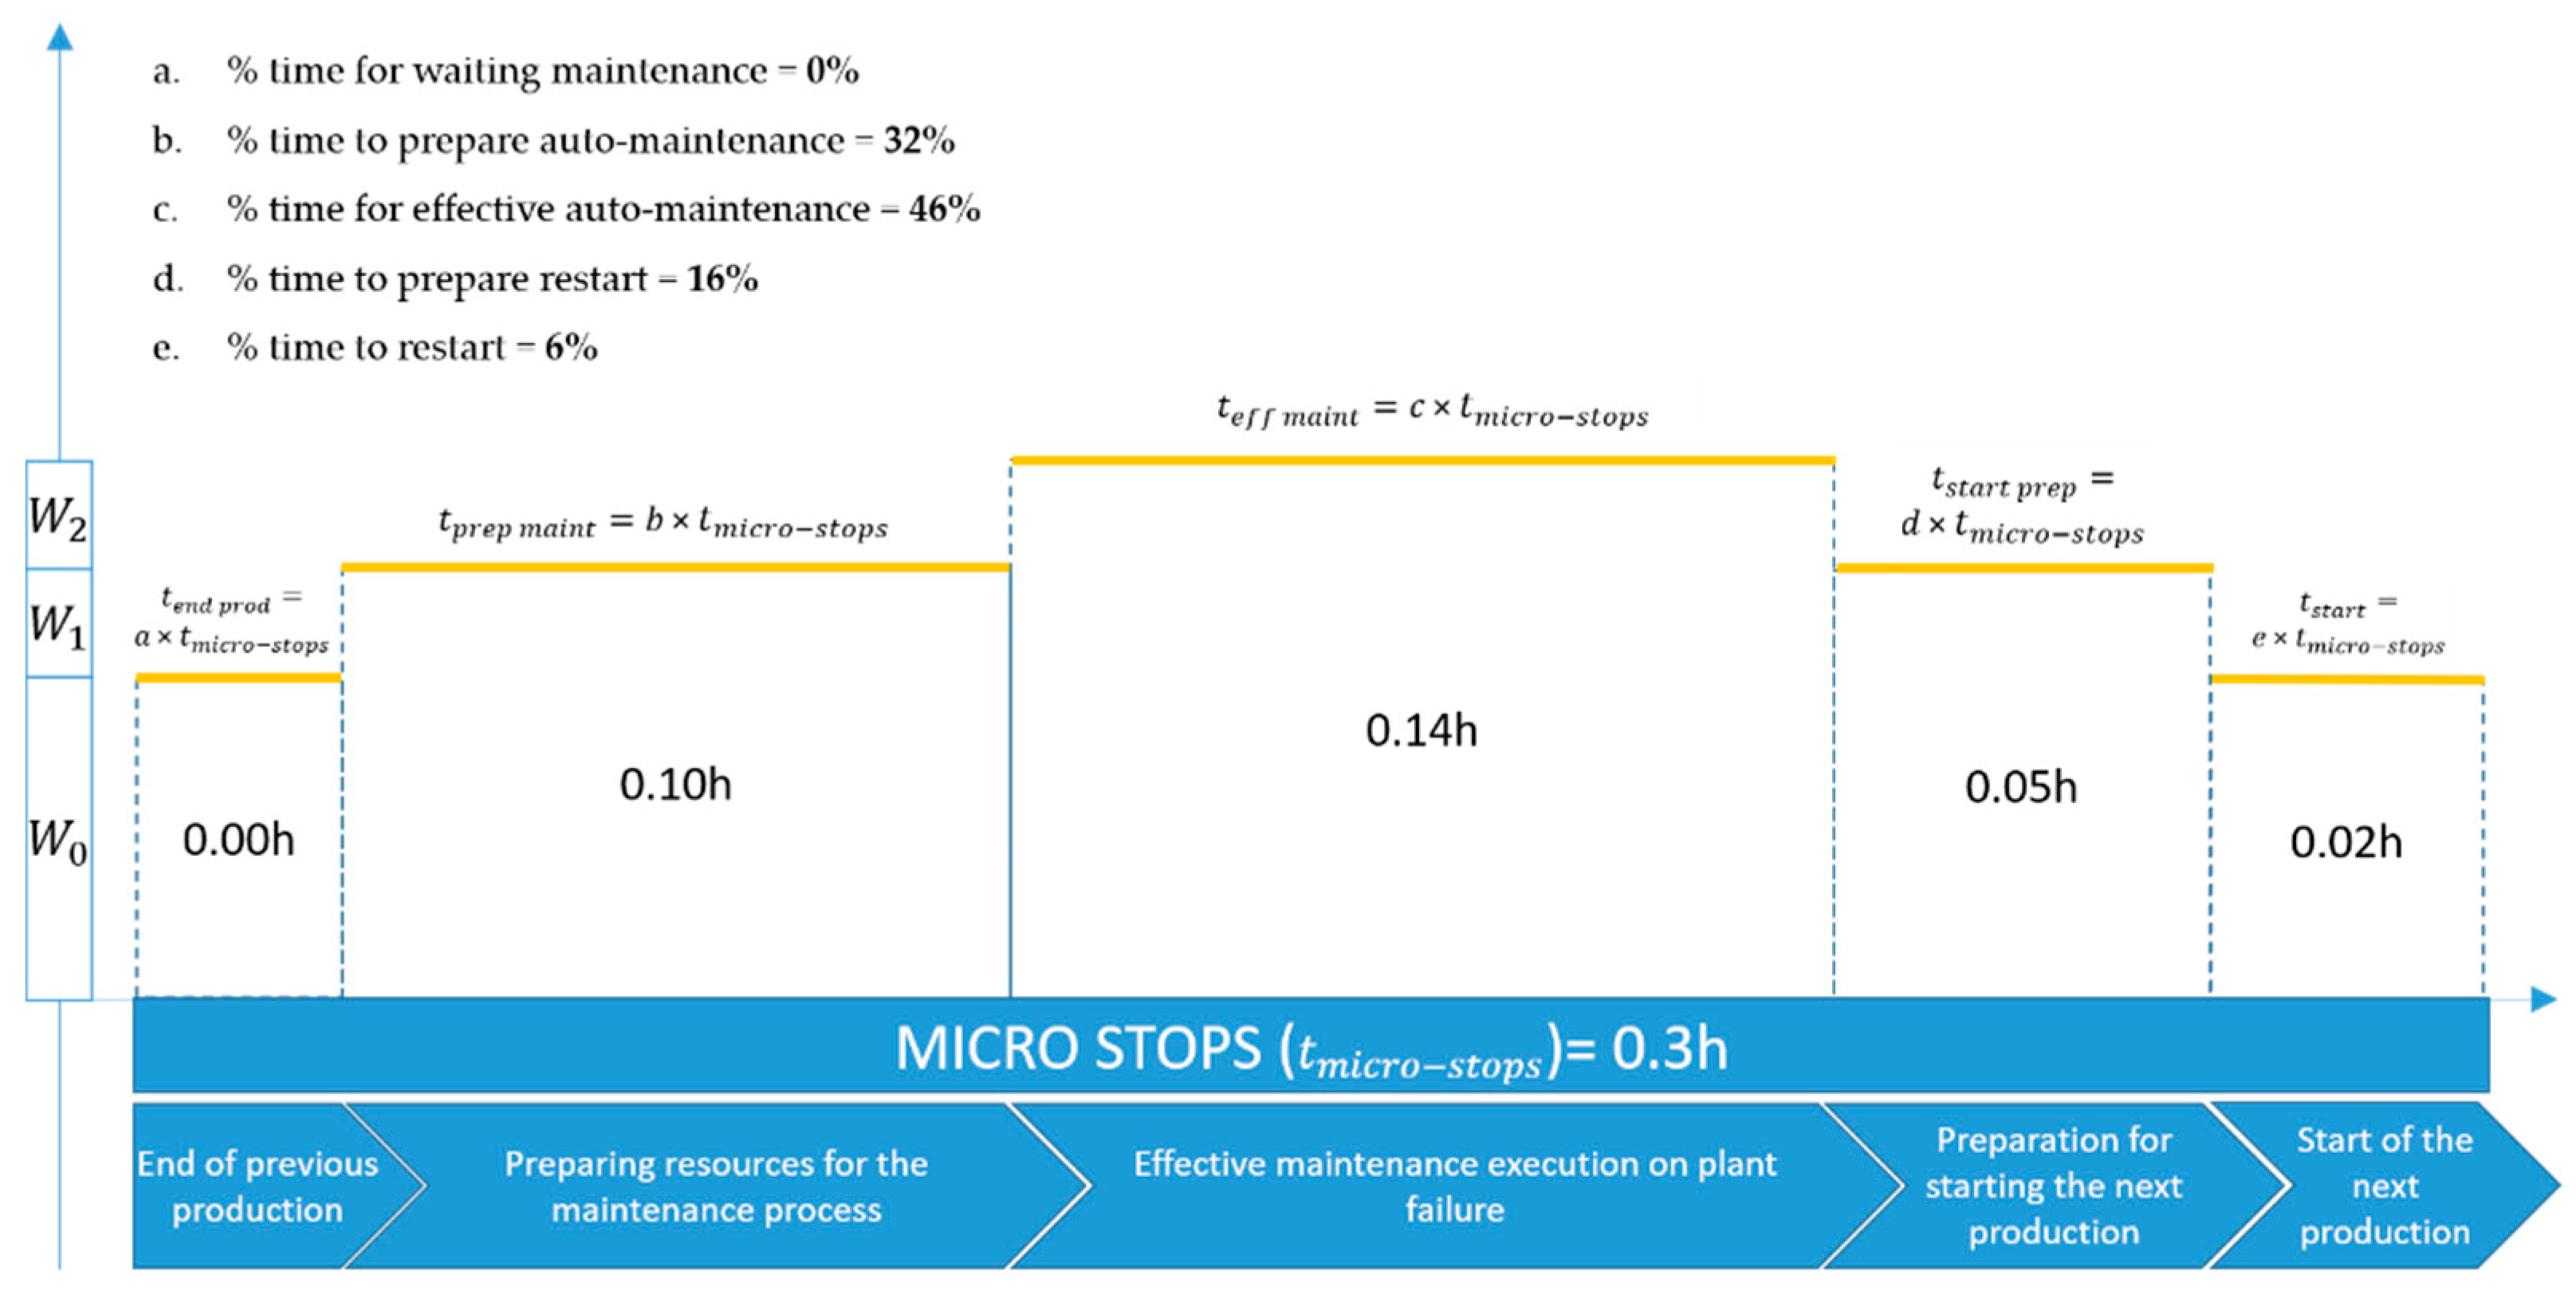
Frequently, during the production process, the line must be stopped for reasons not attributable to failures, such as preventive maintenance or auto-maintenance activities. During these short stops, the line continues in the ON state and consuming energy, which is why the energy losses associated with this variation and their environmental impact in terms of emissions were studied (Figure 10). Consider the values for the same production line of the previous examples.
In this case, the values of consumed energy power correspond to ( (standby power), (average power to support), and (average power in use). When calculating the change in energy consumption corresponding to micro-stops and the conversion of the change in energy consumption into equivalent consumption of to determine the environmental impact gradient due to energy loss by stops not attributable to faults, also known as micro-stops, the results in Table 11 were obtained.
As can be seen in the previous calculation (Table 11), the total emissions to the environment equivalent to the energy losses from stops not attributable to faults is 5.3 kg.
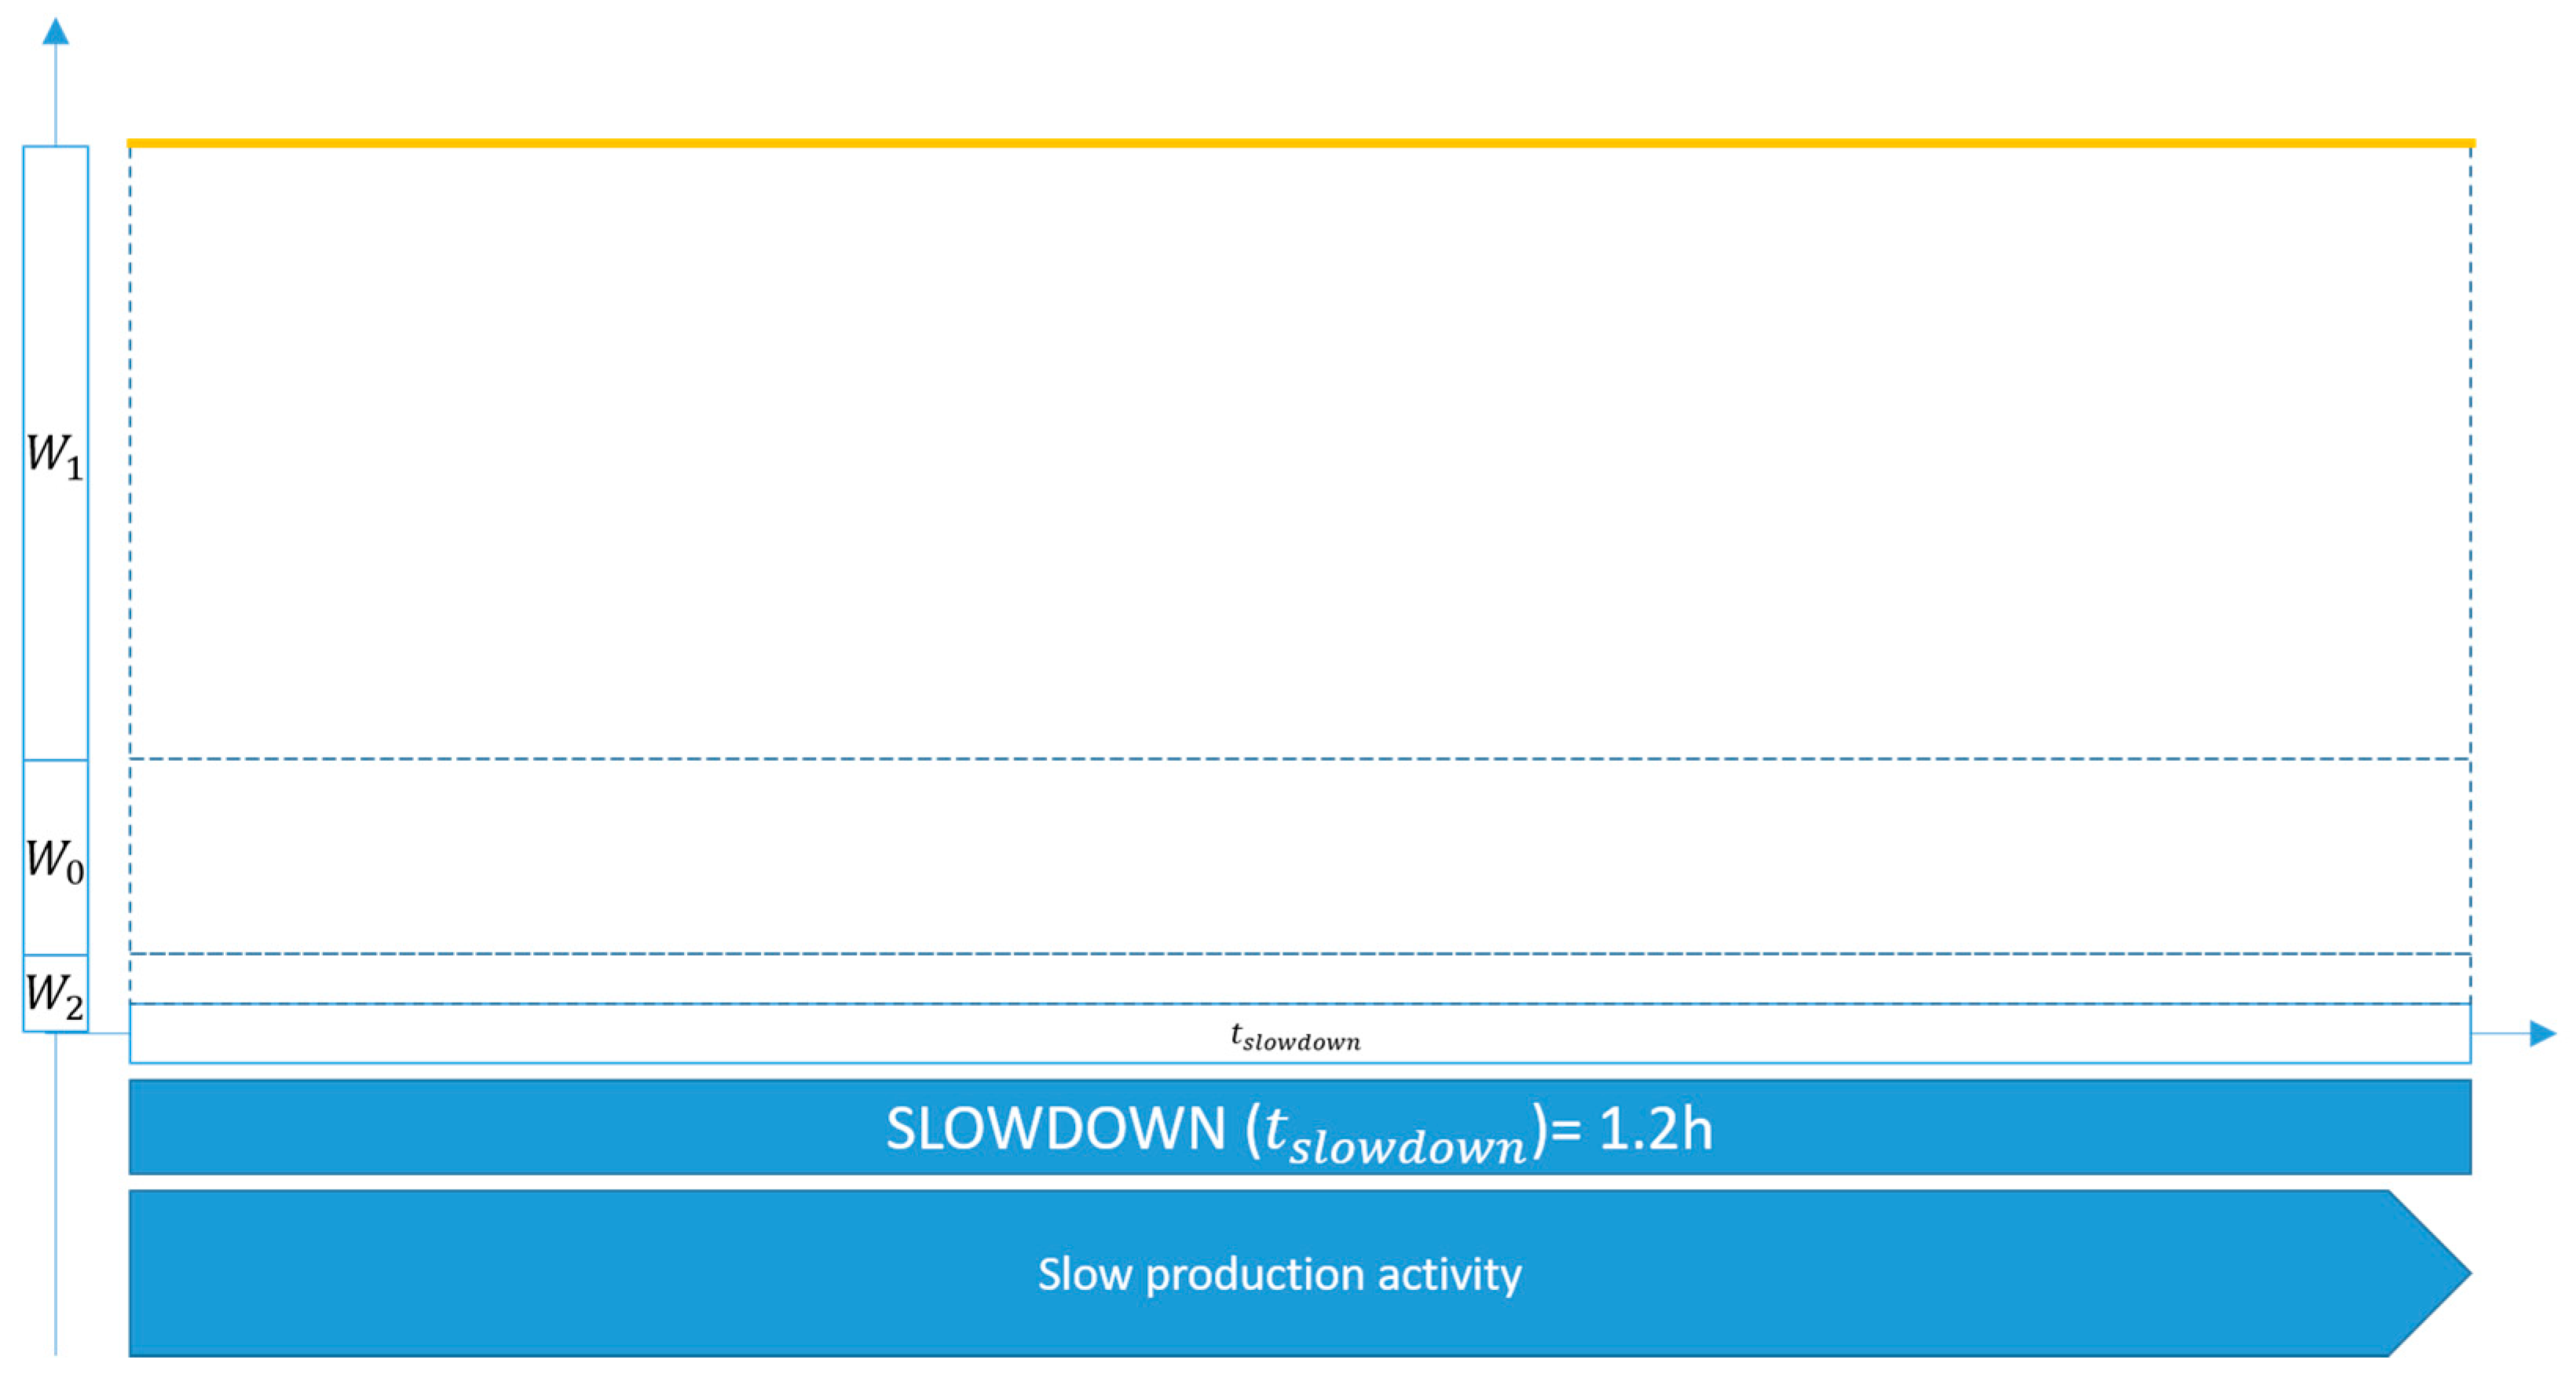
- C5. The Increases in Piece Cycle Time
To analyze this loss cause (Figure 11), the speed loss value () presented in Table 5 was taken as a reference, which is the product of the difference between the operating time (OT) and the net run time (NRT), which supposes an extension of the theoretical time necessary to produce a piece. Likewise, in this case, the measurement of the energy consumption values of the production line under study corresponds to a standby power of -Standby power,—Average power to support, —Average power in use.
In this way, the change in energy consumption corresponding to slowdowns and its equivalent environmental impact are shown in Table 12.
As a result, the energy loss corresponding to the increases in piece cycle time have a considerable environmental impact, represented in the emission of 138.1 kg of , which is why the performance rate, as evidenced in Table 5, is below ideal conditions.
- C6. Waste
The waste as loss of quality () is presented in Table 6 with a value of 0.2 h, corresponding to the time invested for the production of parts that have not complied with the required characteristics and therefore have been discarded or must be reworked. In this case, the values of are the same as in the immediately previous analysis related to slowdowns, and follows the same pattern as shown in Figure 11. Along the same lines, the change in energy consumption corresponding to waste ) and its equivalent to the environmental impact are presented in Table 13.
According to the result in Table 13, 17.1 kg of is emitted to the environment due to energy losses related to C6 waste.
Table 14 summarizes the energy consumption and emission for each different cause of loss.
The analysis performed on the data corresponding to the production line in the period January–February 2020 allows for the determination of the environmental impact of emissions to the environment associated with the six causes of energy loss studied (), which yielded a total of 366.9 kg as the average value of the line on a 24 h basis.
6. Discussion
The efficient use of natural resources and the need to combat climate change are topics that increasingly involve society, research, policy, and government in the debate on how to limit the impact of human activities on environmental sustainability. To achieve this goal, the finalistic behavior of human activities in economics requires a paradigm shift: instead of “maximum profit from the minimum of capital,” we need to achieve “maximum profit from the minimum of resources” [10].
This paper addresses the topic of energy efficiency in batch production processes. We proposed both a method to calculate the waste of energy from the OEE indicator during the type change of a batch production process and a model that comprises a CPPS together with IoT components. The model can be taken as a reference to implement PPC/MES software, which includes energy management. There are at least two implications arising from our findings. First, new generations of PPC and MES software systems can be developed for batch processes where energy is handled together with other resources whose consumption can be planned, controlled, and optimized. Second, the acquisition of precise information about energy losses, as well as productivity losses, motivates the activation of value co-creation programs aiming at the reduction of the carbon footprint and reducing manufacturing costs.
The idea to consider integrating energy as a resource in MES software was also previously discussed [33]. Unlike Bougain et al. [33], who focused primarily on machine characteristics, our work highlights the advantage of optimizing a batch production process that minimizes the energy waste that can occur during the various phases of a type change on the basis of accurate data collected by the underlying CPS.
At a higher level, many research results emphasize how the efficiency of production management decisions can be increased when integrating energy data, such as production planning and scheduling [51], demand response, machine configuration, the configuration of production processes [21], maintenance management, and logistics [49]. In this sense, the multi-disciplinary analysis presented here has positive implications as a result of integrating energy consumption in production planning and control of enterprise resources and processes. In addition to facilitating the generation of management strategies that positively impact energy and economic savings, the CPS model shown in Figure 5 allowed us to consider other improvements. For example, predictive maintenance through IoT and big data techniques [52] can be achieved, from which improved machinery availability and process performance can be derived. This aspect will be the next step of this research.
Process optimization also reduces energy consumption [21]. For example, minimizing the time of support activities that do not create value (e.g., handling work parts in a cell or maintenance of machinery) contributes to an increase in overall energy efficiency. From this point of view, the monitoring of the availability, performance, and quality of manufacturing equipment and/or facilities becomes relevant. For this purpose, IoT devices, such as smart sensors and smart meters, are generally used as tools for collecting accurate and real-time energy consumption data to be used in scheduling optimization [21].
Since the OEE’s analysis related to the case study showed that the most important loss was due to the failure of the machines belonging to the line, an improvement program was started for maintenance activities, approached from the lens of value co-creation. The identified participant, the relationships among them, and the technologies adopted (row 1) or identified for future implementation (rows 2–4) are shown in Table 15. During the development of the program, professional maintenance (PM) software was developed to allow immediate internal maintainer intervention to restore the operation of the faulty machine. The PM receives data either directly by the machine (through the CPPS) or from the machine operator who uses the MES to report the failure.
The continuous assessment of losses stratified by type allows a systematic approach to increasing the OEE, producing better production performance and reducing energy consumption. As a consequence of precise measurements of process variables, it is possible to use standard management techniques according to the type of loss when a calculated average time value exceeds a defined threshold. The following approaches have been used in manufacturing industries to improve the performance of the production process: In the automotive industries, the World Class Manufacturing approach [95] adopted Single-Minute Exchange of Die (SMED) [96], Kaizen [97], and advanced autonomous maintenance management [11]. With reference to the case study, the values indicated below were considered for the support of maintenance activity decisions. These are empirical values deduced from the observation and analysis of historical data, and have produced acceptable results during the study.
- If the type change exceeds 2.5 h/day, the SMED methodologies must be applied to enable the reduction of machine downtimes through the improvement of the changeover process.
- If the stops due to a fault exceed 3 h/day, use the autonomous and/or professional maintenance procedures.
- If the transients exceed 0.5 h/day, Kaizen advanced methodologies must be applied for the analysis of events.
- If the micro-stops and the slowdowns exceed 0.5 and 1.5 h/day, respectively, use the advanced autonomous maintenance.
Traditionally, the criticism of these methods for improving performance is derived from the collection of data that can introduce errors and delays in decisions. The model in Figure 5 contributes to overcoming these drawbacks as the data are collected automatically and in real time, allowing automating the intervention requests to the interested bodies so that the necessary interventions can be triggered promptly. This is an important achievement because each delay in the problem-solving procedure incurs energy losses.
The case study discussed in this paper is representative of a scenario frequently occurring in manufacturing. During the first application of this method, a gain of 7% was obtained on the OEE value of Equation (9), increasing the value from 48 to 55%. This result was achieved by increasing the availability value from 54.4 to 61.9% applying the time-based and emergency maintenance using the technology mentioned in the first row of Table 15. As a result, the energy consumption decreases from 349.1 to 268.2 kWh and the corresponding emission of decreases from 139.7 to 107.3 kg in case C2 (plant failure). Other improvements can be obtained by applying the points a, c, and d previously described. This is still far from the gold standard of OEE, but it was achieved by the adoption of PM software to manage the emergency maintenance and by a simple process improvement during the type change. Further improvements are expected by the implementation of the remaining maintenance activities in Table 15 and by the optimization of operations during the type change.
Notably, the consumption data, collected during this study by an energy sensor located upstream of the line, refer to batch production. However, the model in Figure 5 can also be adapted to other layouts among those described in Section 2.1. For example, the factory in which we conducted this study contains some large presses that operate as individual devices but also cell or multi-machine systems. In the first case, the model is simplified as the production process affects only one machine. In the case of cellular or multi-machine systems, the situation is similar to what has already been observed for the line.
Decision makers should be aware that optimizing energy consumption on the factory floor is a complex problem that requires different types of intervention to be better managed. We focused on the combination of management methodologies and Industry 4.0 technologies, but other types of intervention are possible. For example, industrial research has produced a new generation of electric motors in which the energy consumed during the initial transient is gradually supplied by the controller, avoiding unnecessary losses. Energy recovery presses and leak control systems [10] are other examples of possible improvements.
Several future developments are possible from this work. In the developed analysis, we studied the environmental impact in terms of consumption of machine production inefficiencies from OEE-related losses of the transformation process. We could consider the proposed analysis method in the seven lean production waste scenario, but the method must be enriched with the possibility to manage views (for example, overproduction or material handling). Another development direction is the idea of a single point of access for all the planning and control functions in real time also considering the perspective of energy savings. This could be achieved even in the supply chain (material handling, energy, human resources, machines allocation, etc.) and will imply the use of generalized algorithms and Industry 4.0 technologies.
Author Contributions
Conceptualization, G.N.; methodology, A.T.L.; data curation, F.D.N.; validation, G.N. and D.P.; formal analysis, A.T.L.; investigation, D.P. and F.D.N.; writing—original draft preparation, F.D.N. and A.T.L.; writing—review and editing, G.N. and A.T.L.; supervision, G.N.; project administration, D.P.; funding acquisition, G.N. All authors have read and agreed to the published version of the manuscript.
Funding
The authors disclosed receipt of the following financial support for this research: MIUR—project “PICO e PRO, n. ARS01_01061.”
Acknowledgments
The authors thank Massimo De Lisio for the drawing of Figure 6.
Conflicts of Interest
The authors declare no conflict of interest.
Appendix A

Table A1.
Summary of search terms used for the literature review.
| No. | Literature Search Strings | No. of Document Results | No. of Refined Document Results |
|---|---|---|---|
| 1 | (“Overall Equipment Efficiency” OR OEE) AND (“Energy management”) AND manufacturing | 7 | 3 |
| 2 | (“Overall Equipment Efficiency” OR OEE) AND (“Energy efficiency”) AND manufacturing | 24 | 13 |
| 3 | (“Overall Equipment Efficiency” OR OEE) AND (“Energy consumption”) AND manufacturing | 31 | 19 |
| 4 | (“Overall Equipment Efficiency” OR OEE) AND (“Energy saving”) AND manufacturing | 8 | 5 |
| 5 | (“Overall Equipment Efficiency” OR OEE) AND Energy AND “process optimization” AND manufacturing | 4 | 0 |
| 6 | (“Overall Equipment Efficiency” OR OEE) AND Energy AND “process management” AND manufacturing | 5 | 2 |
| 7 | (“Overall Equipment Efficiency” OR OEE) AND Energy AND (“Cyber-physical system” OR “Cyber physical system”) AND manufacturing | 4 | 4 |
| 8 | (“Industry 4.0” OR (IoT OR “Internet of Things”)) AND (“Energy management”) AND manufacturing | 118 | 26 |
| 9 | (“Industry 4.0” OR (IoT OR “Internet of Things”)) AND (“Energy efficiency”) AND manufacturing | 228 | 45 |
| 10 | (“Industry 4.0” OR (IoT OR “Internet of Things”)) AND (“Energy consumption”) AND manufacturing | 345 | 56 |
| 11 | (“Industry 4.0” OR (IoT OR “Internet of Things”)) AND (“Energy saving”) AND manufacturing | 89 | 12 |
| 12 | (“Industry 4.0” OR (IoT OR “Internet of Things”)) AND Energy AND “process optimization” AND manufacturing | 26 | 6 |
| 13 | (“Industry 4.0” OR (IoT OR “Internet of Things”)) AND Energy AND “process management” AND manufacturing | 32 | 8 |
| 14 | (“Industry 4.0” OR (IoT OR “Internet of Things”)) AND Energy AND (“Cyber-physical system” OR “Cyber physical system”) AND manufacturing | 191 | 77 |
| 15 | “Value co-creation” AND manufacturing AND sustainability | 150 | 29 |
| Total number of refined document results | 1262 | 305 | |
Appendix B
Table A2.
Relationship between factory layouts and management aspects.
| Factory Layout | ||||||
|---|---|---|---|---|---|---|
| Device/Machine/Unit Process | Line/Cell/Multi-Machine System | Facility/Shop Floor/Plant | Multi-Factory System | Enterprise/Global Supply Chain | ||
| Management aspects | OEE for energy management | [33,34] | [34,35] | [36] | ||
| Optimization process in manufacturing management | [13,37,38,39,40,41,42] | [41,42] | [36,40,43] | |||
| Asset management in operations and logistics | [9,37,41,44] | [45] | [46] | [43] | ||
| Facilities management, materials, and equipment management | [27,39,40,42,44,47] | [49] | ||||
Table A3.
Relationship between factory layouts and technological aspects.
| Factory Layout | ||||||
|---|---|---|---|---|---|---|
| Device/Machine/Unit Process | Line/Cell/Multi- Machine System | Facility/Shop Floor/Plant | Multi-Factory System | Enterprise/Global Supply Chain | ||
| Technological aspects | Energy management | [50] | [50] | [16,52,53] | [52] | |
| IoT contribution (monitoring, control, energy management) | [50] | [54] | [16,45,52,53,55] | [46,49] | [51,56,57] | |
| CPS contribution (planning, optimization, energy management) | [38,58,59,60,61,62,63] | [48,54,64] | [16,45,53,64,65] | [46,69] | [51,57,66,67,68] | |
| Technical efficiency | [51] | [55] | ||||
Table A4.
Relationship between factory layouts and value co-creation.
| Factory Layout | ||||||
|---|---|---|---|---|---|---|
| Device/Machine/Unit Process | Line/Cell/Multi-Machine System | Facility/Shop Floor/Plant | Multi-Factory System | Enterprise/Global Supply Chain | ||
| Value co-creation | Sustainability | [75] | ||||
| Decision-making | [75,79] | |||||
| Resource integration | [75,82] | |||||
| Optimization | [84,85] | [86] | ||||
| Information technologies | [83,84] | [85] | ||||
References
- Rosen, M.A. Engineering sustainability: A technical approach to sustainability. Sustainability 2012, 4, 2270–2292. [Google Scholar] [CrossRef] [Green Version]
- Faggini, M.; Cosimato, S.; Nota, F.D.; Nota, G. Pursuing Sustainability for Healthcare through Digital Platforms. Sustainability 2018, 11, 165. [Google Scholar] [CrossRef] [Green Version]
- Rosen, M.A.; Kishawy, H. Sustainable manufacturing and design: Concepts, practices and needs. Sustainability 2012, 4, 154–174. [Google Scholar] [CrossRef] [Green Version]
- Kanellakis, M.; Martinopoulos, G.; Zachariadis, T. European energy policy—A review. Energy Policy 2013, 62, 1020–1030. [Google Scholar] [CrossRef]
- Oyedepo, S.O. On energy for sustainable development in Nigeria. Renew. Sustain. Energy Rev. 2012, 16, 2583–2598. [Google Scholar] [CrossRef]
- Neves, A.R.; Leal, V. Energy sustainability indicators for local energy planning: Review of current practices and derivation of a new framework. Renew. Sustain. Energy Rev. 2010, 14, 2723–2735. [Google Scholar] [CrossRef]
- Mohamed, N.; Al-Jaroodi, J.; Lazarova-Molnar, S. Leveraging the Capabilities of Industry 4.0 for Improving Energy Efficiency in Smart Factories. IEEE Access 2019, 7, 18008–18020. [Google Scholar] [CrossRef]
- Shrouf, F.; Ordieres-Meré, J.; Miragliotta, G. Smart factories in Industry 4.0: A review of the concept and of energy management approached in production based on the Internet of Things paradigm. In Proceedings of the 2014 IEEE International Conference on Industrial Engineering and Engineering Management, Selangor, Malaysia, 9–12 December 2014; pp. 697–701. [Google Scholar] [CrossRef]
- Adolph, S.; Kübler, P.; Metternich, J.; Abele, E. Overall Commissioning Effectiveness: Systematic Identification of Value-added Shares in Material Supply. Procedia CIRP 2016, 41, 562–567. [Google Scholar] [CrossRef]
- The Federal Ministry of Education and Research. Energy Efficiency in Production: Future Action Fields; Fraunhofer Gesellschaft: Munich, Germany, 2008. [Google Scholar]
- Nakajima, S. Introduction to TPM: Total Productive Maintenance; Productivity Press Inc.: New York, NY, USA, 1988. [Google Scholar]
- SEMI. Semi E79-0200 Standard for Definition and Measurement of Equipment Productivity. Semicond. Equip. Mater. Int. 1999, 1–24. [Google Scholar]
- de Ron, J.; Rooda, J.E. OEE and equipment effectiveness E: An evaluation. Int. J. Prod. Res. 2009, 12, 1537–1546. [Google Scholar]
- May, G.; Taisch, M.; Prabhu, V.V.; Barletta, I. Integrity and Internal Control in Information Systems; Energy related key performance indicators—State of the art, gaps and industrial needs; Springer: Berlin/Heidelberg, Germany, 2013; Volume 414, pp. 257–267. [Google Scholar] [CrossRef] [Green Version]
- Wang, W.; Yang, H.; Zhang, Y.; Xu, J. IoT-enabled real-time energy efficiency optimisation method for energy-intensive manufacturing enterprises. Int. J. Comput. Integr. Manuf. 2017, 31, 362–379. [Google Scholar] [CrossRef]
- Zhang, Y.; Ma, S.; Yang, H.; Lv, J.; Liu, Y. A big data driven analytical framework for energy-intensive manufacturing industries. J. Clean. Prod. 2018, 197, 57–72. [Google Scholar] [CrossRef]
- Kang, H.S.; Lee, J.Y.; Choi, S.; Kim, H.; Park, J.H.; Son, J.Y.; Kim, B.H.; Noh, S.D. Smart manufacturing: Past research, present findings, and future directions. Int. J. Precis. Eng. Manuf. Green Technol. 2016, 3, 111–128. [Google Scholar] [CrossRef]
- UNIDO. Accelerating Clean Energy Through Industry 4.0 Manufacturing the Next Revolution; United Nations Industrial Development Organization: Vienna, Austria, 2017; p. 54. [Google Scholar]
- Moeuf, A.; Pellerin, R.; Lamouri, S.; Tamayo, S.; Barbaray, R. The industrial management of SMEs in the era of Industry 4.0. Int. J. Prod. Res. 2017, 56, 1118–1136. [Google Scholar] [CrossRef] [Green Version]
- Reich-Weiser, C.; Simon, R.; Fleschutz, T.; Yuan, C.; Vijayaraghavan, A.; Onsrud, H. Green Manufacturing: Fundamentals and Applications; Metrics forGreen Manufacturing; Springer: Boston, MA, USA, 2012; pp. 49–81. [Google Scholar] [CrossRef]
- Duflou, J.; Sutherland, J.W.; Dornfeld, D.; Herrmann, C.; Jeswiet, J.; Kara, S.; Hauschild, M.Z.; Kellens, K. Towards energy and resource efficient manufacturing: A processes and systems approach. CIRP Ann. Manuf. Technol. 2012, 61, 587–609. [Google Scholar] [CrossRef] [Green Version]
- Reich-Weiser, C.; Vijayaraghavan, A.; Dornfeld, D.A. Appropriate use of Green Manufacturing Frameworks. Green Manufacturing and Sustainable Manufacturing Partnership. 2010. Available online: https://escholarship.org/content/qt10w7h9rb/qt10w7h9rb.pdf (accessed on 5 June 2020).
- Groover, M.P. Automation, Production Systems and Computer-Integrated Manufacturing; Pearson Higher Education, Inc.: New York, NY, USA, 2015. [Google Scholar]
- Swamidass, P.M. Encyclopedia of Production and Manufacturing Management; Kluwer Academic Publisher: Boston, MA, USA, 2000. [Google Scholar]
- ISA-The Instrumentation Systems and Automation Society-TM. ANSI/ISA-88.01-1995, Batch Control, Part 1: Models and Terminology. 1995. Available online: https://gmpua.com/GAMP/ISA-88.pdf (accessed on 1 August 2020).
- Vorne Industries Inc. “Overall Equipment Effectiveness”, What is Overall Equipment Effectiveness? 2019. Available online: https://www.oee.com/ (accessed on 21 February 2020).
- Purba, H.H.; Wijayanto, E.; Aristiara, N. Analysis of Overall Equipment Effectiveness (OEE) with Total Productive Maintenance Method on Jig Cutting: A Case Study in Manufacturing Industry. J. Sci. Eng. Res. 2018, 5, 397–406. [Google Scholar]
- Schmidt, C.; Li, W.; Thiede, S.; Kornfeld, B.; Kara, S.; Herrmann, C. Implementing Key Performance Indicators for Energy Efficiency in Manufacturing. Procedia CIRP 2016, 57, 758–763. [Google Scholar] [CrossRef]
- Kellens, K.; Dewulf, W.; Overcash, M.; Hauschild, M.Z.; Duflou, J. Methodology for systematic analysis and improvement of manufacturing unit process life-cycle inventory (UPLCI)—CO2PE! initiative (cooperative effort on process emissions in manufacturing). Part 1: Methodology description. Int. J. Life Cycle Assess. 2011, 17, 69–78. [Google Scholar] [CrossRef]
- CECIMO. Concept Description for CECIMO ’s Self-Regulatory Initiative (SRI) for the Sector Specific Implementation of the Directive 2005/32/EC (EuP Directive); Comité Européen de Coopération des Industries de la Machine-Outil: Nernstweg, Hamburg, Germany, 2011; pp. 1–26. [Google Scholar]
- Abele, E.; Anderl, R.; Birkhofer, H. Environmentally-Friendly Product Development: Methods and Tools; Springer: London, UK, 2005. [Google Scholar]
- Liberati, A.; Altman, D.G.; Tetzlaff, J.; Mulrow, C.; Gøtzsche, P.C.; Ioannidis, J.P.A.; Clarke, M.; Devereaux, P.; Kleijnen, J.; Moher, D. The PRISMA statement for reporting systematic reviews and meta-analyses of studies that evaluate health care interventions: Explanation and elaboration. J. Clin. Epidemiol. 2009, 62, e1–e34. [Google Scholar] [CrossRef] [PubMed] [Green Version]
- Bougain, S.; Gerhard, D.; Nigischer, C.; Ugurlu, S. Towards Energy Management in Production Planning Software Based on Energy Consumption as a Planning Resource. Procedia CIRP 2015, 26, 139–144. [Google Scholar] [CrossRef] [Green Version]
- Müller, S.; Schlüter, W.; Krieg, J. Smart Melting: Increasing Efficiency in Non-Ferrous Melting and Die-Casting Plants through Incident Management. Appl. Mech. Mater. 2018, 882, 174–181. [Google Scholar] [CrossRef]
- Lindberg, C.-F.; Tan, S.; Yan, J.; Starfelt, F. Key Performance Indicators Improve Industrial Performance. Energy Procedia 2015, 75, 1785–1790. [Google Scholar] [CrossRef] [Green Version]
- Domingo, R.; Aguado, S. Overall Environmental Equipment Effectiveness as a Metric of a Lean and Green Manufacturing System. Sustainability 2015, 7, 9031–9047. [Google Scholar] [CrossRef] [Green Version]
- Lourenĉo, E.J.; Pereira, J.; Barbosa, R.; Baptista, A. Using Multi-layer Stream Mapping to Assess the Overall Efficiency and Waste of a Production System: A Case Study from the Plywood Industry. Procedia CIRP 2016, 48, 128–133. [Google Scholar] [CrossRef] [Green Version]
- Rehe, M.; Denkena, B.; Wagener, C. Energy consumption analysis of modules for CPS retrofitting. Procedia Manuf. 2018, 24, 48–53. [Google Scholar] [CrossRef]
- Yazdi, P.G.; Azizi, A.; Hashemipour, M. An empirical investigation of the relationship between overall equipment efficiency (OEE) and manufacturing sustainability in industry 4.0 with time study Approach. Sustainability 2018, 10, 3031. [Google Scholar] [CrossRef] [Green Version]
- Yazdi, P.G.; Azizi, A.; Hashemipour, M. A hybrid methodology for validation of optimization solutions effects on manufacturing sustainability with time study and simulation Approach for SMEs. Sustainability 2019, 11, 1454. [Google Scholar] [CrossRef] [Green Version]
- Durán, O.; Durán, P.A. Prioritization of Physical Assets for Maintenance and Production Sustainability. Sustainability 2019, 11, 4296. [Google Scholar] [CrossRef] [Green Version]
- Creutznacher, T.; Berger, U.; Lepratti, R.; Lamparter, S. The Transformable Factory: Adapting Automotive Production Capacities. Procedia CIRP 2016, 41, 171–176. [Google Scholar] [CrossRef] [Green Version]
- Graham, I.; Goodall, P.; Peng, Y.; Palmer, C.; West, A.; Conway, P.P.; Mascolo, J.E.; Dettmer, F.U. Performance measurement and KPIs for remanufacturing. J. Remanuf. 2015, 5. [Google Scholar] [CrossRef] [Green Version]
- Kuznetsov, A.P.; Koriath, H.-J.; Kalyashina, A.; Langer, T. Equivalence assessment method for the resource efficiency of equipment, technologies and production systems. Procedia Manuf. 2018, 21, 525–532. [Google Scholar] [CrossRef]
- Velandia, D.M.S.; Kaur, N.; Whittow, W.G.; Conway, P.P.; West, A.A. Towards industrial internet of things: Crankshaft monitoring, traceability and tracking using RFID. Robot. Comput. Manuf. 2016, 41, 66–77. [Google Scholar] [CrossRef] [Green Version]
- Zhang, Y.; Guo, Z.; Lv, J.; Liu, Y. A Framework for Smart Production-Logistics Systems Based on CPS and Industrial IoT. IEEE Trans. Ind. Inform. 2018, 14, 4019–4032. [Google Scholar] [CrossRef] [Green Version]
- Cesarotti, V.; Introna, V.; Rotunno, R.; Scerrato, G. Investigating the relationship between energy consumption and overall equipment effectiveness for improving manufacturing systems’ productivity: An application in the thermoforming process. Int. J. Prod. Qual. Manag. 2016, 18, 279. [Google Scholar] [CrossRef]
- Thiede, S.; Juraschek, M.; Herrmann, C. Implementing Cyber-physical Production Systems in Learning Factories. Procedia CIRP 2016, 54, 7–12. [Google Scholar] [CrossRef] [Green Version]
- Preuveneers, D.; Ilie-Zudor, E. The intelligent industry of the future: A survey on emerging trends, research challenges and opportunities in Industry 4.0. J. Ambient. Intell. Smart Environ. 2017, 9, 287–298. [Google Scholar] [CrossRef] [Green Version]
- Shrouf, F.; Miragliotta, G. Energy management based on Internet of Things: Practices and framework for adoption in production management. J. Clean. Prod. 2015, 100, 235–246. [Google Scholar] [CrossRef]
- Zhang, Y.; Wang, J.; Liu, Y. Game theory based real-time multi-objective flexible job shop scheduling considering environmental impact. J. Clean. Prod. 2017, 167, 665–679. [Google Scholar] [CrossRef]
- Zhong, R.; Xu, X.; Klotz, E.; Newman, S.T. Intelligent Manufacturing in the Context of Industry 4.0: A Review. Engineering 2017, 3, 616–630. [Google Scholar] [CrossRef]
- Bonilla, S.H.; Silva, H.R.O.; da Silva, M.T.; Gonçalves, R.F.; Sacomano, J.B. Industry 4.0 and Sustainability Implications: A Scenario-Based Analysis of the Impacts and Challenges. Sustainability 2018, 10, 3740. [Google Scholar] [CrossRef] [Green Version]
- Zuo, Y.; Tao, F.; Nee, A.Y.C. An Internet of things and cloud-based approach for energy consumption evaluation and analysis for a product. Int. J. Comput. Integr. Manuf. 2017, 31, 337–348. [Google Scholar] [CrossRef]
- Nagy, J.; Oláh, J.; Erdei, E.; Máté, D.; Popp, J. The Role and Impact of Industry 4.0 and the Internet of Things on the Business Strategy of the Value Chain—The Case of Hungary. Sustainability 2018, 10, 3491. [Google Scholar] [CrossRef] [Green Version]
- Tao, F.; Wang, Y.; Zuo, Y.; Yang, H.; Zhang, M. Internet of Things in product life-cycle energy management. J. Ind. Inf. Integr. 2016, 1, 26–39. [Google Scholar] [CrossRef]
- Chen, Y. Integrated and Intelligent Manufacturing: Perspectives and Enablers. Engineering 2017, 3, 588–595. [Google Scholar] [CrossRef]
- Colledani, M.; Bolognese, L.; Ceglarek, D.; Franchini, F.; Mariné, C.; Mistry, A. Multi-objective Early-stage Design of Automotive Hybrid Assembly Lines. Procedia CIRP 2015, 28, 125–130. [Google Scholar] [CrossRef] [Green Version]
- Stock, T.; Seliger, G. Opportunities of Sustainable Manufacturing in Industry 4.0. Procedia CIRP 2016, 40, 536–541. [Google Scholar] [CrossRef] [Green Version]
- Lee, J.; Ardakani, H.D.; Yang, S.; Bagheri, B. Industrial Big Data Analytics and Cyber-physical Systems for Future Maintenance & Service Innovation. Procedia CIRP 2015, 38, 3–7. [Google Scholar] [CrossRef] [Green Version]
- Galaske, N.; Anderl, R. Disruption Management for Resilient Processes in Cyber-physical Production Systems. Procedia CIRP 2016, 50, 442–447. [Google Scholar] [CrossRef] [Green Version]
- Abele, E.; Metternich, J.; Tisch, M.; Chryssolouris, G.; Sihn, W.; Elmaraghy, H.; Hummel, V.; Ranz, F. Learning Factories for Research, Education, and Training. Procedia CIRP 2015, 32, 1–6. [Google Scholar] [CrossRef]
- Chen, J.-H.; Yang, J.; Zhou, H.; Xiang, H.; Zhu, Z.; Li, Y.; Lee, C.-H.; Xu, G. CPS Modeling of CNC Machine Tool Work Processes Using an Instruction-Domain Based Approach. Engineering 2015, 1, 247–260. [Google Scholar] [CrossRef] [Green Version]
- Liu, C.; Jiang, P. A Cyber-physical System Architecture in Shop Floor for Intelligent Manufacturing. Procedia CIRP 2016, 56, 372–377. [Google Scholar] [CrossRef] [Green Version]
- Fraga-Lamas, P.; Davila, D.N.; Fernandez-Carames, T.M.; Díaz-Bouza, M.A.; Vilar-Montesinos, M.A. Smart Pipe System for a Shipyard 4.0. Sensors 2016, 16, 2186. [Google Scholar] [CrossRef] [PubMed] [Green Version]
- Faller, C.; Feldmüller, D. Industry 4.0 Learning Factory for regional SMEs. Procedia CIRP 2015, 32, 88–91. [Google Scholar] [CrossRef] [Green Version]
- Seitz, K.-F.; Nyhuis, P. Cyber-Physical Production Systems Combined with Logistic Models—A Learning Factory Concept for an Improved Production Planning and Control. Procedia CIRP 2015, 32, 92–97. [Google Scholar] [CrossRef] [Green Version]
- Siemieniuch, C.; Sinclair, M.; Henshaw, M. Global drivers, sustainable manufacturing and systems ergonomics. Appl. Ergon. 2015, 51, 104–119. [Google Scholar] [CrossRef] [Green Version]
- Galvagno, M.; Dalli, D. Theory of value co-creation: A systematic literature review. Manag. Serv. Qual. 2014, 24, 643–683. [Google Scholar] [CrossRef]
- Prahalad, V.; Ramaswamy, C.K. Co-opting customer competence. Harv. Bus. Rev. 2000, 78, 79–90. [Google Scholar]
- Prahalad, V.; Ramaswamy, C.K. The Future of Competition: Co-creating Unique Value with Customers; Springer: Boston, MA, USA, 2004. [Google Scholar]
- Prahalad, C.; Ramaswamy, V. Co-creation experiences: The next practice in value creation. J. Interact. Mark. 2004, 18, 5–14. [Google Scholar] [CrossRef] [Green Version]
- Vargo, S.L.; Lusch, R.F. Evolving to a new dominant logic for marketing. J. Mark. 2004, 68, 1–17. [Google Scholar] [CrossRef] [Green Version]
- Mele, C.; Polese, F. Key Dimensions of Service Systems in Value-Creating Networks. In The Science of Service Systems; Demirkan, H., Spohrer, J.A., Krishna, V., Eds.; Springer Science Business Media: Boston, MA, USA, 2011; pp. 107–129. [Google Scholar]
- Brozović, D.; D’Auria, A.; Tregua, M. Value Creation and Sustainability: Lessons from Leading Sustainability Firms. Sustainability 2020, 12, 4450. [Google Scholar] [CrossRef]
- Kemper, J.; Schilke, O.; Reimann, M.; Wang, X.; Brettel, M. Competition-motivated corporate social responsibility. J. Bus. Res. 2013, 66, 1954–1963. [Google Scholar] [CrossRef]
- Eteokleous, P.P.; Leonidou, L.C.; Katsikeas, C.S. Corporate social responsibility in international marketing: Review, assessment, and future research. Int. Mark. Rev. 2016, 33, 580–624. [Google Scholar] [CrossRef]
- de Brito, M.P.; Terzieva, L. Key elements for designing a strategy to generate social and environmental value: A comparative study of festivals. Res. Hosp. Manag. 2016, 6, 51–59. [Google Scholar] [CrossRef]
- Ueda, K.; Takenaka, T.; Fujita, K. Toward value co-creation in manufacturing and servicing. CIRP J. Manuf. Sci. Technol. 2008, 1, 53–58. [Google Scholar] [CrossRef]
- Brunet, A.P.; New, S. Kaizenin Japan: An empirical study. Int. J. Oper. Prod. Manag. 2003, 23, 1426–1446. [Google Scholar] [CrossRef] [Green Version]
- Schonberger, R.; Gilbert, J. JIT Purchasing: A challenge for U. S. Industry. Calif. Manag. Rev. 1983, 26, 54–68. [Google Scholar] [CrossRef]
- Uhlmann, E.; Peukert, B.; Prasol, L.; Könnecke, K. Value Co-Creation in Living Factories Based on Shared Manufacturing Equipment. 1. Interdisziplinäre Konferenz zur Zukunft der Wertschöpfung; Helmut-Schmidt-Universität: Holstenhofweg, Hamburg, Germany, 2016; pp. 199–208. [Google Scholar]
- Barbu, A.; Militaru, G. Value Co-Creation between Manufacturing Companies and Customers. The Role of Information Technology Competency. Procedia Manuf. 2019, 32, 1069–1076. [Google Scholar] [CrossRef]
- Kaihara, T.S.; Kokuryo, D.; Suginouchi, S.; Kuik, S. Reconstruction of the Public Sphere in the Socially Mediated Age; Value Co-creative Manufacturing Methodology with IoT-Based Smart Factory for Mass Customisation; Springer Science and Business Media LLC: New York, NY, USA, 2017; pp. 165–180. [Google Scholar]
- Aarikka-Stenroos, L.; Jaakkola, E. Value co-creation in knowledge intensive business services: A dyadic perspective on the joint problem solving process. Ind. Mark. Manag. 2012, 41, 15–26. [Google Scholar] [CrossRef]
- Zaborek, P.; Mazur, J. Enabling value co-creation with consumers as a driver of business performance: A dual perspective of Polish manufacturing and service SMEs. J. Bus. Res. 2019, 104, 541–551. [Google Scholar] [CrossRef]
- Liu, A.H. Customer value and switching costs in business services: Developing exit barriers through strategic value management. J. Bus. Ind. Mark. 2006, 21, 30–37. [Google Scholar] [CrossRef]
- Olaru, D.; Purchase, S.; Peterson, N. From customer value to repurchase intentions and recommendations. J. Bus. Ind. Mark. 2008, 23, 554–565. [Google Scholar] [CrossRef] [Green Version]
- Hermann, M.; Pentek, T.; Otto, B. Design Principles for Industrie 4.0 Scenarios. In Proceedings of the 2016 49th Hawaii International Conference on System Sciences (HICSS), Koloa, HI, USA, 5–8 January 2016; Institute of Electrical and Electronics Engineers (IEEE): New York, NY, USA, 2016; pp. 3928–3937. [Google Scholar]
- Dubey, R.; Gunasekaran, A.; Childe, S.J.; Wamba, S.F.; Papadopoulos, T. The impact of big data on world-class sustainable manufacturing. Int. J. Adv. Manuf. Technol. 2015, 84, 631–645. [Google Scholar] [CrossRef] [Green Version]
- Rüßmann, M.; Lorenz, M.; Gerbert, P.; Waldner, M.; Justus, J.; Engel, P.; Harnisch, M. Industry 4.0: The future of productivity and growth in manufacturing industries. Boston Consult. Group 2015, 9, 54–89. [Google Scholar]
- Greer, C.; Burns, M.; Wollman, D.; Griffor, E. Cyber-Physical Systems and Internet of Things; Cyber-physical systems and internet of things; National Institute of Standards and Technology (NIST): Gaithersburg, MD, USA, 2019.
- Kagermann, H.; Wahlster, W.; Helbig, J. Recommendations for Implementing the Strategic Initiative Industrie 4.0. Final Report of the Industrie 4.0 Working Group; Forschungsunion: Berlin, Germany, 2013. [Google Scholar]
- IEA, “Tracking Power”; International Energy Agency, Paris. 2019. Available online: http://www.eia.org/ (accessed on 30 March 2020).
- de Felice, F.; Petrillo, A.; Monfre, S. Operations Management; Improving Operations Performance with World Class Manufacturing Technique: A Case in Automotive Industry; IntechOpen: Rijeka, Croatia, 2013. [Google Scholar]
- Brito, M.; Ramos, A.L.; Carneiro, P.; Gonçalves, M. Combining SMED methodology and ergonomics for reduction of setup in a turning production area. Procedia Manuf. 2017, 13, 1112–1119. [Google Scholar] [CrossRef]
- Rossini, M.; Audino, F.; Costa, F.; Cifone, F.D.; Kundu, K.; Portioli-Staudacher, A. Extending lean frontiers: A kaizen case study in an Italian MTO manufacturing company. Int. J. Adv. Manuf. Technol. 2019, 104, 1869–1888. [Google Scholar] [CrossRef]
Figure 1.
Time intervals for the computation of Overall Equipment Effectiveness (OEE).

Figure 2.
System boundaries of a unit process [29].
Figure 2.
System boundaries of a unit process [29].

Figure 3.
A systematic review of the OEE indicator, Industry 4.0, and value co-creation contribution.
Figure 3.
A systematic review of the OEE indicator, Industry 4.0, and value co-creation contribution.

Figure 4.
The power profile of a type change in batch production.

Figure 5.
A scheme for the design and implementation of a Cyber-physical production system.

Figure 6.
Production line.

Figure 7.
Type change times.

Figure 8.
Failure times.

Figure 9.
Transients at the start and end of production times.

Figure 10.
Micro-stop times.

Figure 11.
Slowdown times.

Table 1.
Unproductive times and impact variations deriving from loss causes.
| Loss Causes | Loss | Impact Variation | |
|---|---|---|---|
| a. | Availability losses | ||
| C1. The production type changes | |||
| C2. The stops for failure | |||
| C3. The transients at the start and end of production | |||
| b. | Performance losses | ||
| C4. Stops not attributable to faults | |||
| C5. The increases in piece cycle time | |||
| c. | Quality losses | ||
| C6. Waste | where | ||
Table 2.
Type change subdivision into blocks.
| Block | Time | Energy Consumption |
|---|---|---|
| 1 | ||
| 2 | ||
| 3 | ||
| 4 | ||
| 5 |
Table 3.
The planned time for production.
| Total Time | 24.0 h | |
| Not Scheduled | 1.0 h | |
| Plant Operating Time | 23.0 h | |
| Planned Shutdown | 1.5 h | |
| Planned Production Time | 21.5 h |
Table 4.
Availability calculation.
| C1 (Type Change) | 2.6 h | |
| C2 (Plant Failure) | 6.9 h | |
| C3 (Start Up and Shut Down Transitory) | 0.3 h | |
| Down Time Loss (dtl) | 9.8 h | |
| Operating Time (OT) | 11.7 h | |
| Availability Rate (A) | 54.4% |
Table 5.
Performance calculation.
| Average Cycle Ime | 20.0 s | |
| No. Produced Parts | 1834 | |
| Net Run Time (NRT) | 10.2 h | |
| SPEED LOSS | 1.5 h | |
| C4 (Micro Stops) | 0.3 h | |
| C5 (Slow Down) | 1.2 h | |
| Performance Rate (P) | 90% |
Table 6.
Quality calculation.
| No. Scrap Parts | 27 | |
| C6 (Quality Loss) (ql) | 0.2 h | |
| Fully Productive Time (FPT) | 10.3 h | |
| Quality Rate (Q) | 100 | 98% |
Table 7.
Energy consumption and environmental impact calculation due to type change.
| Equation | kWh | ||
|---|---|---|---|
| 5.0 kg | |||
| 3.3 kg | |||
| 28.7 kg | |||
| 4.6 kg | |||
| 5.9 kg | |||
| TOTAL | 118.8 | 47.5 kg | |
Table 8.
Energy consumption calculation due to plant failure.
| Equation | kWh | ||
|---|---|---|---|
| 7.5 kg | |||
| 6.6 kg | |||
| 106.0 kg | |||
| 8.8 kg | |||
| 10.8 kg | |||
| TOTAL | 349.1 | 139.7 kg | |
Table 9.
Transitory times to start up and shut down.
| Start Up and Shut Down Transitory () | 0.3 h | |
| % Time for shut down transitory () | 38% | |
| Time for shut down transitory () | 0.1 h | |
| % Time for start up transitory () | 62% | |
| Time for start up transitory () | 0.2 h |
Table 10.
Energy consumption calculation due to transient losses.
| Equation | kWh | ||
|---|---|---|---|
| 7.3 kg | |||
| 11.9 kg | |||
| TOTAL | 48.0 | 19.2 kg | |
Table 11.
Energy consumption calculation due to micro-stops.
| Equation | kWh | ||
|---|---|---|---|
| 0.0 kg | |||
| 1.5 kg | |||
| 2.8 kg | |||
| 0.8 kg | |||
| 0.2 kg | |||
| TOTAL | 13.2 | 5.3 kg | |
Table 12.
Energy consumption and environmental impact due to slowdown.
| Equation | kWh | ||
|---|---|---|---|
| 138.1 kg |
Table 13.
Energy consumption due to waste.
| Equation | kWh | ||
|---|---|---|---|
| 17.1 kg |
Table 14.
Energy consumption and emission summary.
| kWh | ||
|---|---|---|
| C1 (Type Change) | 118.8 | 47.5 kg |
| C2 (Plant Failure) | 349.1 | 139.7 kg |
| C3 (Start Up and Shut Down Transitory) | 48.0 | 19.2 kg |
| C4 (Micro Stops) | 13.2 | 5.3 kg |
| C5 (Slow Down) | 138.1 kg | |
| C6 (Quality Loss) | 17.1 kg | |
| Total | 917.1 | 366.9 kg |
Table 15.
Maintenance activities.
| No. | Participant 1 | Participant 2 | Relationship Name | Technology |
|---|---|---|---|---|
| 1 | Planner | Internal maintainer | Time-based maintenance | PPC (Machine Ledger in Excel) |
| Emergency maintenance | CPPS/MES/PM | |||
| 2 | Planner | External maintainer | Condition based maintenance | CPPS/IoT/Cloud Computing |
| 3 | Internal maintainer | External maintainer | Condition based maintenance | CPPS/IoT/Cloud Computing |
| Corrective maintenance | ||||
| 4 | Planner | Machine manufacturer | Corrective maintenance | CPPS/IoT/Cloud Computing |
| Predictive maintenance |
© 2020 by the authors. Licensee MDPI, Basel, Switzerland. This article is an open access article distributed under the terms and conditions of the Creative Commons Attribution (CC BY) license (http://creativecommons.org/licenses/by/4.0/).
Share and Cite
MDPI and ACS Style
Nota, G.; Nota, F.D.; Peluso, D.; Toro Lazo, A. Energy Efficiency in Industry 4.0: The Case of Batch Production Processes. Sustainability 2020, 12, 6631. https://doi.org/10.3390/su12166631
AMA Style
Nota G, Nota FD, Peluso D, Toro Lazo A. Energy Efficiency in Industry 4.0: The Case of Batch Production Processes. Sustainability. 2020; 12(16):6631. https://doi.org/10.3390/su12166631
Chicago/Turabian StyleNota, Giancarlo, Francesco David Nota, Domenico Peluso, and Alonso Toro Lazo. 2020. "Energy Efficiency in Industry 4.0: The Case of Batch Production Processes" Sustainability 12, no. 16: 6631. https://doi.org/10.3390/su12166631
Note that from the first issue of 2016, this journal uses article numbers instead of page numbers. See further details here.