Article

Optimizing Conservation Strategies for a Threatened Tree Species: In Situ Conservation of White Ash (Fraxinus americana L.) Genetic Diversity through Insecticide Treatment

1
USDA Forest Service, Northern Research Station, 359 Main Rd., Delaware, OH 43015, USA
2
Biological Sciences, Department of Ecology and Evolution, University of Illinois at Chicago, 845 W, Taylor St, Chicago, IL 60607, USA
3
Chicago Botanic Gardens, Department of Plant Science, 1000 Lake Cook Rd, Glencoe, IL 60022, USA
4
The Morton Arboretum, 4100 Illinois Route 53, Lisle, IL 60532, USA
5
Department of Biology, Miami University, 316 Pearson Hall, Oxford, OH 45056, USA
6
USDA Forest Service, Allegheny National Forest, 4 Farm Colony Dr., Warren, PA 16365, USA
7
The USDA Forest Service, Northern Research Station, P.O. Box 267, Irvine, PA 16329, USA
*
Author to whom correspondence should be addressed.
Forests 2018, 9(4), 202; https://doi.org/10.3390/f9040202
Submission received: 20 February 2018 / Revised: 9 April 2018 / Accepted: 10 April 2018 / Published: 13 April 2018
(This article belongs to the Special Issue Understanding and Managing Emerald Ash Borer Impacts on Ash Forests)

Abstract

:
Forest resources face numerous threats that require costly management. Hence, there is an increasing need for data-informed strategies to guide conservation practices. The introduction of the emerald ash borer to North America has caused rapid declines in ash populations (Fraxinus spp. L.). Natural resource managers are faced with a choice of either allowing ash trees to die, risking forest degradation and reduced functional resilience, or investing in conserving trees to preserve ecosystem structure and standing genetic diversity. The information needed to guide these decisions is not always readily available. Therefore, to address this concern, we used eight microsatellites to genotype 352 white ash trees (Fraxinus americana L.) across 17 populations in the Allegheny National Forest; a subset of individuals sampled are part of an insecticide treatment regimen. Genetic diversity (number of alleles and He) was equivalent in treated and untreated trees, with little evidence of differentiation or inbreeding, suggesting current insecticidal treatment is conserving local, neutral genetic diversity. Using simulations, we demonstrated that best practice is treating more populations rather than more trees in fewer populations. Furthermore, through genetic screening, conservation practitioners can select highly diverse and unique populations to maximize diversity and reduce expenditures (by up to 21%). These findings will help practitioners develop cost-effective strategies to conserve genetic diversity.

1. Introduction

The intentional and unintentional spread of non-native species is contributing to the global reduction of plant diversity and the homogenization of plant communities [1,2]. Non-native insect pests and pathogens represent major destructive forces in forests, impacting productivity, biogeochemical cycling, hydrology and forest successional dynamics [3,4,5]. Conserving the genetic diversity of imperiled forest tree species is essential for maintaining the long-term sustainability and resilience of forest ecosystems. Genetic diversity provides the basis for adaptation to environmental and anthropogenic change [6], increases ecosystem stability and resilience [7,8], and promotes species diversity [9]. Particularly influential is the genetic diversity of foundational species, such as large trees. Although it is well established that conserving genetic diversity is crucial in preventing the extinction of populations and species, very few management plans incorporate genetic monitoring in their action plans [10].
Conserving genetic diversity typically relies on both an ex situ approach, in which a species is preserved outside of its natural habitat, and an in situ approach, in which viable, reproducing populations are maintained within the species’ natural habitat. Ex situ conservation can involve either maintenance of living trees, or storing seeds in long term storage such as a seed bank. Although ex situ approaches have the potential to save a majority of a species’ diversity, they also have their limitations. Seed banks only work for species with orthodox seeds, and accessions may be compromised either during the collection (selection bias) [11] or storage (e.g., seed death, mutation accumulation). Likewise, trees maintained in living collections require large planting areas, diversity can be lost through cycles of regeneration, and there is potential for adaptation to cultivated conditions [12,13]. The value of ex situ collections may also be limited if it is not associated with any in situ strategies. Reintroductions, with ex situ material, may be hampered by the degradation of underlying ecosystem properties associated with the initial disturbance and extirpation and loss of in situ mutualists, like pollinators, seed dispersers, and fungi. Recent evidence suggests that Fraxinus are associated with unique soil microbial assemblages which may be altered if ash were to be lost from a forest ecosystem [14]. Additionally, black ash (Fraxinus nigra Marshall) has been shown to help to maintain the hydraulic balance of sensitive wetland forests, and its loss from these systems because of the invasive emerald ash borer (Agrilus planipennis Fairmaire, EAB) may prevent the future establishment of black ash and other tree species [15]. Therefore, in situ conservation is often the preferred means of conserving a species, especially when used in conjunction with ex situ conservation.
Refinement of in situ approaches for maintaining imperiled species is required if managers are to maximize the genetic diversity conserved while minimizing costs. Developing such tools is increasingly necessary as outbreaks of forest pest and pathogen become more prevalent and result in widespread disturbances [16]. EAB, a non-native forest pest accidentally introduced into North America in the 1990’s, has spread from south eastern Michigan to over 31 states, resulting in a dramatic decline in numbers of ash trees [17]. There are 16 native species of ash trees (Fraxinus spp.) across North America [18], which collectively represent ~2.5% of the trees in the United States, with the greatest density and abundance in the Great Lakes Region [19]. EAB larvae, which feed predominately on phloem and cambial tissue, create serpentine galleries that effectively girdle host trees [20,21] and result in >99% tree mortality (for black, white and green ash see [22,23], relative to ~71% survival for blue ash see [24]). Due to this infestation, five ash species are now listed as critically endangered on the International Union for Conservation of Nature red list (F. pennsylvanica Marshall, F. americana, F. nigra, F. profunda (Bush) Bush, and F. quadrangulata Michx.) and one is listed as endangered (F. caroliniana Mill.) [25]. The loss of ash trees has been estimated to cost upwards of $60 billion USD, not including replacement costs [26], which will be significant in cities like Chicago, where there were significant numbers of ash trees (>600,000). Because of the lethal effects and speed with which EAB is spreading, managers need new tools to mitigate the impact.
The threat to ash trees has led to the development of a combined ex situ and in situ conservation approach. Ex situ methods include seed collection and storage, which have yielded collections from 1982 ash trees from five species (US National Plant Germplasm System). Meanwhile, the in situ methods include insecticide treatment of standing trees to protect them from future EAB attacks. In situ preservation will help maintain breeding populations of large trees in the landscape, thereby protecting ecosystems services, helping to ensure future ash reintroduction, and allowing continued natural selection and adaptation. Evidence from early in situ Fraxinus conservation efforts suggest a degree of associational protection, in which insecticide treatment of a small number of ash trees in a stand can promote the health of untreated trees [27]. However, the optimal treatment densities to achieve maximal associational protection remain unknown and are under investigation [28]. While insecticides have been used frequently for protection of urban street trees and yard trees, these cultivated ash are not representative of, and do not help to preserve, natural levels of genetic diversity. To address this concern, insecticide treatment has been expanded to multiple, naturally-occurring populations, managed by a diverse assemblage of landowners. Multiple insecticide formulations are available, but all require repeated treatments (yearly or every 3 years, depending on the insecticide used). The cost of emamectin benzoate injections, which have been demonstrated to be most effective at controlling EAB [29,30], range from $50 to $150 USD per tree, depending on tree diameter. Multiple entities have expressed interest in expanding these efforts; however, practical information is needed to help managers maximize the benefits of insecticide treatments while minimizing resource use.
As treating all trees in an area is usually not an option, a subset of trees will need to be chosen for treatment. If the objective is to maintain local standing genetic diversity, population models suggest that treating more trees will maximize the chance of conserving a substantial portion of the local alleles [31,32]. However, the relationship between allelic diversity and sample size is non-linear, hence there is a point at which additional individuals provide minimal gains in diversity. Ex situ seed collections protocols suggest that in order to maximize the local diversity collected, you need to sample a minimum of 50 unrelated maternal trees per population, and repeat for as many populations as possible [33]. However, the appropriate design of a conservation collection depends on various aspects of the target species, including population size, reproductive biology, recent population history, and connectivity among populations [34,35,36,37,38,39]. Given that it is nearly impossible to preserve all genetic material, determining the optimum number and spatial arrangement of treated trees will be important in efforts to conserve the majority of local genetic variation.
Here we investigated the genetic diversity of white ash trees (F. americana) across the Allegheny National Forest (ANF), and utilized the results to optimize a regional in situ conservation plan. Our goals were specifically to: (1) determine the genetic diversity and structure of white ash populations across the ANF; (2) quantify how varying levels of treatment (number of trees and populations) will affect the preservation of ash genetic diversity; and (3) formulate optimal strategies, including identifying which populations preserve the greatest proportion of genetic diversity. To achieve this, we conducted a genetic survey of white ash trees, then used computer algorithms to subsample the dataset with different possible sampling strategies (100 plants, 20 plants, etc.). Finally, we discuss implications for white ash, as well as caveats to this approach.

2. Materials and Methods
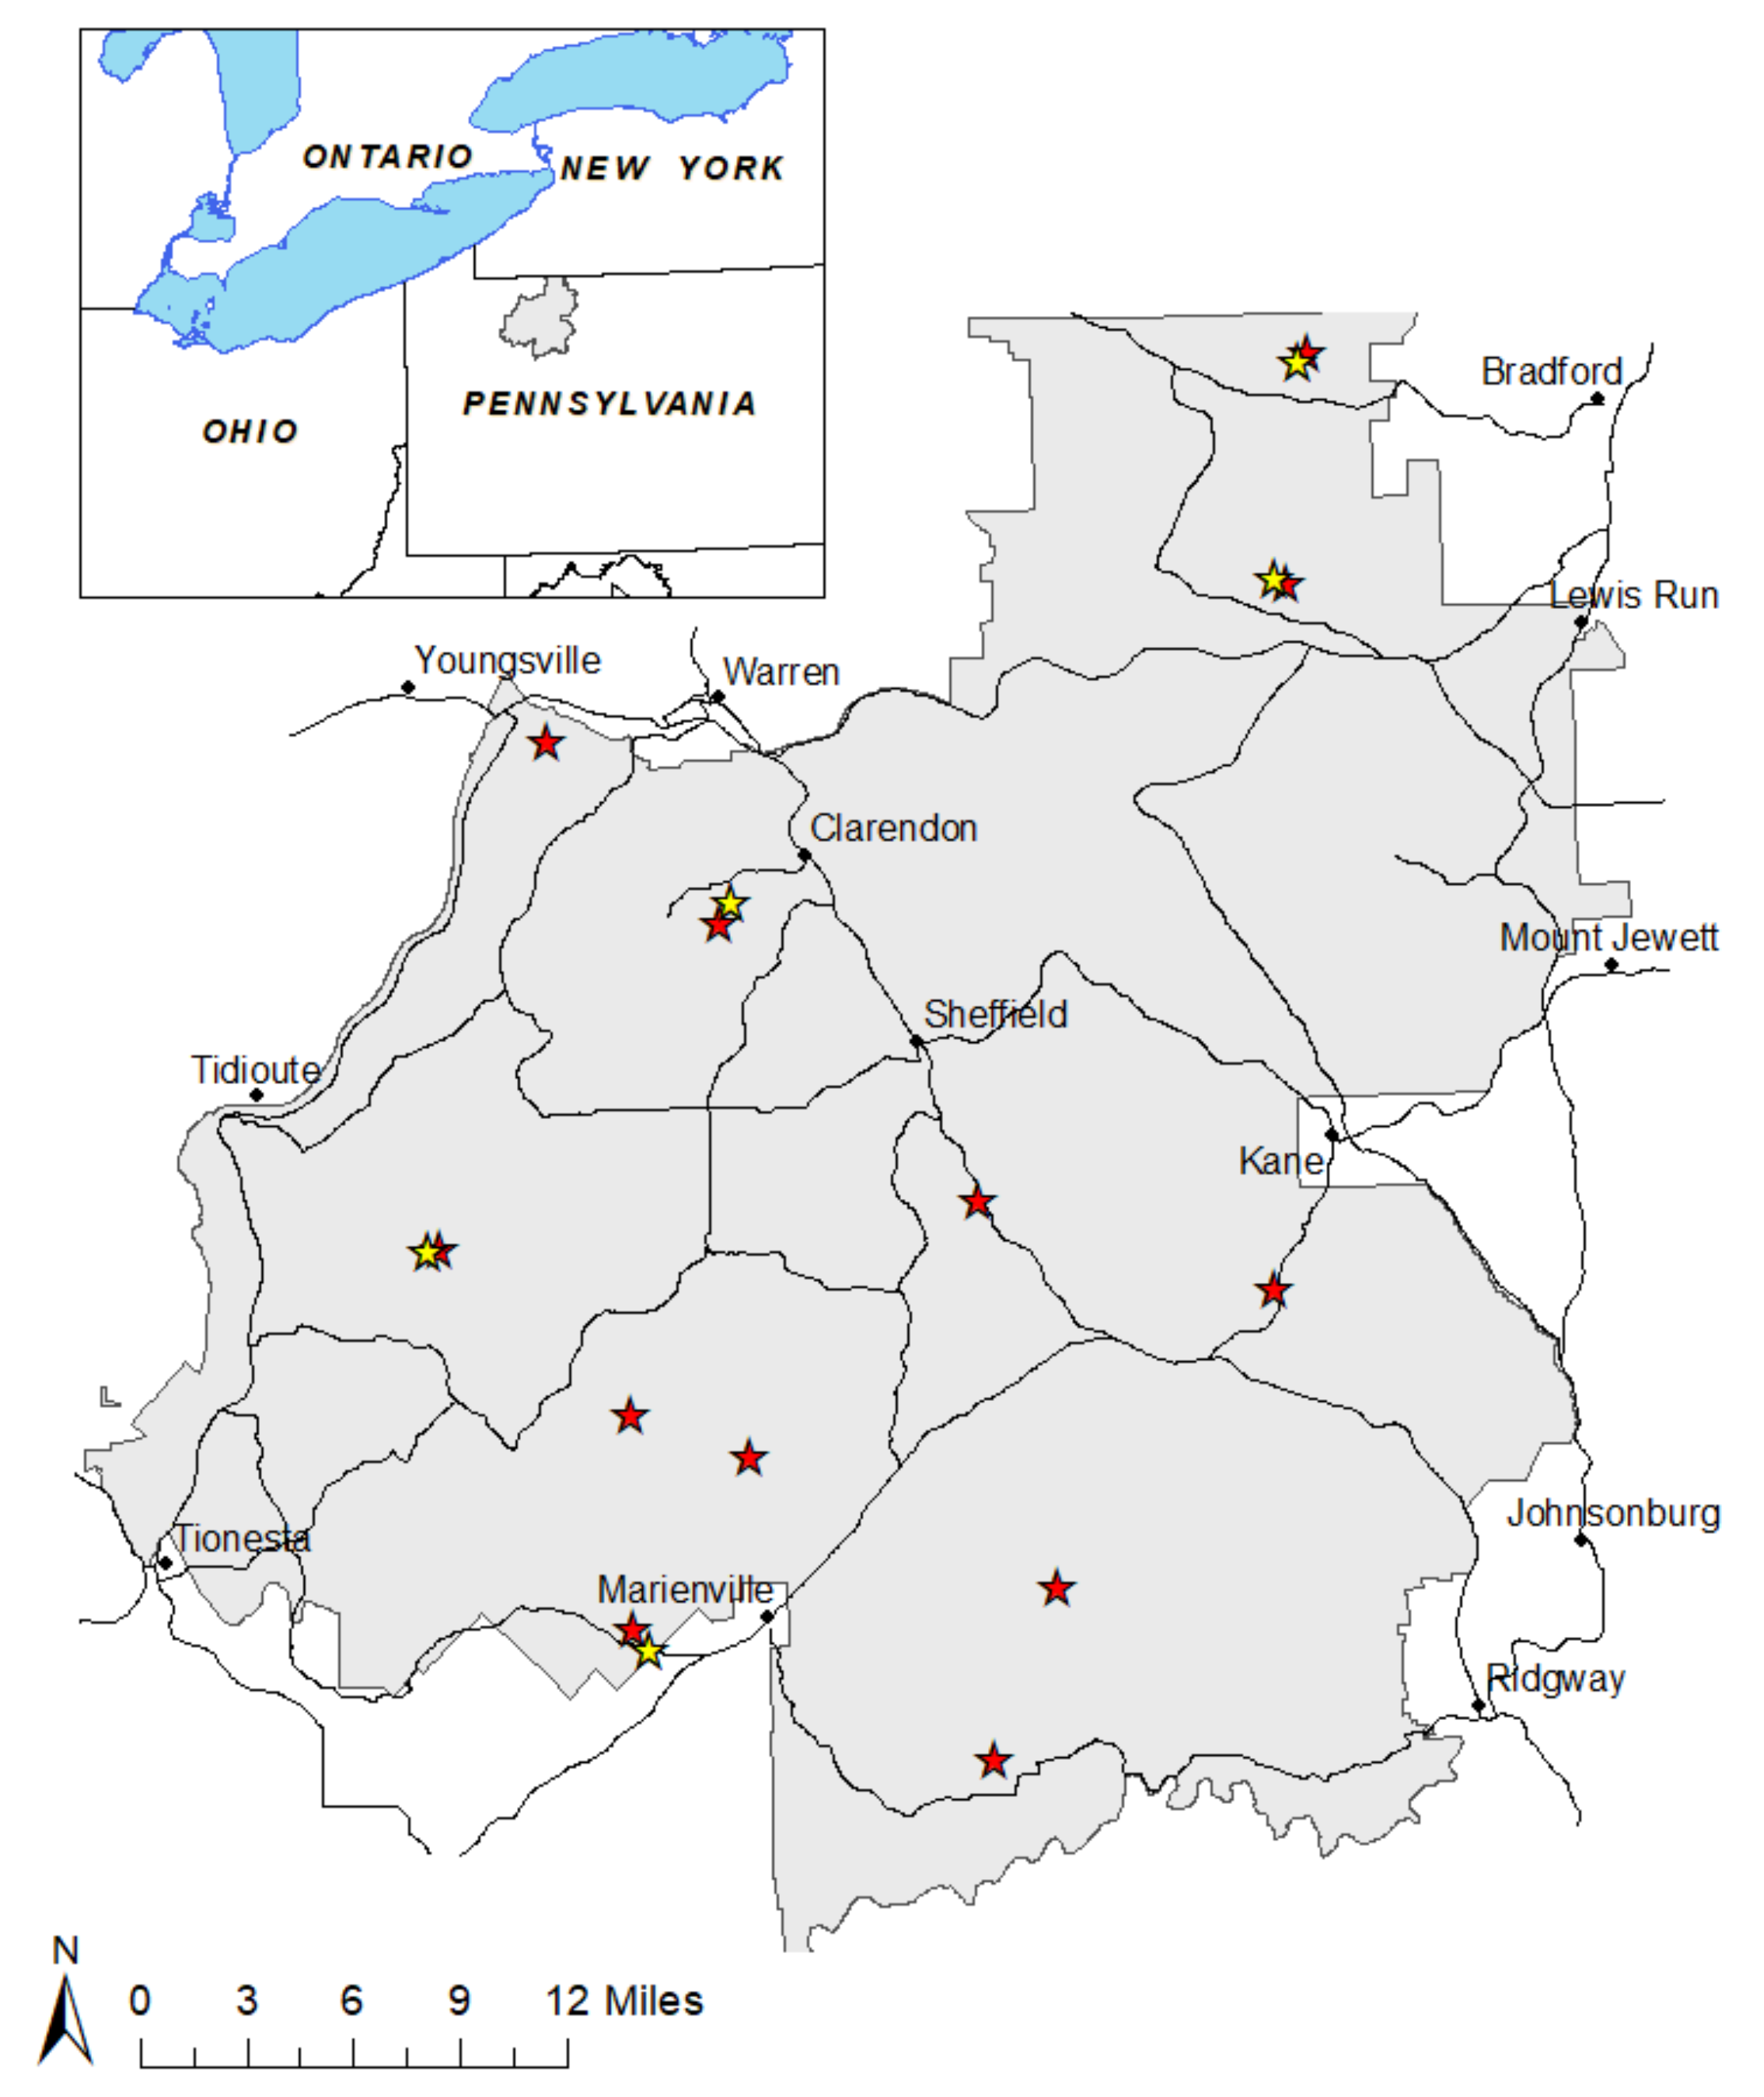
2.1. Site Selection

Our study was conducted in the Allegheny National Forest (ANF) in northwestern Pennsylvania, USA, which covers over 2075 km2 (Figure 1). The forest sits atop an unglaciated portion of the Allegheny plateau, and exhibits considerable variability in topographic relief. The forest ecosystem is comprised largely of secondary successional mixed deciduous forests, which regenerated after extensive anthropogenic disturbances in the late 1800’s and early 1900’s. The forest is managed intensively for timber and is dominated by black cherry, maples, and other hardwoods; Fraxinus spp. comprise nearly 3% of trees across the ANF, comparable to densities across the eastern US, but not as high as densities near the epicenter of the EAB outbreak.

2.2. Sample Collection

During 2015, 27 (100 m radius, 3.14 ha) permanent research plots were established across the ANF for in situ conservation efforts. These plots represent a portion of a larger network of plots across the ANF which was established to track the arrival and spread of EAB, as well as the decline of ash in the region. For the insecticide conservation effort, plots widely distributed across the ANF containing at least 20 ash trees were selected (Figure 1). These plots contained anywhere from 21 to 201 specimens. In May 2015, to protect these trees from EAB, a random subset of 20 ash trees within each site was treated with 0.157 g a.i./cm diameter at breast height of the systemic insecticide emamectin benzoate (Tree-äge®; Arborjet, Woburn, MA, USA) using the Arborjet Quick-Jet system (as directed by the manufacturer: Arborjet, Woburn, MA, USA). As such, in these plots, between ~10% and 95% of the ash were inoculated with insecticide. In July 2016, foliar samples were collected from 17 plots distributed across the ANF (see Figure 1; Table 1); these plots represent a subset of those assigned to the insecticide trial, as well as several other plots that did not receive insecticide treatment that comprise a wider geographic footprint. Furthermore, because many of the insecticide treated plots are paired (high and low elevation), sampling each of the paired plots would not be necessary to assess population genetics across the ANF, and would represent similar local alleles. Although it would be unexpected to see genetic differentiation between groups of individuals in close vicinity, it is possible that trees may exhibit phenological differences in flowering across systems with considerable topographic complexity as in this system. As such, we incorporated five of these areas into the study (denoted in Figure 1 below). In each plot, foliar samples were collected from ~30 trees (if available) which were randomly selected. Foliar samples were stored on ice in the field, and frozen until analysis, for a total of 352 trees sampled (consisting of 274 inoculated trees and 78 non-inoculated trees). Obviously, because of randomly selecting trees within the treatment plots, foliar samples were sourced from both insecticide and non-insecticide treated trees.

2.3. Genetic Analysis

Genomic DNA was extracted from ~1 cm2 of silica dried leaf tissues using a modified Cetyl trimethylammonium bromide (CTAB) method, developed by Doyle and Doyle [40]. Following DNA extraction and purification, the quality and concentration of DNA were evaluated using spectrophotometry (Nanodrop 2000, ThermoScientific, Waltham, MA, USA). A subset of samples was screened using 23 microsatellites primers pairs previously designed for F. excelsior L. [41,42,43,44], and 15 expressed sequence-simple sequence repeats (EST-SSR) designed from F. americana [41]. From these, 10 primer pairs amplified reliably and were polymorphic in our samples. The remainder produced no bands (9), were monomorphic (6), or did not amplify reliably (13). The final primer sets used in this study included FEMSATL 11 & FEMSATL 16 [41], FR639485 [44], M230 [45] and Fp21068, Fp20239, Fp19681; Fp12378; Fp14665; and Fp17710 [46].
To visualize the alleles, each forward primer was modified with the addition of an M13 sequence to the 5’ end (5′-CACGACGTTGTAAAACGAC-3′), to allow post-polymerase chain reaction (PCR) labeling with fluorescent dyes [47]. An initial PCR was conducted in a 10 μL reaction mixture containing 5 ng template DNA, 25 nM of forward and reverse primer, and 5 µL of MyTaqTM Master mix (Bioline, Taunton, MA, USA). This PCR mix was run for 2 min initial annealing (94 °C), then 15 cycles of 94 °C for 40 s, 57 °C for 40 s, and 72 °C for 90 s, and a final extension (72 °C) for 5 min. Once the initial PCR product was generated, it was labeled through a second PCR through the addition of 2.5 μL of MyTaqTM Master mix (Bioline, Taunton, MA, USA), 2.25 μL of DNA grade water and 0.25 μL M13 primer labeled with either WellRed Black (D2), Green (D3) or Blue (D4) fluorescent dye (Sigma-Proligo, The Woodlands, TX, USA-Sigma-Aldrich, St. Louis, MO, USA). The labeling PCR’s were conducted at 94 °C for 2 min, 27 cycles of 94 °C for 30 s, 55 °C for 30 s, and 72 °C for 1 min, and an extension of 72 °C for 10 min. PCR products were analyzed on a CEQ 8000 Genetic Analysis System with GenomeLab 400 internal size standard (ABSCIEX, Chicago, IL, USA).

2.4. Data Analysis

The program GENALEX [48] was used to generate descriptive parameters, including common metrics of genetic diversity such as mean number of alleles per locus (Ap) effective number of alleles per loci (Ae), expected heterozygosity (He), and number of private alleles (P), as well as measures of inbreeding, using Weir and Cockerham’s [49] estimates of Wright’s inbreeding co-efficient (FIS). The average pairwise relatedness of each population was calculated using the Queller and Goodnight [50] estimator in GENALEX. A generalized linear model was used to test for differences between treated and untreated trees for all genetic parameters using the lme4 statistical package in the statistical program R version 3.3.1 [51] (R Development Core Team, 2009). Pairwise genetic distances (Fst) were calculated using GENALEX [48]. The Bayesian clustering analysis software STRUCTURE [52] was used to determine if there was any geographic structure of genotypes within the ANF. We used the parameters: ploidy level two, length of burnin period 100,000, and the number of Markov chain Monte Carlo reps after burn 100,000 for the admixture model. To identify the optimal value of K, 20 replicates of each value of K was used from 1 to 20, which is 3 more than a total number of populations used [53]. Structure Harvester [54] was used to choose the most likely K.

2.4.1. Assessing the Success of In Situ Treatments

To determine the degree to which currently treated ash trees represent the genetic diversity of the entire ash population, we counted alleles present in the entire genotyped sample (ATotal), as well as alleles present only in the insecticide-treated sample (ATreated). ATreated/ATotal is the proportion of genetic diversity currently protected. We calculated this proportion for each of several categories of alleles: all, very common (overall frequency > 0.10), common (overall frequency > 0.05), low frequency (overall frequency < 0.10 and > 0.01), rare (overall frequency < 0.01), and “locally common” (present in only one population at frequency > 0.15 and in all other populations at frequency < 0.05). “Locally common” is included because this is the pattern reminiscent of local adaptation (high frequency in one local population only).

2.4.2. Optimizing In Situ Treatments

The following methods aim to test possible conservation strategies, in terms of number of trees and populations to treat. To test other possible treatment strategies, we used a resampling technique in which we repeatedly selected (from the genotyped dataset) at random a given number of trees from a given number of local populations for “treatment” (i.e., in situ conservation). For each sampling strategy, we calculated the proportion of genetic diversity protected in terms of all alleles (as above), and the identity of the selected populations was recorded. We tested various possible strategies, i.e., all combinations of 2 to 20 randomly chosen trees per population and 1 to 10 randomly chosen populations (thus there are 190 combinations of trees and trees per population), without replacement. As some populations are small (see Table 1), if a sampling strategy was attempted that exceeded population size, all trees available were sampled. Each of the 190 sampling strategies was performed 100,000 times (replicates), using the adegenet package [55] and a custom written set of functions in R version 3.3.1 [51] (see the R code file in Supplemental Materials). For each possible treatment strategy, we calculated the mean and standard deviation of alleles captured over all replicates.
It is possible that treating certain populations will be more effective than treating others, as some have more unique allelic diversity than others. As such, treating certain sets of populations can provide complementarity to cover all the unique alleles. Thus, an optimal set has the highest number of alleles. To identify the “best” or optimal sets of populations to treat, the 100,000 replicates (additional runs of 200,000 replicates showed identical results) were sorted by genetic diversity preserved for each of the 190 sampling combinations. The identity of the particular combinations of populations resulting in the highest number of alleles were recorded as the optimal set. For each of the 190 optimal sets, these populations were resampled an additional 100,000 times with different individuals. This resampling is designed to determine the distribution of allelic diversity from treating these populations. Lastly, the improvement due to sampling the optimal set was calculated as the difference between sampling a random set of populations and the optimal set of populations, assuming the random choice of trees within populations, for the 190 combinations, and for each allele category.

3. Results

3.1. White Ash Genetic Variability across the ANF

Across all sites, the average number of alleles per locus (Na) ranged from 1.4 to 8.2, the effective number of alleles ranged from 1.4 to 3.6, and gene diversity (He) ranged from 0.23 to 0.65 (Table 1). A total of 26 private alleles (P) were detected from 8 microsatellites across all populations. The numbers by population ranged from 0 to 7, with all being found in treated populations except for 2, which were located in one lowland population of untreated trees (PopID 200). For a few untreated sites, the death rate was so high that our sample size was reduced to only a handful of trees. As a consequence, the genetic diversity for these sites was the lowest. As genetic diversity metrics can be limited at small sample sizes, these populations were excluded for the statistical comparisons between treated and untreated plots. Once these plots were removed we found a significant difference between treated and untreated populations for number of alleles per loci (t1,11 = 2.85, p = 0.02), with treated populations being higher. There were no significant differences in the number of effective alleles (t1,11 = 1.82, p = 0.10) or gene diversity (t1,11 = 0.94, p = 0.37). Inbreeding coefficient ranged from −1.00 to 0.16, although for populations which had larger samples sizes (n > 16), the range was restricted from 0.00 to 0.14, suggesting low to moderate levels of inbreeding. The result was supported by a comparison of the degree of relatedness between trees within populations, which was close to zero, suggesting most trees sampled were unrelated (Figure 2). There was no significant difference between treated and untreated trees for inbreeding (t1,11 = 0.31, p = 0.76). Pairwise genetic distances (Fst) showed low (0.01) to moderate (0.09) genetic differentiation between populations, with no obvious differences for treated and untreated sites. This was supported by the Structure analysis which showed a gradual drop in maximum likelihood from its peak at K = 1, which suggests little to no structure. This was supported by visualization with all populations being comprised of both genetic groups for K = 2.

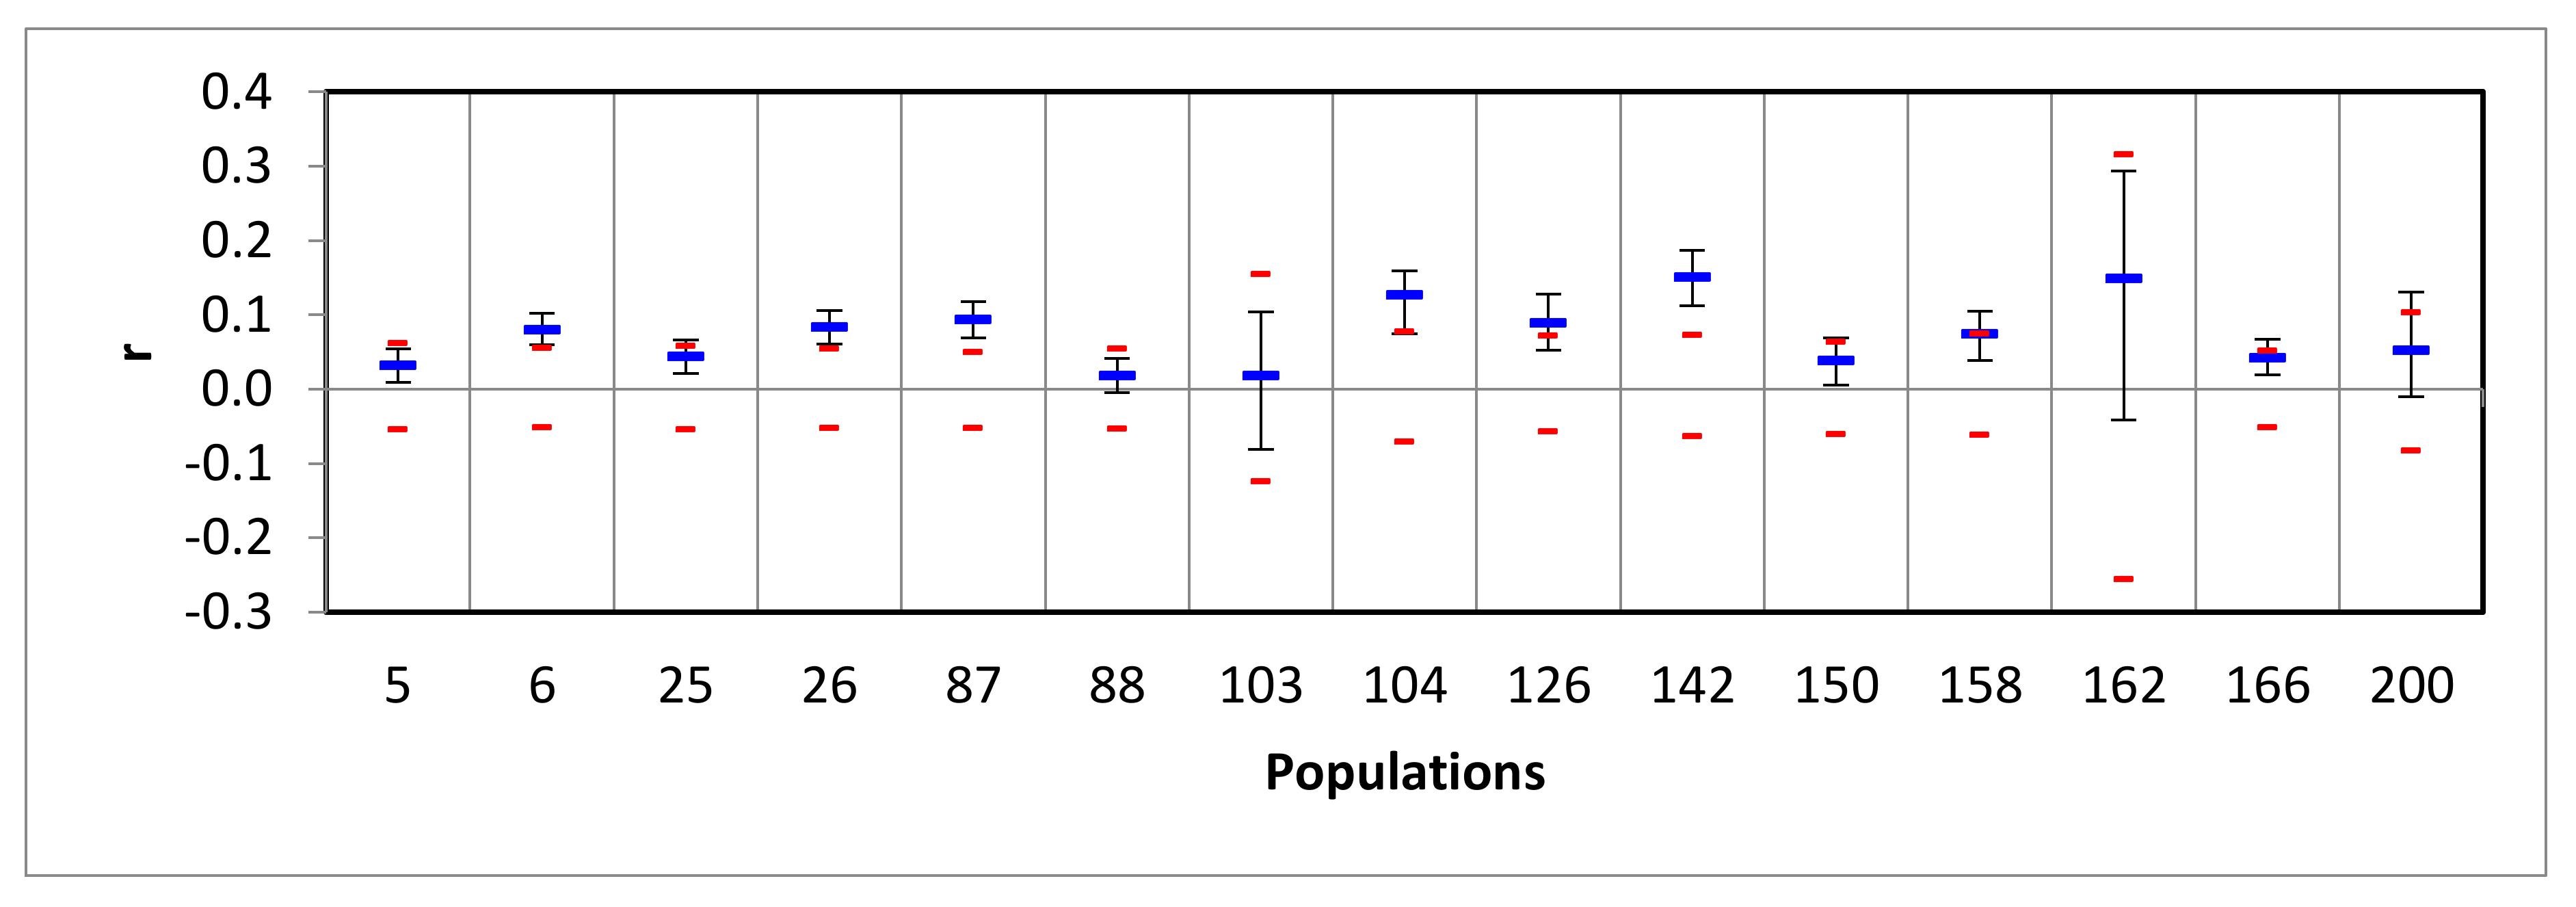
3.2. Assessing the Success of In Situ Efforts

Overall, there were 131 alleles (28 very common, 38 commons, 45 low frequency, 58 rare, 8 locally common and 68 locally rare). Assuming the genotyped trees are representative of the ash meta-population across the ANF (see Discussion), the 536 trees that were treated in the larger scale treatment regimen capture a substantial proportion of the neutral genetic variation present. Specifically, the proportion of all alleles captured at least once in the genotyped dataset is 97.7%. The proportion of all other categories is 100%, except with rare alleles (94.8%).
A forest manager is often faced with decision making about how to spend funds. We first aimed to examine the consequences of potential alternative choices. These simple choices are arbitrary of course, but illustrate major lessons about gene conservation. We modeled different treatment scenarios to determine the genetic diversity that would be preserved with less expensive alternatives. Protecting the same number of trees in fewer populations is one management option, i.e., treating 4 populations as opposed to 10 populations. Our results show that this decrease would result in a lower proportion of genetic diversity preserved for the same number of trees (Table 2). This decrease is most noticeable in the low frequency and locally common alleles (about 6% and 13% respectively). It is worth noting for this comparison that a maximum of 61 trees was used, which is on average the maximum number of trees that can be sampled from 4 randomly chosen populations in our dataset. This is illustrative of the difference that can be expected for other numbers of trees.
Another option is protecting the same number of populations but fewer trees. This would also substantially reduce the genetic variation protected. Reducing the number of currently protected trees approximately by half (in our dataset, from 274 to 140), albeit with trees still spread across 10 populations, would decrease the proportion of alleles saved from 97.7% to 81.1%.
We then examined all possible combinations of the number of trees per population and number of populations. In general, our results show that it is better to protect more populations (Figure 3). The slightly higher slope and the narrower distance between lines on the left panels suggest that typically, more genetic variation is gained by adding a new population than a new individual. It can also be observed that the lines for adding more trees look to be reaching a plateau sooner than is the case when more populations are added. A specific example of the choice of more trees or more populations is that the same proportion of locally common alleles can be protected by treating 77 trees across 10 populations or 102 trees across 7 populations.

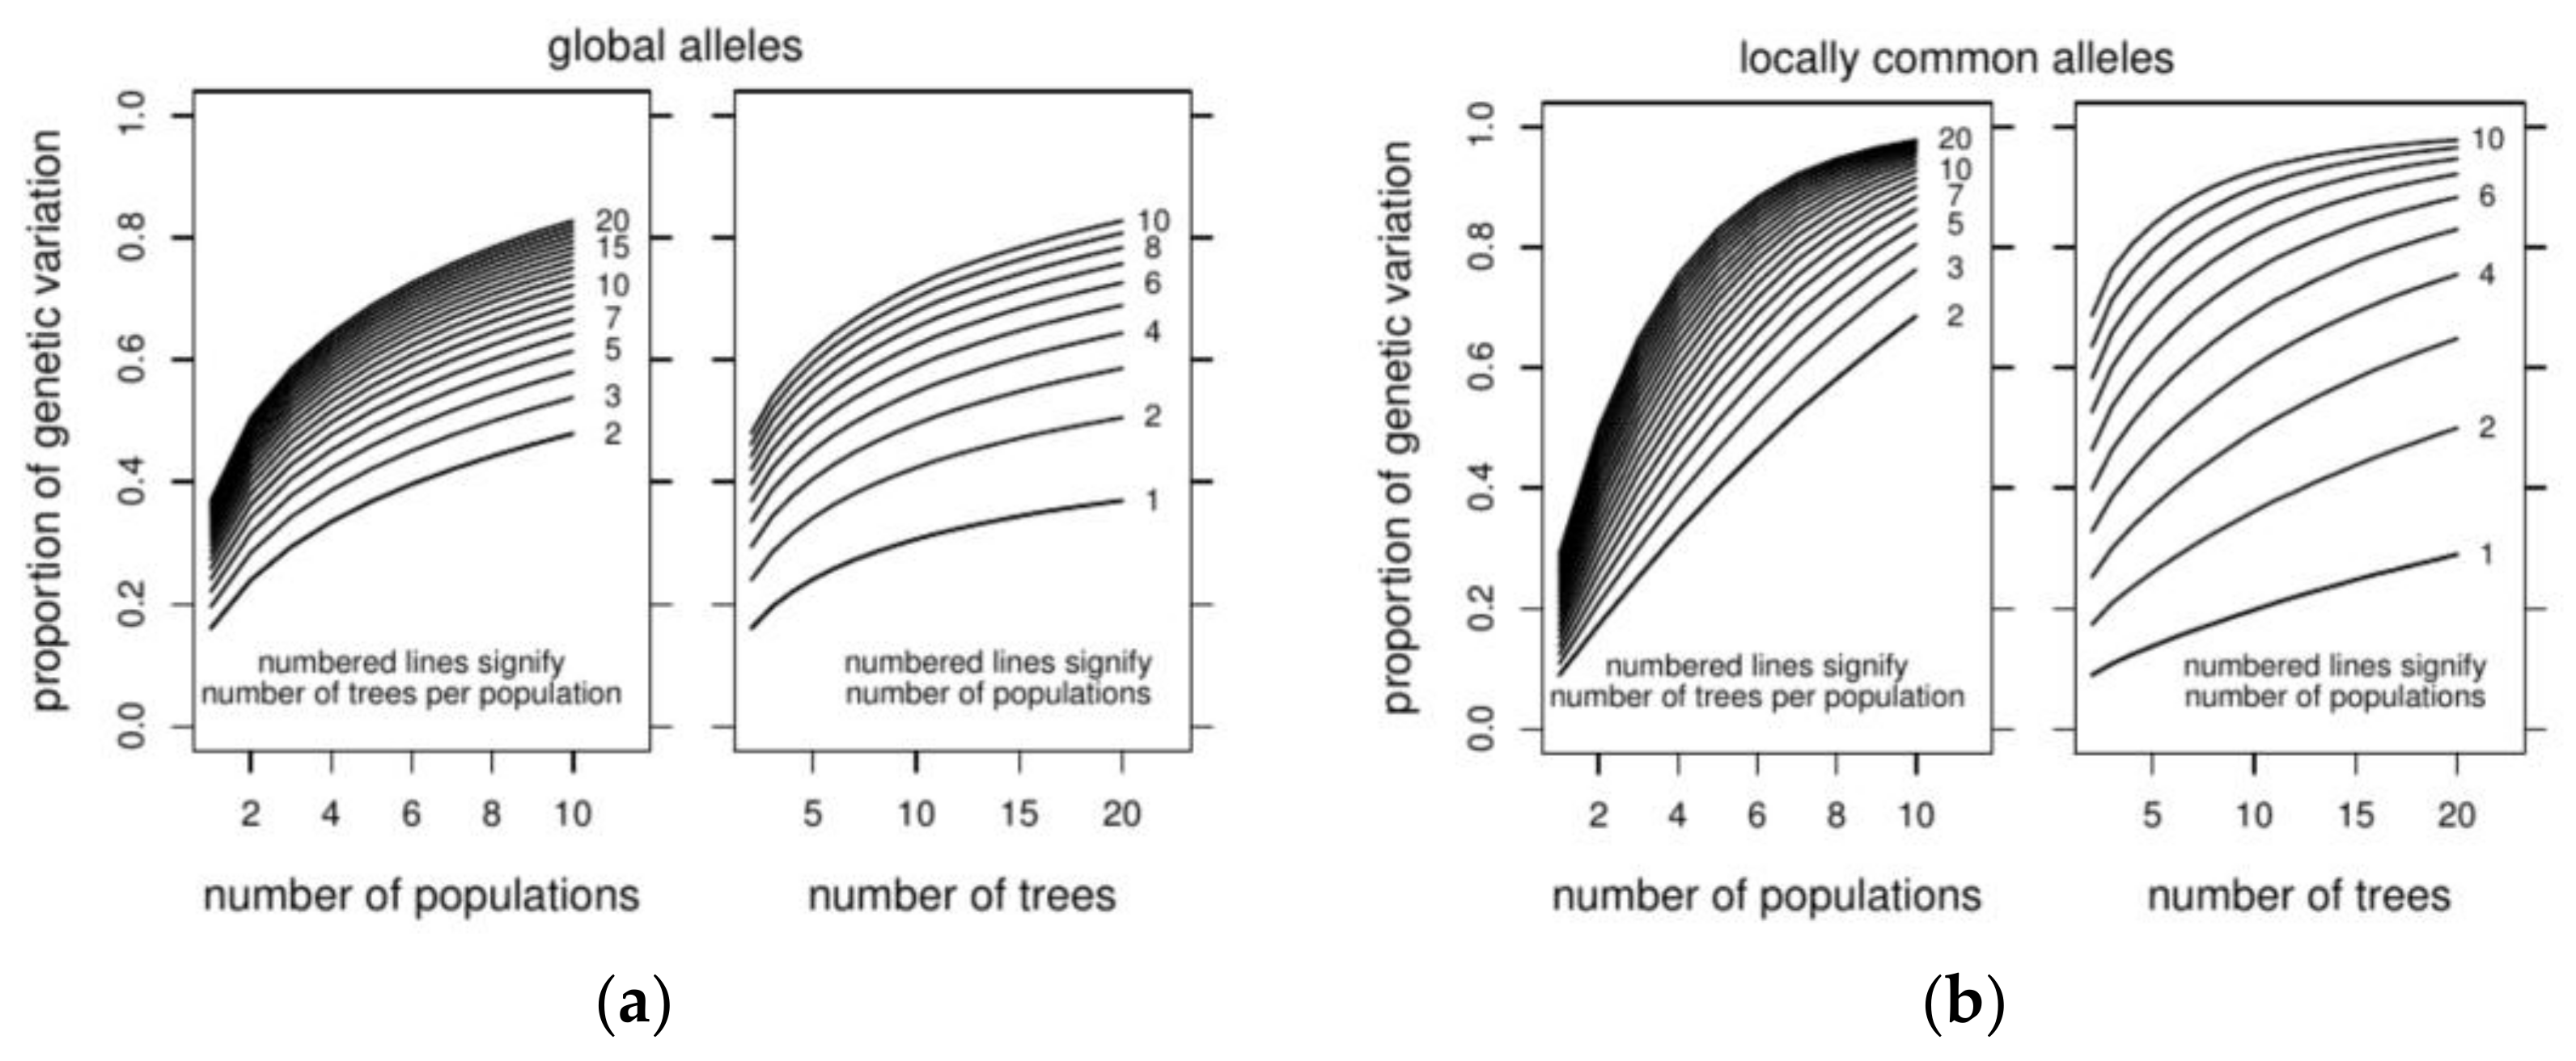
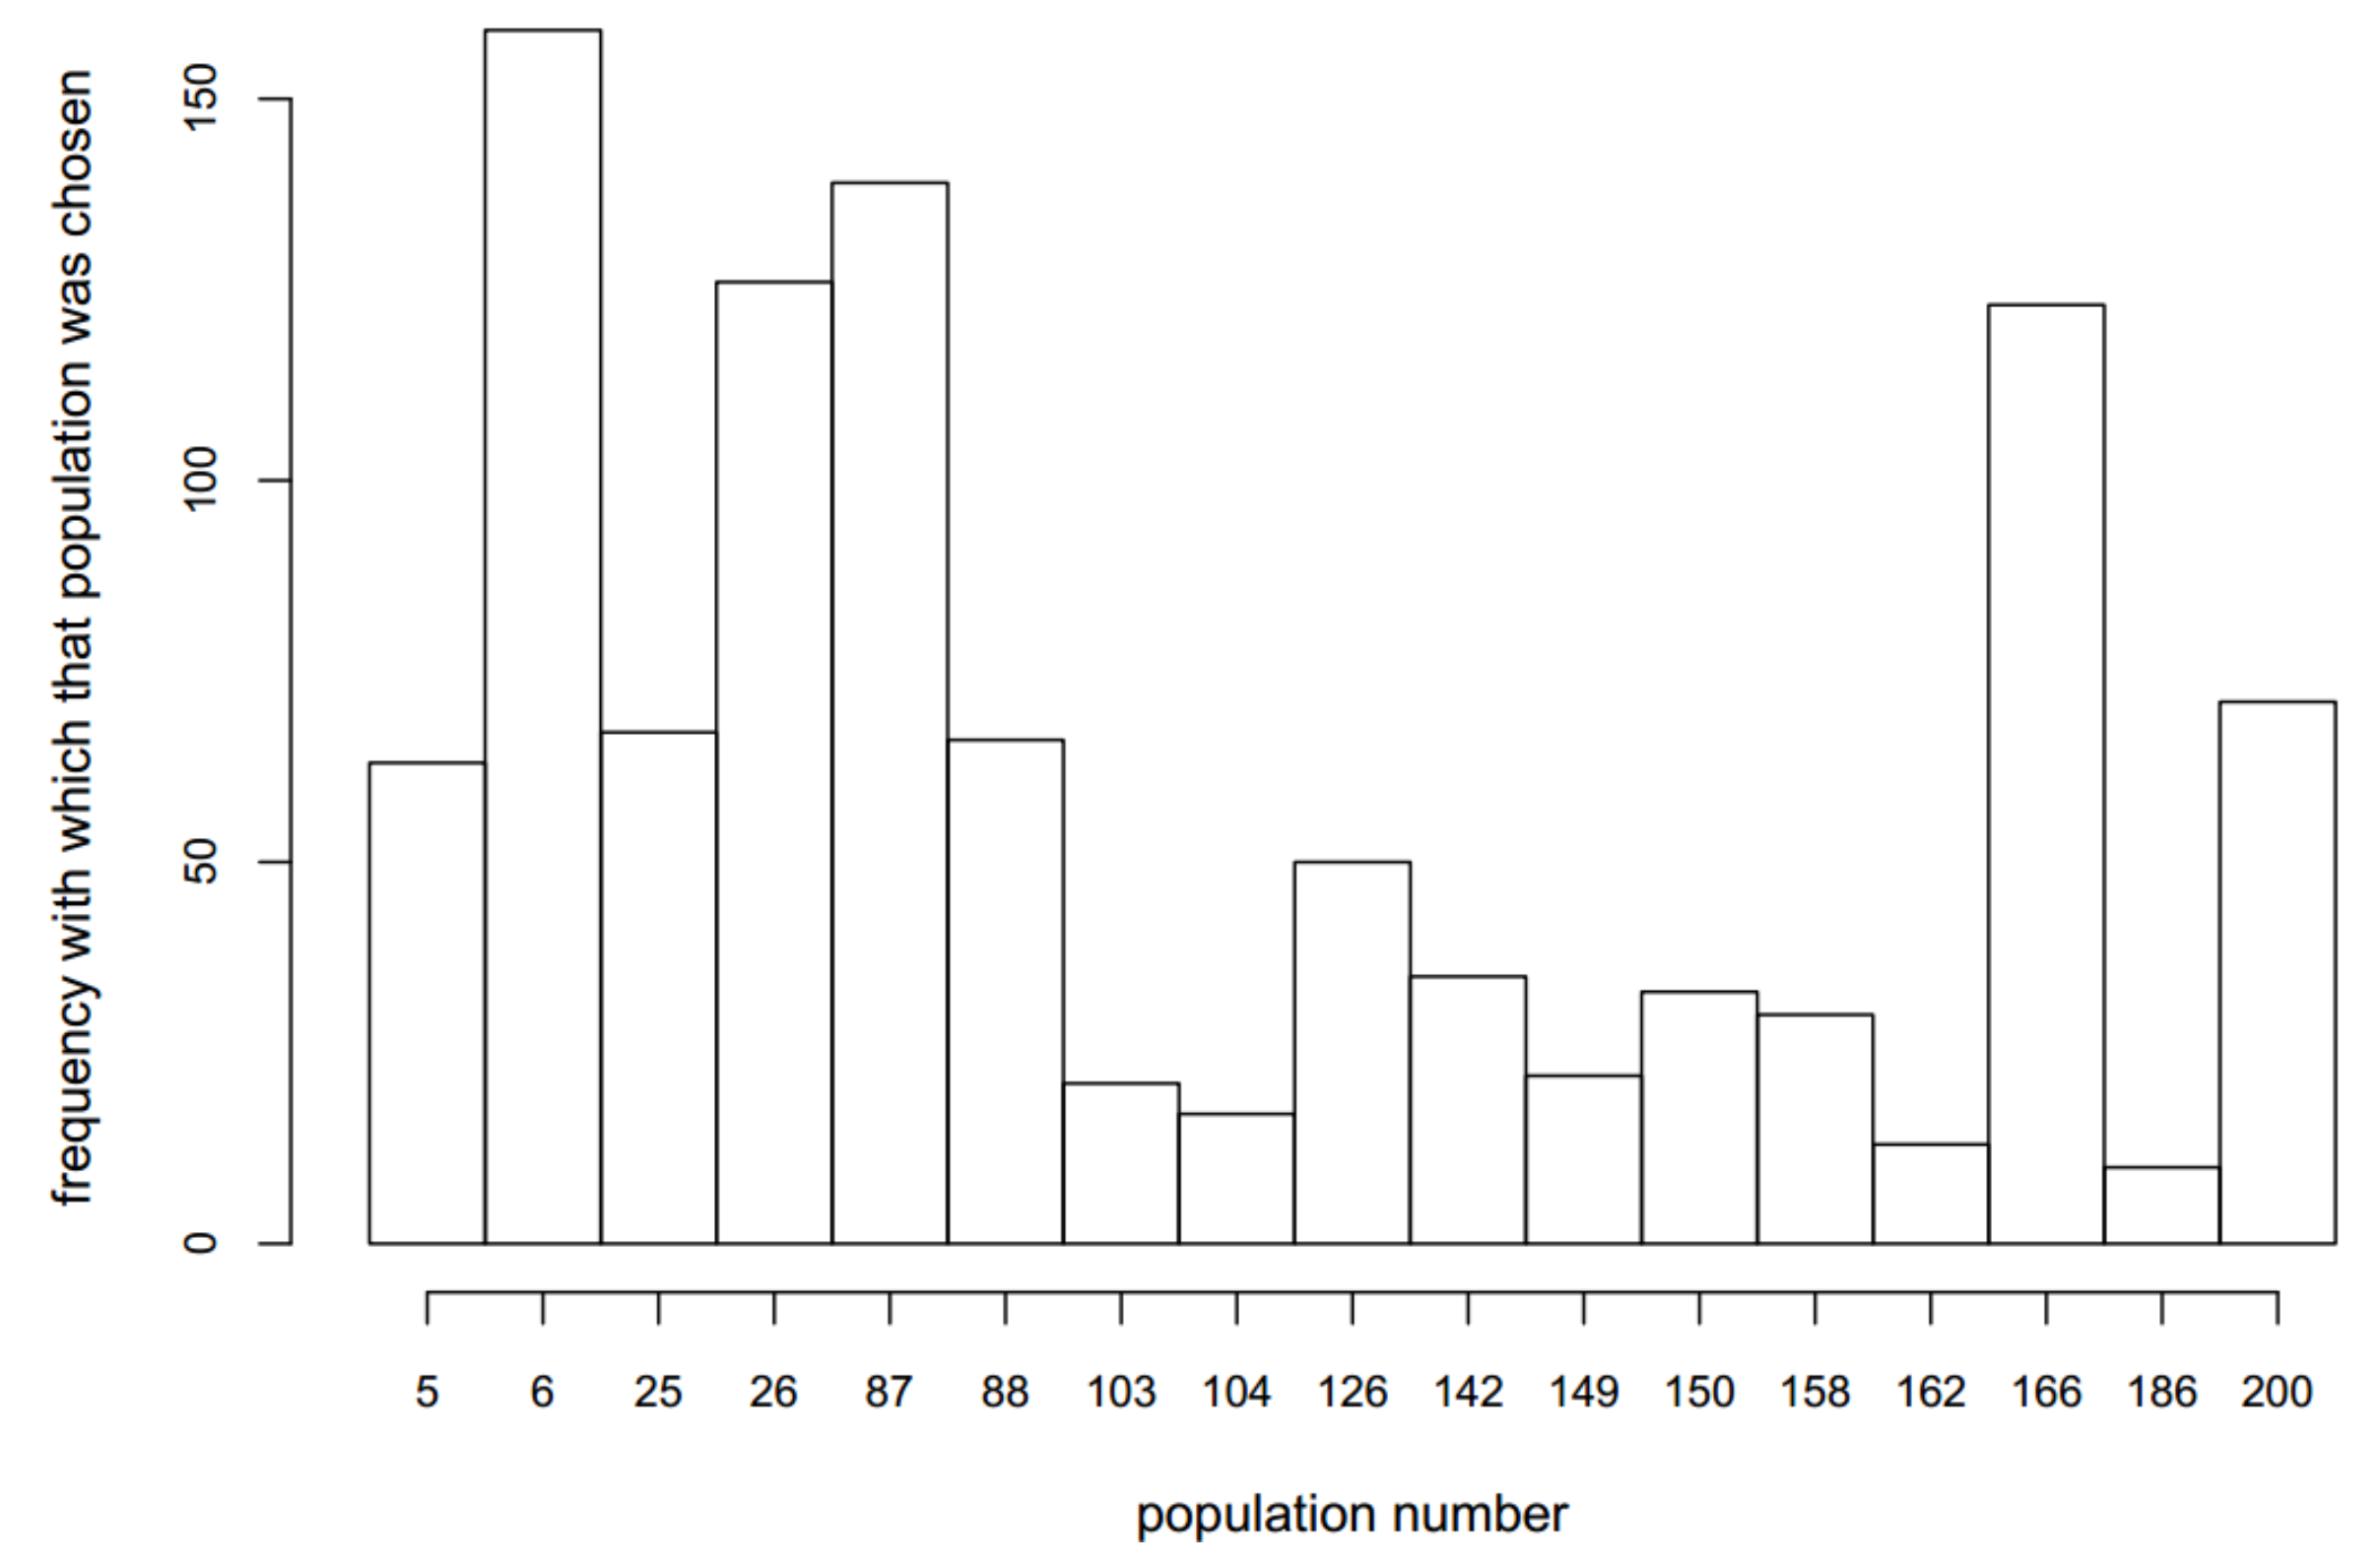
3.3. Optimizing Insecticide Treatment

An optimal set of populations to sample was recorded for each of the 190 treatment combinations. Our iterative approach consistently identified several populations across the span of minimum numbers of populations. For 10 treated populations, the optimal set is 5, 6, 25, 26, 87, 88, 142, 166, 200, and one of either 103 or 149 (Figure 4). Note that this is the ranking when choosing sets of populations to maximize preservation of all alleles. If the optimality “criteria” is to maximize a given category of the allele, the ranking of populations by their optimality does change; for example, to maximize locally common alleles the top populations are 5, 88, 149, and 166. Note that for pairs of plots that are close together, i.e., 25 and 26 (one is upland, and one is lowland), typically only one of these pairs shows up as optimal, suggesting that maintaining a minimum distance between treated populations would be prudent for maximizing diversity.
The optimal populations are often, but not exclusively, those with a larger number of genotyped trees in our study. For example, populations 6, 26, 87, and 166 were frequently chosen and all have 30 trees genotyped; population 200, however, is frequently chosen and only 22 trees were sampled. In addition, we find that when treatment strategies are limited to three or fewer trees per population, nearly the same populations are chosen as optimal, suggesting they are not optimal merely because of the larger sample size. To further investigate whether the number of trees genotyped influenced the inclusion of a population as optimal, we plotted the genetic diversity captured compared to the number of trees treated (Figure 5), which shows an improvement on allele preservation using the optimal set.
On average, treating an optimal set of populations increased the proportion of all alleles preserved by 7.7% and a maximum of 16.1%, with similar gains observed for the low frequency, rare, and “locally common” alleles. Again, this result is based on using all alleles as the ranking criteria, although examining plots for other allele categories reveals similar substantial improvement. On average, the optimal populations captured more variation than randomly chosen ones, even for the same number of trees (Figure 5), suggesting some populations do indeed have an optimal genetic diversity content. Optimal populations tend to have higher allelic diversity and heterozygosity, although not consistently (populations 150 and 158). The fact that all populations are chosen at least a few times (Figure 4), suggests that there can be multiple combinations of populations that can conserve the same level of diversity. As such, there is not just one optimal set for managers to use.
These results show that if a conservation practitioner chose populations to treat at random, they would have to treat more trees in order to preserve the same amount of genetic diversity as an optimal set. For example, two strategies—treating a total of 153 from 10 random populations and treating a total of 121 trees from 10 optimal populations—both capture about 83% of all alleles. This equates to about 21% fewer trees requiring treatment, under the optimal plan, to preserve the same genetic variation. If this percentage is transferred to the cost of treating 536 trees as opposed to 675 trees (21% fewer), these savings would be 139 fewer trees and thus nearly $13,900 USD per year that the treatment is applied (assuming $100 USD/tree treatment costs). Costs of genotyping may be between $5 USD and $10 USD per tree, which would total $6750 ($10/tree × 675 trees). Thus, in year one, the savings of treating an optimal set more than offsets the genotyping costs. From then on, the savings will only accumulate with every treatment cycle. The exact cost savings will depend on the number and distribution of trees of course, and the criteria for optimality, but it is likely that the cost of sampling and genetic analysis of trees before embarking on an insecticide treatment plan could lead to greater savings in treatment costs by allowing managers to optimize treatment strategies.

4. Discussion

In this study, we have found that the optimal tree sampling strategy identified here, i.e., treating more populations, rather than more trees per population, maximizes conservation of genetic diversity of ash while reducing management costs by >20%. The F. americana populations of the Allegheny National Forest showed minimal genetic structure (in terms of low Fst), suggesting that genetic diversity within white ash is evenly distributed across the region. Efficiencies may be even higher in forests with more structured populations. The cost savings associated with reduced treatment expenses can easily offset the costs of genetic analyses. The low genetic structure and high genetic diversity observed herein compliments findings in other ash species (i.e., F. excelsior [56,57]), and is consistent with other common, wind-pollinated tree species (oaks [58,59] such as pine [60,61] and beech [62]). This likely reflects adequate gene flow between populations, common in species with wind-dispersed pollen and seeds. Hence, we suggest that our findings on landscape population patterns and management may be transferable to conservation efforts of other wind dispersed tree species. However, in complex landscapes with high levels of environmental variability, a high degree of adaptation to local environments may occur.
A number of studies have examined how many trees and populations to sample for ex situ conservation, both empirically [34,36,37,38], and theoretically [33,63,64,65]. These studies have shown that appropriate sampling strategies depend on the species and the situation. They have also provided several consistent messages: (1) a relatively small number of well-chosen samples can preserve most of the genetic diversity; (2) many samples are needed to preserve all of the genetic diversity; and (3) diminishing returns are observed as more samples are added. More importantly, protecting multiple populations is almost always necessary to capture most of the genetic diversity. These results are consistent with these commonalities from previous studies. We found that even for a species with moderately low genetic differentiation across populations, protecting more populations is more valuable for maintaining a maximum level of genetic diversity. Our study helps address the paucity of specific information aimed at designing an optimal in situ or ex situ strategy for conserving the genetic variation in plants (though see [66,67]), and provides the first gene conservation strategy for designing in situ pest management approaches.
We show that for F. americana in the Allegheny region, the current strategy of treating 536 trees from 27 plots (of which 10 plots were in our analyzed data) will likely protect the majority of the known genetic variation, based on our samples. The alleles that are not protected are typically rare (frequency less than 0.01), or are restricted to, but common in, one population (locally common). We demonstrate that protection of a larger number of populations with insecticide treatment is more useful and cost effective than a treatment applied to more trees per population. Protecting numerous populations has the additional benefit of ensuring against disturbances caused by fire, windstorms, or other local environmental change. However, the number of trees protected per population should still be substantial (20 or more if possible) so that future seed production will remain highly heterozygous. To test whether it is possible to reduce costs without sacrificing genetic diversity, we examined alternative strategies for treating fewer trees (thus reducing the amount of insecticide needed), or fewer populations (reducing travel time and transportation costs for treatment). Our results show that protecting the same number of trees but in fewer populations would result in a small loss (2%) of diversity, but a larger loss (13%) in locally common diversity. An attempt to reduce cost expenditures further might consider reducing the number of individuals treated by half; this would result in a larger loss (16%) of diversity (primarily rare alleles). Lastly, we demonstrate that an optimal set of populations can be identified that could result in greater genetic preservation and cost reductions. This is likely due to the principle of complementarity; an optimal set of populations has minimal overlap in alleles, and thus each population complements the others [34]. Considering that it was possible to identify optimal strategies for F. americana, a common and wind-pollinated species with low genetic structure, this method should provide even greater benefit for species with higher genetic structure.
While we consider our results to be robust in these main findings, we need to be cautious as we used a small number of neutral microsatellite markers and a small sample size of untreated trees. While neutral markers are good at detecting effective population sizes and migration rates, their connection to fitness and “adaptive potential” is more tenuous. A number of studies have demonstrated that with low differentiation there can still be extensive between-population differences in adaptive traits [60,61,68]. Thus, there may be adaptive genetic differences that were not captured in our study, nor might they be captured in a treatment program guided by neutral markers; indeed, capturing them is a difficult task, regardless of methods used [69]. Despite this limitation, neutral markers are the most cost-effective tools available, and alleles are the only “currency” we have for measuring the gain in genetic diversity from a conservation action. In addition, sparse densities of ash as well as EAB induced mortality in the region limited the number of untreated trees available for the study. The exact estimates of the ‘proportion of genetic variation’ preserved for a given number of trees would decrease as more of the untreated trees were genotyped, and future studies may benefit from collecting additional samples before EAB expands to those areas (Figure 6). An accumulation curve of resampling our datasets, adding individuals one by one, supports this supposition; there are likely many more rare alleles in existence, but the other categories have likely reached an asymptote (Figure 6). It is important to note that the broad conclusions about sampling more trees or more populations derived from our approach is unlikely to be changed by using other marker approaches or increasing sampling size.
Natural demographic loss is an important consideration when determining an optimal number of populations and trees for treatment. With ex situ seed collections, the minimum number of seeds needed to preserve genetic variation is increased to account for germination and recruitment failures [70]. For our in situ treatment, the main dangers include the loss of populations due to abiotic disturbances (e.g., fire or windstorms), or the lack of treatment efficacy [30]. A recent estimate of disturbance levels gleaned from Forest Inventory and Analysis Data suggests that in the eastern US, approximately 3% of all trees are lost across a 5-year period [71]. Although these disturbance levels are relatively low, we suggest factoring disturbance into treatment plans, in order to help ensure that the 27 treated populations persist long term (i.e., 100 years). This may be achieved through a moderate increase in the number of populations treated (5 to 10 additional populations), and an increase in individuals per population (to perhaps 25), as well as the wide spatial distribution of populations. A more detailed regional analysis of mortality frequency from past catastrophic events may be useful to determine the likelihood that sufficient treated populations and trees will survive over the long term. Insecticide treatment efficacy should also be considered when deciding how many individuals to treat within a population. Because treatment efficacy decreases in less healthy trees [30], more trees must be treated in strains that are already in decline, to ensure the survival of the target number of trees for genetic conservation. In sum, our analysis represents a minimum number of white ash trees and populations to treat based on standing genetic diversity; as some trees will be lost to disturbance or insecticide failure, this minimum number could be increased to ensure that a minimum persists into the future.
A more complete genotyping of the populations containing fewer samples would help fully verify these results. Sequencing a large number of genes with a known function would provide an important complement to this work, by providing information on functional genetic variation [72]. Additionally, layering in a biological control strategy may help mitigate EAB pressures while contributing to the maintenance of ecosystem stability [73]. As such, efforts should be made to incorporate insecticide treatments into broader in situ or combined in situ and ex situ conservation program(s) [74]. Lastly, including information on the soil, vegetation, slope and other environmental variables may be useful to ensure the preservation of ecologically relevant adaptations, by demonstrating that treated trees are found through the full environmental range of the species.

5. Conclusions

In this study, we used genetic data from microsatellite markers to determine the effectiveness of current insecticide treatments for protecting the neutral genetic variation of white ash in situ in the Allegheny National Forest. We determined that treating a smaller number of trees across more populations is more effective than more trees in fewer populations, especially for locally common alleles. Furthermore, our iterative approach for identifying optimal sets of populations can be used to increase the efficiency of treatment, resulting in cost savings that would essentially offset the cost of the genetic study within one to two years.

Supplementary Materials

The source code for R scripts is available online at https://www.mdpi.com/1999-4907/9/4/202/s1.

Acknowledgments

This research was supported by the U.S.D.A. Forest Service Northern Research Station. We appreciate field assistance from M. Pickar and lab assistance from C. Courtney. Additionally, we thank the three reviewers for their thoughtful comments/suggestions.

Author Contributions

C.E.F., M.A.G.-M. and J.B.F. conceived and designed the experiment; K.S.K., C.E.F. and A.A.R. conceived and deployed the larger experiment; C.E.F. managed field work; E.A., S.F., and A.H. collected foliar samples; J.B.F., L.S. and S.H. analyzed the data; C.E.F., S.H. and J.B.F. wrote the paper.

Conflicts of Interest

The authors declare no conflict of interest.

References

  1. McKinney, M.L. Measuring floristic homogenization by non-native plants in North America. Glob. Ecol. Biogeogr. 2004, 13, 47–53. [Google Scholar] [CrossRef]
  2. Corvalan, C.; Hales, S.; McMichael, A. Ecosystems and human well-being: Biodiversity synthesis. In Millenium Ecosystem Assessment; World Resources Institute: Washington, DC, USA, 2005. [Google Scholar]
  3. Lovett, G.M.; Canham, C.D.; Arthur, M.A.; Weathers, K.C.; Fitzhugh, R.D. Forest ecosystem responses to exotic pests and pathogens in eastern North America. Bioscience 2006, 56, 395–405. [Google Scholar] [CrossRef]
  4. Flower, C.E.; Gonzalez-Meler, M.A. Responses of temperate forest productivity to insect and pathogen disturbances. Annu. Rev. Plant Biol. 2015, 66, 547–569. [Google Scholar] [CrossRef] [PubMed]
  5. Liebhold, A.M.; Brockerhoff, E.G.; Kalisz, S.; Nuñez, M.A.; Wardle, D.A.; Wingfield, M.J. Biological invasions in forest ecosystems. Biol. Invasions 2017, 19, 3437–3458. [Google Scholar] [CrossRef]
  6. Schaberg, P.G.; DeHayes, D.H.; Hawley, G.J.; Nijensohn, S.E. Anthropogenic alterations of genetic diversity within tree populations: Implications for forest ecosystem resilience. For. Ecol. Manag. 2008, 256, 855–862. [Google Scholar] [CrossRef]
  7. Hughes, A.R.; Inouye, B.D.; Johnson, M.T.J.; Underwood, N.; Vellend, M. Ecological consequences of genetic diversity. Ecol. Lett. 2008, 11, 609–623. [Google Scholar] [CrossRef] [PubMed]
  8. Hughes, A.R.; Stachowicz, J.J. Genetic diversity enhances the resistance of a seagrass ecosystem to disturbance. Proc. Natl. Acad. Sci. USA 2004, 101, 8998–9002. [Google Scholar] [CrossRef] [PubMed]
  9. Clark, J.S. Individuals and the variation needed for high species diversity in forest trees. Science 2010, 327, 1129–1132. [Google Scholar] [CrossRef] [PubMed]
  10. Laikre, L.; Allendorf, F.W.; Aroner, L.C.; Baker, C.S.; Gregovich, D.P.; Hansen, M.M.; Jackson, J.A.; Kendall, K.C.; Mckelvey, K.; Neel, M.C.; et al. Neglect of genetic diversity in implementation of the convention on biological diversity. Conserv. Biol. 2009, 24, 86–88. [Google Scholar] [CrossRef] [PubMed]
  11. Schoen, D.J.; Brown, A.H. The Conservation of Wild Plant Species in Seed Banks: Attention to both taxonomic coverage and population biology will improve the role of seed banks as conservation tools. Bioscience 2001, 51, 960–966. [Google Scholar] [CrossRef]
  12. Fant, J.; Havens, K.; Kramer, A.; Walsh, S.; Callicrate, T.; Lacy, R.; Maunder, M.; Meyer, A.; Smith, P. What to do when we can’t bank on seeds: What botanic gardens can learn from the zoo community about conserving plants in living collections. Am. J. Bot. 2016, 103, 1541–1543. [Google Scholar] [CrossRef] [PubMed]
  13. Basey, A.C.; Fant, J.B.; Kramer, A.T. Producing native plant materials for restoration: 10 rules to collect and maintain genetic diversity. Nativ. Plants J. 2015, 16, 37–53. [Google Scholar] [CrossRef]
  14. Ricketts, M.P.; Flower, C.E.; Knight, K.S.; Gonzalez-Meler, M.A. Evidence of ash tree (Fraxinus spp.) association with soil bacterial community structure and function. Forests 2018, 9, 187. [Google Scholar] [CrossRef]
  15. Slesak, R.A.; Lenhart, C.F.; Brooks, K.N.; D’Amato, A.W.; Palik, B.J. Water table response to harvesting and simulated emerald ash borer mortality in black ash wetlands in Minnesota, USA. Can. J. For. Res. 2014, 44, 961–968. [Google Scholar] [CrossRef]
  16. Fady, B.; Aravanopoulos, F.A.; Alizoti, P.; Mátyás, C.; Von Wühlisch, G.; Westergren, M.; Belletti, P.; Cvjetkovic, B.; Ducci, F.; Huber, G.; et al. Evolution-based approach needed for the conservation and silviculture of peripheral forest tree populations. For. Ecol. Manag. 2016, 375, 66–75. [Google Scholar] [CrossRef]
  17. Herms, D.A.; McCullough, D.G. Emerald ash borer invasion of North America: History, biology, ecology, impacts, and management. Annu. Rev. Entomol. 2014, 59, 13–30. [Google Scholar] [CrossRef] [PubMed]
  18. MacFarlane, D.W.; Meyer, S.P. Characteristics and distribution of potential ash tree hosts for emerald ash borer. For. Ecol. Manag. 2005, 213, 15–24. [Google Scholar] [CrossRef]
  19. Flower, C.E.; Knight, K.S.; Gonzalez-Meler, M.A. Impacts of the emerald ash borer (Agrilus planipennis Fairmaire) induced ash (Fraxinus spp.) mortality on forest carbon cycling and successional dynamics in the eastern United States. Biol. Invasions 2013, 15, 931–944. [Google Scholar] [CrossRef]
  20. Flower, C.E.; Knight, K.S.; Rebbeck, J.; Gonzalez-Meler, M.A. The relationship between the emerald ash borer (Agrilus planipennis) and ash (Fraxinus spp.) tree decline: Using visual canopy condition assessments and leaf isotope measurements to assess pest damage. For. Ecol. Manag. 2013, 303, 143–147. [Google Scholar] [CrossRef]
  21. Flower, C.E.; Lynch, D.J.; Knight, K.S.; Gonzalez-Meler, M.A. Biotic and abiotic drivers of sap flux in mature green ash trees (Fraxinus pennsylvanica) experiencing varying levels of emerald ash borer (Agrilus planipennis) infestation. Forests 2018, in press. [Google Scholar]
  22. Knight, K.S.; Brown, J.P.; Long, R.P. Factors affecting the survival of ash trees (Fraxinus spp.) infested by emerald ash borer (Agrilus planipennis). Biol. Invasions 2013, 15, 371–383. [Google Scholar] [CrossRef]
  23. Klooster, W.S.; Herms, D.A.; Knight, K.S.; Herms, C.P.; McCullough, D.G.; Smith, A.; Gandhi, K.J.K.; Cardina, J. Ash (Fraxinus spp.) mortality, regeneration, and seed bank dynamics in mixed hardwood forests following invasion by emerald ash borer (Agrilus planipennis). Biol. Invasions 2013, 16, 859–873. [Google Scholar] [CrossRef]
  24. McCullough, D.G.; Tanis, S.R.; Robinett, M.; Limback, C.; Poland, T.M. White ash—Is EAB always a death sentence? In Proceedings of the 2014 Emerald Ash Borer National Research and Technology Development Meeting, Wooster, OH, USA, 15–16 October 2014; Buck, J., Parra, G., Lance, D., Reardon, R., Binion, D., Eds.; U.S. Department of Agriculture, Forest Service: Washington, DC, USA, 2015; pp. 10–11. [Google Scholar]
  25. The IUCN Red List of Threatened Species. Available online: http://www.iucnredlist.org/ (accessed on 11 April 2018).
  26. Cappaert, D.; Mccullough, D.G.; Poland, T.M.; Siegert, N.W. Emerald ash borer in North America: A research and regulatory challenge. Am. Entomol. 2005, 51, 152–165. [Google Scholar] [CrossRef]
  27. O’Brien, E.M. Conserving Ash (Fraxinus) Populations and Genetic Variation in Forests Invaded by Emerald Ash Borer Using Large-Scale Insecticide Applications; Ohio State University: Columbus, OH, USA, 2017. [Google Scholar]
  28. Flower, C.E.; Aubihl, E.; Fant, J.; Forry, S.; Hille, A.; Knight, K.S.; Oldland, W.K.; Royo, A.A.; Richard, M. In-situ Genetic Conservation of White Ash (Fraxinus americana) at the Allegheny National Forest. In Proceedings of the Workshop on Gene Conservation of Tree Species-Banking on the Future, Chicago, IL, USA, 16–19 May 2016; Sniezko, R.A., Man, G., Hipkins, V., Woeste, K., Gwaze, D., Kliejunas, J.T., McTeague, B.A., Eds.; U.S. Department of Agriculture, Forest Service: Washington, DC, USA; Pacific Northwest Research Station: Portland, OR, USA, 2016; pp. 165–169. [Google Scholar]
  29. Herms, D.A.; Mccullough, D.G.; Smitley, D.R.; Sadof, C.S.; Cranshaw, W. Insecticide Options for Protecting Ash Trees from Emerald Ash Borer, 2nd ed.; North Central IPM Center Bulletin: Champaign, IL, USA, 2014; 16p. [Google Scholar]
  30. Flower, C.E.; Dalton, J.E.; Knight, K.S.; Brikha, M.; Gonzalez-Meler, M.A. To treat or not to treat: Diminishing effectiveness of emamectin benzoate tree injections in ash trees heavily infested by emerald ash borer. Urban For. Urban Green. 2015, 14. [Google Scholar] [CrossRef]
  31. Gregorious, H.-R. The probability of losing an allele when diploid genotypes are sampled. Bioinformatics 1980, 36, 643–652. [Google Scholar] [CrossRef]
  32. Bashalkhanov, S.; Pandley, M.; Rahjora, O.P. A simple method for estimating genetic diversity in large populations from finite sample sizes. BMC Genet. 2009, 10, 84. [Google Scholar] [CrossRef] [PubMed]
  33. Brown, A.; Marshall, D. A basic sampling strategy: Theory and practice. In Collecting Plant Genetic Diversity: Technical Guidelines; Guarino, L., Rao, V.R., Reid, R., Eds.; CAB International: Wallingford, UK, 1995; pp. 75–91. [Google Scholar]
  34. Richards, C.M.; Antolin, M.F.; Reilley, A.; Poole, J.; Walters, C. Capturing genetic diversity of wild populations for ex situ conservation: Texas wild rice (Zizania texana) as a model. Genet. Resour. Crop Evol. 2007, 54, 837–848. [Google Scholar] [CrossRef]
  35. Hoban, S.; Strand, A. Ex situ seed collections will benefit from considering spatial sampling design and species’ reproductive biology. Biol. Conserv. 2015, 187, 182–191. [Google Scholar] [CrossRef]
  36. Griffith, M.P.; Calonje, M.; Meerow, A.W.; Francisco-Ortega, J.; Knowles, L.; Aguilar, R.; Tut, F.; Sánchez, V.; Meyer, A.; Noblick, L.R.; et al. Will the same ex situ protocols give similar results for closely related species? Biodivers. Conserv. 2017, 26, 2951–2966. [Google Scholar] [CrossRef]
  37. McGlaughlin, M.E.; Riley, L.; Brandsrud, M.; Arcibal, E.; Helenurm, M.K.; Helenurm, K. How much is enough? Minimum sampling intensity required to capture extant genetic diversity in ex situ seed collections: Examples from the endangered plant Sibara filifolia (Brassicaceae). Conserv. Genet. 2015, 16, 253–266. [Google Scholar] [CrossRef]
  38. Kashimshetty, Y.; Pelikan, S.; Rogstad, S.H. Effective seed harvesting strategies for the ex situ genetic diversity conservation of rare tropical tree populations. Biodivers. Conserv. 2017, 26, 1311–1331. [Google Scholar] [CrossRef]
  39. Schoen, D.J.; Brown, A.H.D. Intraspecific variation in population gene diversity and effective population size correlates with the mating system in plants. Proc. Natl. Acad. Sci. USA 1991, 88, 4494–4497. [Google Scholar] [CrossRef] [PubMed]
  40. Doyle, J.J.; Doyle, J.L. A rapid DNA isolation procedure for small quantities of fresh leaf tissue. Phytochem. Bull. 1987, 19, 11–15. [Google Scholar]
  41. Lefort, F.; Brachet, S.; Frascaria-Lacoste, N.; Edwards, K.J.; Douglas, G. Identification and characterization of microsatellite loci in ash (Fraxinus excelsior L.) and their conservation in the olive family (Oleaceae). Mol. Ecol. 1999, 8, 1088–1089. [Google Scholar] [CrossRef]
  42. Harbourne, M.E.; Douglas, C.G.; Waldren, S.; Hodkinson, T.R. Characterization and primer development for amplification of chloroplast microsatellite regions of Fraxinus excelsior. J. Plant Res. 2005, 118, 339–341. [Google Scholar] [CrossRef] [PubMed]
  43. Sutherland, B.G.; Belaj, A.; Nier, S.; Cottrell, J.E.; P Vaughan, S.; Hubert, J.; Russell, K. Molecular biodiversity and population structure in common ash (Fraxinus excelsior L.) in Britain: Implications for conservation. Mol. Ecol. 2010, 19, 2196–2211. [Google Scholar] [CrossRef] [PubMed]
  44. Beatty, G.E.; Brown, J.A.; Cassidy, E.M.; Finlay, C.M.V.; McKendrick, L.; Montgomery, W.I.; Reid, N.; Tosh, D.G.; Provan, J. Lack of genetic structure and evidence for long-distance dispersal in ash (Fraxinus excelsior) populations under threat from an emergent fungal pathogen: Implications for restorative planting. Tree Genet. Genomes 2015, 11, 1–13. [Google Scholar] [CrossRef] [Green Version]
  45. Brachet, S.; Jubier, M.; Richard, M.; Jung-Muller, B.; Frascaria-Lacoste, N. Rapid identification of microsatellite loci using 5’ anchored PCR in the common ash Fraxinus excelsior. Microb. Ecol. 1999, 8, 160–163. [Google Scholar]
  46. Noakes, A.G.; Best, T.; Staton, M.E.; Koch, J.; Romero-Severson, J. Cross amplification of 15 EST-SSR markers in the genus Fraxinus. Conserv. Genet. Resour. 2014, 6, 969–970. [Google Scholar] [CrossRef]
  47. Schuelke, M. An economic method for the fluorescent labeling of PCR fragments. Nat. Biotechnol. 2000, 18, 233–234. [Google Scholar] [CrossRef] [PubMed]
  48. Peakall, R.; Smouse, P. GenAlEx 6: Genetic analysis in Excel. Population genetic software for teaching and research. Mol. Ecol. Notes 2006, 6, 288–295. [Google Scholar] [CrossRef]
  49. Weir, B.; Cockerham, C. Estimating F-statistics for the analysis of population structure. Evolution 1984, 38, 1358–1370. [Google Scholar] [PubMed]
  50. Queller, D.C.; Goodnight, K.F. Estimating relatedness using genetic markers. Evolution 1989, 43, 258. [Google Scholar] [CrossRef] [PubMed]
  51. Bates, D.; Maechler, M.; Bolker, B.; Walker, S. Fitting linear mixed-effects models using lme4. J. Stat. Softw. 2015, 67, 1–48. [Google Scholar] [CrossRef]
  52. Pritchard, J.; Stephens, M.; Donnelly, P. Inference of population structure using multilocus genotype data. Genetics 2000, 155, 945–959. [Google Scholar] [PubMed]
  53. Evanno, G.; Regnaut, S.; Goudet, J. Detecting the number of clusters of individuals using the software STRUCTURE: A simulation study. Mol. Ecol. 2005, 14, 2611–2620. [Google Scholar] [CrossRef] [PubMed]
  54. Earl, D.A.; von Holdt, B.M. STRUCTURE HARVESTER: A website and program for visualizing STRUCTURE output and implementing the Evanno method. Conserv. Genet. Resour. 2012, 4, 359–361. [Google Scholar] [CrossRef]
  55. Jombart, T. Adegenet: A R package for the multivariate analysis of genetic markers. Bioinformatics 2008, 24, 1403–1405. [Google Scholar] [CrossRef] [PubMed]
  56. Heuertz, M.; Hausman, J.F.; Tsvetkov, I.; Frascaria-Lacoste, N.; Vekemans, X. Assessment of genetic structure within and among Bulgarian populations of the common ash (Fraxinus excelsior L.). Mol. Ecol. 2001, 10, 1615–1623. [Google Scholar] [CrossRef] [PubMed]
  57. Heuertz, M.; Hausman, J.F.; Hardy, O.; Vendramin, G.G.; Frascaria-Lacoste, N.; Vekemans, X. Nuclear microsatellites reveal contrasting patterns of genetic structure between western and southeastern European populations of the common ash (Fraxinus excelsior L.). Evolution 2004, 58, 976–988. [Google Scholar] [PubMed]
  58. Craft, K.J.; Ashley, M.V. Landscape genetic structure of bur oak (Quercus macrocarpa) savannas in Illinois. For. Ecol. Manag. 2007, 239, 13–20. [Google Scholar] [CrossRef]
  59. Streiff, R.; Ducousso, A.; Lexer, C.; Steinkellner, H.; Gloessl, J.; Kremer, A. Pollen dispersal inferred from paternity analysis in a mixed oak stand of Quercus robur L. and Q. petraea (Matt.) Liebl. Mol. Ecol. 1999, 8, 831–841. [Google Scholar] [CrossRef]
  60. Nadeau, S.; Meirmans, P.G.; Aitken, S.N.; Ritland, K.; Isabel, N. The challenge of separating signatures of local adaptation from those of isolation by distance and colonization history: The case of two white pines. Ecol. Evol. 2016, 6, 8649–8664. [Google Scholar] [CrossRef] [PubMed]
  61. Bower, A.D.; Aitken, S.N. Ecological genetics and seed transfer guidelines for Pinus albicaulis (Pinaceae). Am. J. Bot. 2008, 95, 66–76. [Google Scholar] [CrossRef] [PubMed]
  62. Jump, A.S.; Penuelas, J. Genetic effects of chronic habitat fragmentation in a wind-pollinated tree. Proc. Natl. Acad. Sci. USA 2006, 103, 8096–8100. [Google Scholar] [CrossRef] [PubMed]
  63. Brown, A.H.D. Isozymes, plant population genetic structure and genetic conservation. Theor. Appl. Genet. 1978, 52, 145–157. [Google Scholar] [CrossRef] [PubMed]
  64. Hoban, S.; Schlarbaum, S. Optimal sampling of seeds from plant populations for ex-situ conservation of genetic biodiversity, considering realistic population structure. Biol. Conserv. 2014, 177, 90–99. [Google Scholar] [CrossRef]
  65. Guerrant, E.O.; Fiedler, P.L.; Havens, K.; Maunder, M. Revised genetic sampling guidelines for conservation collections of rare and endangered plants. In Ex Situ Plant Conservation: Supporting Species Survival in the Wild; Island Press: Washington, DC, USA, 2004; pp. 419–448. [Google Scholar]
  66. Vinceti, B.; Loo, J.; Gaisberger, H.; van Zonneveld, M.J.; Schueler, S.; Konrad, H.; Kadu, C.A.C.; Geburek, T. Conservation priorities for prunus Africana defined with the aid of spatial analysis of genetic data and climatic variables. PLoS ONE 2013, 8, e59987. [Google Scholar] [CrossRef] [PubMed] [Green Version]
  67. Schlottfeldt, S.; Walter, M.E.M.T.; de Carvalho, A.C.P.L.F.; Soares, T.N.; Telles, M.P.C.; Loyola, R.D.; Diniz-Filho, J.A.F. Multi-objective optimization for plant germplasm collection conservation of genetic resources based on molecular variability. Tree Genet. Genomes 2015, 11, 16. [Google Scholar] [CrossRef]
  68. Jump, A.S.; Hunt, J.M.; Martínez-Izquierdo, J.; Peñuelas, J. Natural selection and climate change: Temperature-Linked spatial and temporal trends in gene frequency in Fagus sylvatica. Mol. Ecol. 2006, 15, 3469–3480. [Google Scholar] [CrossRef] [PubMed]
  69. Hoban, S.; Kelley, J.L.; Lotterhos, K.E.; Antolin, M.F.; Bradburd, G.; Lowry, D.B.; Poss, M.L.; Reed, L.K.; Storfer, A.; Whitlock, M.C. Finding the genomic basis of local adaptation: pitfalls, practical solutions, and future directions. Am. Nat. 2016, 188, 379–397. [Google Scholar] [CrossRef] [PubMed]
  70. Way, M.J. Collecting seed from non-domesticated plants for long-term conservation. In Seed Conservation: Turning Science into Practice; Smith, R., Dickie, J., Linington, S., Pritchard, H., Probert, R., Eds.; Royal Botanic Gardens Kew: London, UK, 2003; pp. 165–201. [Google Scholar]
  71. Vanderwel, M.C.; Coomes, D.A.; Purves, D.W. Quantifying variation in forest disturbance, and its effects on aboveground biomass dynamics, across the eastern United States. Glob. Chang. Biol. 2013, 19, 1504–1517. [Google Scholar] [CrossRef] [PubMed]
  72. Flanagan, S.P.; Forester, B.R.; Latch, E.K.; Aitken, S.N.; Hoban, S. Guidelines for planning genomic assessment and monitoring of locally adaptive variation to inform species conservation. Evol. Appl. 2017, 1–18. [Google Scholar] [CrossRef]
  73. Margulies, E.; Bauer, L.; Ibáñez, I. Buying time: Preliminary assessment of biocontrol in the recovery of native forest vegetation in the aftermath of the invasive emerald ash borer. Forests 2017, 8, 369. [Google Scholar] [CrossRef]
  74. Schoettle, A.W.; Klutsch, J.G.; Sniezko, R.A. Integrating regeneration, genetic resistance, and timing of intervention for the long-term sustainability of ecosystems challenged by non-native Pests—A novel proactive approach. In Proceedings of the 4th International Workshop on the Genetics of Host-Parasite Interactions in Forestry: Disease and Insect Resistance in Forest Trees, Eugene, OR, USA, 31 July–5 August 2011; Sniezko, R.A., Yanchuk, A.D., Kliejunas, J.T., Palmieri, K.M., Alexander, J.M., Frankel, S.J., Eds.; Pacific Southwest Research Station: Redding, CA, USA; Forest Service, U.S. Department of Agriculture: Washington, DC, USA, 2012; pp. 112–123. [Google Scholar]
Figure 1. Map of the Allegheny National Forest with white ash foliar sampling locations denoted with stars (red stars denote low elevation and yellow sites upper elevation sites). Inset map denotes the position of the ANF in the greater region.
Forests 09 00202 g001
Figure 2. Mean relatedness (r) within the population, box plots (blue) represent average relatedness and standard error. Red bars represent 95% confidence intervals about zero, which is determined by sample size.
Forests 09 00202 g002
Figure 3. Accumulation of genetic variation as more populations or trees are added. The two plots in panel (a) represent “global alleles” (i.e., all alleles) and the two in panel (b) “locally common” alleles. In the graphs with number of populations on the X axis, the successive lines are additional numbers of trees per population; likewise, in the graphs with number of trees on the X axis, the lines are additional numbers of populations those trees are sampled from.
Forests 09 00202 g003
Figure 4. Frequency with which each population was observed in the 190 optimal sets of populations when optimality is defined as capturing all alleles.
Forests 09 00202 g004
Figure 5. Proportion of genetic variation preserved for a given number of individuals treated depending on whether optimal populations or random populations are selected.
Forests 09 00202 g005
Figure 6. Accumulation analysis which shows an asymptote of low frequency (a) and rare (b) alleles as more individuals trees are selected across all samples, demonstrating an asymptote is likely reached for locally common but not for all alleles (due to rare alleles).
Forests 09 00202 g006
Table 1. Averages for genetic parameters by population, including population name (PopID), whether trees were treated with insecticide (Y = yes, N = no), topographic position of the site (upland or lowland), number of trees sampled (n), average number of alleles (Na), average effective number of alleles (Ne) corrected for sample size, gene diversity (He), number of Private alleles (P) and Inbreeding coefficient (Fis).
PopIDInsecticide TreatedTopographynNaNeHePFis
104NLowland164.882.890.6000.00
150NLowland235.883.130.6400.13
162NLowland32.632.110.480−0.09
186NLowland21.631.580.230−0.64
200NLowland235.002.880.6120.04
103NUpland74.132.830.6000.16
149NUpland11.381.380.250−1.00
6YLowland308.253.400.6270.08
26YLowland297.503.140.6170.07
88YLowland307.503.320.6500.07
126YLowland246.132.890.6110.11
142YLowland225.382.760.5910.09
158YLowland235.752.990.6300.02
166YLowland307.503.450.6420.08
5YUpland297.133.260.6510.08
25YUpland306.633.100.6320.08
87YUpland307.253.580.6430.17
Table 2. Proportion of genetic diversity preserved in 61 trees, whether these trees are chosen from 4 (option 1) or 10 (option 2) populations, randomly.
Management OptionNo. of PopulationsAllVery CommonCommonLow FreqRareLocally Common
Option 1464.4%~100%99.4%84.8%31.4%75.5%
Option 21066.6%~100%99.9%91.1%31.4%88.4%
Difference 2.2%<0.1%0.5%6.3%<0.1%12.9%

