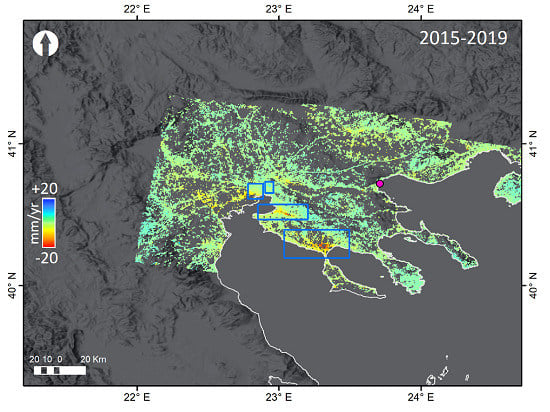
InSAR Campaign Reveals Ongoing Displacement Trends at High Impact Sites of Thessaloniki and Chalkidiki, Greece

 ,
,  ,
,  , , and
Abstract
:
1. Introduction
2. Methods and Data Used
3. Results
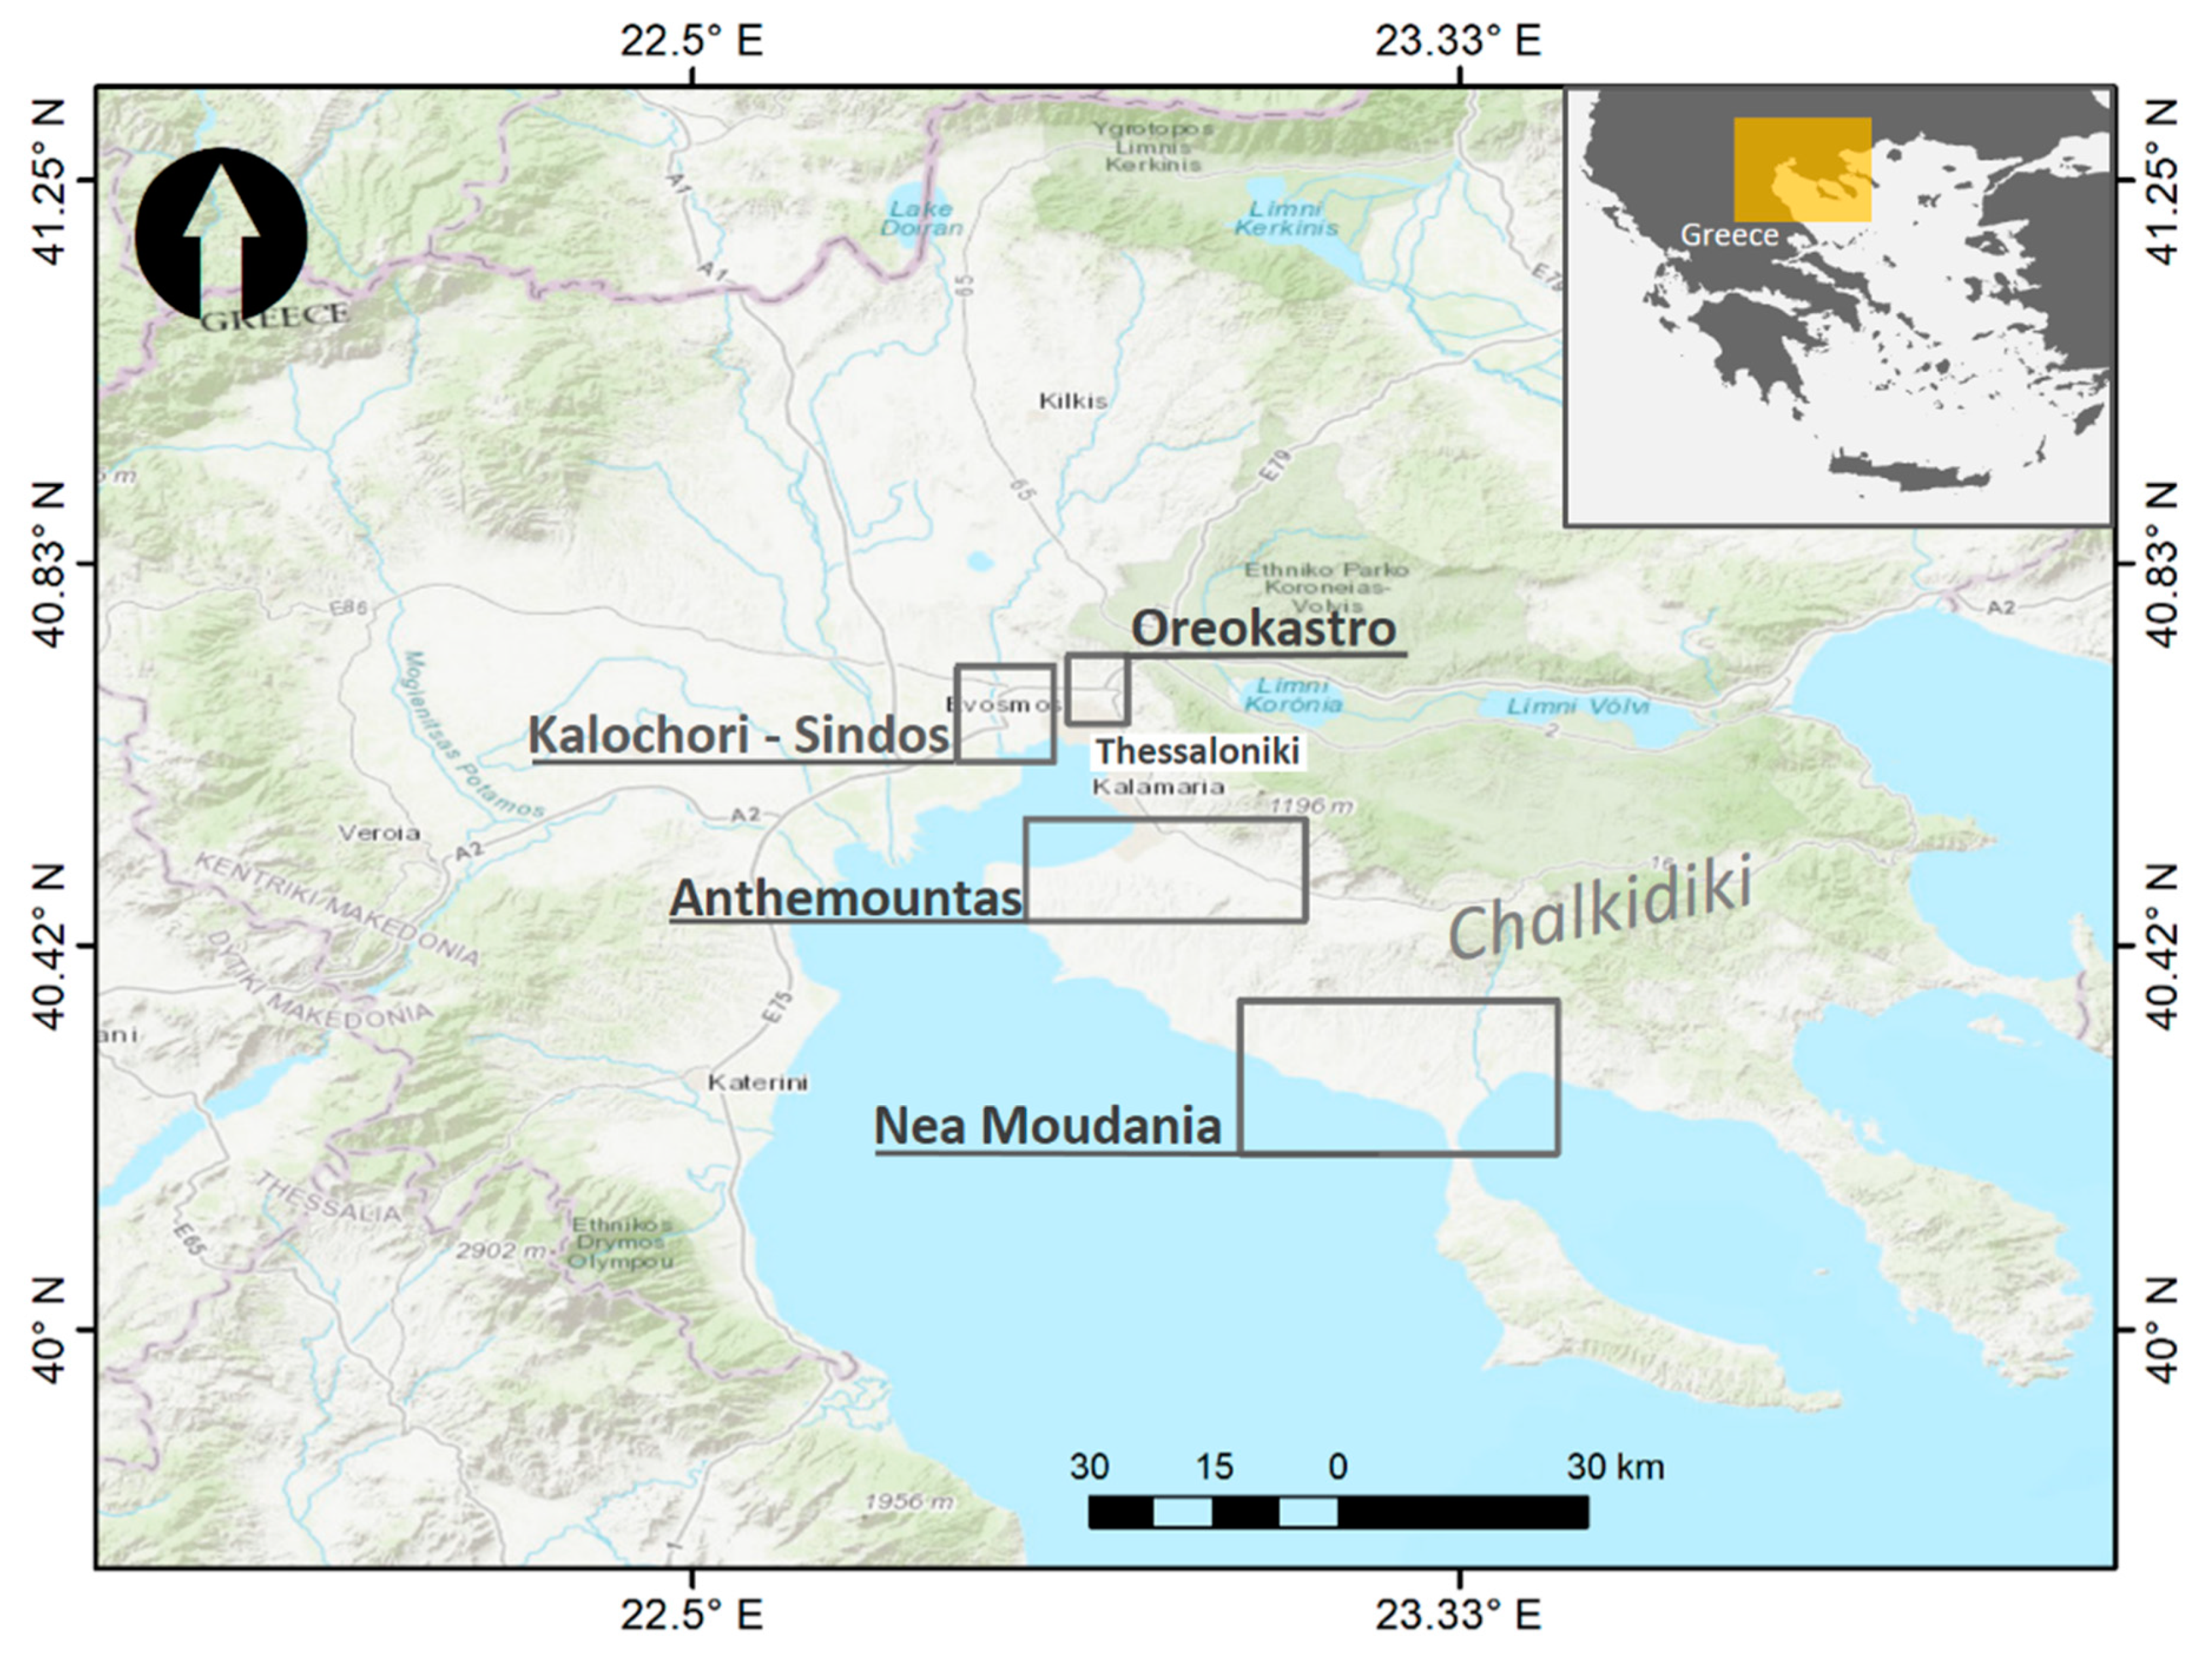
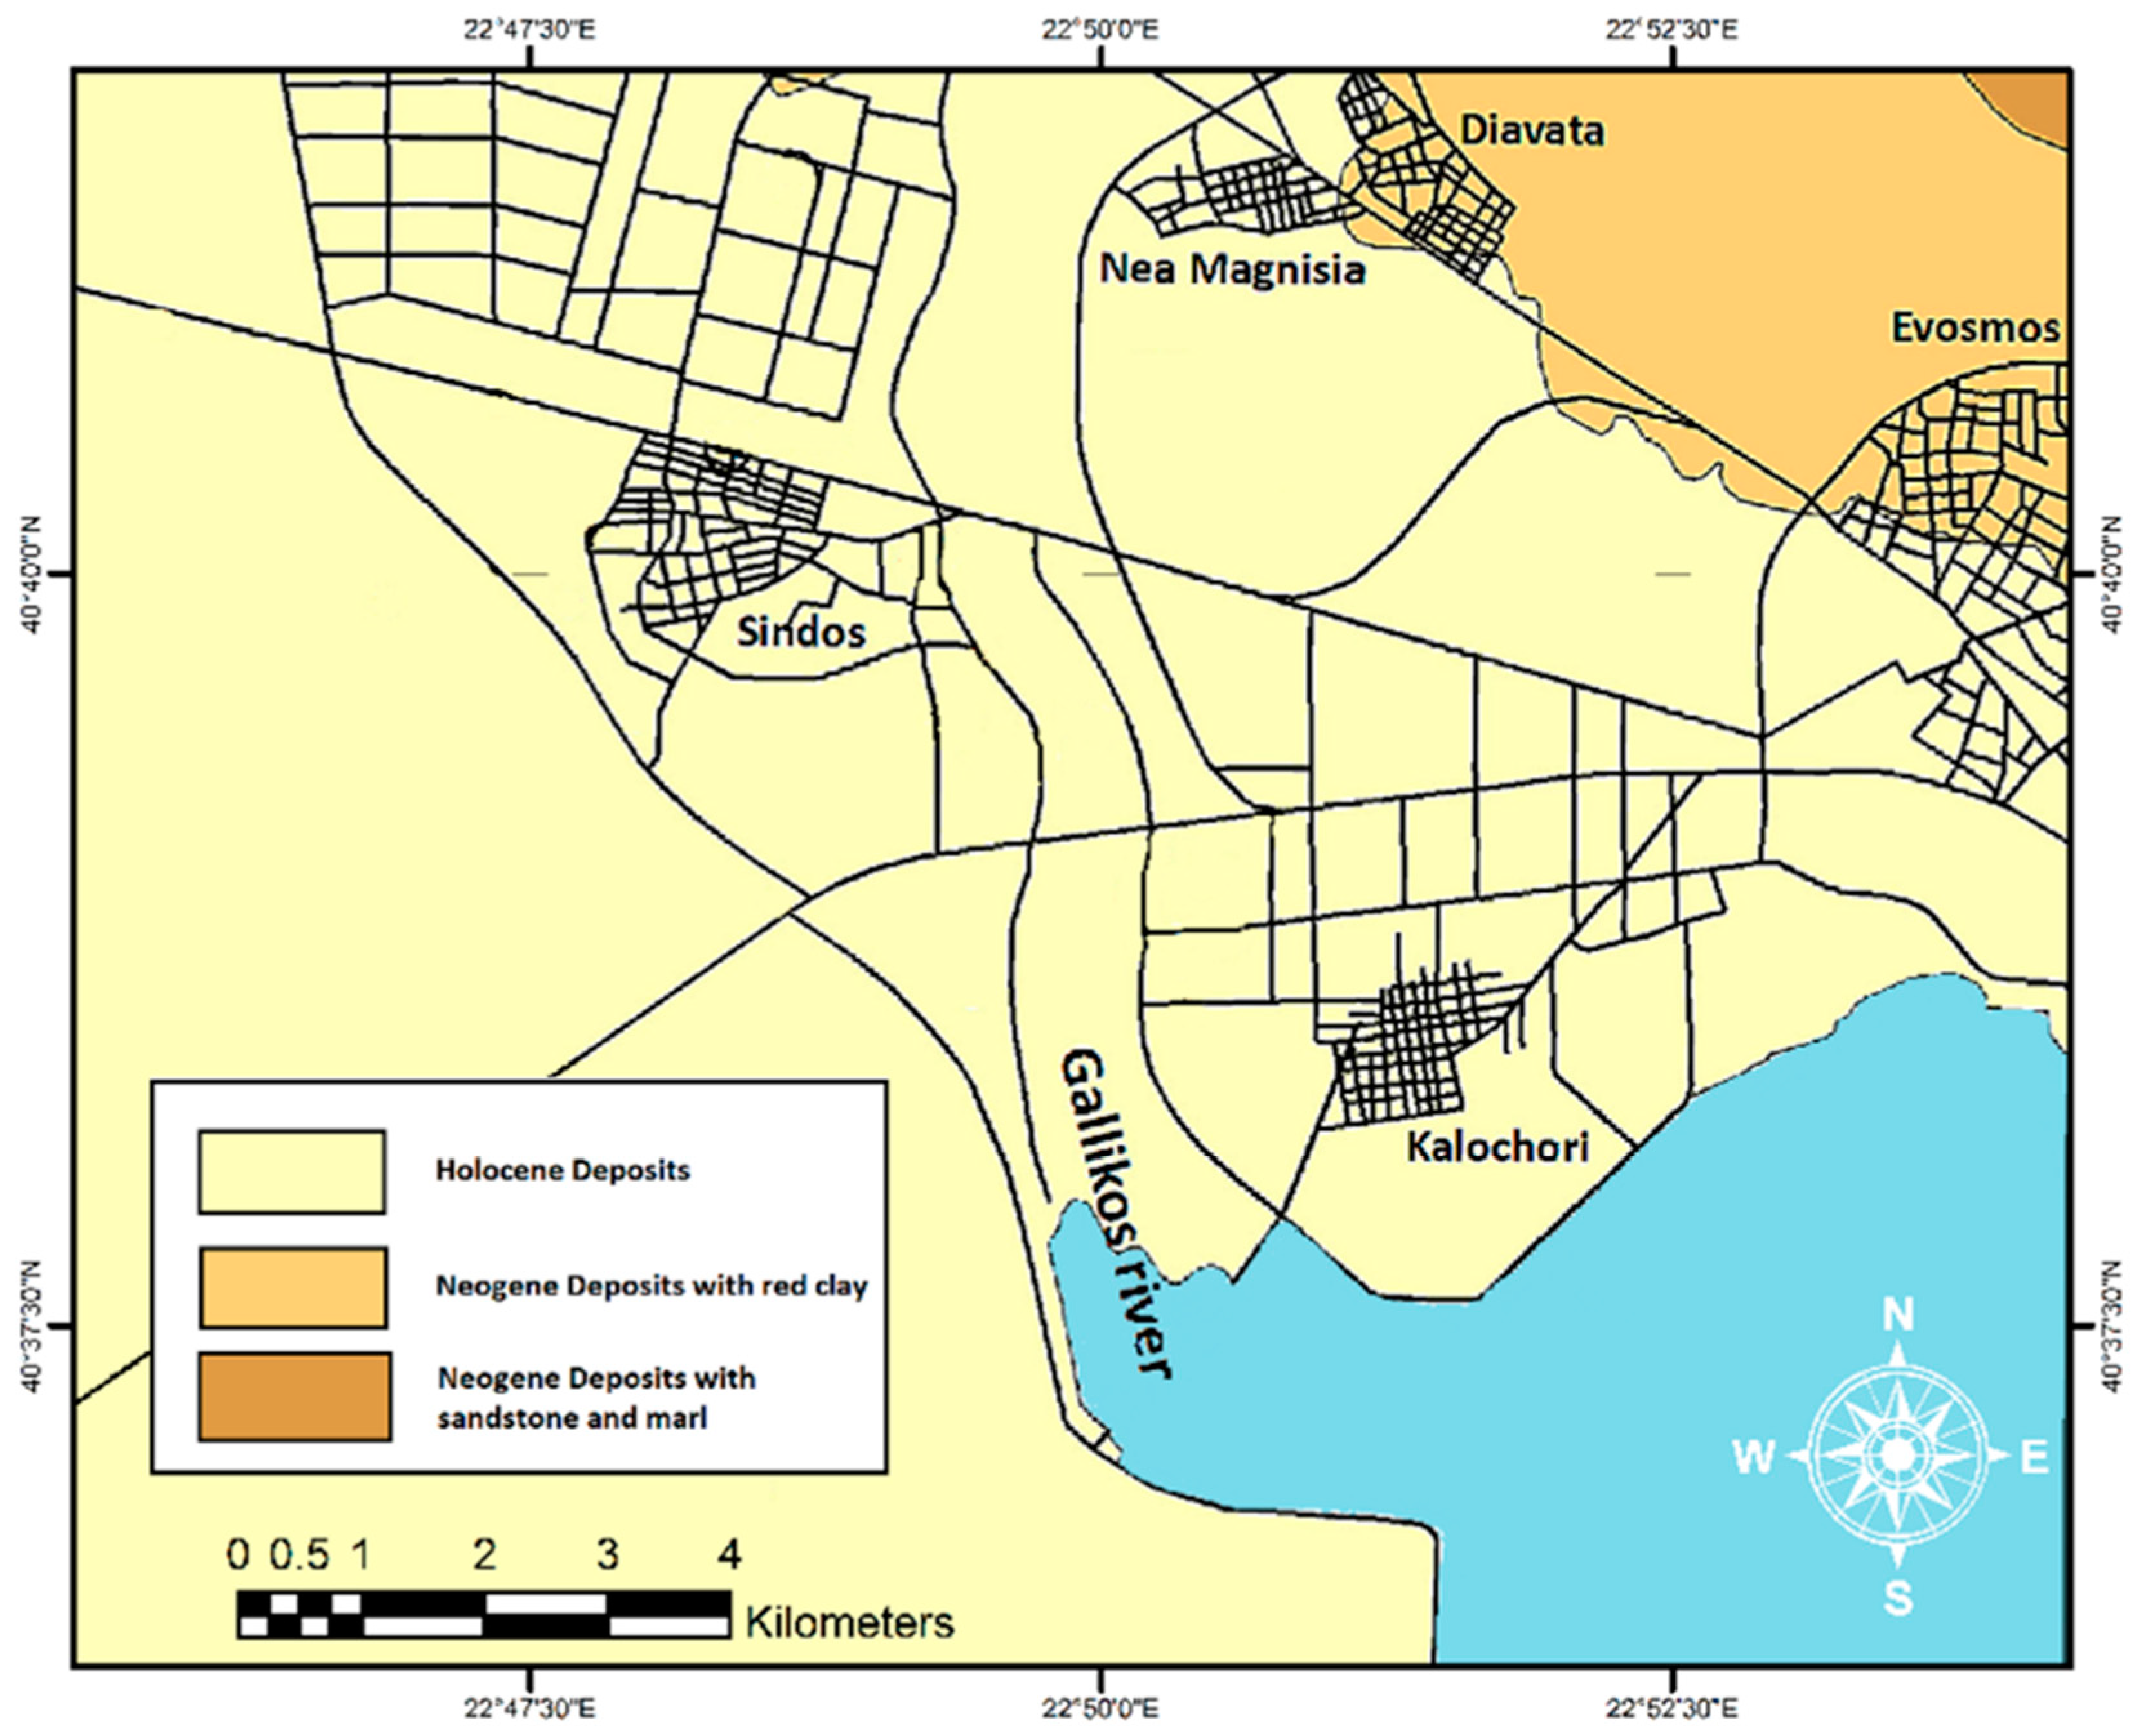
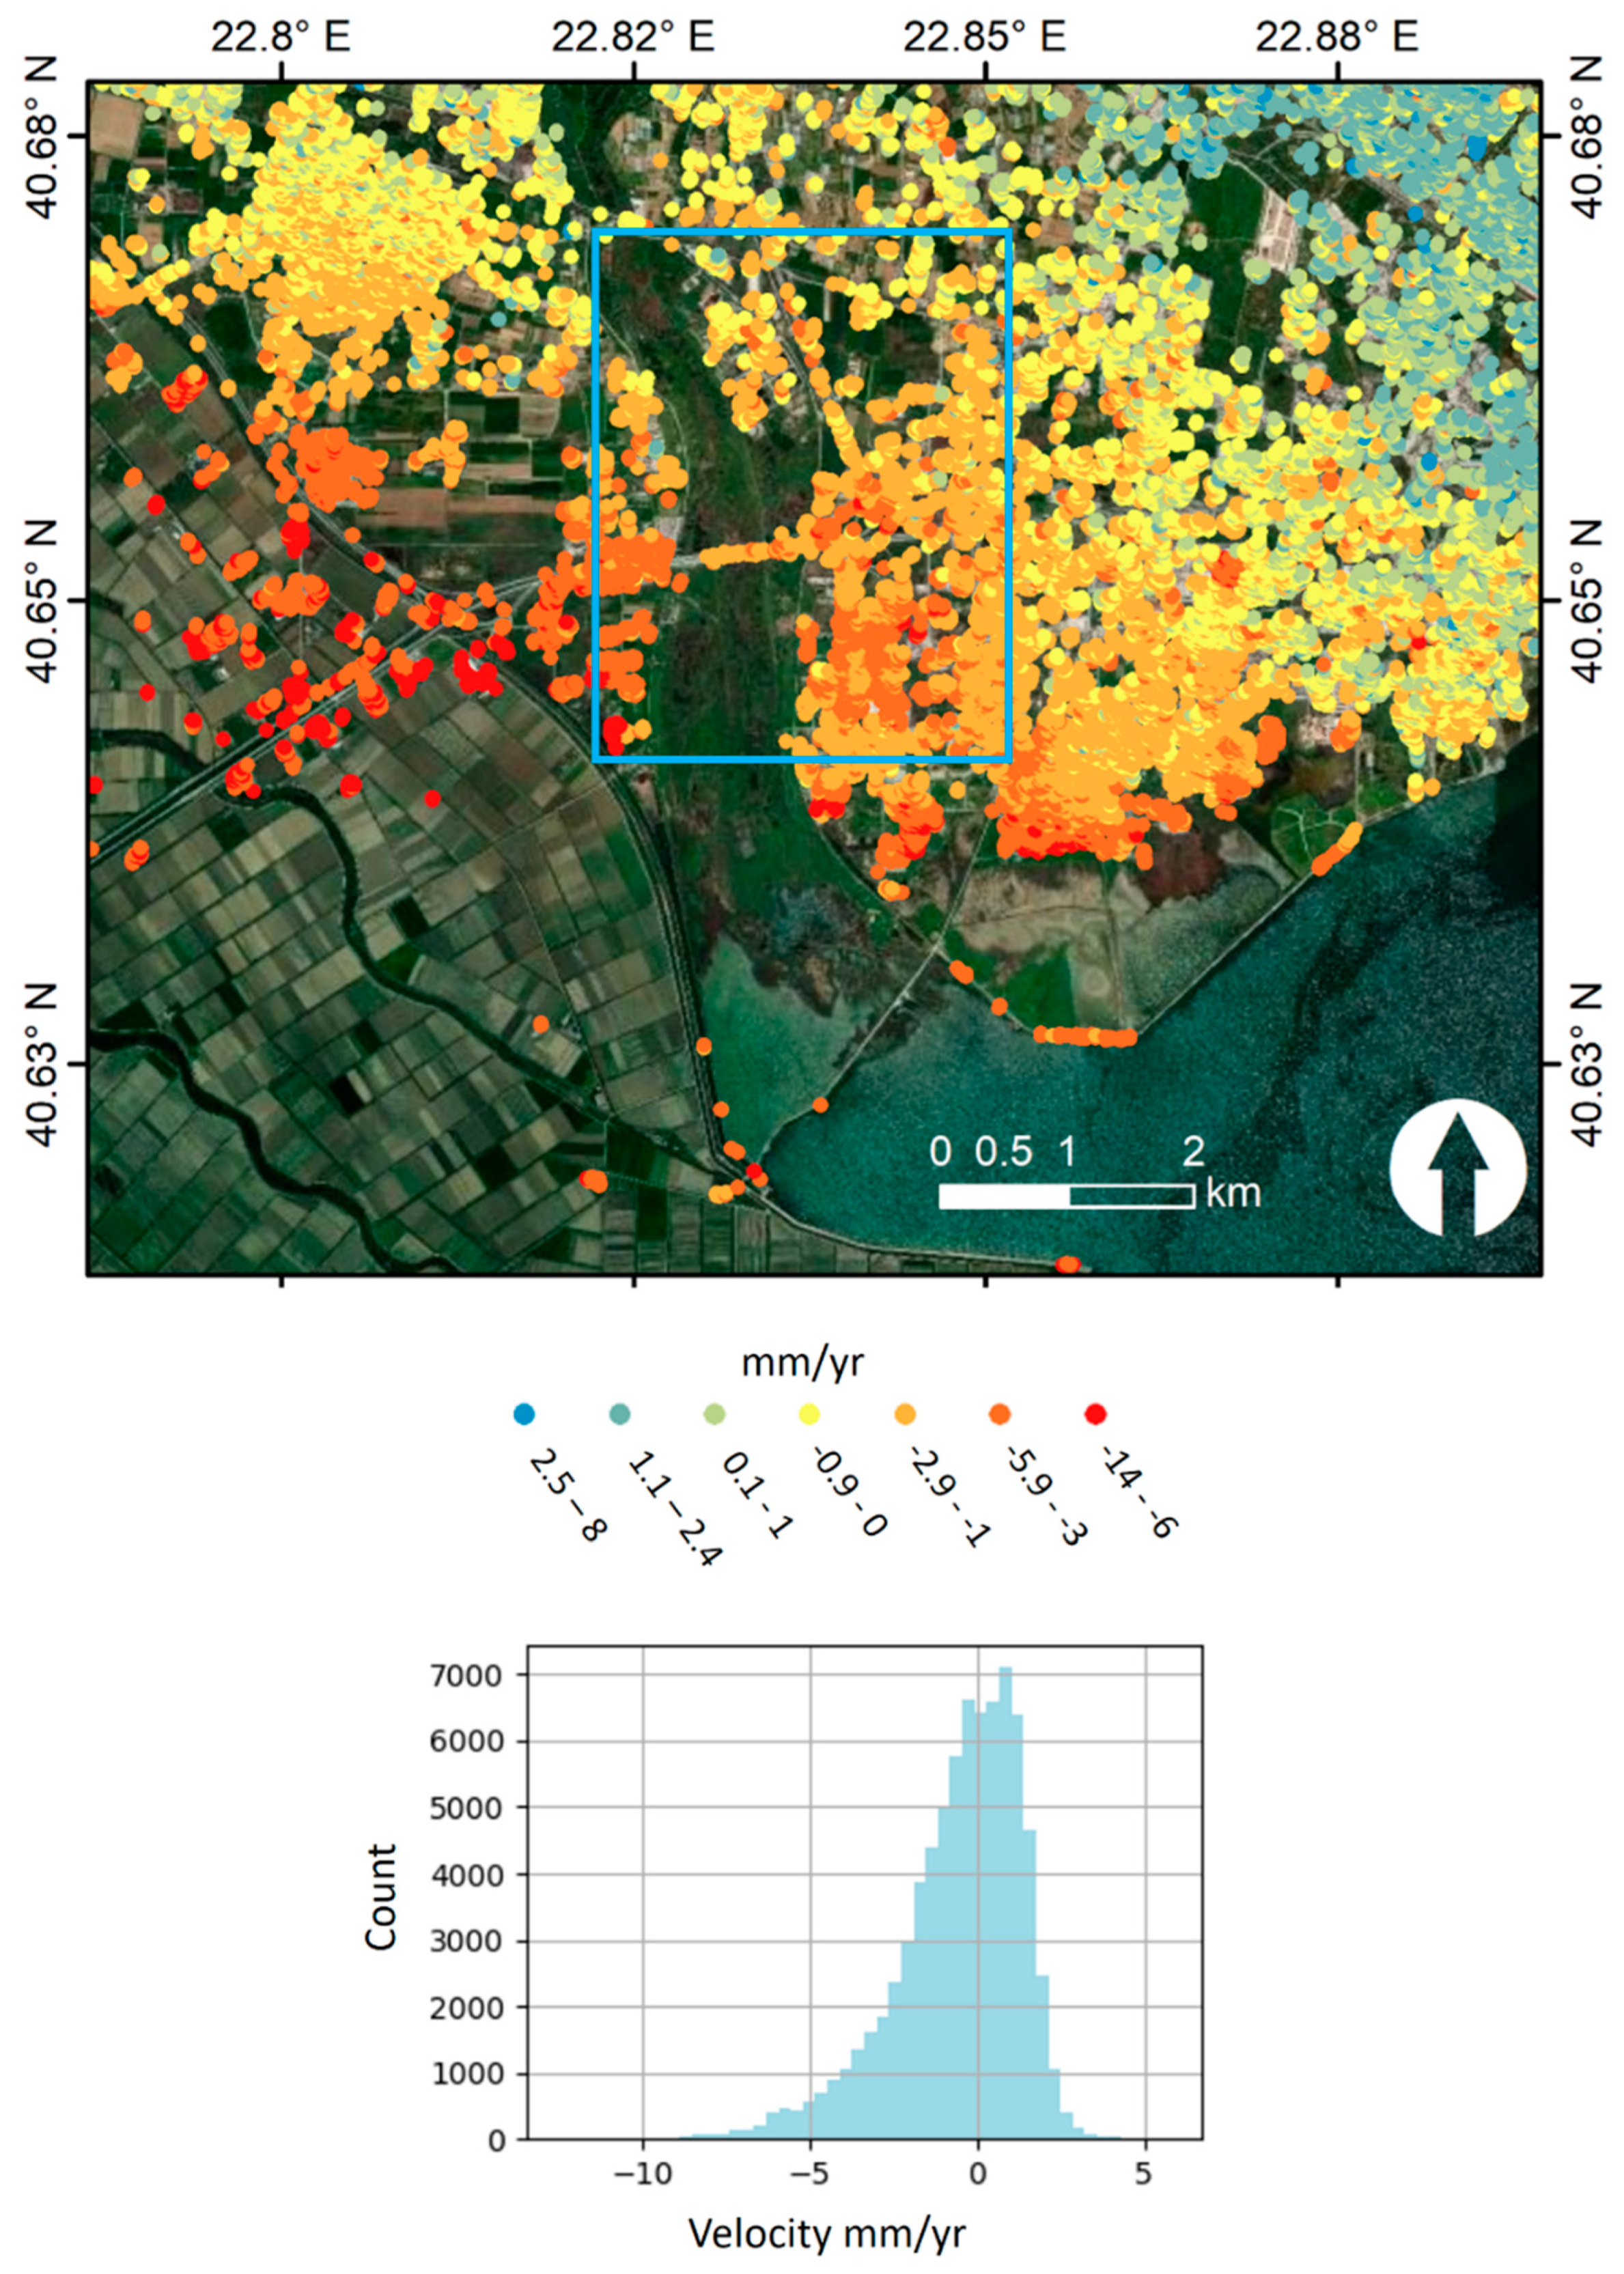
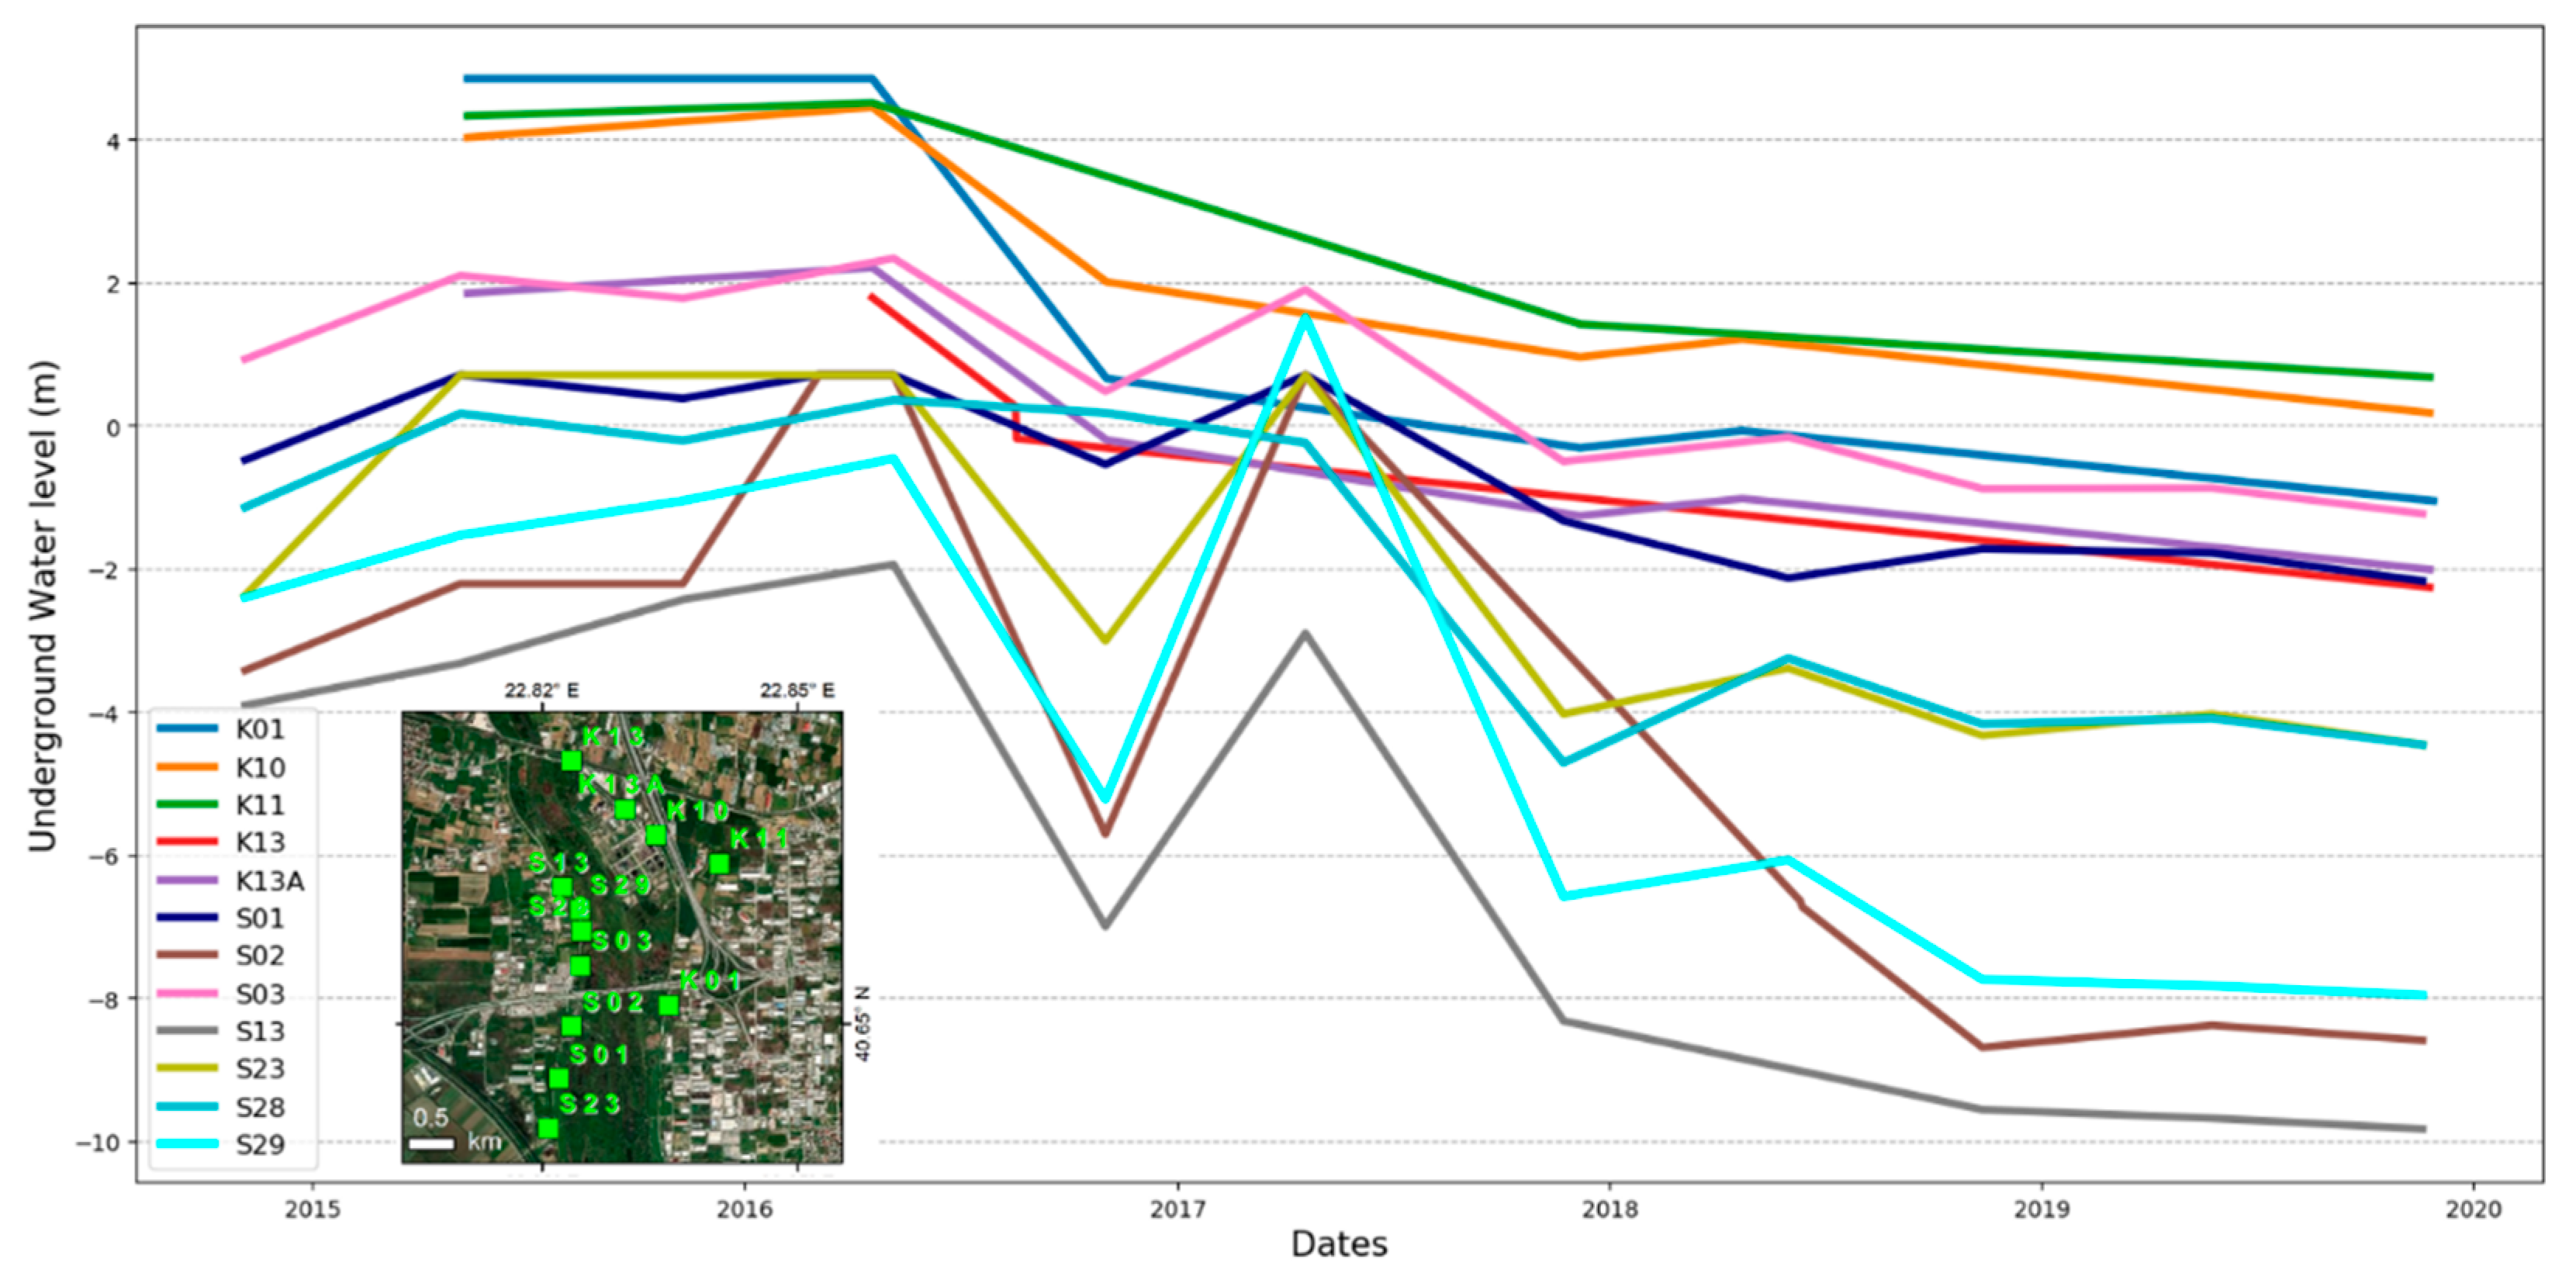
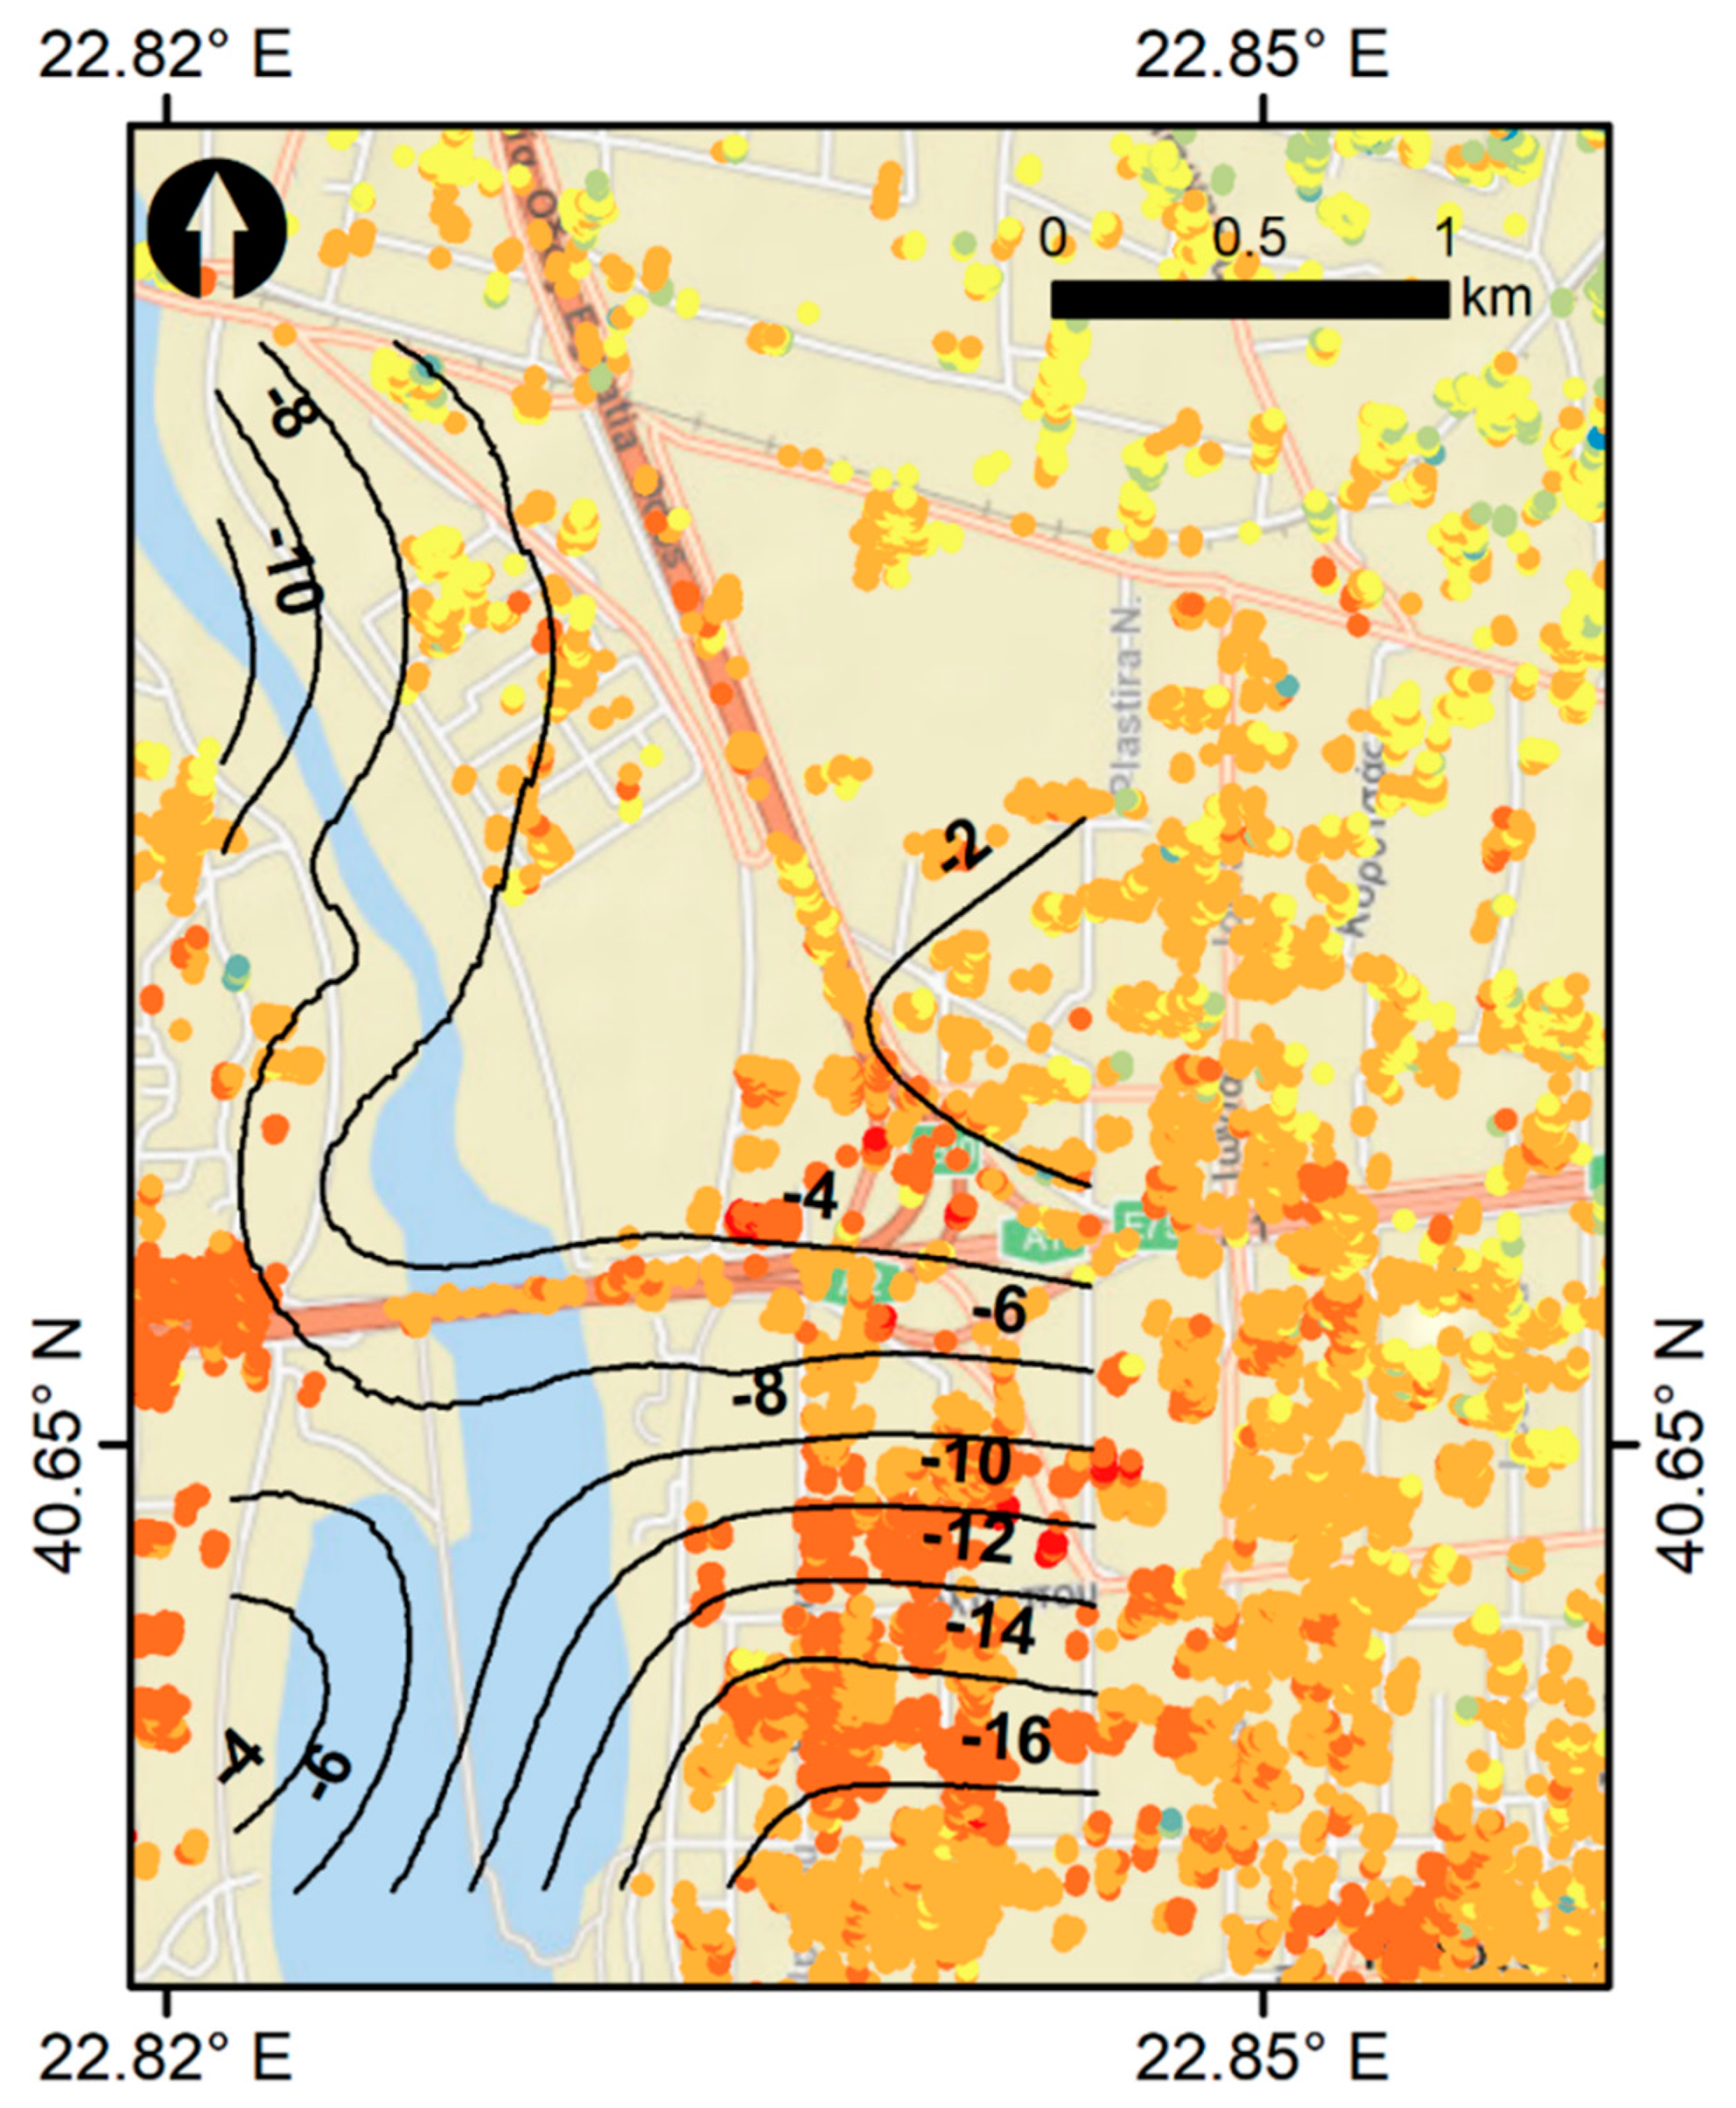
3.1. Kalochori–Sindos Region
3.2. Oreokastro Industrial Zone
3.3. Anthemountas Basin
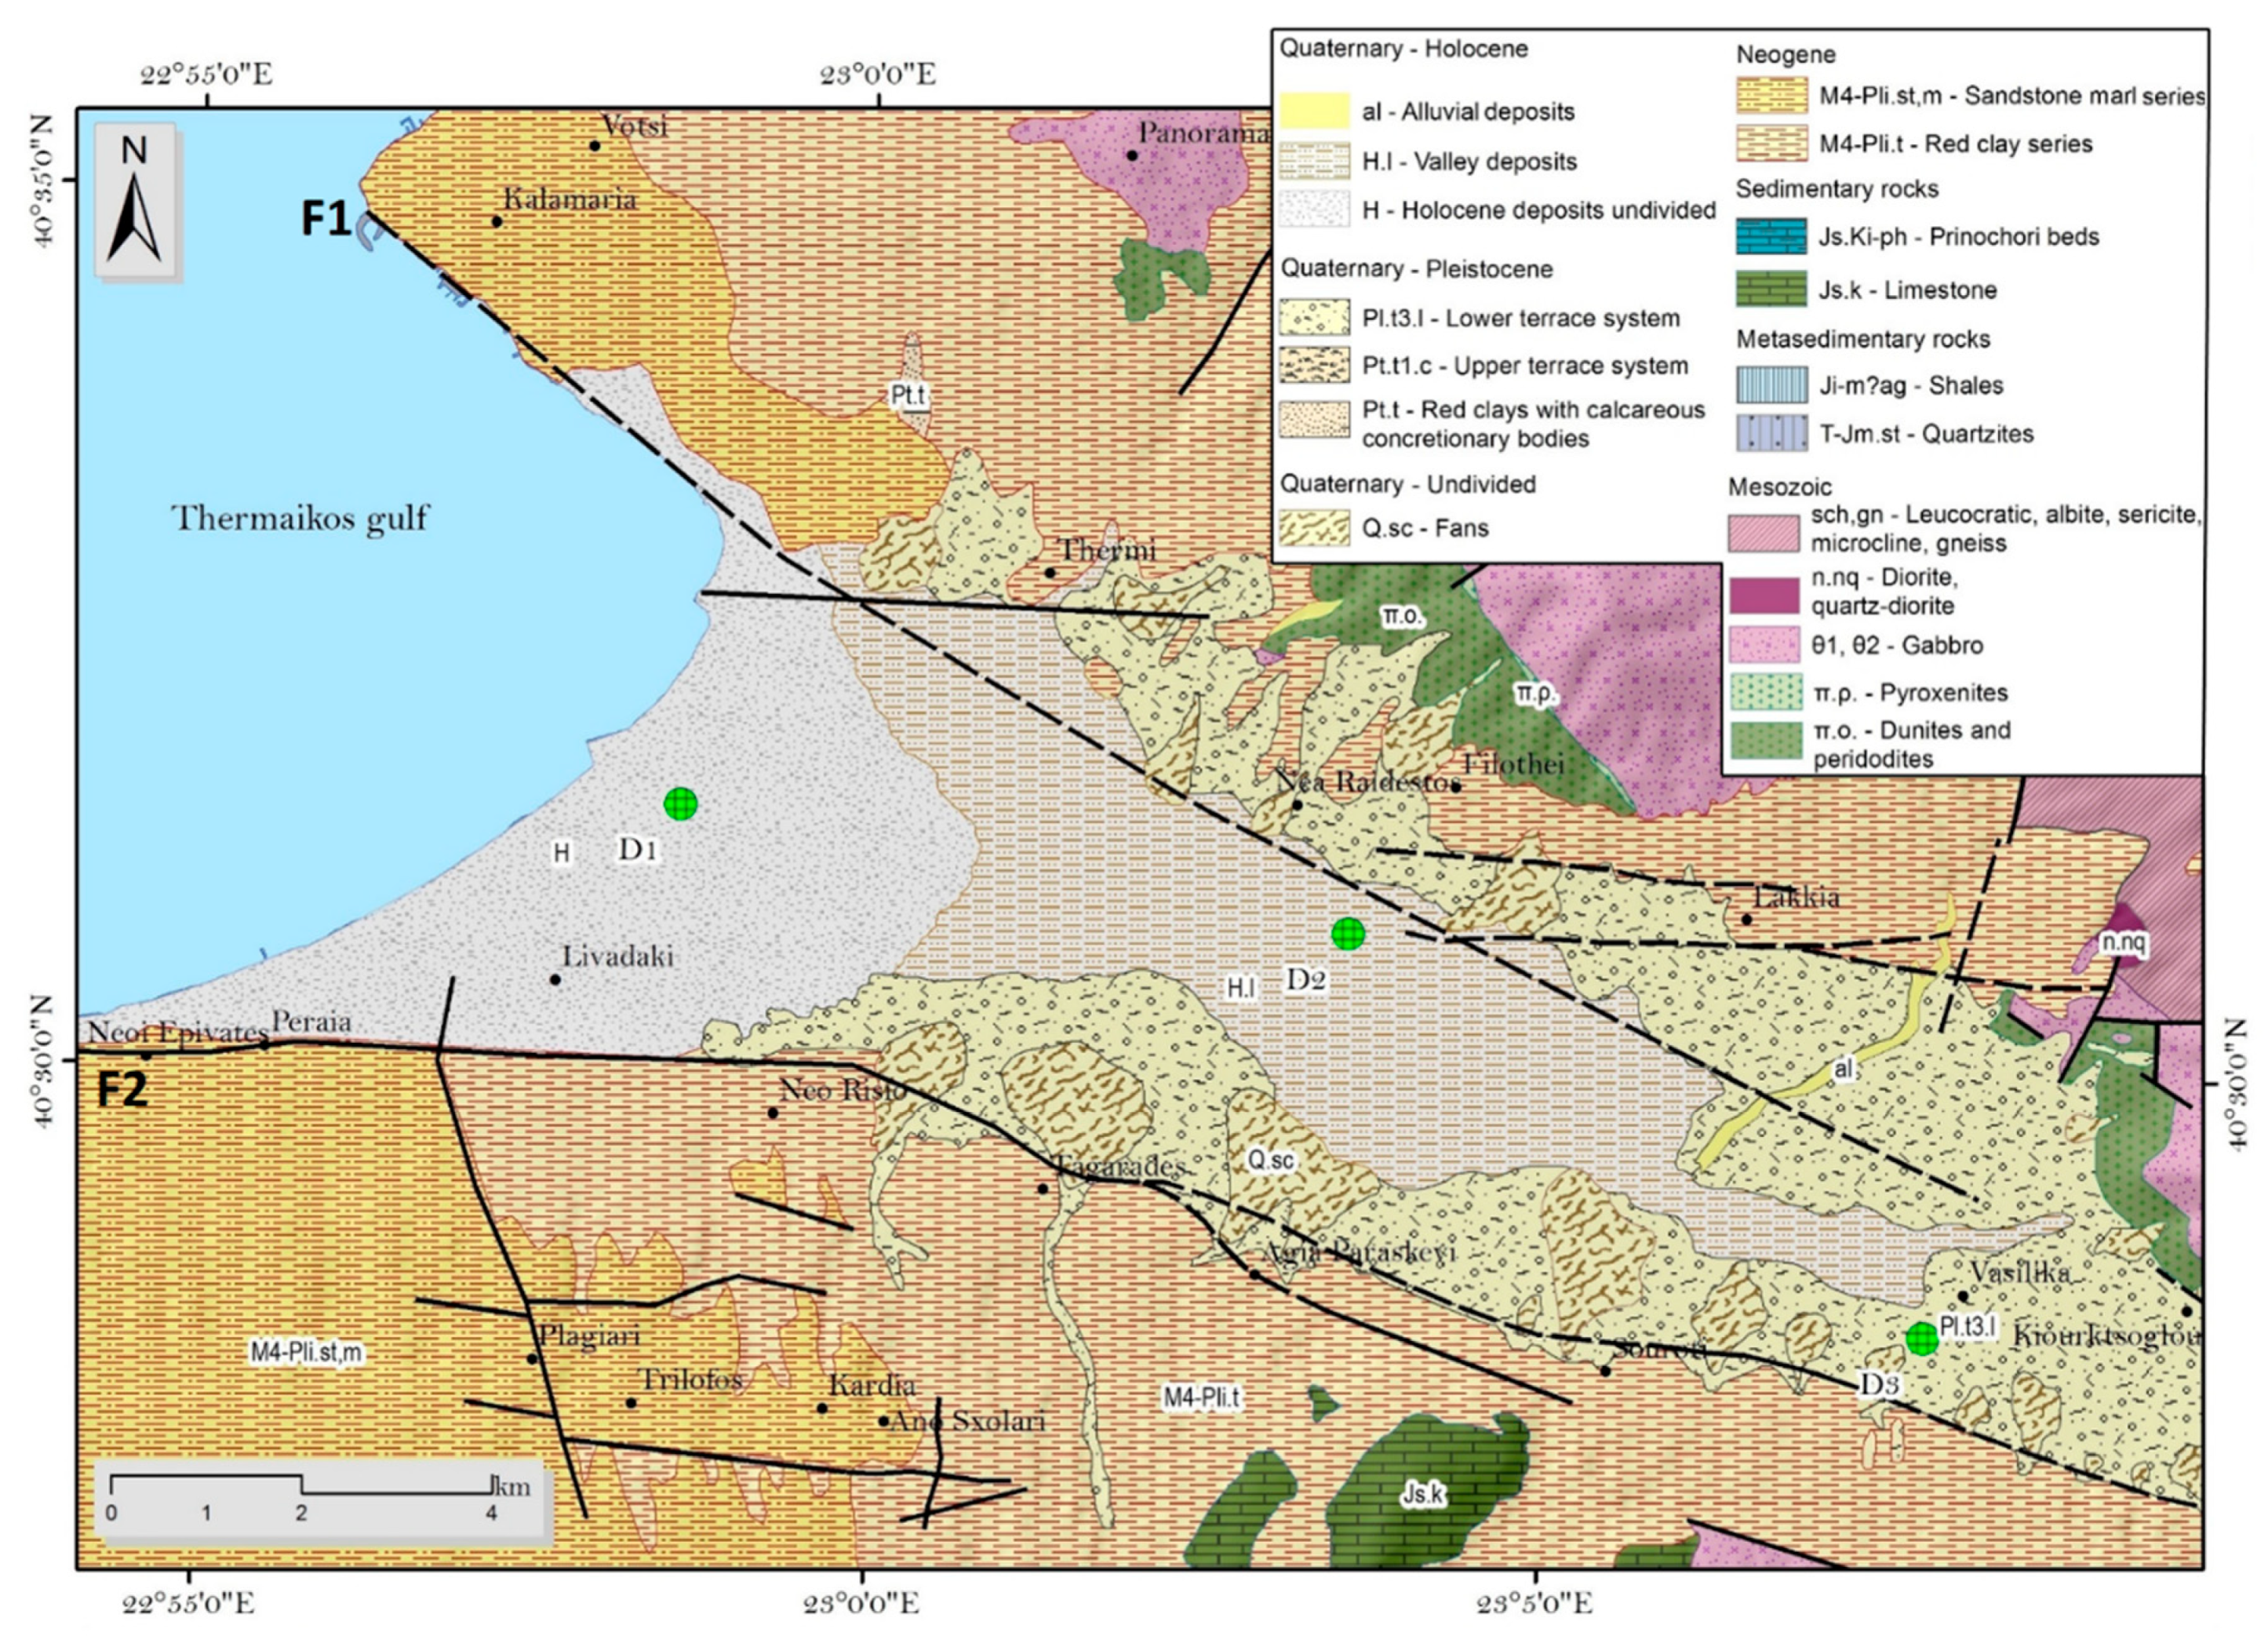
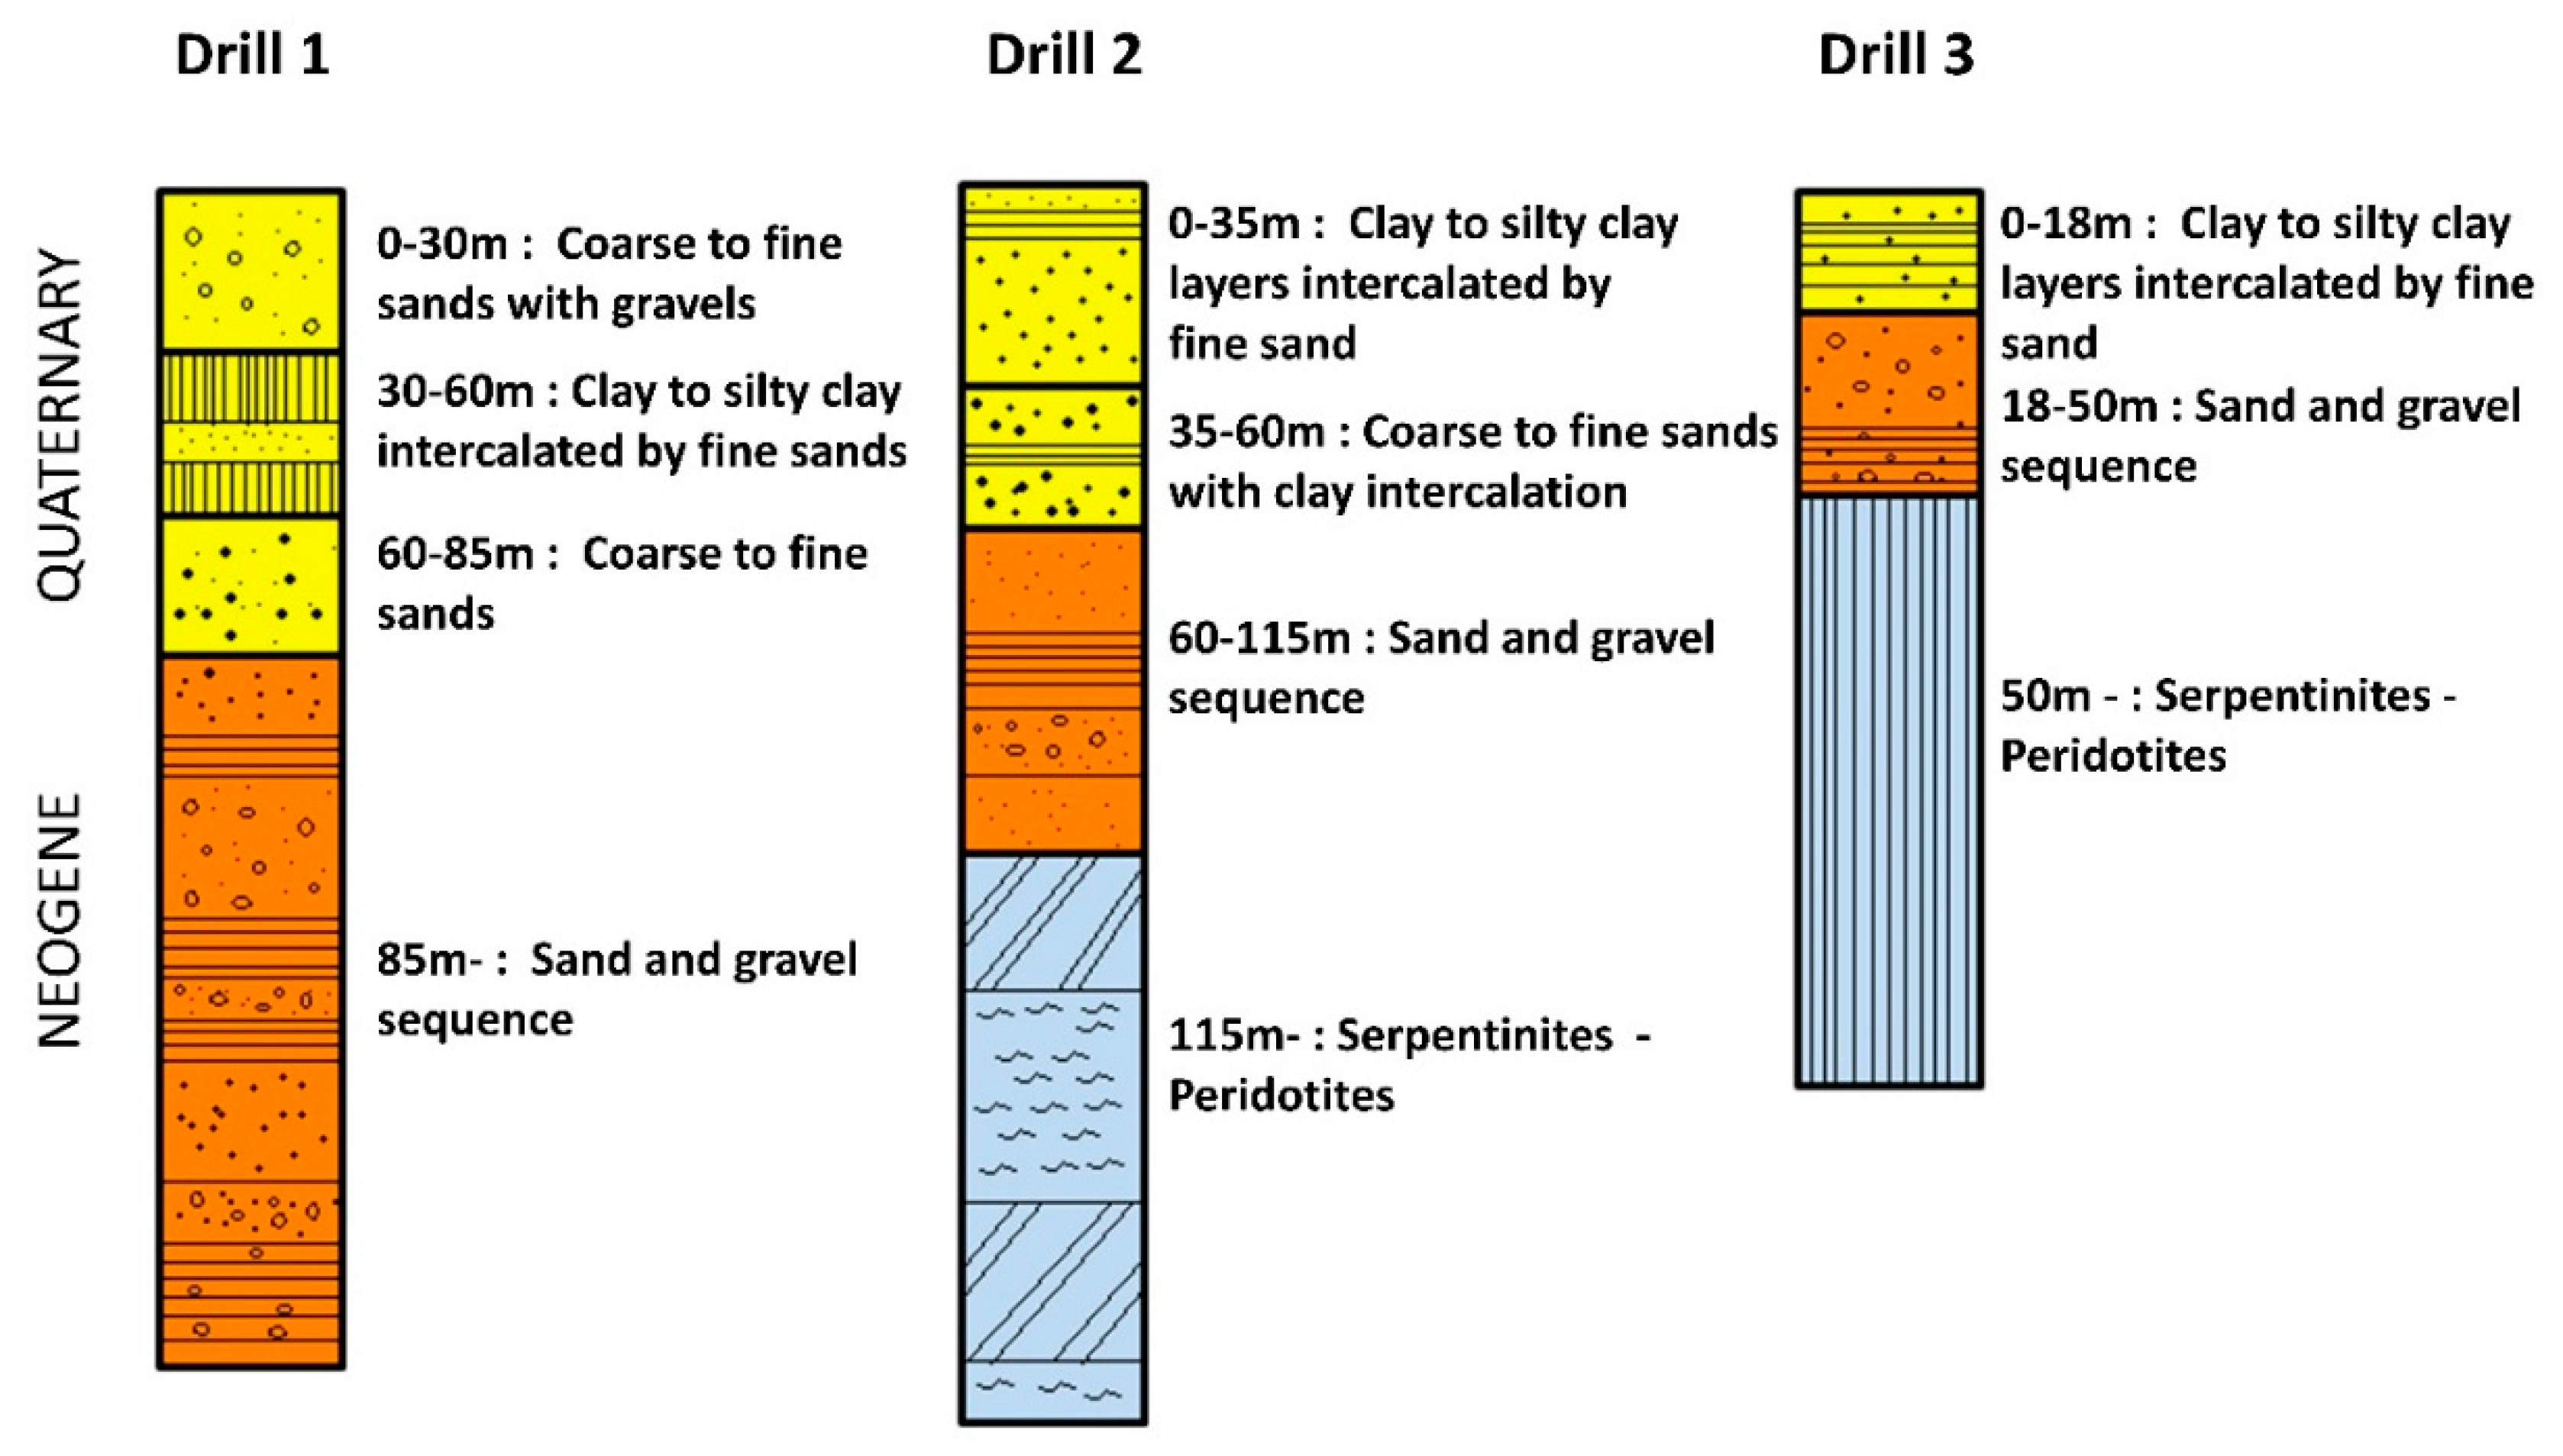
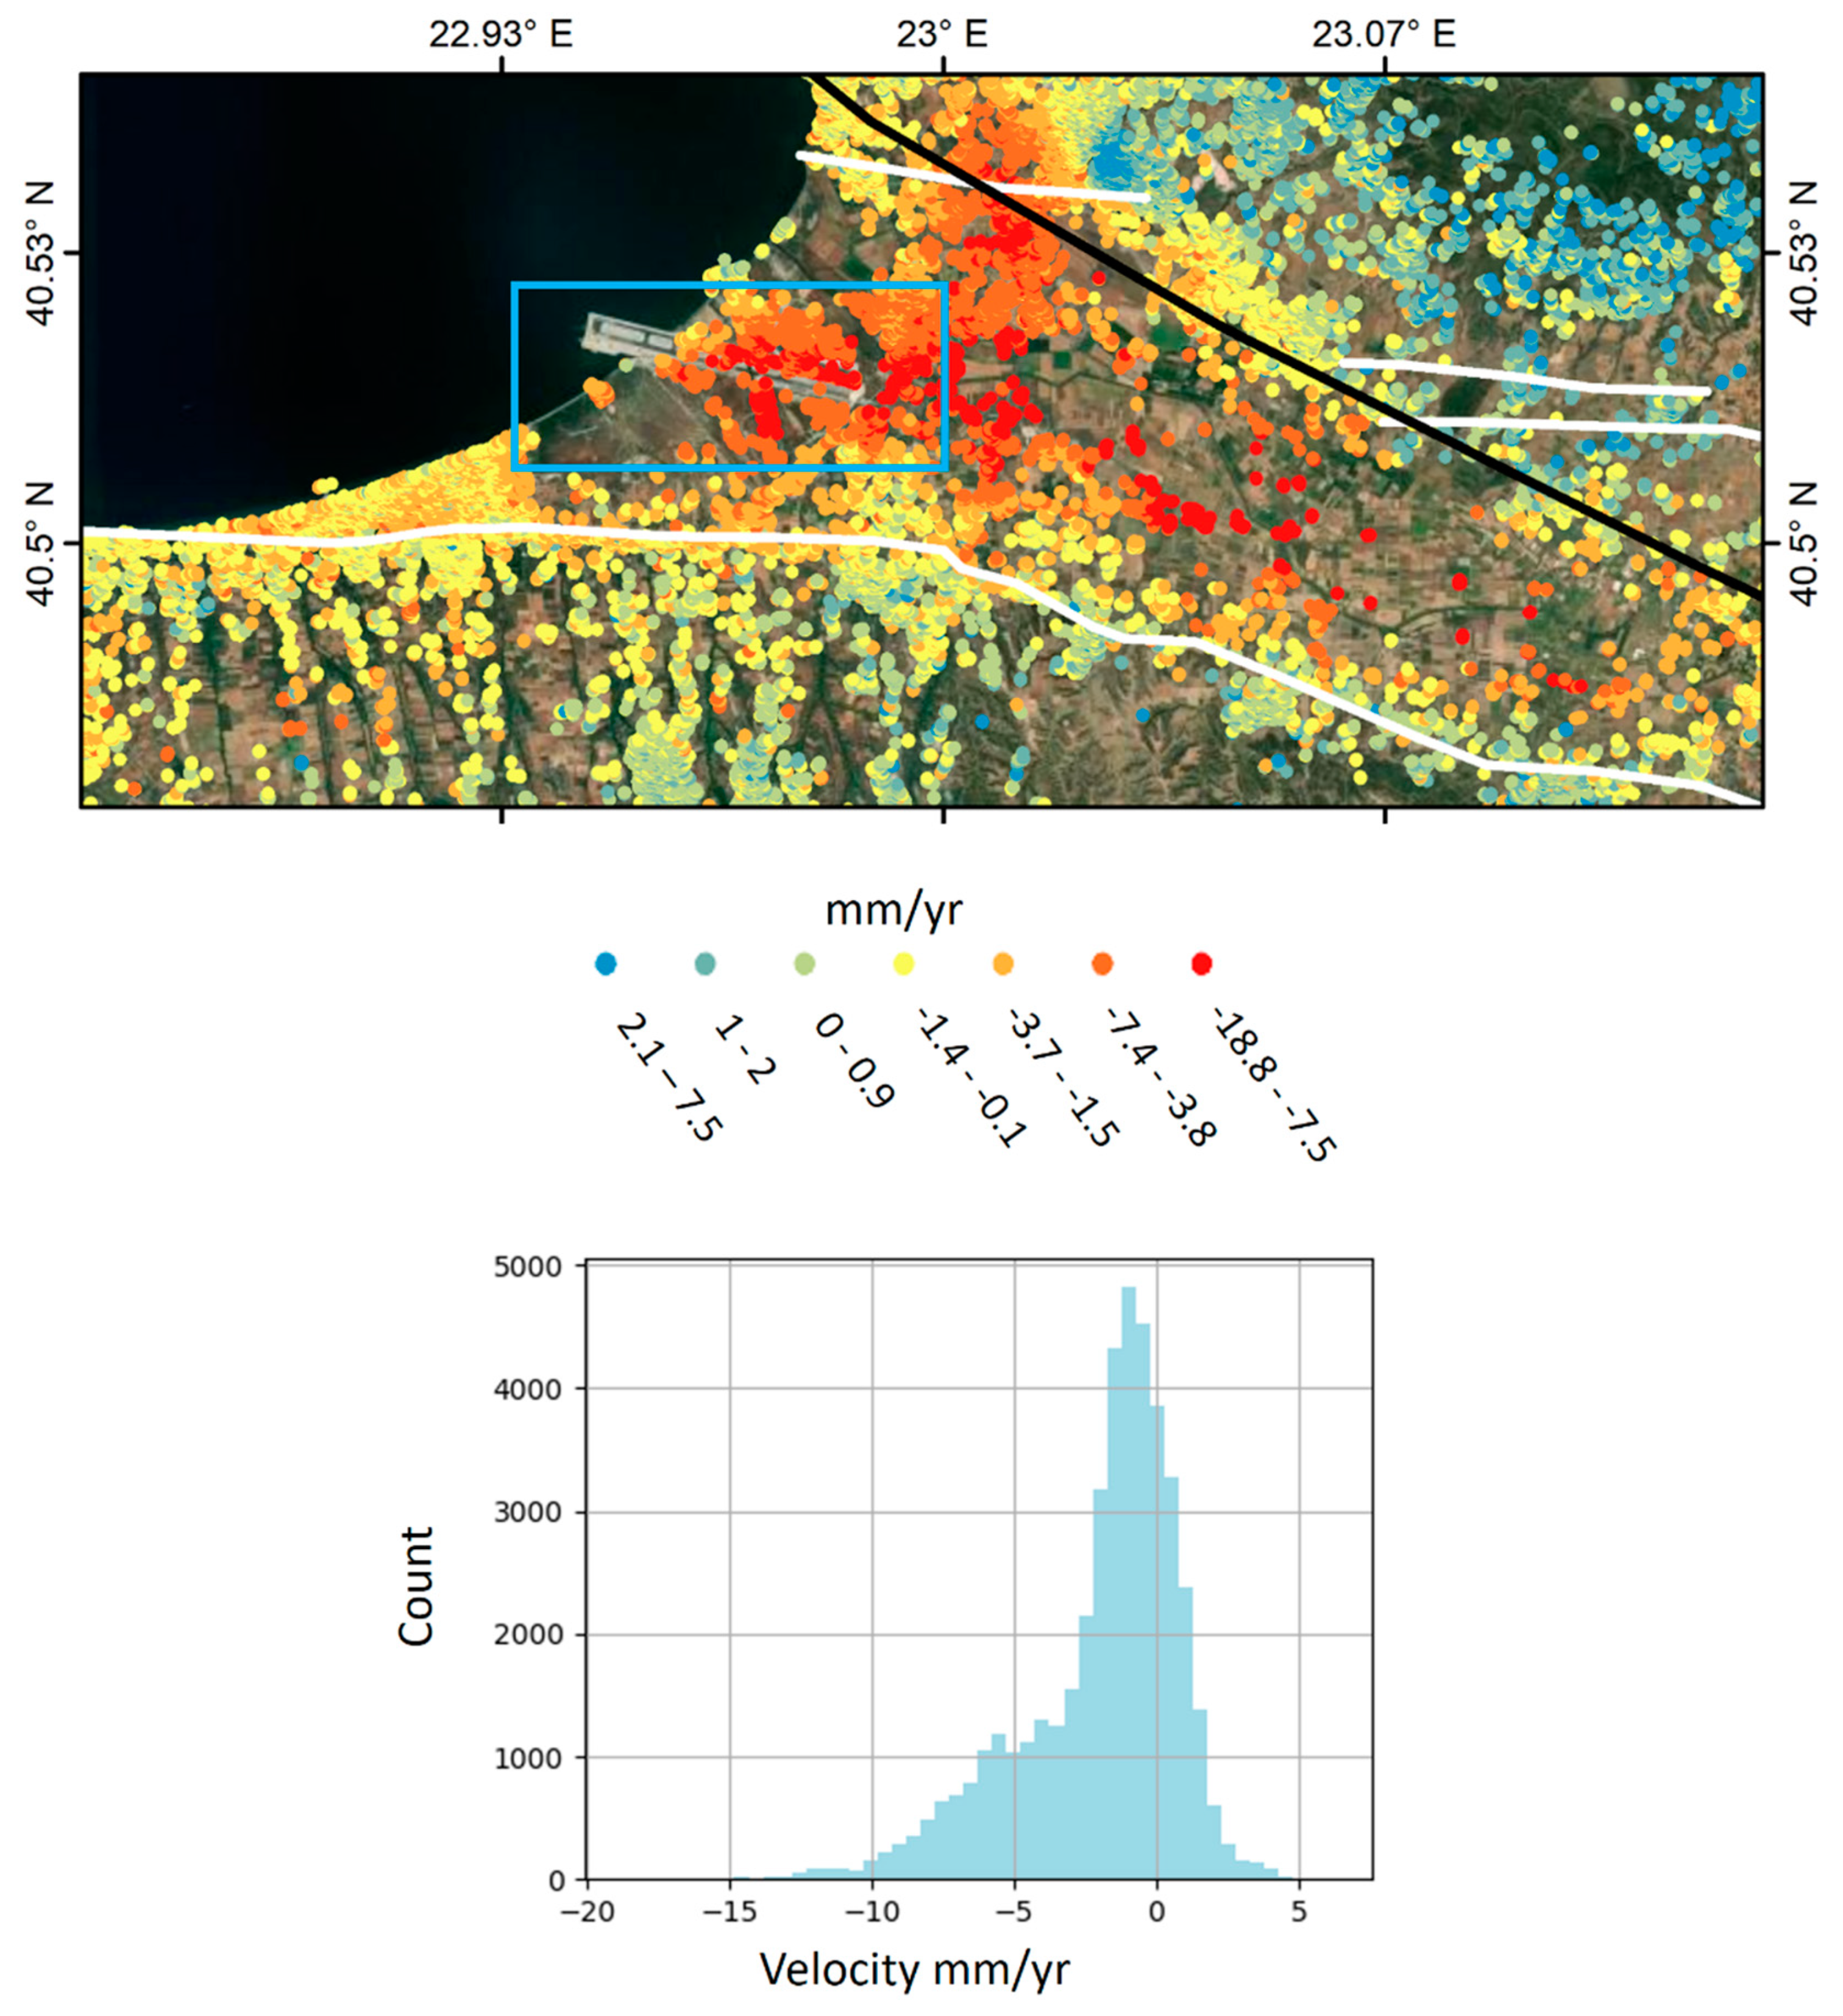
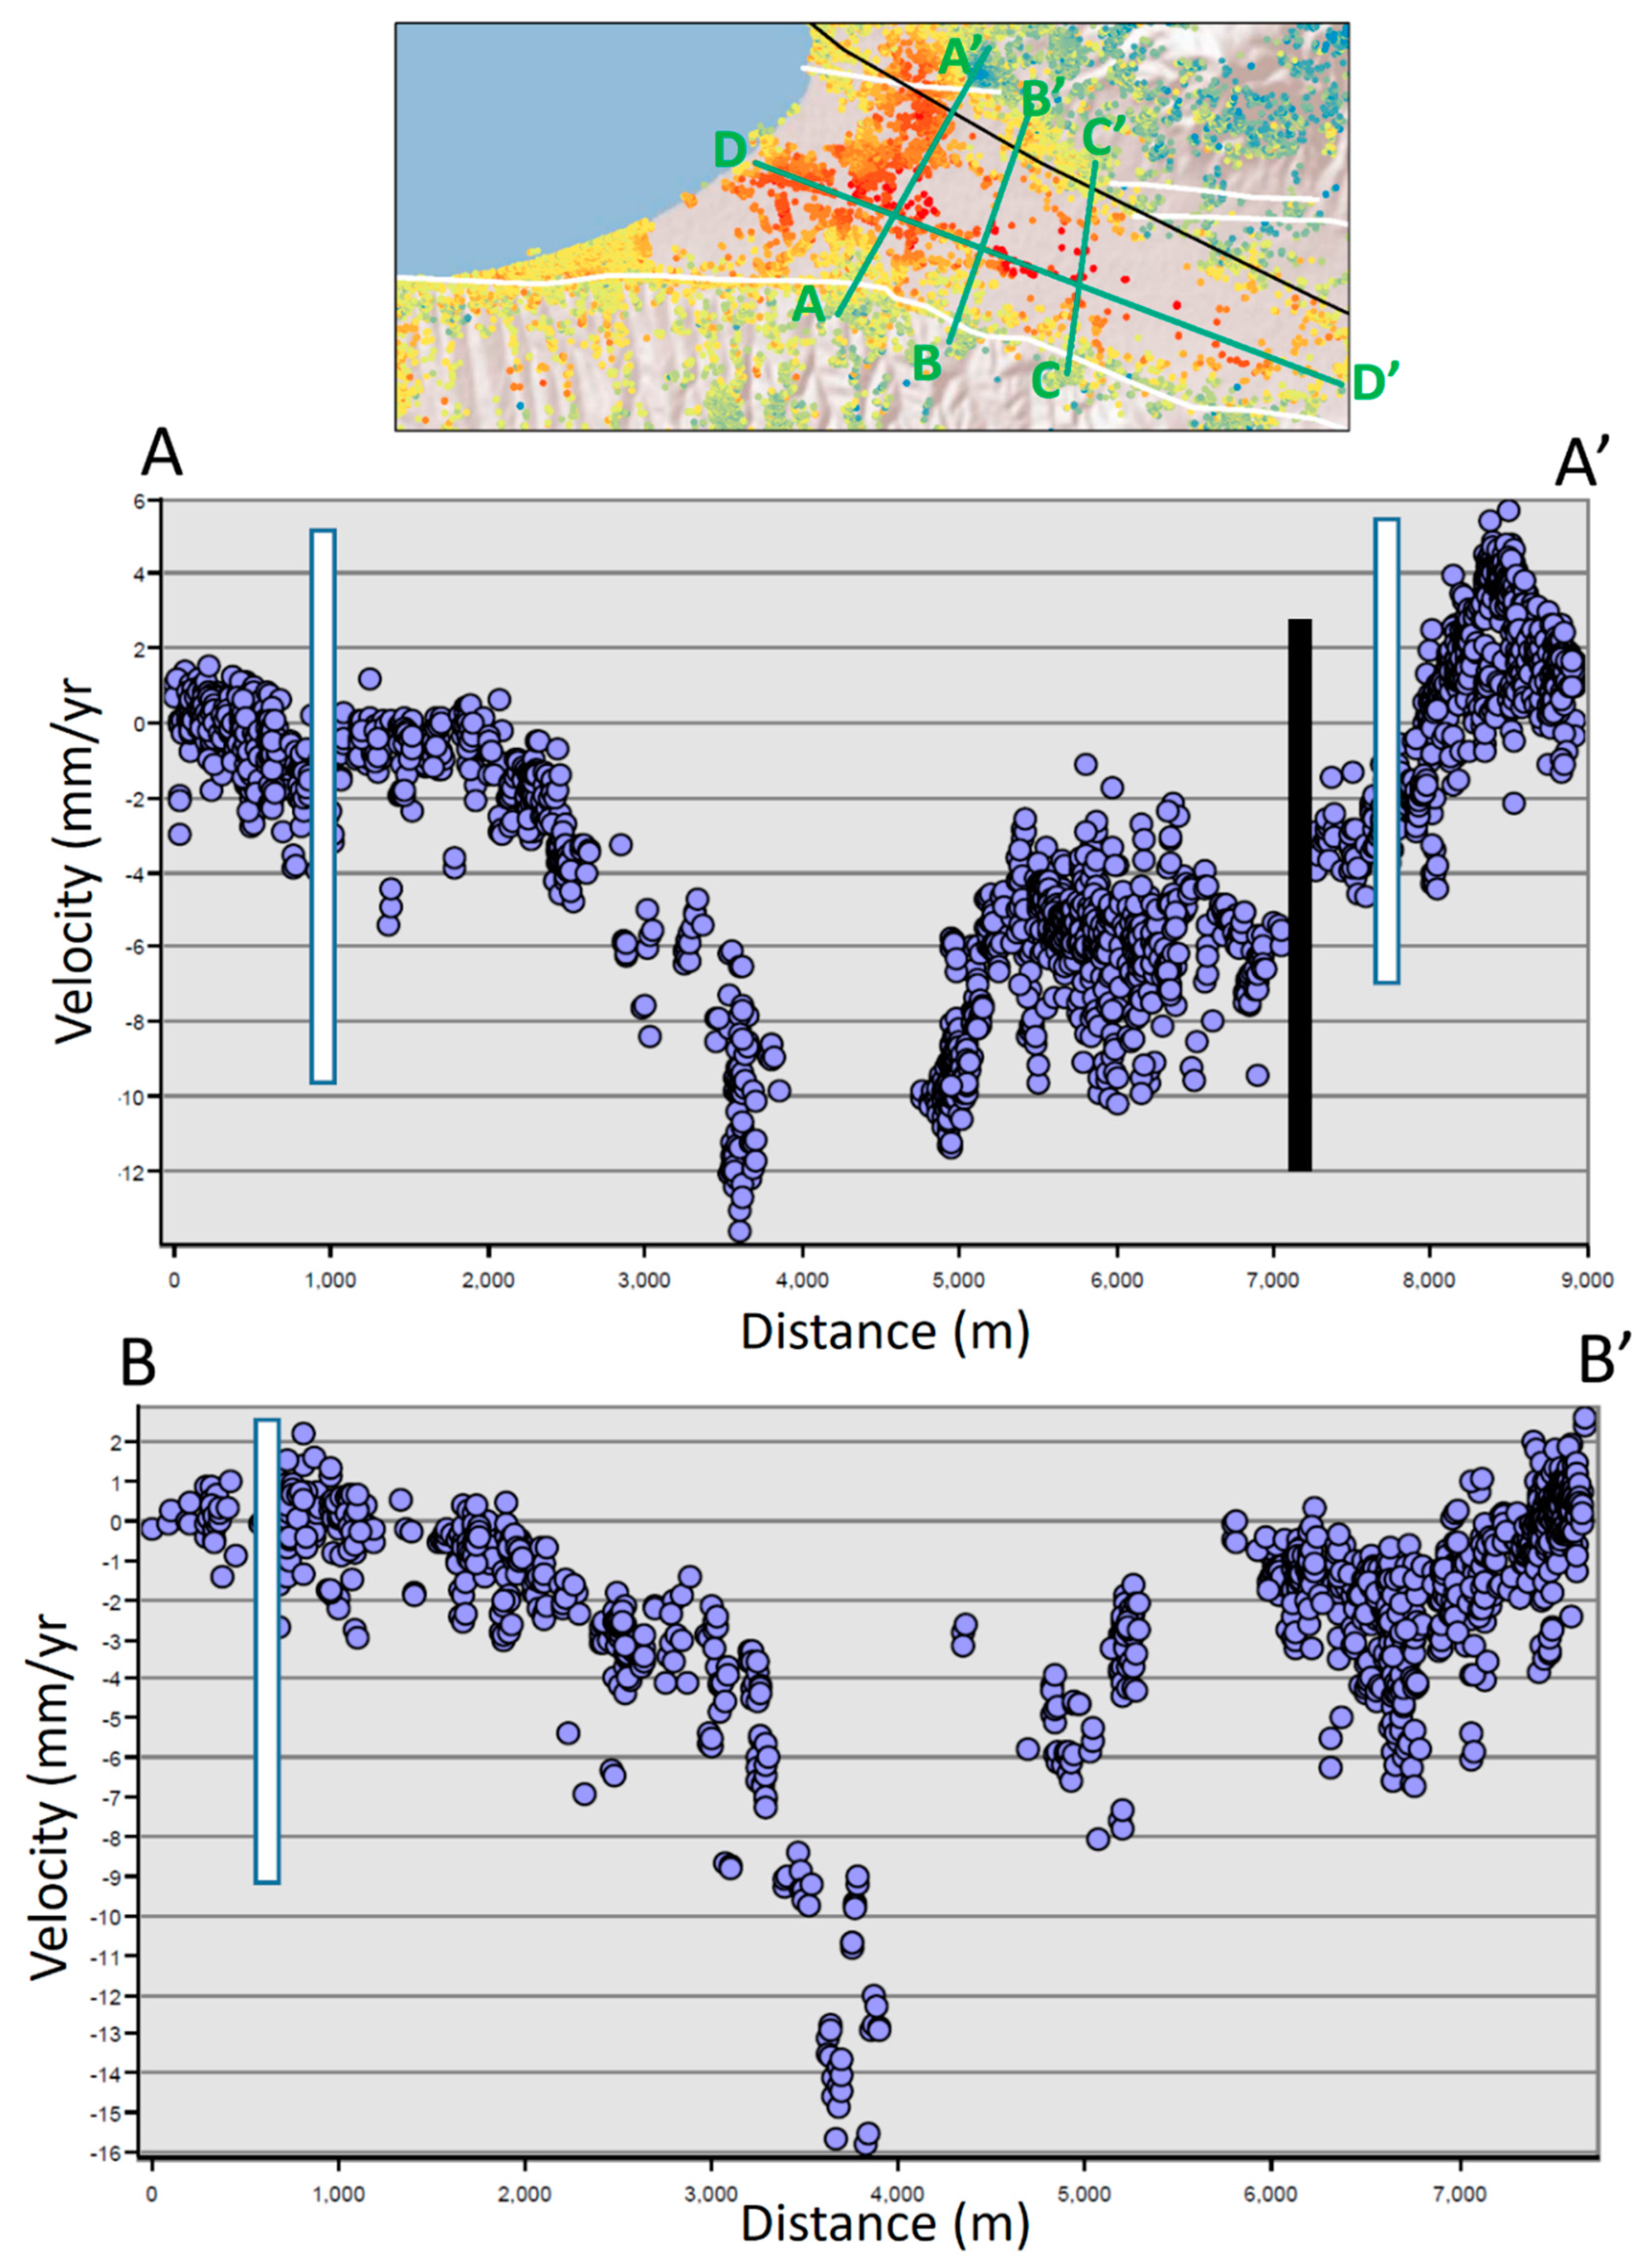
3.4. Nea Moudania
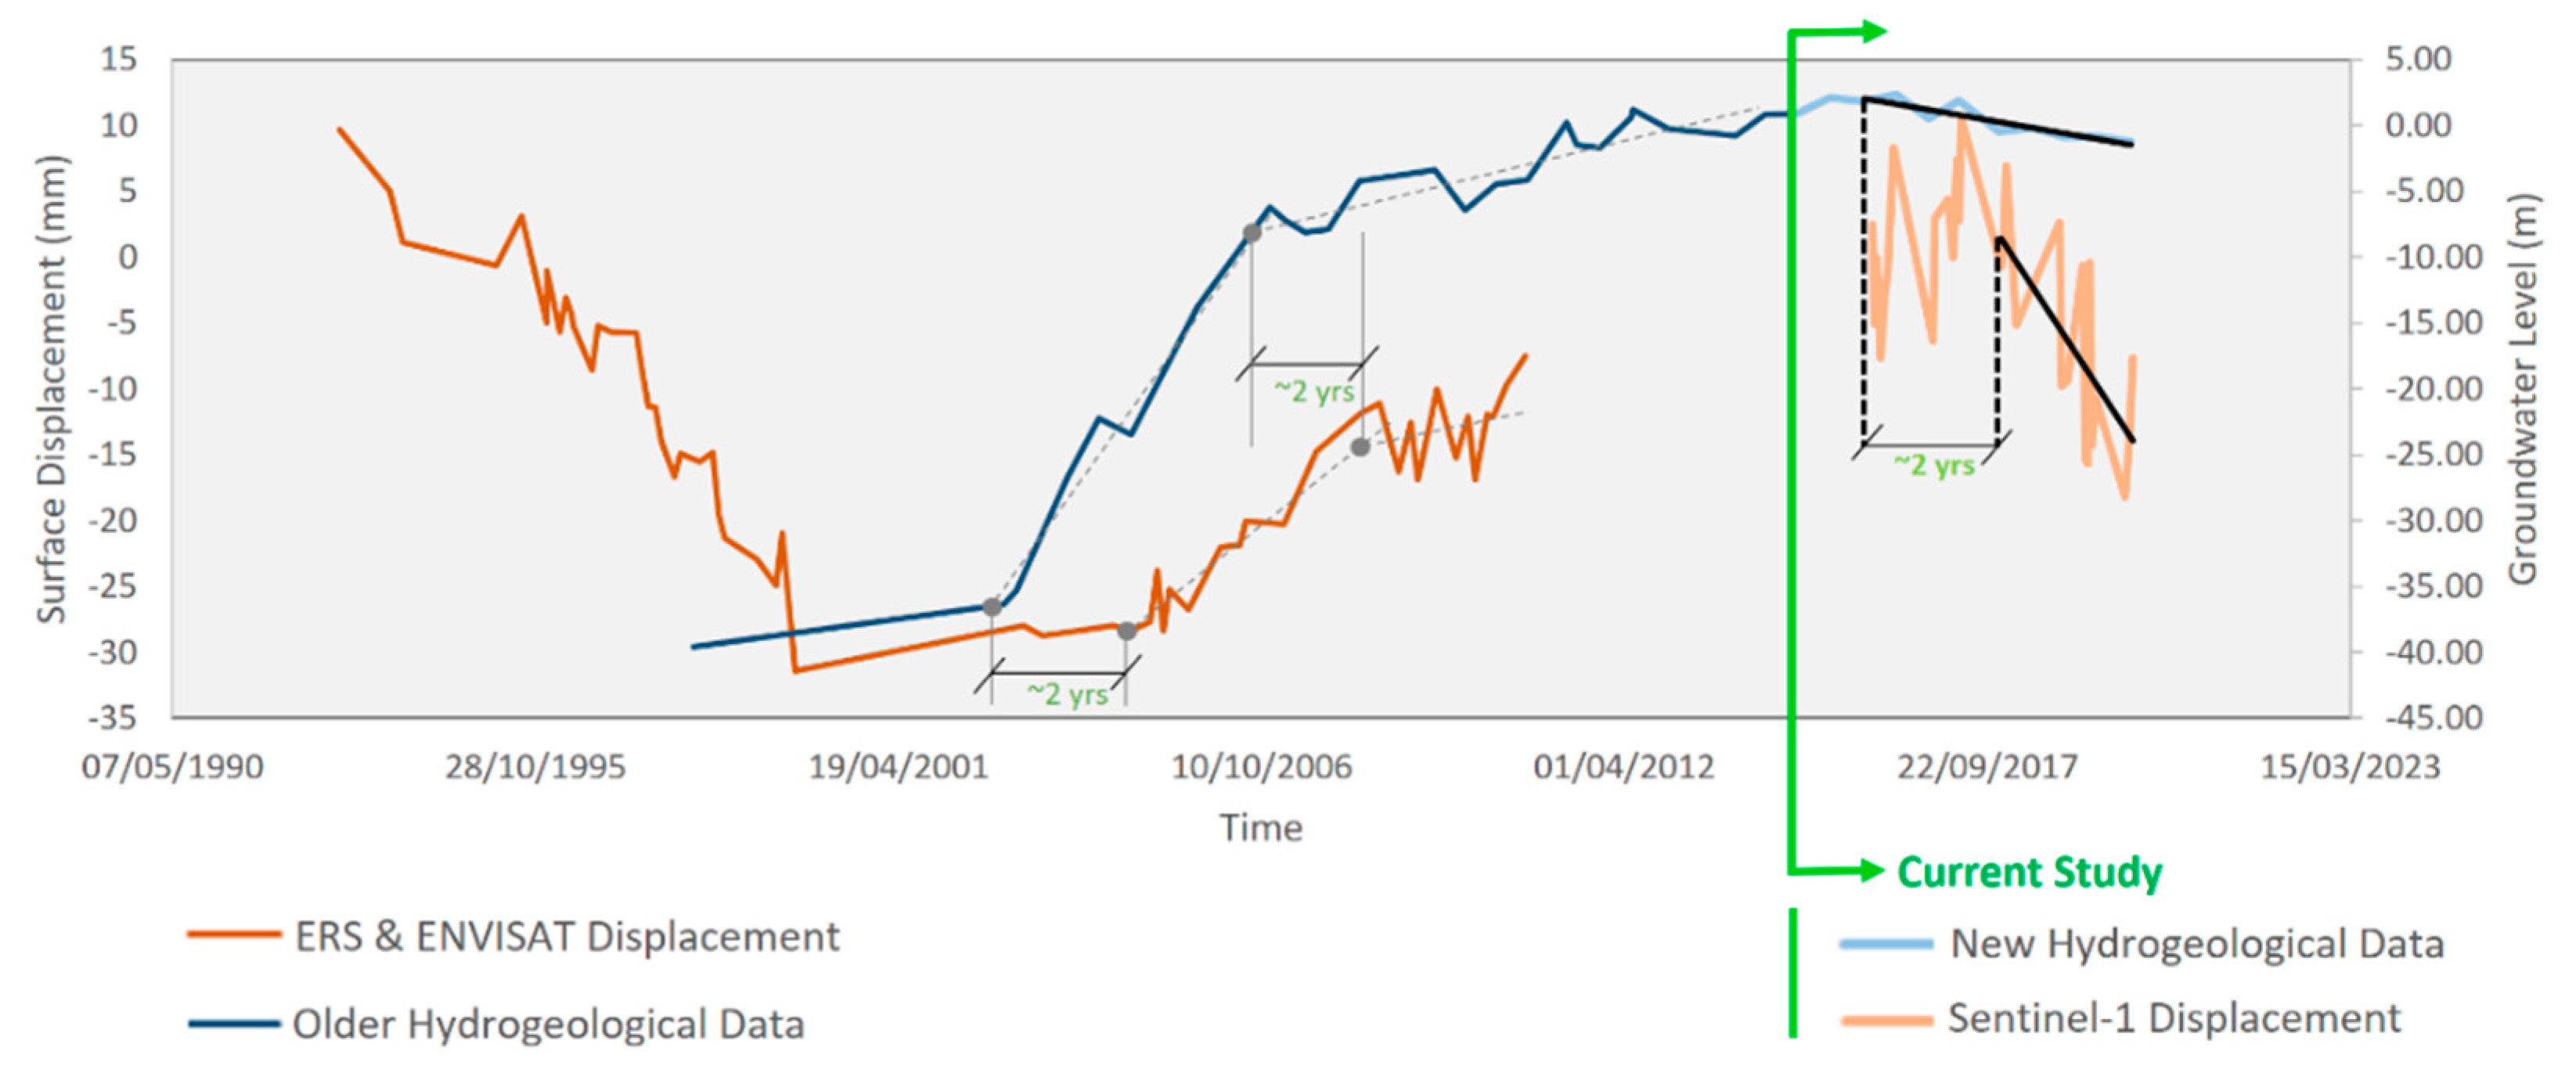
4. Discussion
5. Conclusions
Supplementary Materials
Author Contributions
Funding
Acknowledgments
Conflicts of Interest
References
- Loupasakis, C.; Angelitsa, V.; Rozos, D.; Spanou, N. Mining geohazards—Land subsidence caused by the dewatering of opencast coal mines: The case study of the Amyntaio coal mine, Florina, Greece. Nat. Hazards 2013, 70, 675–691. [Google Scholar] [CrossRef]
- Psimoulis, P.; Ghilardi, M.; Fouache, E.; Stiros, S. Subsidence and evolution of the Thessaloniki plain, Greece, based on historical leveling and GPS data. Eng. Geol. 2007, 90, 55–70. [Google Scholar] [CrossRef]
- Galloway, D.L.; Hoffmann, J. The application of satellite differential SAR interferometry-derived ground displacements in hydrogeology. Hydrogeol. J. 2006, 15, 133–154. [Google Scholar] [CrossRef] [Green Version]
- Lu, Z.; Danskin, W.R. InSAR analysis of natural recharge to define structure of a ground-water basin, San Bernardino, California. Geophys. Res. Lett. 2001, 28, 2661–2664. [Google Scholar] [CrossRef] [Green Version]
- Alatza, S.; Papoutsis, I.; Paradissis, D.; Kontoes, C.; Papadopoulos, G.A. Multi-Temporal InSAR Analysis for Monitoring Ground Deformation in Amorgos Island, Greece. Sensors 2020, 20, 338. [Google Scholar] [CrossRef] [Green Version]
- Triantafyllou, A.I.; Vergos, G.S.; Tziavos, I.N. Contribution of Sentinel-1 Dinsar to the Determination of Vertical Deformation and Height System Monitoring. In Proceedings of the 4th Joint International Symposium on Deformation Monitoring (JISDM), Athens, Greece, 15–17 May 2019. [Google Scholar]
- Papoutsis, I.; Kontoes, C.; Paradissis, D. Multi-Stack Persistent Scatterer Interferometry Analysis in Wider Athens, Greece. Remote Sens. 2017, 9, 276. [Google Scholar] [CrossRef] [Green Version]
- Foumelis, M.; Papageorgiou, E.; Stamatopoulos, C.A. Episodic ground deformation signals in Thessaly Plain (Greece) revealed by data mining of SAR interferometry time series. Int. J. Remote Sens. 2016, 37, 3696–3711. [Google Scholar] [CrossRef]
- Mouratidis, A.; Briole, P.; Ilieva, M.; Astaras, T.; Rolandone, F.; Baccouche, M. Subsidence and deformation phenomena in the vicinity of Thessaloniki (N. Greece) monitored by Envisat/ASAR interferometry. In Proceedings of the Fringe 2009 Workshop: “Advances in the Science and Applications of SAR Interferometry”, Frascati, Italy, 30 November–4 December 2009. [Google Scholar]
- Raucoules, D.; Parcharidis, I.; Feurer, D.; Novalli, F.; Ferretti, A.; Carnec, C.; Lagios, E.; Sakkas, V.; Le Mouélic, S.; Cooksley, G.; et al. Ground deformation detection of the greater area of Thessaloniki (Northern Greece) using radar interferometry techniques. Nat. Hazards Earth Syst. Sci. 2008, 8, 779–788. [Google Scholar] [CrossRef]
- Svigkas, N.; Papoutsis, I.; Loupasakis, C.; Kontoes, C.; Kiratzi, A. Geo-hazard Monitoring in Northern Greece Using InSAR techniques: The case Study of Thessaloniki. In Proceedings of Fringe 2015: Advances in the Science and Applications of SAR Interferometry and Sentinel-1 InSAR Workshop; European Space Agency: Paris, France, 2015. [Google Scholar]
- Raspini, F.; Loupasakis, C.; Rozos, D.; Moretti, S. Advanced interpretation of land subsidence by validating multi-interferometric SAR data: The case study of the Anthemountas basin (Northern Greece). Nat. Hazards Earth Syst. Sci. 2013, 13, 2425–2440. [Google Scholar] [CrossRef] [Green Version]
- Raspini, F.; Loupasakis, C.; Rozos, D.; Adam, N.; Moretti, S. Ground subsidence phenomena in the Delta municipality region (Northern Greece): Geotechnical modeling and validation with Persistent Scatterer Interferometry. Int. J. Appl. Earth Obs. Geoinf. 2014, 28, 78–89. [Google Scholar] [CrossRef] [Green Version]
- Svigkas, N.; Papoutsis, I.; Loupasakis, C.; Tsangaratos, P.; Kiratzi, A.; Kontoes, C.H. Land subsidence rebound detected via multi-temporal InSAR and ground truth data in Kalochori and Sindos regions, Northern Greece. Eng. Geol. 2016, 209, 175–186. [Google Scholar] [CrossRef]
- Svigkas, N.; Papoutsis, I.; Loupasakis, C.; Tsangaratos, P.; Kiratzi, A.; Kontoes, C.H. InSAR time-series monitoring of ground displacement trends in an industrial area (Oreokastro—Thessaloniki, Greece): Detection of natural surface rebound and new tectonic insights. Environ. Earth Sci. 2017, 76. [Google Scholar] [CrossRef]
- Svigkas, N.; Papoutsis, I.; Loupasakis, C.; Tsangaratos, P.; Kiratzi, A.; Kontoes, C.H. Radar Space Measurements of the Deforming Trends at Northern Greece Resulting from Underground Water Activity. In Advances in Remote Sensing and Geo Informatics Applications; Springer International Publishing: Cham, Switzerland, 2019; pp. 309–313. [Google Scholar]
- Svigkas, N.; Loupasakis, C.; Tsangaratos, P.; Papoutsis, I.; Kiratzi, A.; Kontoes, C.H. A deformation study of Anthemountas graben (northern Greece) based on in situ data and new InSAR results. Arab. J. Geosci. 2020, 13, 1–13. [Google Scholar] [CrossRef]
- Galloway, D.L.; Hudnut, K.W.; Ingebritsen, S.E.; Phillips, S.P.; Peltzer, G.; Rogez, F.; Rosen, P.A. Detection of aquifer system compaction and land subsidence using interferometric synthetic aperture radar, Antelope Valley, Mojave Desert, California. Water Resour. Res. 1998, 34, 2573–2585. [Google Scholar] [CrossRef]
- Papoutsis. InSAR Greece: A national ground motion service, based on big Copernicus Sentinel-1 data. Remote Sens. 2020. under review. [Google Scholar]
- Fattahi, H.; Agram, P.; Simons, M. A Network-Based Enhanced Spectral Diversity Approach for TOPS Time-Series Analysis. IEEE Trans. Geosci. Remote Sens. 2016, 55, 777–786. [Google Scholar] [CrossRef] [Green Version]
- Hooper, A.; Zebker, H.; Segall, P.; Kampes, B. A new method for measuring deformation on volcanoes and other natural terrains using InSAR persistent scatterers. Geophys. Res. Lett. 2004, 31, L23611. [Google Scholar] [CrossRef]
- Hooper, A.; Segall, P.; Zebker, H. Persistent scatterer interferometric synthetic aperture radar for crustal deformation analysis, with application to Volcán Alcedo, Galápagos. J. Geophys. Res. Space Phys. 2007, 112, B07407. [Google Scholar] [CrossRef] [Green Version]
- Farr, T.G.; Kobrick, M. Shuttle radar topography mission produces a wealth of data. Eos Trans. Am. Geophys. Union 2000, 81, 583–585. [Google Scholar] [CrossRef]
- Bekaert, D.; Walters, R.; Wright, T.J.; Hooper, A.; Parker, D.J. Statistical comparison of InSAR tropospheric correction techniques. Remote Sens. Environ. 2015, 170, 40–47. [Google Scholar] [CrossRef] [Green Version]
- Hatzinakos, I.; Rozos, D.; Apostolidis, E. Engineering geological mapping and related geotechnical problems in the wider industrial area of Thessaloniki, Greece. In International Congress International Association of Engineering Geology; Price, D., Ed.; A. A. Balkema: Rotterdam, The Netherlands, 1990; pp. 127–134. [Google Scholar]
- Rozos, D.; Apostolidis, E.; Christaras, B. Engineering-geological map of Thessaloniki wider area. Bull. Eng. Geol. Environ. 2004, 63, 103–108. [Google Scholar]
- Loupasakis, C.; Rozos, D. Land subsidence induced by the overexploitation of the aquifers in Kalochori village—New approach by means of the computational geotechnical engineering. Bull. Geol. Soc. Greece 2010, 43, 1219–1229. [Google Scholar] [CrossRef] [Green Version]
- IGME Institute of Geological and Mineralogical Exploration. Geological Map of Greece, Scale 1:50,000; Thessaloniki Sheets; IGME: Athens, Greece, 1978. [Google Scholar]
- Andronopoulos, V.; Rozos, D.; Hadzinakos, J. Geotechnical Study of Ground Settlement in the Kalochori Area, Thessaloniki District; Unpublished Report; IGME: Athens, Greece, 1990; p. 45. [Google Scholar]
- Rozos, D.; Hatzinakos, I. Geological conditions and geomechanical behaviour of the neogene sediments in the area west of Thessaloniki (Greece). In Geotechnical Engineering of Hard Soils-Soft Rocks; A.A. Balkema: Rotterdam, The Netherlands, 1993; pp. 269–274. [Google Scholar]
- Stiros, S. Subsidence of the Thessaloniki (northern Greece) coastal plain, 1960–1999. Eng. Geol. 2001, 61, 243–256. [Google Scholar] [CrossRef]
- Loupasakis, C.; Rozos, D. Land subsidence induced by water pumping in Kalochori village (North Greece) —Simulation of the phenomenon by means of the finite element method. Q. J. Eng. Geol. Hydrogeol. 2009, 42, 369–382. [Google Scholar] [CrossRef]
- Ganas, A.; Chousianitis, K.; Argyrakis, P.; Tsimi, C.; Papanikolaou, M.; Papathanassiou, G.; Exarchos, K. Monitoring of Surface Displacements in the Kalochori Area (Thessaloniki, Greece) Using a Local Gnss Network. Bull. Geol. Soc. Greece 2017, 50, 1553–1562. [Google Scholar] [CrossRef] [Green Version]
- Zervopoulou, A. Neotectonic Faults in the Broader Area of Thessaloniki, in Relation to the Foundation Soils. Ph.D. Thesis, Aristotle University of Thessaloniki, Thessaloniki, Greece, 2010. [Google Scholar]
- Papazachos, C.; Soupios, P.; Savvaidis, A.; Roumelioti, Z. Identification of small-scale active faults near metropolitan areas: An example from the Asvestochori fault near Thessaloniki. In Proceedings of the XXXII ESC General Assembly 2000, Lisbon, Portugal, 10–15 September 2000; pp. 221–225. [Google Scholar]
- Paradisopoulou, P.M.; Karakostas, V.G.; Papadimitriou, E.E.; Tranos, M.D.; Papazachos, C.B.; Karakaisis, G.F. Microearthquake study of the broader Thessaloniki area (Northern Greece). Ann. Geophys. 2006, 49, 1081–1093. [Google Scholar]
- Garlaouni, C.; Papadimitriou, E.; Karakostas, V.; Kilias, A.; Lasocki, S. Fault population recognition through microsismicity in Migdonia region (northern Greece). Boll. Geofis. Teor. Appl. 2015, 56, 367–382. [Google Scholar]
- European Center on Prevention and Forecasting of Earthquakes (ECPFE). Earthquake Planning and Protection Organization (EPPO) & Tectonic Committee of the Geological Society of Greece 1996 Neotectonic Map of Greece, Thessaloniki Sheet, Scale: 1:100000; EPPO & ECPFE: Athens, Greece, 1996. [Google Scholar]
- Ganas, A.; Oikonomou, I.A.; Tsimi, C. NOAfaults: A digital database for active faults in Greece. Bull. Geol. Soc. Greece 2017, 47, 518. [Google Scholar] [CrossRef] [Green Version]
- Fikos, I.; Ziankas, G.; Rizopoulou, A.; Famellos, S. Water balance estimation in Anthemountas river basin and correlation with underground water level. Glob. NEST J. 2005, 7, 354–359. [Google Scholar]
- ΖΕΡΒOΠOΥΛOΥ, A.; ΠAΥΛΙΔHΣ, Σ. Morphotectonic Study of the Broader Area of Thessaloniki for the Cartography of Neotectonic Faults. Bull. Geol. Soc. Greece 2005, 38, 30–41. [Google Scholar] [CrossRef]
- Rozos, D.; Hatzinakos, I.; Apostolidis, E. Engineering Geological Map of Thessaloniki Wider Area; Scale 1 25,000; Institute of Geological and Mineralogical Exploration I.G.M.E.: Athens, Greece, 1998. [Google Scholar]
- Thanasoulas, K. Geophysical Study of Anthemountas Area; Technical Report Institute of Geological and Mineralogical Exploration IGME: Athens, Greece, 1983. (In Greek) [Google Scholar]
- Anastasiadis, A.; Raptakis, D.; Pitilakis, K. Thessaloniki’s Detailed Microzoning: Subsurface Structure as Basis for Site Response Analysis. Pure Appl. Geophys. PAGEOPH 2001, 158, 2597–2633. [Google Scholar] [CrossRef]
- Nagoulis, A.; Loupasakis, C. Hydrogeological conditions of the plain area of the Anthemounta basin (Macedonia, Greece). Bull. Geol. Soc. Greece 2001, 34, 1859–1868. [Google Scholar]
- IGME Institute of Geological and Mineralogical Exploration. Geological Map Sheets, Scale 1:50,000; Epanomi (1969), Thessaloniki (1978), Thermi (1978) and Vasilika (1978); IGME: Athens, Greece, 1978. [Google Scholar]
- Syridis, G. Lithostromatographical, Biostromatographical and Paleostromatographical Study of Neogene-Quaternary Formation of Chalkidiki Peninsula. Ph.D. Thesis, Aristotle University of Thessaloniki, Thessaloniki, Greece, 1990. [Google Scholar]
- IGME Institute of Geological and Mineralogical Exploration. Geological Map of Greece, Scale 1:50,000; Poliyiros and Vasilika Sheet; IGME: Athens, Greece, 1978. [Google Scholar]
- Latinopoulos, P.; Theodossiou, N.; Xefteris, A.; Mallios, Z.; Papageoriou, A.; Fotopoulou, E. Developing Water Resources Management Plan for Water Supply-Irrigation; Final Research Project; Aristotle University of Thessaloniki: Thessaloniki, Greece, 2003. [Google Scholar]
- Veranis, N.; Xatzikirkou, A. Hydrogeological Report Central Macedonia. Aquifers of Epanomis-Moudaniwn, Kassandras, Ormilias and Sithonias; Unpublished technical report; IGME: Thessaloniki, Spain, 2010; p. 394. [Google Scholar]
- Siarkos, I. Developing a Methodological Framework Using Mathematical Simulation Models in Order to Investigate the Operation of Coastal Aquifer Systems: Application in the Aquifer of N. Moudania. Ph.D. Thesis, Aristotle University of Thessaloniki, Thessaloniki, Greece, 2015. [Google Scholar]
- Xefteris, A. Investigating the Deterioration of Groundwater in “Kalamaria Plain” Emphasizing on Nitrates. Ph.D. Thesis, Civil Engineering Department, Aristotle University of Thessaloniki, Thessaloniki, Greece, 2000. [Google Scholar]
- Gavrihlidou, E. The Long Term Study of the Variability of Hydrological Parameters and their Impacts on Groundwater Reserves at Coastal Aquifers. Master’s Thesis, Geological Department, Aristotle University of Thessaloniki, Thessaloniki, Greece, 2017. [Google Scholar]
- Haghighi, M.H.; Motagh, M. Ground surface response to continuous compaction of aquifer system in Tehran, Iran: Results from a long-term multi-sensor InSAR analysis. Remote Sens. Environ. 2019, 221, 534–550. [Google Scholar] [CrossRef]
- Galloway, D.L.; Burbey, T.J. Review: Regional land subsidence accompanying groundwater extraction. Hydrogeol. J. 2011, 19, 1459–1486. [Google Scholar] [CrossRef]
- Hoffmann, J.; Zebker, H.A.; Galloway, D.L.; Amelung, F. Seasonal subsidence and rebound in Las Vegas Valley, Nevada, observed by Synthetic Aperture Radar Interferometry. Water Resour. Res. 2001, 37, 1551–1566. [Google Scholar] [CrossRef]
- Helm, D.C. One-dimensional simulation of aquifer system compaction near Pixley, California: 1. Constant parameters. Water Resour. Res. 1975, 11, 465–478. [Google Scholar] [CrossRef]
- Helm, D.C. One-dimensional simulation of aquifer system compaction near Pixley, California: 2. Stress-Dependent Parameters. Water Resour. Res. 1976, 12, 375–391. [Google Scholar] [CrossRef]
- Schmidt, D.A.; Bürgmann, R. Time-dependent land uplift and subsidence in the Santa Clara valley, California, from a large interferometric synthetic aperture radar data set. J. Geophys. Res. Space Phys. 2003, 108, 2416. [Google Scholar] [CrossRef] [Green Version]


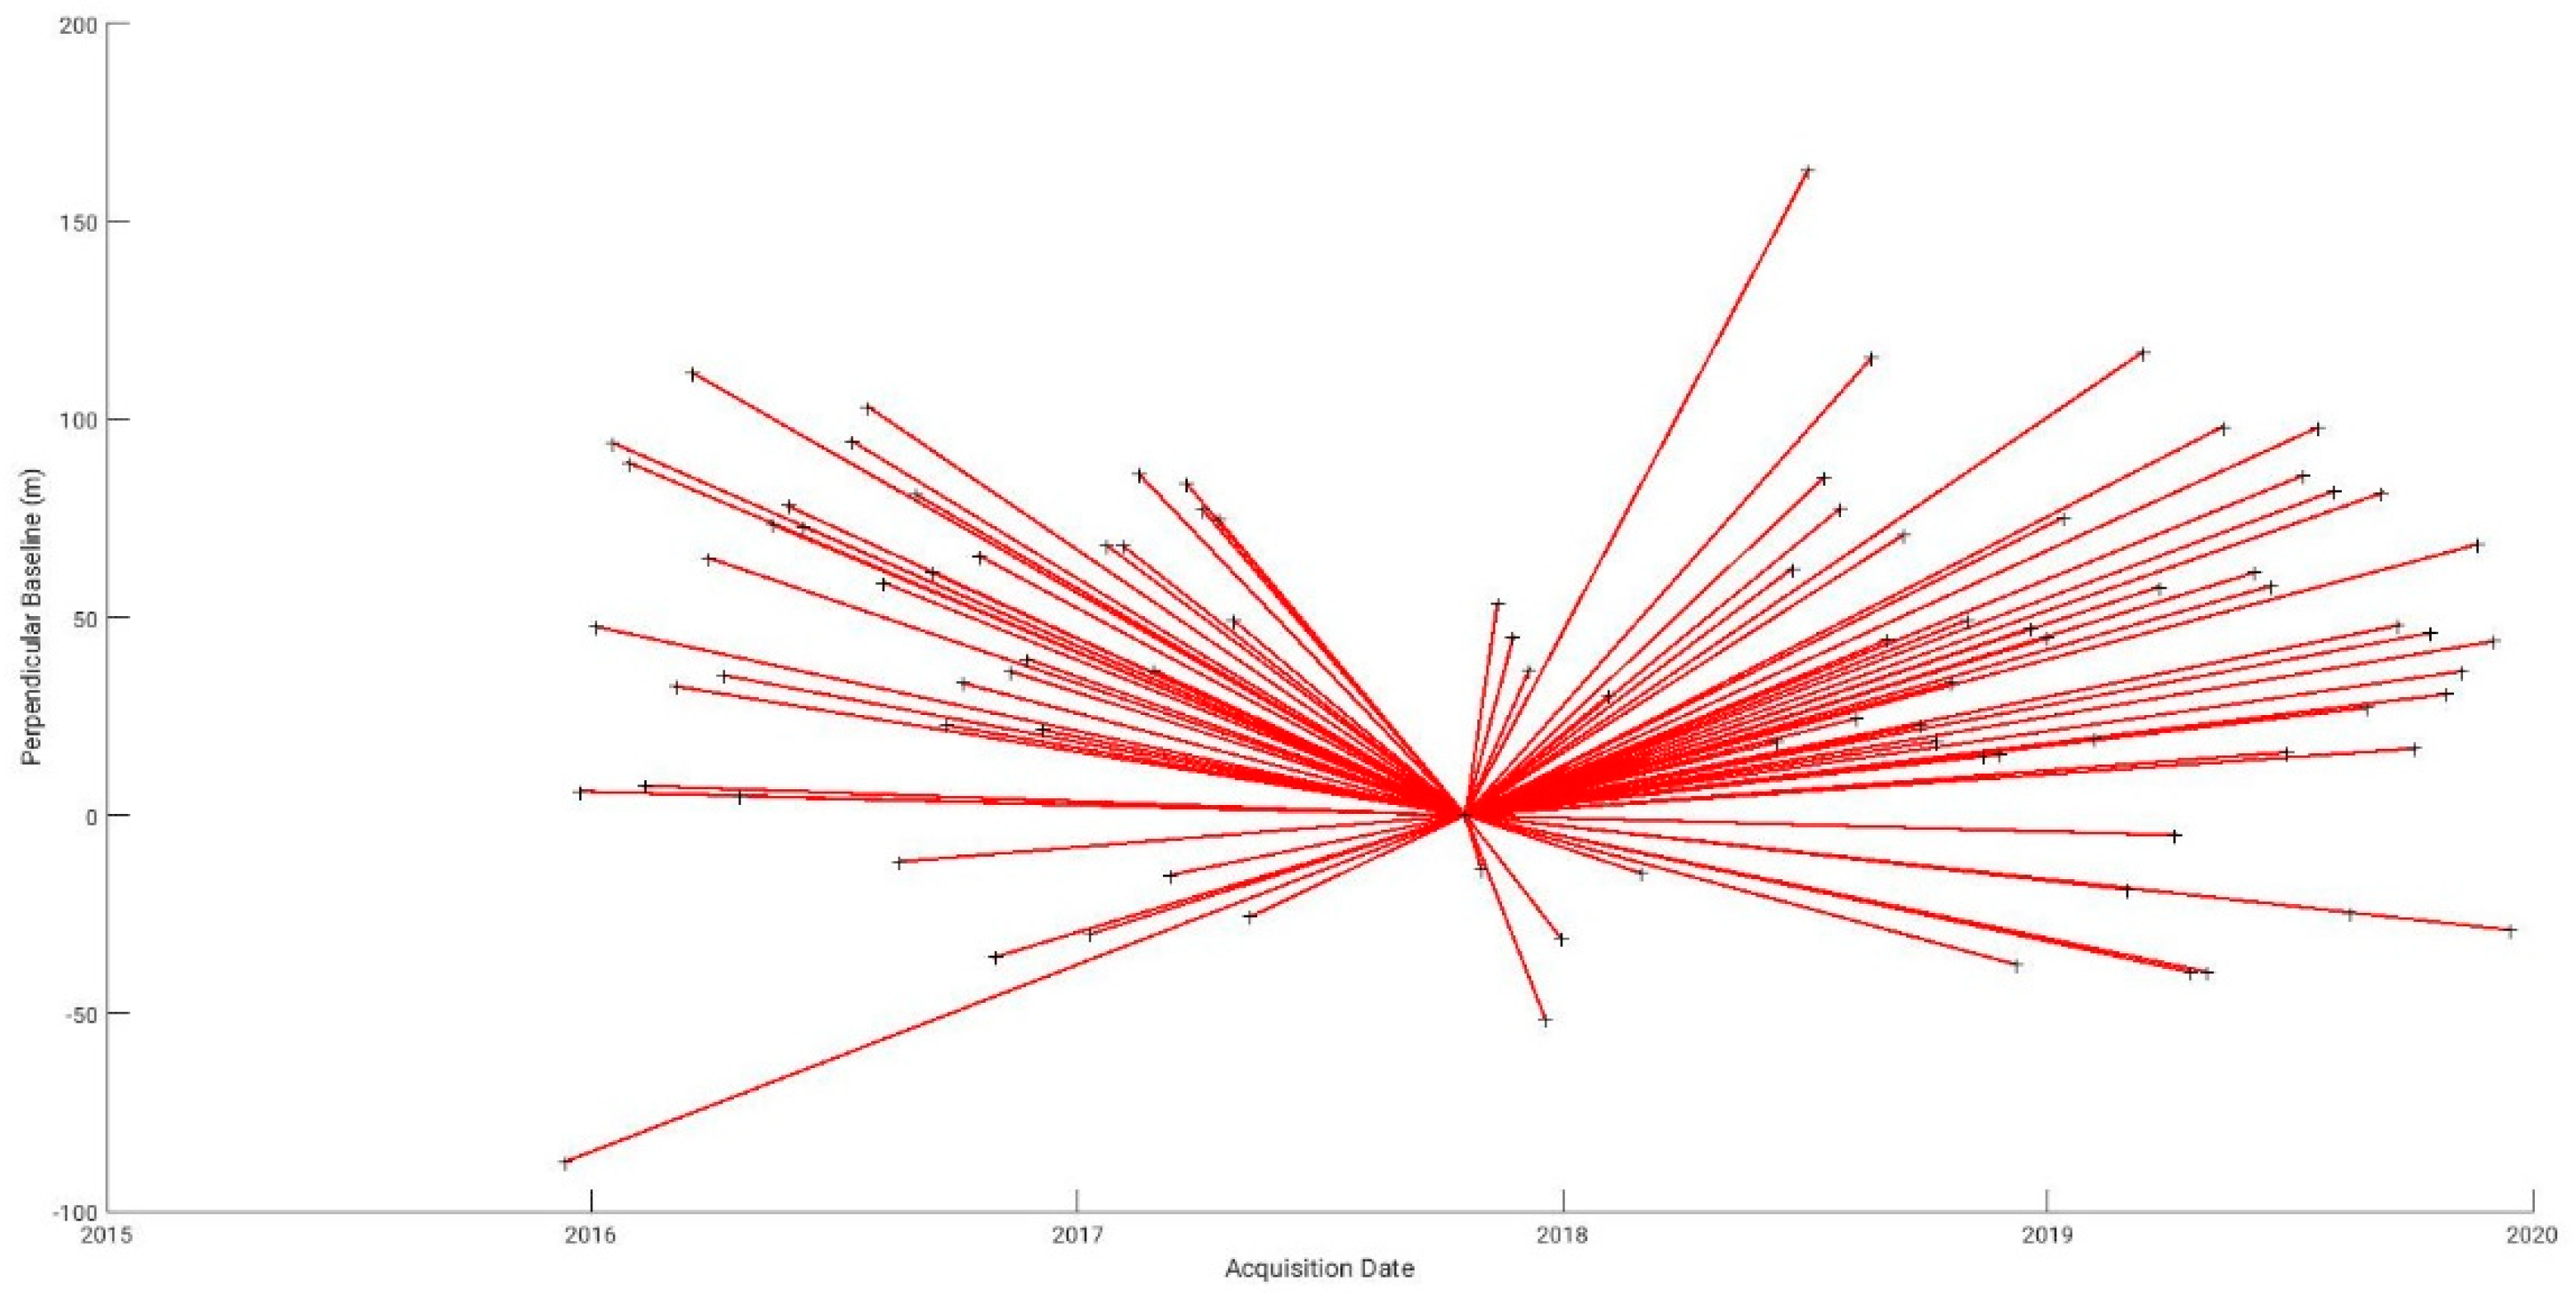
| Date | Normal Baseline | Date | Normal Baseline | Date | Normal Baseline |
|---|---|---|---|---|---|
| 12 December 15 | −88 | 28 February 17 | 37 | 26 November 18 | 15 |
| 24 December 15 | 6 | 12 March 17 | −15 | 08 December 18 | −38 |
| 05 January 16 | 48 | 24 March 17 | 84 | 20 December 18 | 47 |
| 17 January 16 | 94 | 05 April 17 | 77 | 01 January 19 | 45 |
| 29 January 16 | 89 | 17 April 17 | 75 | 13 January 19 | 75 |
| 10 February 16 | 7 | 29 April 17 | 49 | 06 February 19 | 19 |
| 05 March 16 | 33 | 11 May 17 | −26 | 02 March 19 | −19 |
| 17 March 16 | 112 | 20 October17 | 0 | 14 March 19 | 117 |
| 29 March 16 | 65 | 01 November 17 | −14 | 26 March 19 | 58 |
| 10 April 16 | 35 | 13 November 17 | 53 | 07 April 19 | −5 |
| 22 April 16 | 5 | 25 November 17 | 45 | 19 April 19 | −40 |
| 16 May 16 | 73 | 07 December 17 | 37 | 01 May 19 | −40 |
| 28 May 16 | 78 | 19 December 17 | −51 | 13 May 19 | 98 |
| 09-Jun-16 | 73 | 31 December 17 | −31 | 06-Jun-19 | 61 |
| 15-Jul-16 | 95 | 05 February 18 | 30 | 18-Jun-19 | 58 |
| 27-Jul-16 | 103 | 01 March 18 | −15 | 30-Jun-19 | 16 |
| 08-Aug-16 | 59 | 11-Jun-18 | 18 | 12-Jul-19 | 86 |
| 20-Aug-16 | −12 | 23-Jun-18 | 62 | 24-Jul-19 | 98 |
| 01-Sep-16 | 81 | 05-Jul-18 | 163 | 05-Aug-19 | 82 |
| 13-Sep-16 | 61 | 17-Jul-18 | 85 | 17-Aug-19 | −25 |
| 25-Sep-16 | 23 | 29-Jul-18 | 77 | 29-Aug-19 | 27 |
| 07 October16 | 33 | 10-Aug-18 | 24 | 10-Sep-19 | 81 |
| 19 October16 | 66 | 22-Aug-18 | 116 | 22-Sep-19 | 48 |
| 31 October16 | −36 | 03-Sep-18 | 44 | 04 October19 | 17 |
| 12 November 16 | 36 | 15-Sep-18 | 71 | 16 October19 | 46 |
| 24 November 16 | 40 | 27-Sep-18 | 23 | 28 October19 | 31 |
| 06 December 16 | 22 | 09 October18 | 19 | 09 November 19 | 36 |
| 11 January 17 | −30 | 21 October18 | 34 | 21 November 19 | 68 |
| 23 January 17 | 68 | 02 November 18 | 49 | 03 December 19 | 44 |
| 04 February 17 | 68 | 14 November 18 | 15 | 15 December 19 | −29 |
| 16 February 17 | 86 |
© 2020 by the authors. Licensee MDPI, Basel, Switzerland. This article is an open access article distributed under the terms and conditions of the Creative Commons Attribution (CC BY) license (http://creativecommons.org/licenses/by/4.0/).
Share and Cite
Svigkas, N.; Loupasakis, C.; Papoutsis, I.; Kontoes, C.; Alatza, S.; Tzampoglou, P.; Tolomei, C.; Spachos, T. InSAR Campaign Reveals Ongoing Displacement Trends at High Impact Sites of Thessaloniki and Chalkidiki, Greece. Remote Sens. 2020, 12, 2396. https://doi.org/10.3390/rs12152396
Svigkas N, Loupasakis C, Papoutsis I, Kontoes C, Alatza S, Tzampoglou P, Tolomei C, Spachos T. InSAR Campaign Reveals Ongoing Displacement Trends at High Impact Sites of Thessaloniki and Chalkidiki, Greece. Remote Sensing. 2020; 12(15):2396. https://doi.org/10.3390/rs12152396
Chicago/Turabian StyleSvigkas, Nikos, Constantinos Loupasakis, Ioannis Papoutsis, Charalampos (Haris) Kontoes, Stavroula Alatza, Ploutarchos Tzampoglou, Cristiano Tolomei, and Thomas Spachos. 2020. "InSAR Campaign Reveals Ongoing Displacement Trends at High Impact Sites of Thessaloniki and Chalkidiki, Greece" Remote Sensing 12, no. 15: 2396. https://doi.org/10.3390/rs12152396