1. Introduction
Historically, transmission system operators (TSOs) were either providing operational security for their designated control areas independently, or worked bilaterally (multilaterally) based upon separate agreements of cooperation. In such a case, investing in phase-shifting transformers (PSTs) was a fair alternative for developing own transmission branches for a TSO—these costly devices, if located properly, are able to mitigate a significant amount of grid congestions, and protect from the adverse effects of other inter-zonal transactions.
In the near future of CORE Capacity Calculation Region, the role of PSTs will further increase, as they are set to become a part of two large-scale processes crucial to both market efficiency and operational security of the power system. The first process refers to capacity calculation, where the PSTs play a central role in defining the domain for day-ahead market coupling optimisation. The devices will be used to provide more capacity for branches that are constraining inter-zonal power exchange, thus increasing the social welfare of the whole region.
Another role will be played in harmonised coordinated actions listed below:
redispatch, which takes into account an exact grid location of generating units used for remedial actions,
countertrading, which refers to the zonal shift of net position of the whole zone, achieved by multiple units without considering their specific locations.
Both actions can utilise all PSTs offered by the TSOs to resolve congestions within a single process and to minimise the cost of shifting generation units up and down. Hence, both means of utilising PSTs exceed the local character of their operation, which forces us to ask a fundamental question—who should be responsible for the investment in new PSTs? If global exploitation of this kind of resource (financed by a single TSO) is to become the norm, a decrease in incentive for new investments is foreseen. Otherwise, a mechanism based on either choosing the most beneficial party, or proceeding with a joint investment initiative, would be required to provide proper incentivisation.
In this work, we design a methodology for obtaining PST investment shares per TSOs. The reasoning is based on a concept of cost-benefit analysis, but reaches further than a typical CBA, as the subject of comparison is no longer the sum of costs and instead provides a decomposition of expenses into multiple parties. Among the novelties introduced by this paper, one can distinguish (i) the interpretation of the proposal for the cost-sharing method according to the document submitted for consultation by the CORE TSOs; (ii) utilisation of a method for cost-sharing of the optimally coordinated redispatch and countertrading in a different field, namely of determination of investment shares; (iii) an introduction of a share distribution measure, which aims to describe the resulting share factors in terms of deviations from two possible but extreme solutions; that is, a single-party investment and an equal share among all the participants of the coordinated security analysis.
This paper is organised in the following way—
Section 1 is aimed at introducing the research gap through a literature review and provides the regulatory framework for the cost sharing of the coordinated redispatch. The subsequent
Section 2 and
Section 3, provide a theoretical description of the methods for defining investment shares and the obtained results, respectively. Discussion of the results can be found in
Section 4. Lastly,
Section 5 summarises the conclusions and possible next steps in the research field.
1.1. Phase Shifting Transformer as an Investment
Phase Shifting Transformers have been the subject of interest for many authors over the last few decades. On top of hardware engineering aspects, a large share of the interest has been devoted to appropriate modelling PSTs in power systems [
1], including the impact of PSTs on cross-border transmission capacities [
2].
As far as investment decision-making is concerned, several factors important for TSOs are analysed in Reference [
3], where a description of operators’ practices, according to which the profitability of new PSTs is being assessed via cost-benefit analysis (CBA), is provided. While discussing the benefits resulting from introducing phase shifters for power systems operators, the authors distinguish two main areas of impact: (i) the increase of trading volume via enhancing regional capacity calculation processes and (ii) negative influence on the overall cost of remedial actions.
These areas are especially important in the case of the highly interconnected European CORE Capacity Calculation Region (CCR) grid, where power exchange between any two adjacent bidding zones strongly affects the other member states [
4]. In this situation, both optimisation of the market coupling’s domain [
5] and reinforcement of costless remedial actions [
6] increasingly gain importance. In order to address the need for an optimal decision on investment, some authors have shown how the TSOs could locate the PSTs while considering the impact on their own control areas. This can be achieved by applying genetic algorithms and iterative methods [
7], or by applying the recent advances in mixed integer linear programming [
8]. The research into PST placement, which minimises the cost of redispatch, is described in References [
9,
10].
Although the cost of redispatch is a strong indicator for a decision on whether to install such a costly device, let us question how the amount of savings determined in such a CBA study can be put into practice. European TSOs do not operate independently, and the meshed grid of a UCTE area forces the operators to cooperate [
4]. This cooperation is exemplified in common processes aimed at providing the congestion-free operating point of the power system [
11]. Effective coordination of redispatch and countertrading, along with other costless remedial actions used to alleviate the set of congestions in the whole CCR, demands the utilisation of all resources at the same time. Remuneration of redispatch introduces less challenges as, regardless of the reasons for generation shift, the units’ costs are to be covered according to the pre-declared fee, which is based on variable costs in the vast majority of cases. This however is not the case with PSTs—they are considered costless, hence this process misses the opportunity to provide a financial incentive for the investor. In light of this fact, the TSO owning the PST is the sole entity facing costs, but only one of parties to experience any potential benefits.
In other words, the literature known to the authors does not introduce any investment share solutions other than one considered as trivial, that is, entire investment covered by a host TSO. From this perspective the presented work aims at filling the gap with an original proposal. The idea can be seen as an extension of the classical CBA reasoning—if CBA assesses an investment opportunity positively, investment shares are expected to support the decision by providing a fair division of cost across all the beneficiaries.
Thus, we suggest a two-stage approach to support the TSO’s decisions regarding PST investment, the impact of which exceeds their own control area. This two-stage approach consists of (i) typical CBA, where the retained expenses are determined via a different range of measures accessible for the remedial actions optimiser and (ii) determination of zonal (TSO-related) investment shares according to the method for cost-sharing of redispatch and countertrading. The first stage is to be performed using a remedial action optimiser developed for the purpose of power system analysis [
10]. The following subchapter provides an overview of the process that constitutes the latter stage—determination of zonal shares.
1.2. Cost Sharing of Coordinated and Optimised Redispatch
Although to some extent the day-ahead zonal energy market is aimed at considering network constraints, usually the mere execution of market-based transactions cannot be fully implemented without any remedial actions. In order to assess the need for remedial actions, Day-Ahead Congestion Forecast takes place. From these measures, one is able to distinguish both costless (topology switching and regulation of Phase Shifting Transformers) and costly actions (redispatch of generating units and countertrading). At present, with regard to their involvement in solving regional grid congestion—as far as expenses for remedial actions are concerned—the TSOs operate in accordance with bilateral or multilateral agreements.
The limitations of such an approach include sub-optimal results (when compared to global optimisation of remedial actions), counter-productivity (relieving one overload can increase congestions in other locations), multiple iterations (each amendment needs to be updated on the common model for the grid in order to keep the other TSOs informed on the steps taken), and an abundance of agreements and cost sharing rules implemented at the same time.
These drawbacks have been acknowledged by European Transmission System Operators. According to network codes and guidelines, System Operation Guideline (SOGL) [
11] and Capacity Calculation and Congestion Management (CACM) [
12], the TSOs are responsible for the implementation of a globally coordinated and optimised redispatch (SOGL art. 76, CACM art. 35), along with the cost sharing method (CACM art. 74).
According to the draft proposal of cost-sharing methodology [
6] issued by the operators of CCR CORE, the goals of the process, among others, is to establish a common process for sharing the cost of redispatch and countertrading by applying a polluter-pays (or causer-pays) principle.
Utilisation of the aforementioned process does not need to be limited to the daily practice of providing safe conditions of the power system. In this study we focus on an alternative application of the cost-sharing rule, which can help determine the contributors of grid-related investments serving multiple control areas.
2. Method for Defining Investment Shares
As mentioned above, the derivation of investment shares is designed as an extension of the methodology for cost-sharing, for many variants are currently being discussed among European TSOs. Thus, in the next subsection we provide a brief introduction to the cost-sharing process and its vocabulary. The derivation of investment shares follows in the subsequent subsection.
2.1. Calculation of Cost Sharing Key
The guidelines on System Operation, and CORE TSOs’ proposal on new methodology [
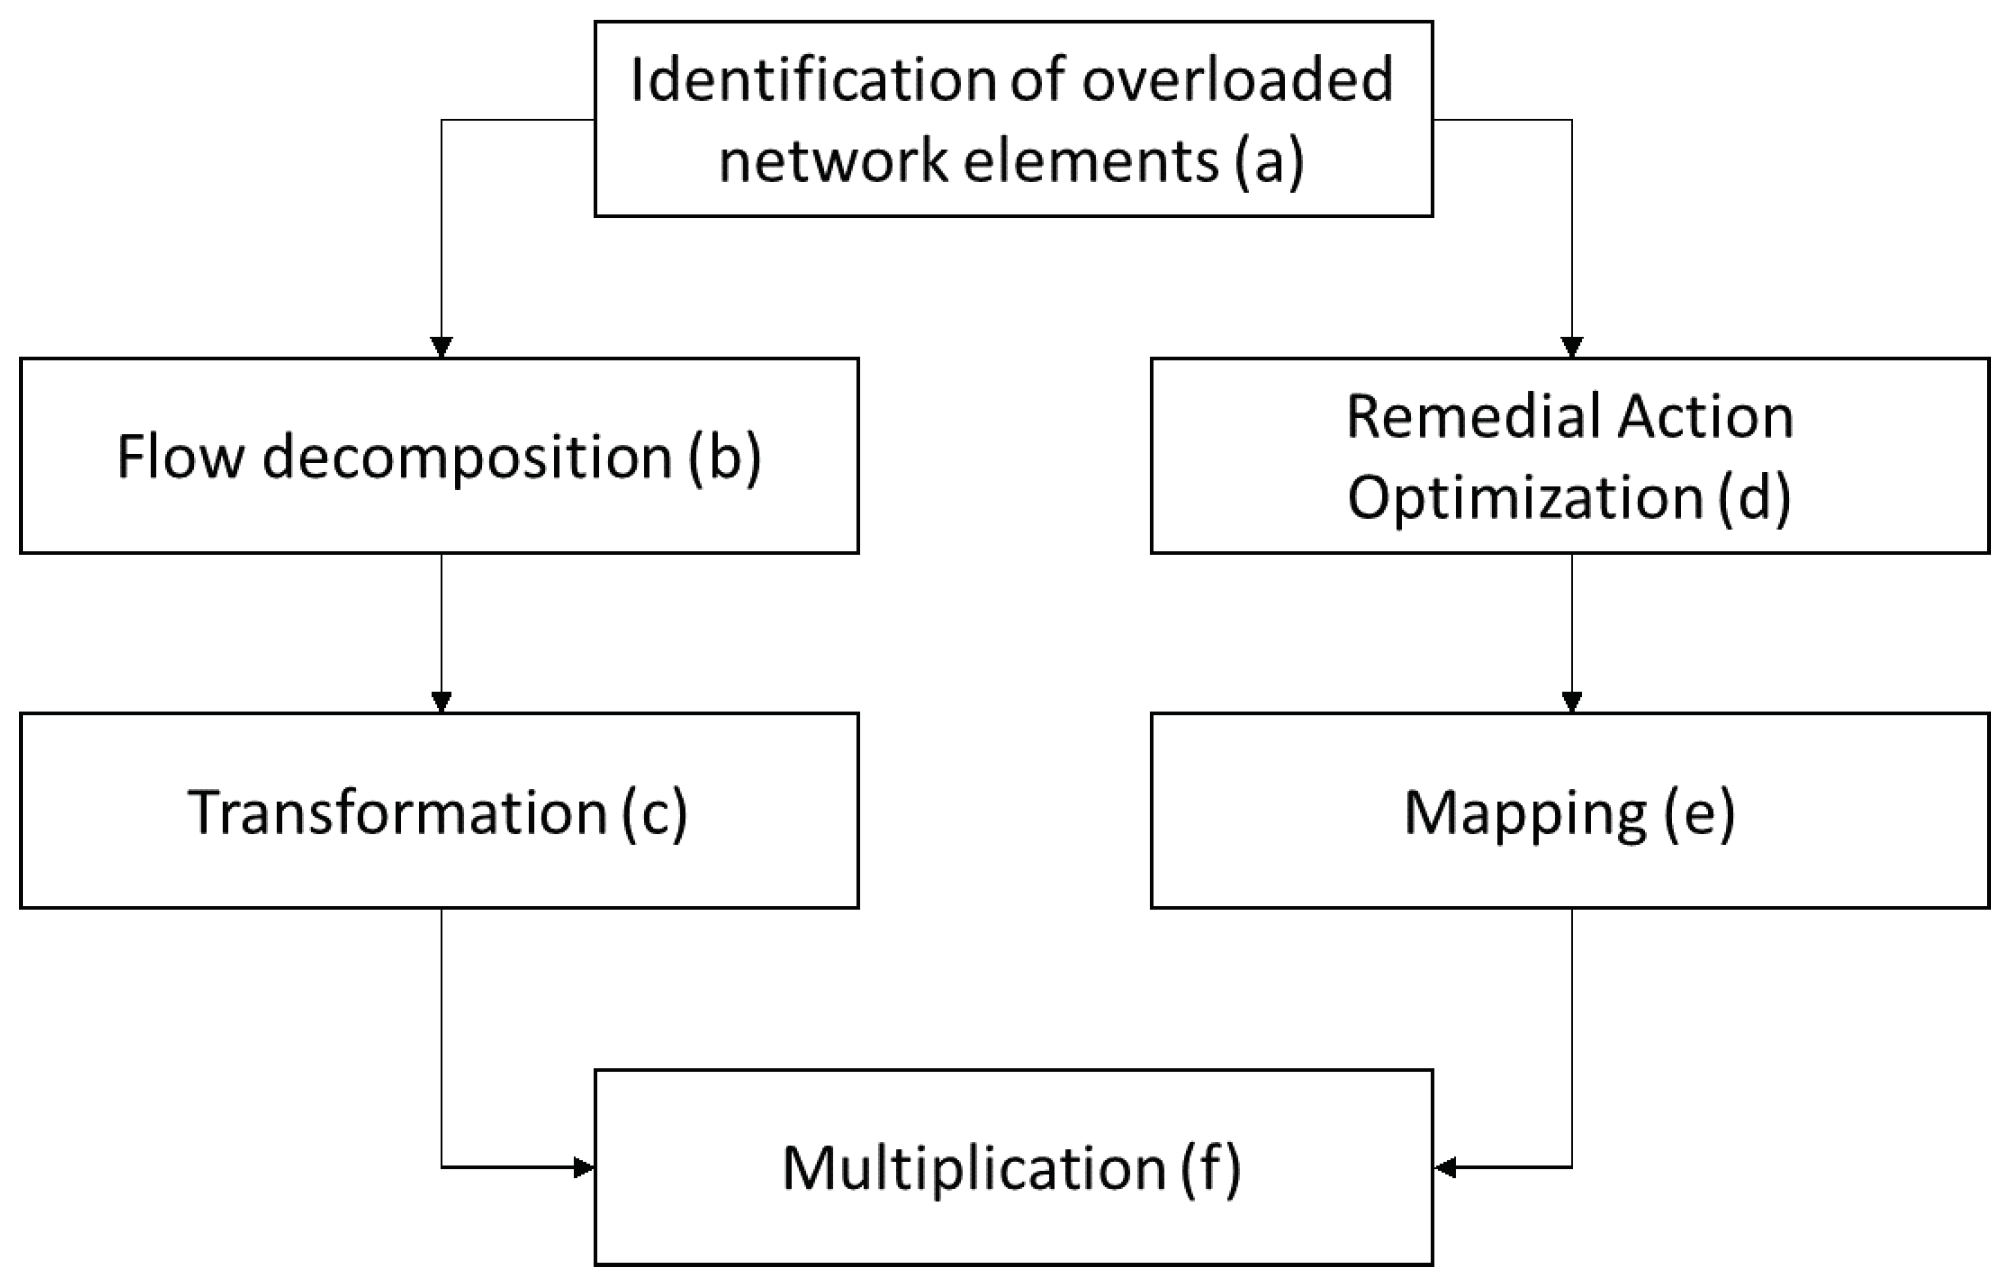
6] provide the overall view of design for the cost sharing process. It consists of at least six distinctive stages (
Figure 1):
- (a)
identification of overloaded network elements—to determine the congested elements that are subject to further remedial actions,
- (b)
flow decomposition—to identify the influence of each zone on every network element under consideration and divided into flow types,
- (c)
transformation—to convert the set of (decomposed) flow components into zonal shares for cost-covering associated with each network element under consideration,
- (d)
remedial Action Optimisation—to select both a set of measures that provide a secure operating point, and assess the overall cost of subsequent actions,
- (e)
mapping—to estimate the aforementioned costs per network element,
- (f)
multiplication—to combine the results of transformation and mapping, reaching zonal shares in overall redispatch and countertrading costs.
As the guidelines provide only high-level description of the stages introduced above, implementation of the process demands taking a set of assumptions. The following subsections introduce the proposal of methodological background on how the stages are to be understood and implemented for the need of this work. It is crucial to underline that the exact implementation of the cost sharing process provided in this chapter, is strictly subordinate to the ultimate goal, which is testing the proposed investment share approach on a large-scale model. The authors emphasise that different assumption on particular stages of cost sharing would affect the final result, nonetheless the general approach to define investment shares would remain unchanged.
2.1.1. Identification of Overloaded Network Elements
In order to assess the security of the system, N-1 contingency analysis is performed. Overloaded network elements are being discovered based on the following procedure:
- (i)
determining the set of cross-border relevant network elements, which consist of all cross border lines and other branches satisfying a sensitivity threshold determined by zone-to-zone PTDFs,
- (ii)
finding contingency states via the analysis of Line Outage Distribution Factors [
13],
- (iii)
computing power flow for all contingency states.
Let us denote a branch in a given contingency state as , where L is a set of all contingency states for all critical network elements under analysis. If power flow exceeds a thermal limit for this branch (), the branch is considered congested (overloaded), and stands for the flow over such a branch: , .
2.1.2. Flow Decomposition
Decomposition of the power flow is computed independently from optimisation of remedial actions. It aims to provide an insight into the responsibility of zones affecting the interconnected infrastructure of a power system. The method is expected to distinguish between five types of flows ([
6] art. 7.1): Loop flows (LF), Internal flows (IN), Import/Export flows (IE), Transit flows (TR) and PST flows (PST).
As a result of this stage, the outcome is expected to express the flow over each congested branch
ℓ, as a sum of component flows of different types and distinctive zones of origin (
z):
Performing a decomposition of the flow is an interesting (and separate) subject of scientific research. Out of several methodologies present in the literature [
14,
15,
16], Power Flow Coloring is selected in accordance to the analysis and conclusions presented by the authors of Reference [
17]. The idea of this approach is as follows:
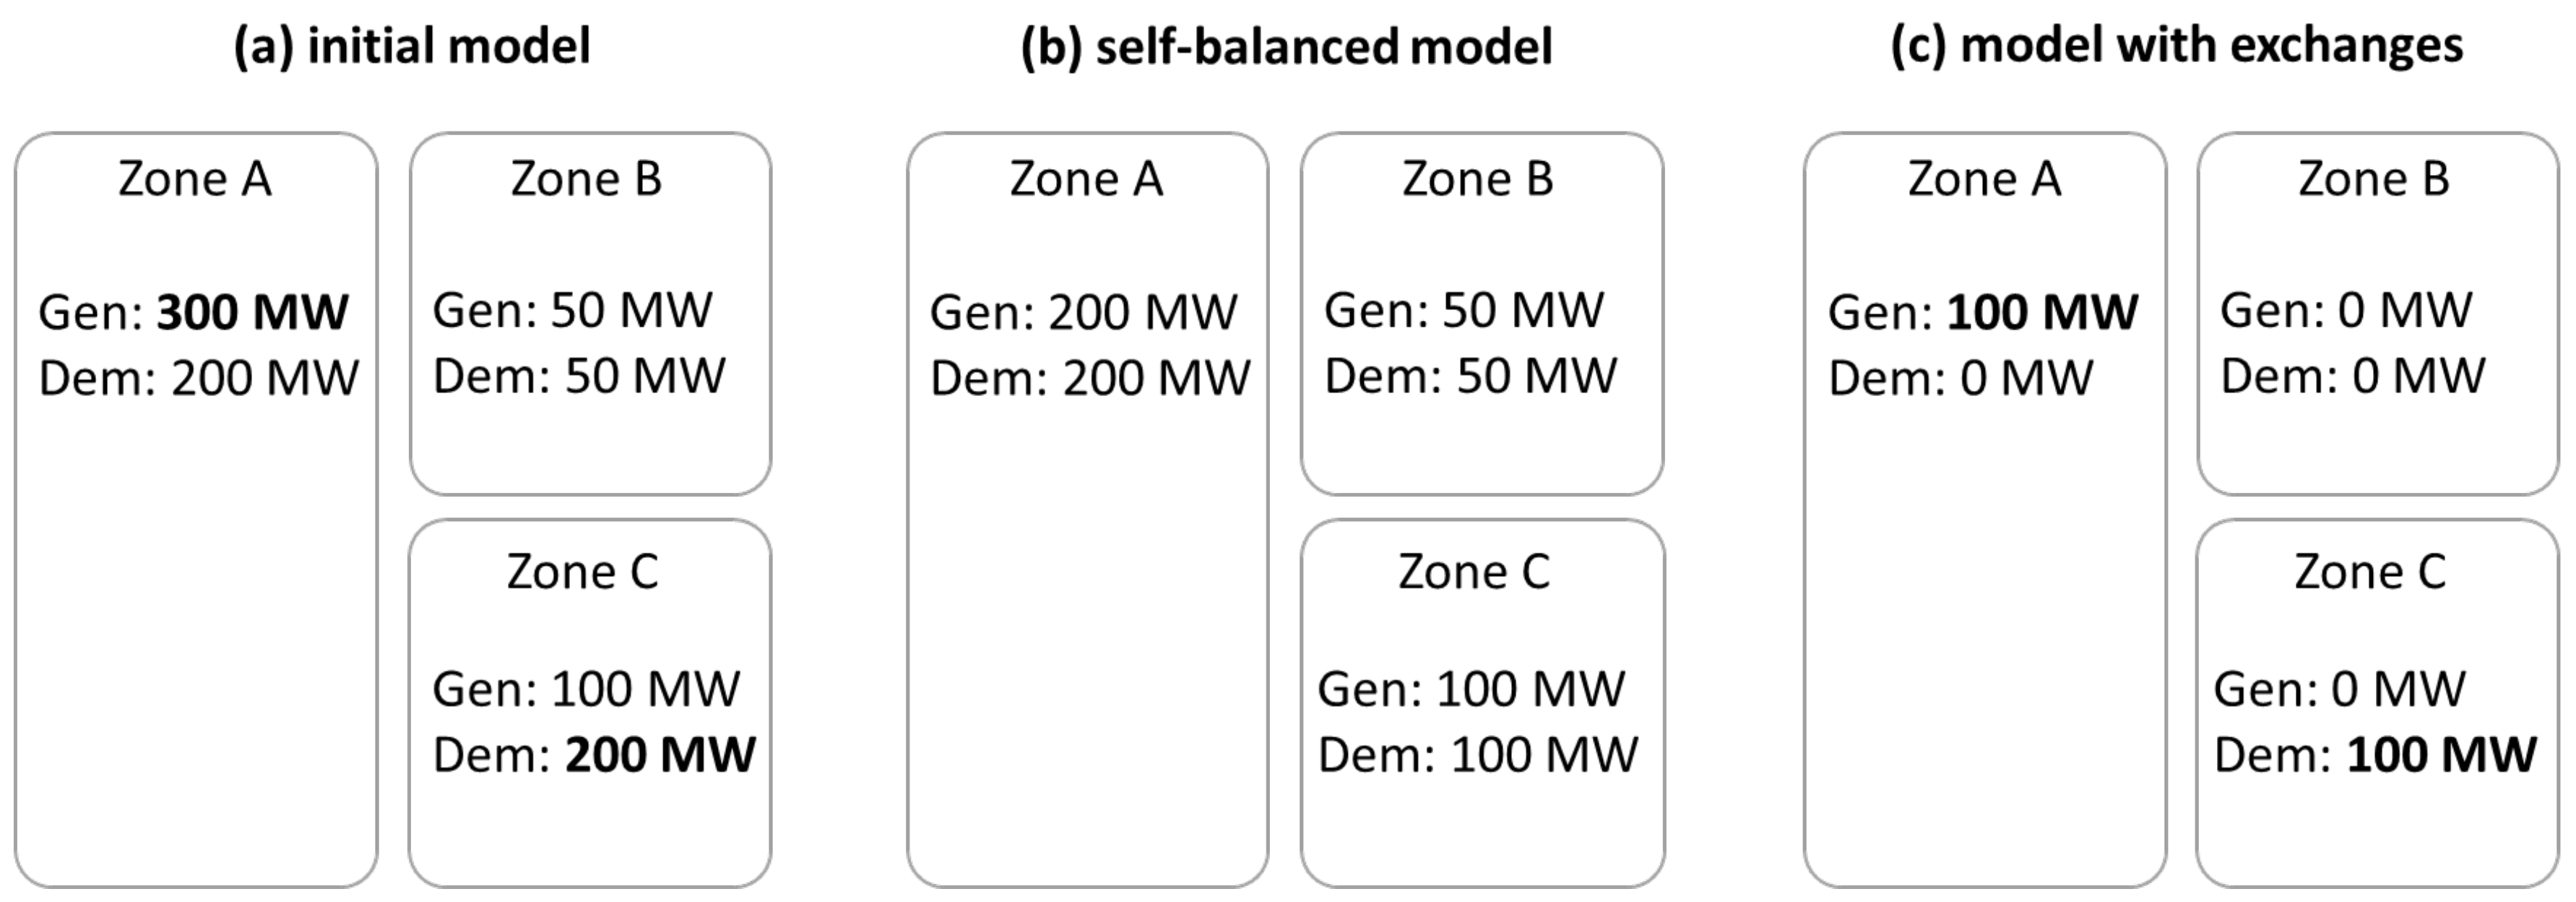
- (i)
Obtain two models of the power system by dividing each operating point of generation and load located in the grid into two components (
Figure 2)—first for internal use of each zone (b) and second, for market exchange with other zones (c). Model (b), called ‘self-balanced’, is characterised by zero net position of each zone, while model (c) (‘model with exchanges’) for each zone, consists either from generation only (for exporting zones) or from pure demand (for importing zones).
- (ii)
Utilise a self-balanced model in order to obtain internal & loop flows produced by each zone.
- (iii)
Use a model with exchanges to determine the distinction between import/export flows and transit flows (along with zonal assignment of causers).
2.1.3. Transformation
Transformation allows for the transition between decomposed flows and fractional zonal shares indicated for each congested network element. This stage is based on a set of heuristic assumptions and consists of the following steps taken for each critical branch—(i) netting (along with application of thresholds), (ii) prioritisation and (iii) calculation of zonal shares.
The goal of netting (i) is to identify the number of megawatts that burden the direction of the interconnection per bidding zone. Netting can be followed by creating sub-types of flows through the application of a threshold, which enables a varying treatment of flow type, below and above a certain value. Next, prioritisation (ii) takes place to determine the order in which the flow types are penalised. Lastly, ordered netted flows that breach the threshold, are subject to the calculation of zonal shares (iii).
For the purpose of this work, we only focused on burdening flows, with no consideration of sub-types (thresholds equal 0%). The order of flow is (from the type most likely to be penalised)—loop flow, transit flow, import/export, internal flow and PST flow. Implementation of these assumptions is as follows; without the loss of generality, it is assumed that the power flow
is a positive number. A netted flow of zone
z and particular type
p (
) can be defined using Heaviside function (
H) and a normalisation factor. Normalisation ensures that the sum of netted flows is equal to original power flow
:
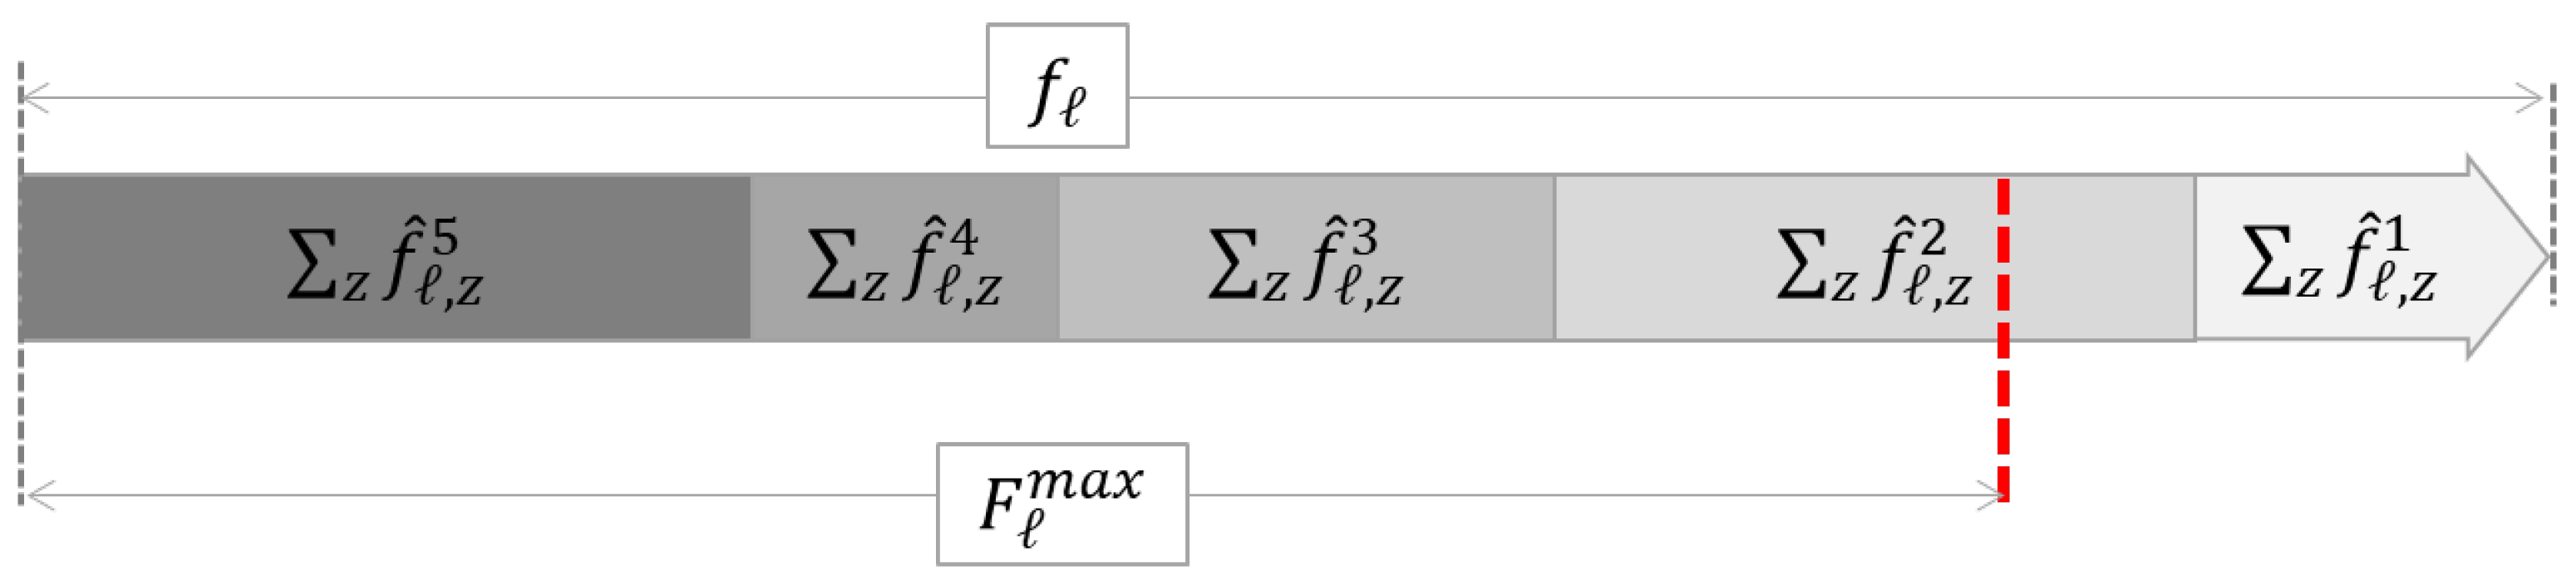
Only a part of the netted flow components contribute directly to overloads. Prioritisation of flow types (assigning each type a number,
, allows to identify these contributing components (
Figure 3) and lets them determine the resulting transformation shares,
:
Equation (
3) defines zonal (fractional) shares by utilising
. The value of
represents the fraction of
that exceeds the threshold set by
. As the the result, the coefficient equals 1, if the flow
is entirely above
limit, it equals 0, when
is completely below the limit, lastly
only if the limit divides the flow category
p into two parts. The algorithm described in
Appendix A (
Table A1) enables a more rigorous procedure aimed at finding values of
and, consequently, determining
.
2.1.4. Remedial Action Optimisation
The introduction of remedial action plays a special role in the cost sharing process, as the amount of the total cost is defined during this stage. The process takes the operation point of a system, thermal limits of all the branches under analysis along with potential range and expenses for costly redispatch and costless PSTs. The Remedial Actions Optimization (RAO) model is formulated as a MILP modification of the DC Optimal Power Flow problem, in which the phase shifts of PST branches are allowed to vary according to integer tap settings. The optimisation model is aimed at relieving congestions among the branches under analysis through a cost-effective manner, using the available tap ranges of PST and costly RAs (redispatch, RES curtailment, ENS), starting from the initial point representing the market solution, and then mapped onto a nodal-resolution grid model. As a result, two key outcomes are obtained;
(flow after RAO for each branch
ℓ) and
C—the sum of costly RAs-related expenditure, associated with a particular time horizon of optimisation and constituting a subject of further zonal split. The detailed formulation of the RAO model used here is given in Reference [
10].
2.1.5. Mapping
The goal of this stage is to determine the costliness for each particular congestion. The question of mapping can be considered as an example of price decomposition where market- & grid-related data influence the estimation of effort taken to alleviate a particular overload. Out of many possible variants of mapping, we chose an implementation based on proportionality. According to this rule, the cost mapped to an element and the amount of overload identified on such a branch are linearly dependent.
2.1.6. Multiplication
This phase aggregates the results of transformation and mapping. Aggregation of cost attributed to a given zone allows defining an ultimate zonal share of global costs
satisfying the following conditions:
2.2. Investment Shares
The proposed cost-benefit analysis of a new investment compares the performance of two states of power system (PSS), before and after investment in a long-term perspective. The long-term cost of remedial actions (in each state) associated with zone
z, is defined as a sum of zonal costs resulting from particular cost sharing horizons
t (
):
In the most general approach the span of a single cost-sharing horizon is not strictly defined, since technical resources and an authentic need of the TSOs may result in associating
t with periods from a quarter of an hour to, for example, one week. The new investment is expected to reduce the cost of operations; hence zonal savings are estimated as a difference
where
b and
a denote system states before and after the investment, respectively. Proportion of
to the global sum of long-term savings is the proposed candidate for investment share of any zone
z:
3. Results
3.1. Input Data
In the H2020 EU-SysFlex project [
18,
19,
20], European network models were designed in order to illustrate different power system stability conditions: minimal inertia, maximal load and minimal reactive power availability. For the purposes of this study, a set of 24 grid scenarios were chosen, in all of which the size of the power system represented Continental Europe. The degree of resolution was developed differently depending on the region—the countries modelled with the highest resolution were Poland, Germany, Czech Republic and Slovakia. Next, the medium detailed resolution power systems were included for Austria, Hungary and Ukraine (this selection of countries/zones does not reflect the structure of any existing CCR and is the consequence of data structures analysed within the EU-SysFlex project). Lastly, an equivalent representation for other European countries connected to the synchronous grid was considered. All in all, the models consist of around 15,000 buses, 17,000 lines and 1200 generators. Across the grid, 15 phase-shifting transformers in 5 locations were identified. Additional assumptions on the cost of redispatchmay be found in
Appendix B.
3.2. Investment Share Outcomes
3.2.1. Congestion Identification
For the purpose of the study only cross-border transmission lines were considered critical network elements (CNE). Each CNE was assessed in multiple N-1 contingency situations that reflect the CNE’s loading in case of possible outages (called CNECs—CNE under contingency). Out of many possible CNECs for a critical branch, only the one with the greatest overload
was considered for the purpose of investment sharing (typically resolving the greatest contingency of a branch that allows to satisfy other constraints associated with the same critical element simultaneously).
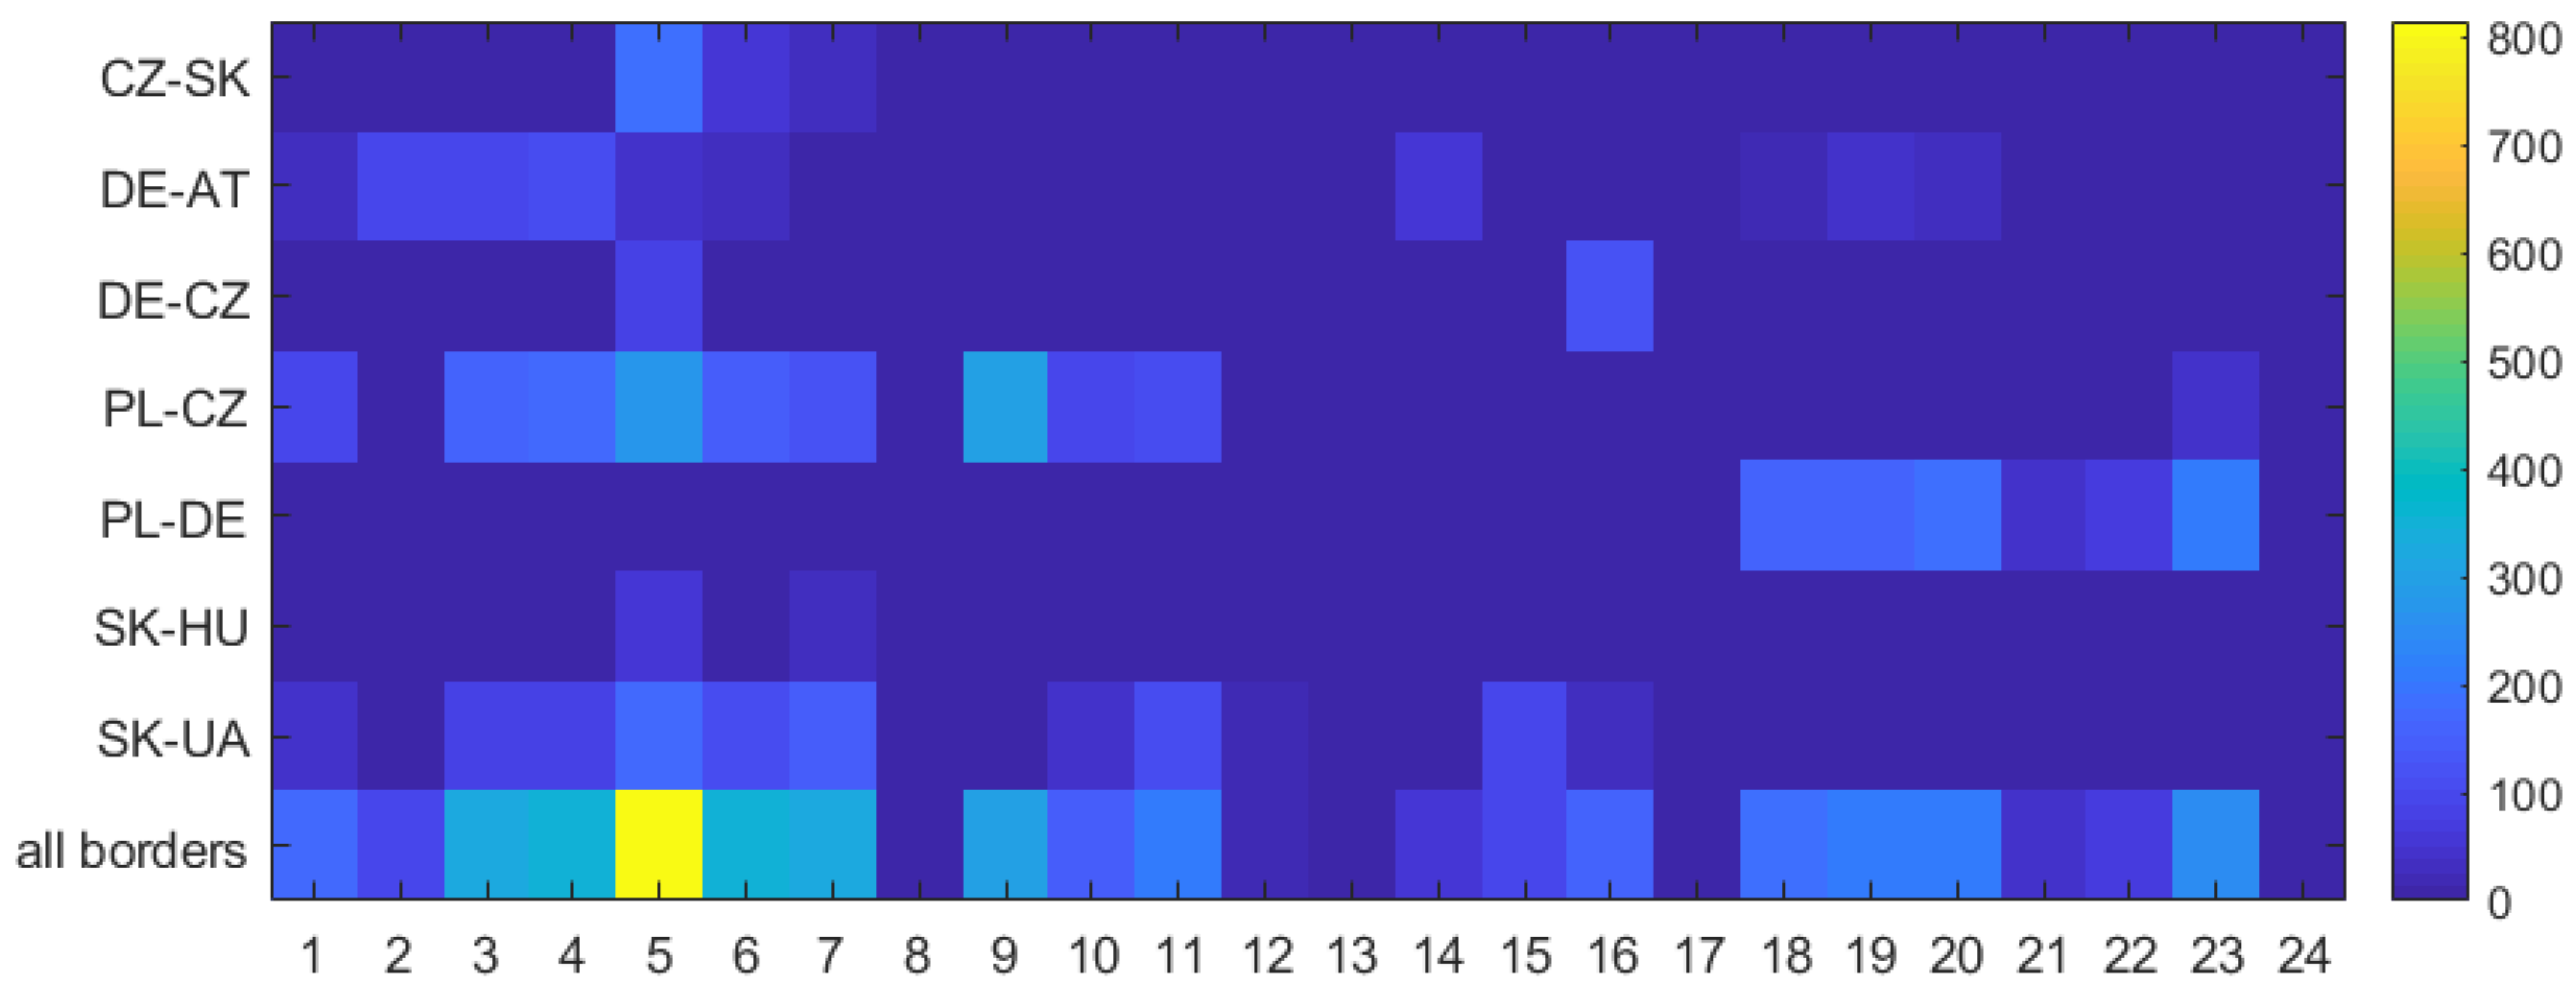
Figure 4 illustrates the sum of CNECs’ overloads for the different borders
B (
). The computations proved the need for remedial actions in the case of 20 different timestamps. For the remaining four hours, no congestion was identified (hours 8, 13, 17 and 24).
The most congested borders are PL-CZ, PL-DE and DE-AT, which together represent the majority of the identified overloads.
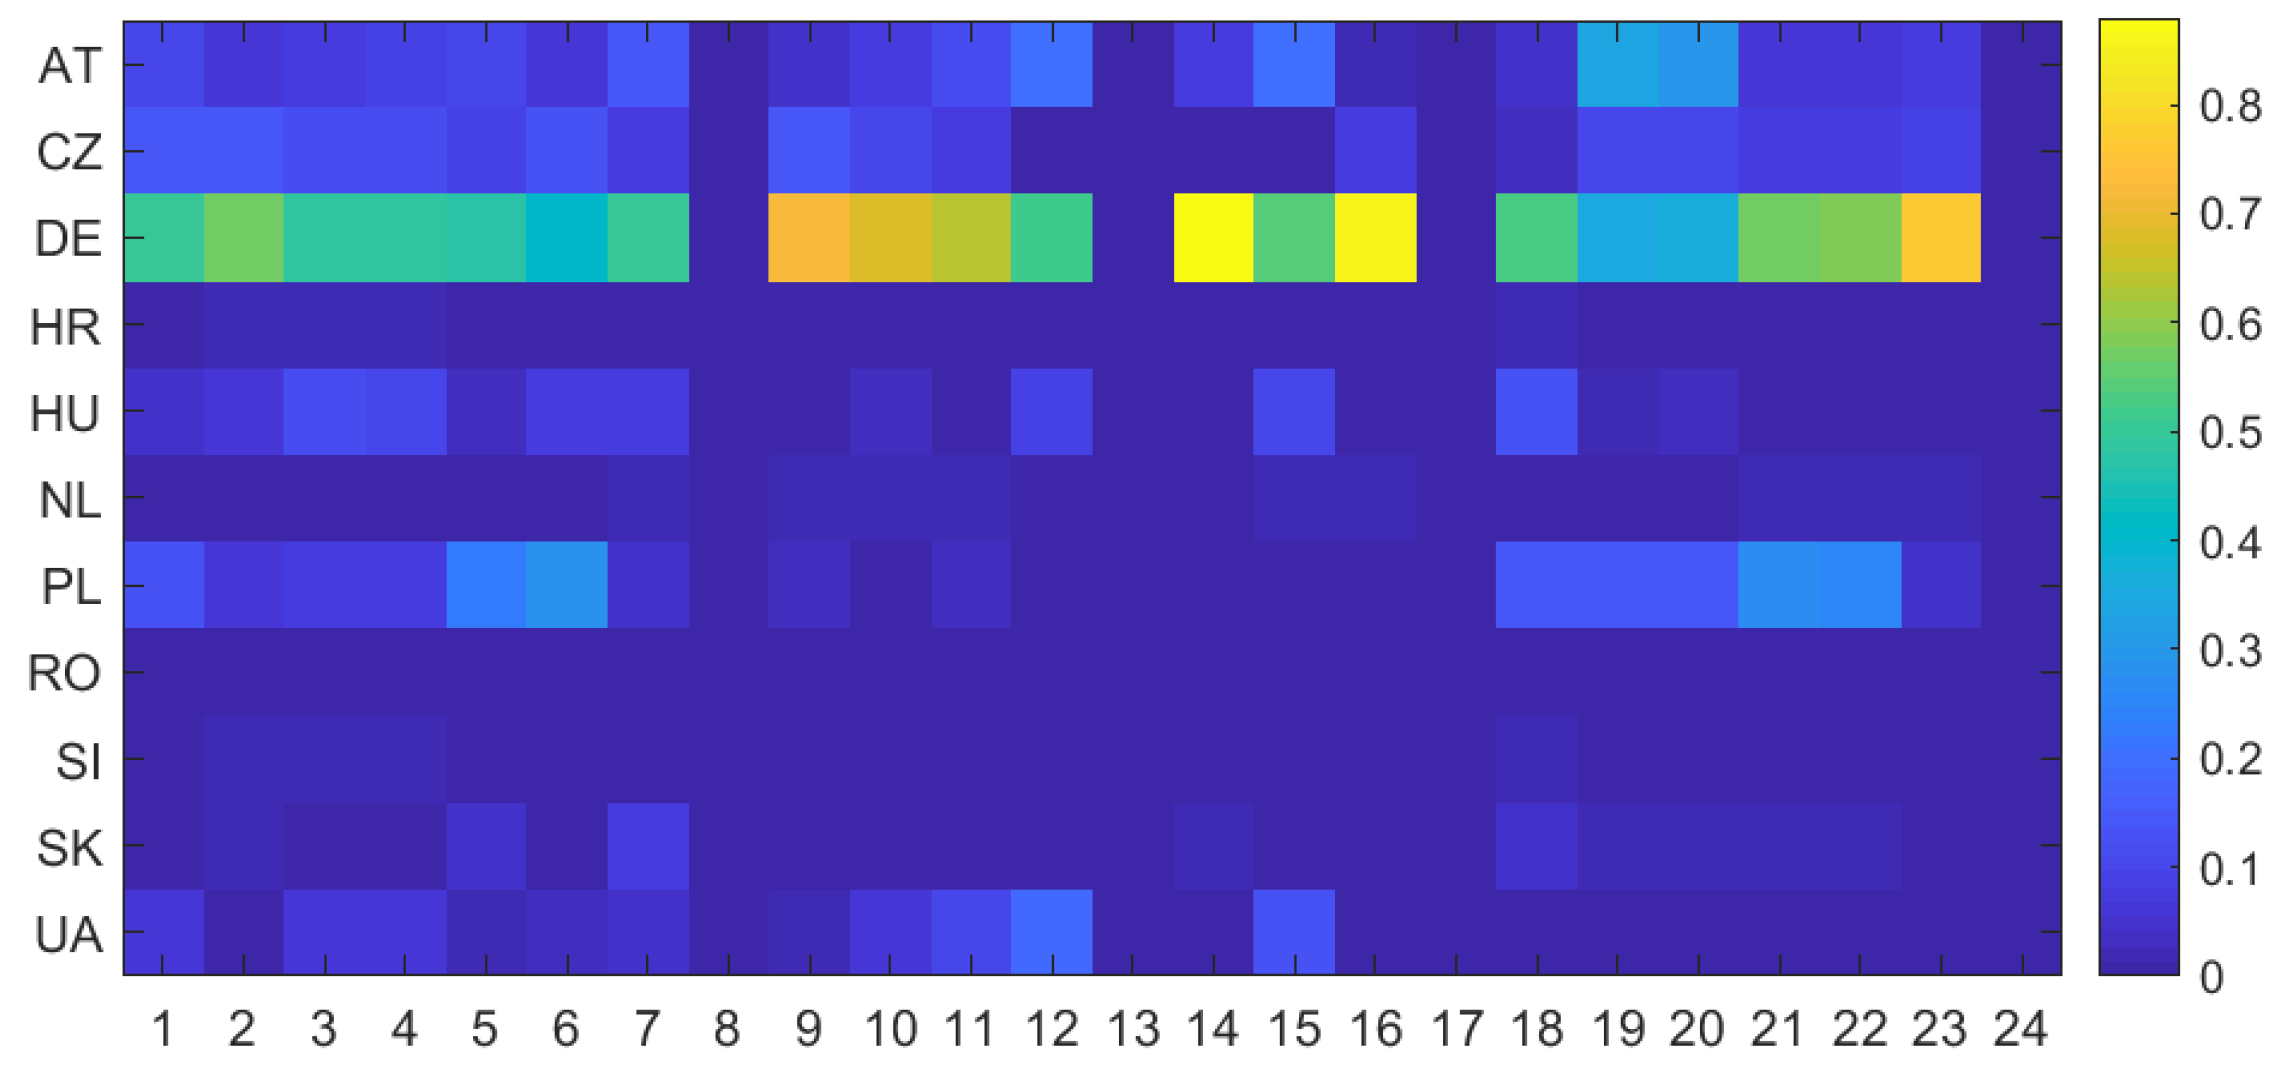
3.2.2. Flow Decomposition and Transformation
Localisation of congestion provides us with our first intuitions on the flow patterns and zones responsible for the identified congestions. However, only load flow decomposition gives full and detailed information on the polluters’ impact. The procedure of decomposition was performed for each contingency state on every border under analysis. Next, transformation took place in order to select flow components above the threshold of the thermal limit. In order to illustrate a typical set of polluters over time, the average zonal fractional share was computed for each zone and timestamp, by combining the outcomes obtained from particular congested network elements.
Figure 5 gives the overview of the congestion causers (according to the reference scenario) and shows a noticeable disproportion in zonal “responsibility” for overloads measured before RAs. For most of the analysed hours, Germany is identified as the main source of congestion. Other significant zones are Poland, Austria, Czech Republic and Hungary.
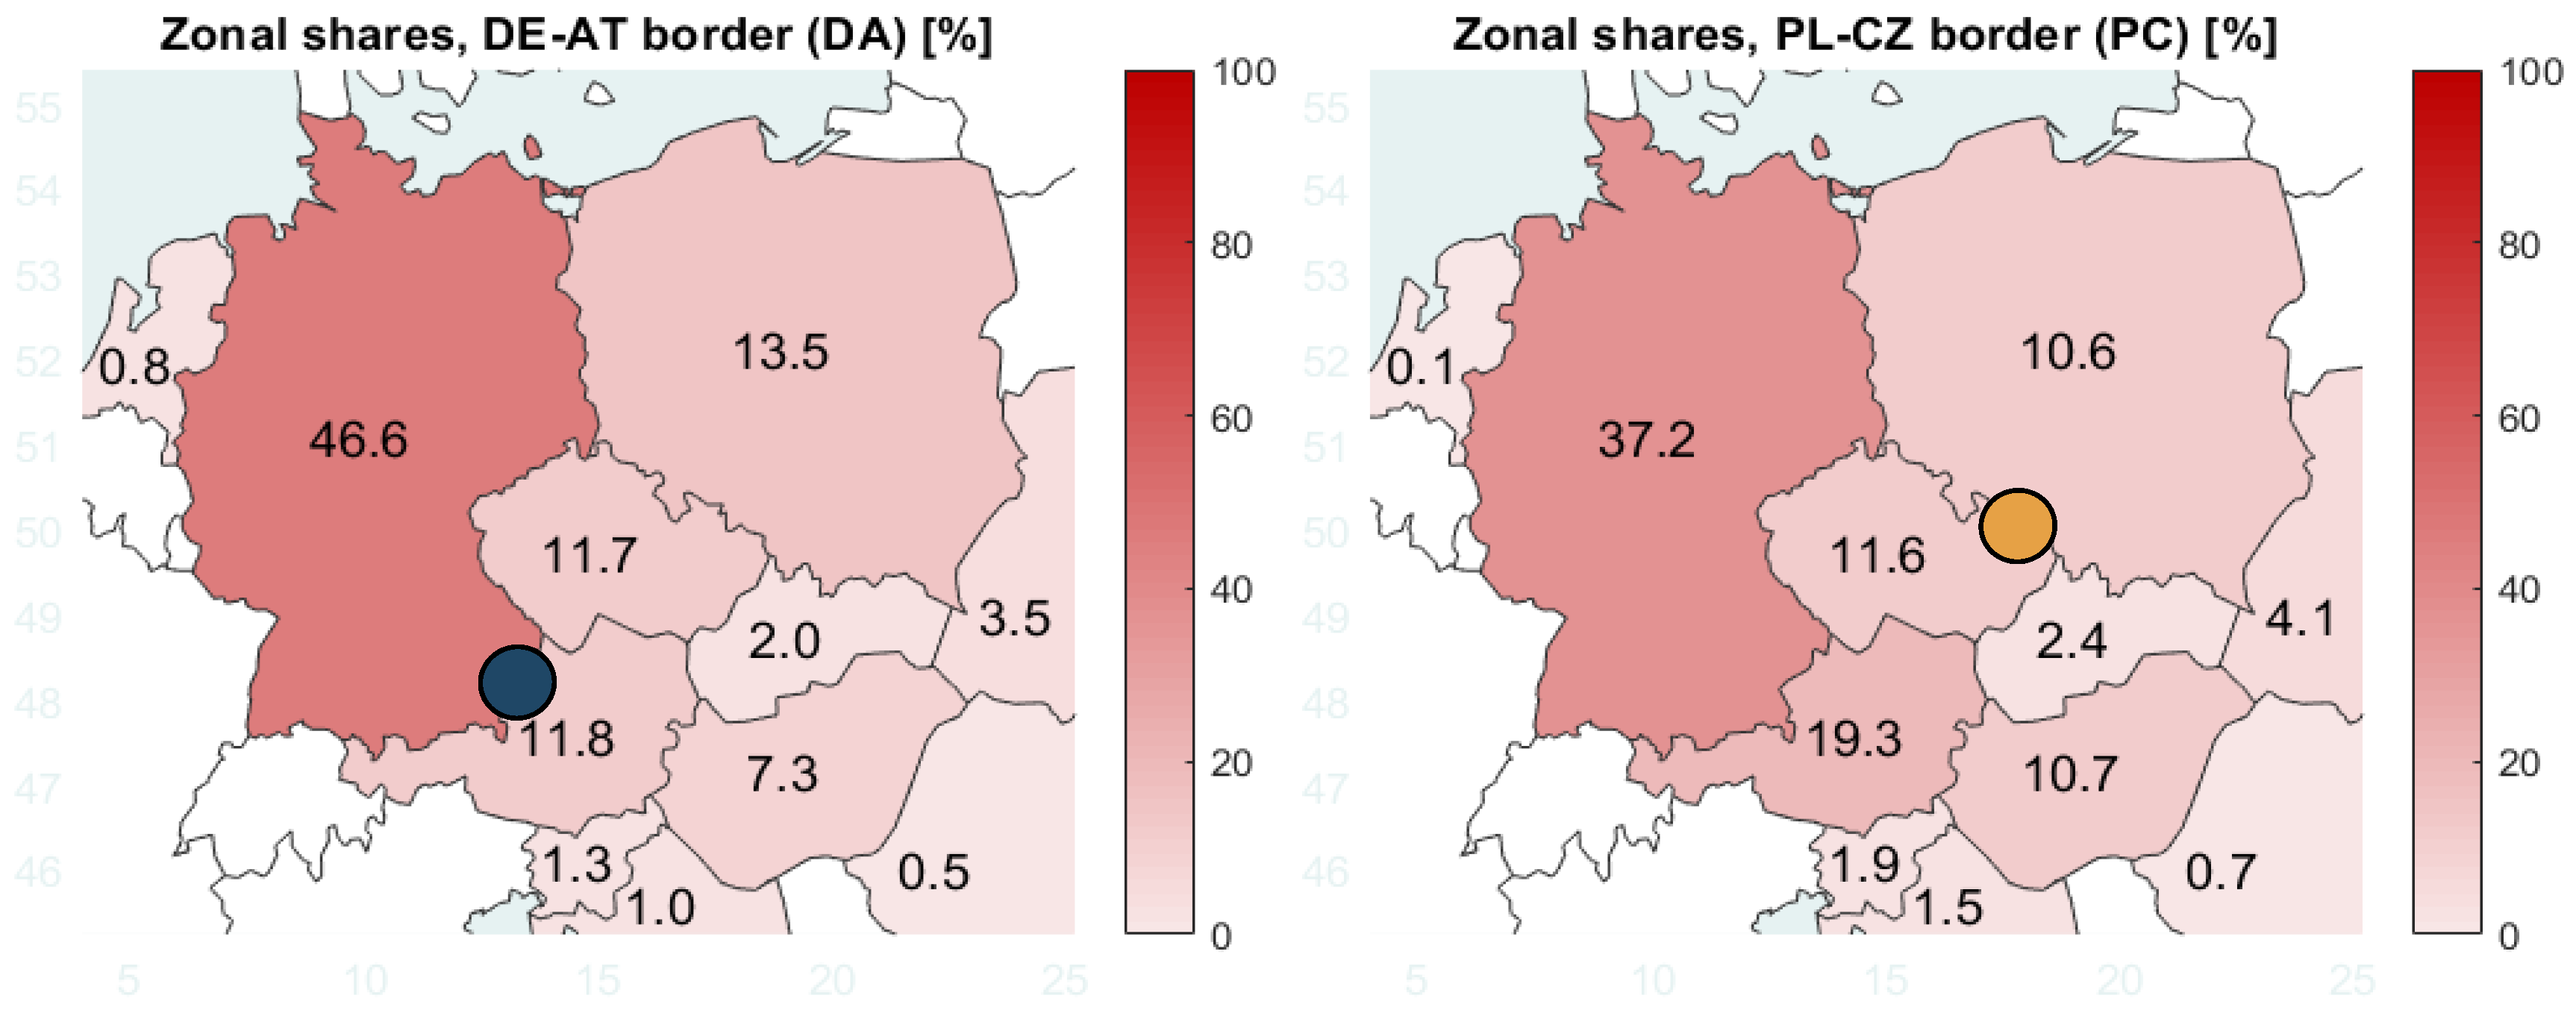
3.2.3. Proposal for New Investments
The new PST investments analysed below were selected by following the procedure presented in Reference [
10]. Two locations were chosen for the purpose of this work. The first can be considered the most effective as it is characterised by the greatest reduction of redispatch cost. The second is, in the opinion of authors, one that draws the most interest, as the location of the zone where the PST is positioned is far from the zone where the highest reduction of cost can be witnessed. Based on these assumptions, two alternative scenarios were also created. The two investment scenarios differ from the reference scenario (
R) only by the location of a new PST:
- (a)
alternative scenario : PST on DE-AT border,
- (b)
alternative scenario : PST on PL-CZ border.
Real PST installations are never placed “on the border”, but in a substation often in the closest proximity to cross-border connection, which in turn makes the endeavor more practical, as only one zone would be the owner and administrator of the newly installed hardware. For the purpose of this paper, the PST on DE-AT border was placed in the German border station, while the one on PL-CZ border in Polish border station, with appropriate TSO’s ownership assumed for the respective devices.
3.2.4. Remedial Action Optimisation
This analysis was based on 24 hourly snapshots. Only 10 h demanded costly RAs and for another 10 it was enough to adjust PST tap positions. Both proposals for investment proved to have a positive impact on the regional coordination of remedial actions. In the case of the first investment (
), it was possible to save almost 97% of initial RA cost; second sub-optimal location (
) has brought 25% of savings (
Table 1).
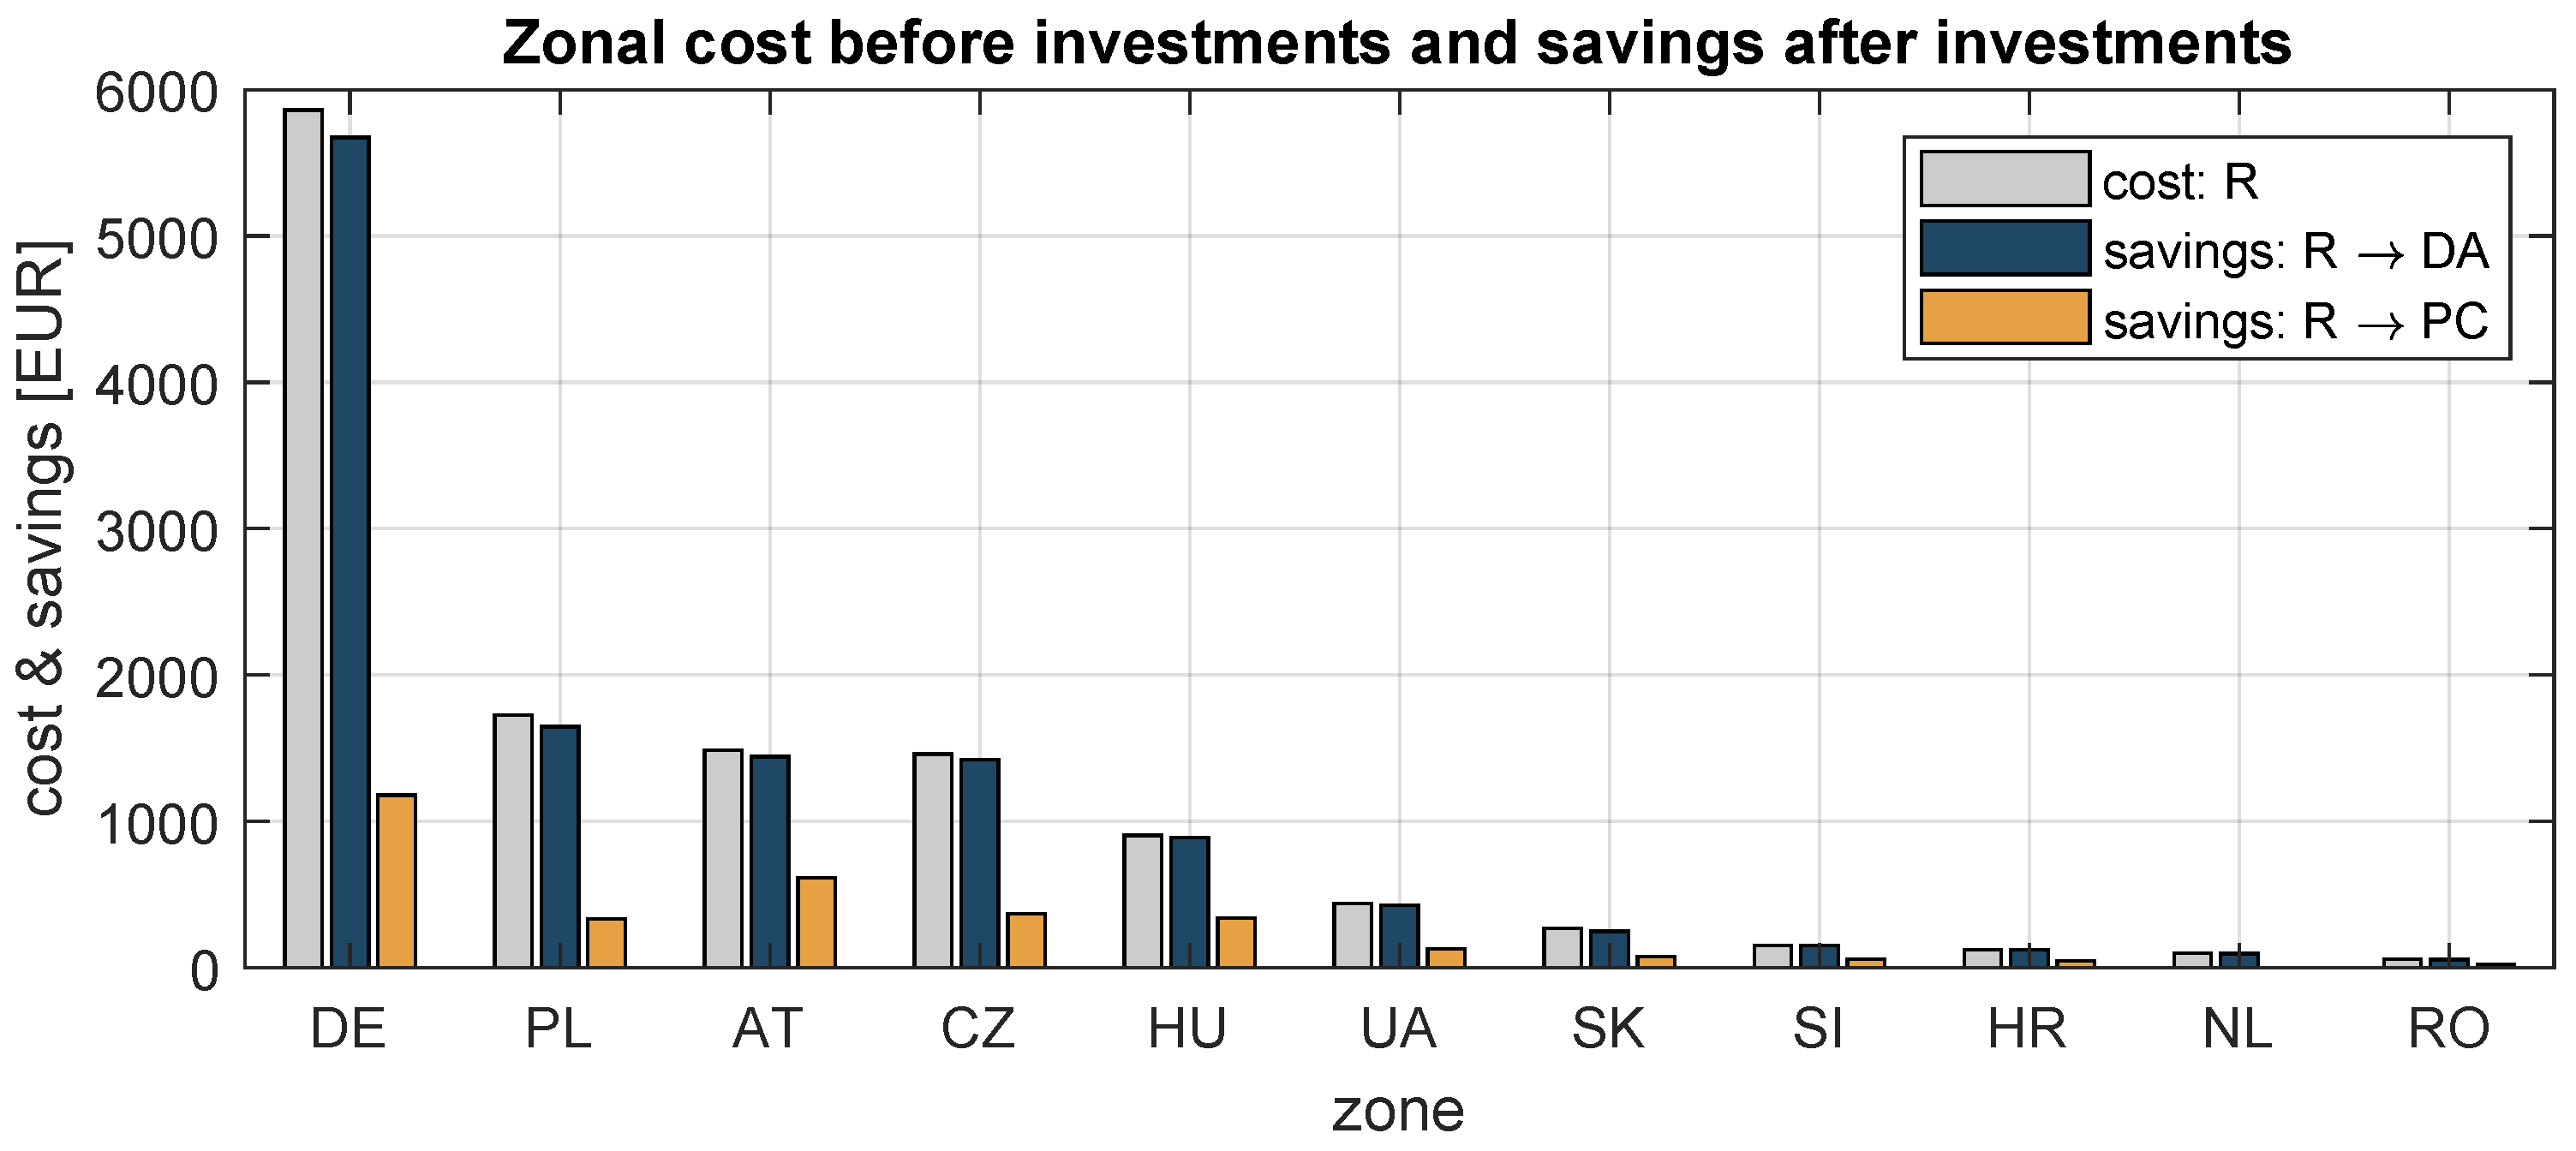
3.2.5. Costs, Savings and Investment Shares
The global costs determined by the Remedial Action Optimiser were treated with the cost-sharing procedure. As a result, the total zonal costs of the reference scenario and zonal savings (
) associated with both alternative investments could be provided (
Figure 6).
Costs and savings are presented in descending order of remedial actions’ zonal costs for the reference scenario. The vast discrepancy between the savings of
and
can be observed. Lower costs introduced by scenario
determine significant savings as the result of this investment. Interestingly, the order of zonal contribution to global costs (
R) and savings (
&
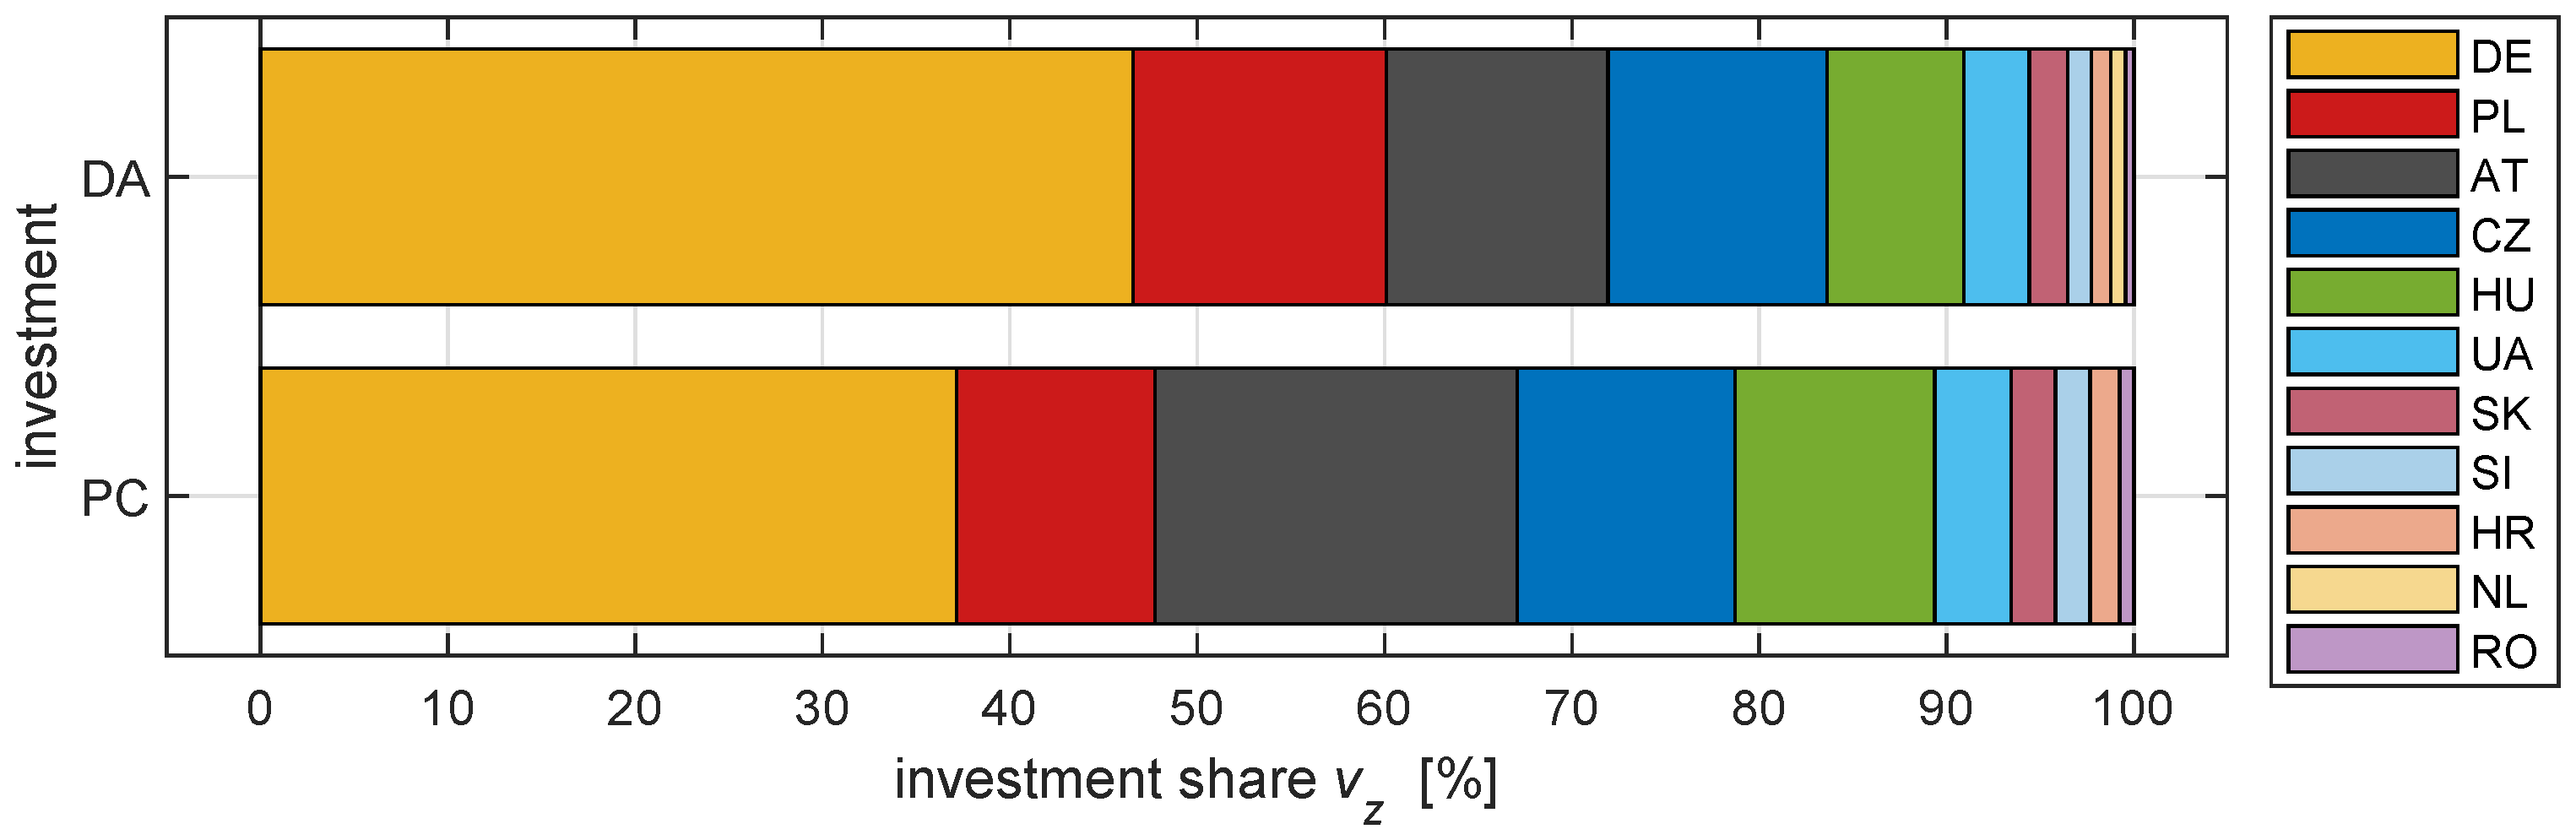
) are similar, which means that in general the greatest polluters benefit the most regardless the location of a new investment. This observation is confirmed by the zonal investment shares
, which are calculated based upon savings (
Figure 7 and
Figure 8).
Appendix C contains detailed numerical data on costs, savings and investment shares in zonal resolution.
4. Discussion
4.1. Savings for Different Scenarios
The most significant differences of zonal shares are limited to four states: Germany, Austria, Poland and Hungary—the sum of shares for these zones is close to 80% in case of both investment scenarios. Observed similarities between two sets of investment shares, illustrated on
Figure 8, originate from the fact that the proportions of the zonal shares for any analyzed hour are the same throughout all the investment scenarios under scrutiny, as they depend on the initial state (before RAO) of the grid, which includes congestions to clear and the tap settings of PSTs, which are the same in each investment scenario.
What we can see that changes is the amount of costly remedial actions (and expenses associated with them). A zone receives more from the transition than others, if costless remedies are handling costly hours more frequently. The total cost of zone
z can alternatively be expressed as
where
is the zonal fraction of costs in timeframe
t and
denotes cost of remedial actions for the same period and a given configuration of a power system. If neutral PSTs’ settings before RAO and RAO-independent mapping are assumed, zonal fractional shares for different PSSs are very similar (
) and depend only on small differences of impedances with and without a new investment. Consequently, zonal savings take the form of:
Due to common value of applied to both and scenarios, the observed differences are solely caused by expression representing system’s savings due to investments (). It is important to underline that this observation does not need to hold for different cost-sharing schemes, and/or different modelling approaches.
4.2. Utility of the Costs’ Partition
The obtained results can be treated as an alternative to two simple, however rather extreme, measures that can be implemented when the search for investors is concerned, that is, a single investor and equal investment share for all the participants (e.g., CCR members).
In order to analyse the distance of the proposed cost sharing outcomes from two naive and extreme solutions (i.e., one investor and all the CCR members taking an equal share), authors propose to use the Herfindahl-Hirschman Index (HHI)—an economic indicator originally designed to describe market concentration, which for the shares
is given by:
In this context, market concentrations (or
market shares) are substituted by the zonal shares of new investment (note, that zonal investment shares are positive fractions that add up to 1, as required by HHI approach). As a result, not only the values of zonal shares can be captured and compared between different scenarios, but also the relation between them can be analyzed. For interpreting results in this form it is useful to be aware of the range of possible results – single investor outcome (economic monopoly) is represented by 1, while the lowest value, which corresponds to the equal shares of all the market participants, is
, with
N denoting the number of participants. In order to make the ultimate measure less dependent from
N, and thus more comparable between situations with a varying number of subjects, normalisation is advised:
The range of values for the index defined above is
. Interpretation of the HHI values provided by the Department of Justice (USA) [
21] are as follows: for
market is considered unconcentrated, whereas
represents a high concentration. The thresholds refer to standard HHI, but in the context of numerous market participants (in such a case, the lower limit of possible values approaches 0). However, in a scenario of only 11 parties constituting “the market”, it is more insightful to reach for the normalised index as a reference point. What is the concentration of savings in the analysed case?
The values of HHI obtained for both alternative scenarios (
Table 2) indicate a relatively high concentration of investment shares—in the analysed cases, although all zones share some part of the new investments, most of the shares are relatively minuscule. Only five of the eleven parties are necessary to reach a 90% threshold of the overall expenses. If concentration of investment shares is high, the method for quantitative solution that proposes non-equal shares proves to be of significant utility.
5. Conclusions and Future Steps
This work meets an important need to determine the future of investments that lead to benefits for multiple zones. Measures introduced in order to obtain the result (, ) are followed by quantities used to assess the relations between the produced outcomes (, ). The added value of this analysis goes beyond the classical CBA, which typically represents a perspective of a single party being both an investor and the only user of the infrastructure under analysis. If a regional context is introduced, then it can be considered that CBAs are often limited to simple heuristic approaches. The presented method however is aimed at justifying future costs by trustworthy estimates of savings. It is specially designed to utilise the properties of power system operation, and hence provides decision support for all the members of CCR debating on effectiveness of the infrastructure under their supervision.
Are the savings sufficient to cover the expenditure related to a new PST? It is fair to state that a study limited to 24 snapshots is unable to provide such an answer. However, the raw estimates can be made based upon average values derived from the described analysis. If the timestamps were representative for a typical situation in the region then 4.5 million EUR of savings could be expected over the course of a year, according to the DA investment scenario. This sum is comparable to the price of installation offered by one of the leading providers [
22] (the provided PST example refers to a device with 500 MVA of rated power; installations adjusted to greater power ranges are considered as more expensive). Even so, it is important to highlight that the analysed scenarios were developed for long-term planning of power systems instead of short-term operational purposes and congestion identification is limited to cross-border elements only—in the case of the actual cost of European remedial actions (wider region), the annual amount of expenses reaches beyond 2 billion EUR (half of which refers to the German inner redispatch) [
23].
One of the most significant findings introduced by this case study exemplifies and justifies the detachment of two main roles of each TSO-related investment process – the roles of host and founder. Placing the PST in the optimal location (German-Austrian border) showed that the Polish benefit exceeds the savings made by Austria. The other alternative is even more interesting, since the reduction of costs due to the Polish-Czech PST did not change the structure of saved RA costs in a significant way, however it gave Austria greater share of benefits as compared to DE-AT investment (cf.
Figure 8). Therefore, it is shown that the beneficiary zones can be ultimately well distanced from the location of the newly installed device.
The obtained Herfindahl-Hirschman indicators proved a high concentration of savings. An interesting application of the HHIs can be seen in the following: if the CBA’s results displayed much below 0.1, then perhaps a more reasonable strategy would be to introduce a simpler solution (equal investment shares). Otherwise (as represented in the analysed example) undertaking the effort to apply cost-sharing based contributions is justified by numerical evidences. Furthermore, if the unevenness of gains is proved, then the appropriate allocation of costs can automatically be proposed.
By submitting this method authors do not make any claim that the cost-sharing key, developed in order to perform computations, is either optimal or the most suitable for any CCR. In fact, the main message is independent from the cost-sharing method, and can be adapted to any final methodology resulting from the implementation of CACM.
In principle the analysis does not need to be limited to PSTs, but any investment of such regional impact (Ten-Year Network Development Plan processed by ENTSO-E is an example of a comparable regionally coordinated initiative). The focus on PSTs is mainly due to the fact that the benefits from hosting new devices can be convincingly outnumbered by the advantages experienced by other zones. In a case where multiple investments are under consideration (either of the same type, or composed of diverse elements, for example, PST and transmission line) it is advised to treat the results with special care and attention. The general approach of calculating can be implemented, but the complex nature of state a (after investments) demands raising further questions: Is each single investment equally beneficial for all the parties? What if their cost of installation differs significantly? Should the assessment be performed at the same time for the whole set of new elements, or for each of them one-by-one? Does the trajectory (the order of introducing investments) affect the results?
Another dilemma outside the scope of this study refers to negative shares that may occur while determining . The idea of introducing such a novelty can be considered rational only if the new investment reduces the global cost of redispatch to the extent that exceeds CAPEX, OPEX and any other important cost factors. However, contrary to the example analysed in this paper, the savings of some parties may turn out to be negative, which would indicate a loss resulting from the installation of the asset under scrutiny. Such a situation can occur when, for example, the PST-flows created by a new device are used for relieving a major congestion and simultaneously cause other minor overloads. In theory, the set of investment shares could serve as a guideline for the redistribution of savings—the avoided cost of parties that benefit from the change are split into (i) covering the investment and (ii) compensating for the other zones’ increase of costs. The alternative solution could only determine the financing of new assets by making use of positive investment shares and introducing a new rule for the cost-sharing of remedial actions.
Additionally, it is worth highlighting that savings elaborated on in this work are not the only source of welfare increase experienced by bidding zones that are introduced by operating PSTs. Perhaps the method defining investment shares should be aimed at encompassing the influence on social-economic welfare introduced by PSTs while optimising the market coupling domain during capacity calculation. The aforementioned issues are the subject of ongoing research in this field.
To sum up, the solution can be challenged by the following observations—(i) it introduces a significant change to existing perception of investment processes, which can be seen as an implementation obstacle, (ii) it is based on simulation of future cost sharing results and, similarly to any forecasting methods, it is sensitive to the accuracy of estimations related to input parameters representing distant future, (iii) it demands further examinations in the light of potential existence of negative share factors. On the other hand, among advantages of the presented investment sharing rule we find (i) strong connection with the commonly established processes related to network guidelines, (ii) association of investment burden with forecasted savings and (iii) equipping the TSOs with another tool enabling stronger integration in the field of power system development.
Author Contributions
Conceptualization, E.U.-P., M.K. and P.K.; methodology, M.K., E.U.-P. and P.K.; software, P.K., W.J., M.J. and M.K.; investigation, M.K., E.U.-P. and W.J.; writing—original draft preparation, M.K., E.U.-P.; writing—review E.U.-P. and M.K.; editing, M.K.; visualization, M.K.; supervision, E.U.-P. and M.K.; funding acquisition, E.U.-P. All authors have read and agreed to the published version of the manuscript.
Funding
The research leading to this work was being carried out as a part of the EU-SysFlex project (Pan-European system with an efficient coordinated use of flexibilities for the integration of a large share of RES), which received funding from the European Union’s Horizon 2020 research and innovation programme under grant agreement No 773505.
Acknowledgments
The authors express their gratitude to Przemysław Kacprzak (PSE—Polish TSO), who shared invaluable insights on the document’s composition and to Tony Sentinella for his engagement in introducing clarity into described ideas.
Conflicts of Interest
The authors declare no conflict of interest. The funders had no role in the design of the study; in the collection, analyses, or interpretation of data; in the writing of the manuscript, or in the decision to publish the results.
Abbreviations
The following abbreviations are used in this manuscript:
| CBA | Cost Benefit Analysis |
| CCR | Capacity Calculation Region |
| CNE | Critical Network Element |
| CNEC | Critical Network Element with Contingency |
| CS | Cost Sharing |
| DC | Direct Current |
| ENS | Energy Not Served |
| HHI | Herfindahl-Hirschman Index |
| IN | internal flow |
| IE | import/export flow |
| LF | loop flow |
| MILP | Mixed-Integer Linear Programming |
| PSS | Power System State |
| PST | Phase Shifting Transformer |
| PTDF | Power Transfer Distribution Factors |
| RA | Remedial Action |
| RAO | Remedial Acion Optimization |
| RES | Renewable Energy Sources |
| TR | transit Flow |
| TSO | Transmission System Operator |
Appendix A. The Algorithm for Defining Zonal Fractional Shares for a Given CNEC
Table A1.
Algorithmic description of the final step of transformation. The procedure is aimed at finding values of and using them to determine (line 11).
Table A1.
Algorithmic description of the final step of transformation. The procedure is aimed at finding values of and using them to determine (line 11).
| | Pseudo-Code | | Meaning |
|---|
| 1. | | 1. | denotes the volume of remaining overload, |
| 2. | | 2. | p stands for consecutive number of prioritised flow type, |
| 3. | | 3. | for each flow type, factor is initialised with zero, it represents
a fraction of flow type that is penalised for overload. |
| 4. | while () | 4. | As long as remaining overload is a positive number: |
| 5. | | 5. | increment p, |
| 6. | | 6. | subtract from all the flows of type categorised as p, |
| 7. | | 7. | assign 1 to relevant factor, |
| 8. | | 8. | assign p (the recent priority number) to variable ; |
| 9. | end | 9. | the loop terminates if . |
| 10. | | 10. | The recent is proportional to the fraction of -type flow causing
overload ( is now negative and ). |
| 11. | | 11. | Zonal share is a normalised sum of these netted flows,
which exceed the thermal limit . |
Appendix B. Assumptions on Redispatch Costs
The operation points of the power units were obtained by modelling a market coupling solution for Continental Europe with the scenarios developed within the EU-SysFlex project. The assumptions regarding must-run units were made to ensure the stability of the power system, especially in case of high integration of RES. Consequently, the input data of operation points associated with particular timestamps, do not necessarily represent a least-cost solution (the most inexpensive generators are in some cases skipped in accordance to unit commitment constraints). In order to derive the redispatch costs the following strategy was used. First, a system-wide price of energy was estimated in each timestamp by constructing a merit-order curve and searching for its intersection with the total demand. Then, based on the expertise of TSO representatives engaged in EU-SysFlex, it was assumed that all the generators that are selected to decrease production return 95% of this price per MWh. For generators that are selected to increase production, if the marginal cost of the generator is lower or equal than the energy price, it receives 105% of the price per MWh, otherwise it receives 105% of its marginal cost per MWh. For RES curtailment, a penalty of 100 EUR/MWh was set. In order to model energy not served, 10,000 EUR/MWh was used as Value of Lost Load.
Appendix C. Numerical Values of Zonal Costs, Savings and Shares
Table A2.
Zonal costs (C), savings (K) and investment shares (v).
Table A2.
Zonal costs (C), savings (K) and investment shares (v).
| | Zonal Costs and Savings [EUR] | Investment Share [%] |
|---|
| | | | | | |
|---|
| | | | | | | |
|---|
| AT | 1485 | 41 | 1443 | 871 | 613 | 11.8 | 19.3 |
| CZ | 1460 | 36 | 1423 | 1091 | 369 | 10.7 | 11.6 |
| DE | 5861 | 187 | 5674 | 4682 | 1179 | 46.6 | 37.2 |
| HR | 125 | 0 | 125 | 76 | 49 | 1.0 | 1.5 |
| HU | 904 | 14 | 890 | 566 | 338 | 7.3 | 10.7 |
| NL | 102 | 5 | 97 | 100 | 2 | 0.8 | 0.1 |
| PL | 1725 | 77 | 1648 | 1389 | 336 | 13.5 | 10.6 |
| RO | 57 | 1 | 56 | 34 | 23 | 0.5 | 0.7 |
| SI | 154 | 0 | 154 | 95 | 59 | 1.3 | 1.9 |
| SK | 270 | 21 | 249 | 195 | 75 | 2.0 | 2.4 |
| UA | 438 | 11 | 427 | 308 | 129 | 3.5 | 4.1 |
| SUM | 12,579 | 394 | 12,185 | 9407 | 3172 | 100.0 | 100.0 |
References and Notes
- Miasaki, C.T.; Franco, E.M.C.; Romero, R.A. Transmission Network Expansion Planning Considering Phase-Shifter Transformers. J. Electr. Comput. Eng. 2012, 2012, 527258. [Google Scholar] [CrossRef] [Green Version]
- Hadzimuratovic, S.; Fickert, L. Determination of critical factors for optimal positioning of Phase-Shift Transformers in interconnected systems. In Proceedings of the 19th International Scientific Conference on Electric Power Engineering (EPE), Brno, Czech Republic, 16–18 May 2018. [Google Scholar]
- Lima, F.G.M.; Galiana, F.D.; Kockar, I.; Munoz, J. Phase Shifter Placement in Large-Scale Systems via Mixed Integer Linear Programming. IEEE Trans. Power Syst. 2003, 18, 1029–1034. [Google Scholar] [CrossRef]
- ENTSO-E. Bidding Zone Configuration Technical Report. Public Report. 2018. Available online: https://www.entsoe.eu/Documents/Events/2018/BZ_report/20181015_BZ_TR_FINAL.pdf (accessed on 3 August 2020).
- CORE TSOs, Day-ahead capacity calculation methodology of the Core capacity calculation region in accordance with Article 20ff. of the Commission Regulation. (EU) 2015/1222, 24 July 2015.
- CORE TSOs, Common Methodology for Redispatching and Countertrading cost Sharing for the Core CCR Regulation. (EU) 2015/1222, 24 July 2015.
- Aygen, Z.E.; Abur, A. Optimal placement of phase shifters considering contingencies. In Proceedings of the IEEE Power Engineering Society General Meeting, Denver, CO, USA, 6–10 June 2004. [Google Scholar]
- Sikora, R.; Wolter, M.; Strunz, K. Analysis on optimal placement and setting of phase-shifting transformers to control cross-border power flows in interconnected transmission systems. In Proceedings of the IEEE PES General Meeting, National Harbor, MD, USA, 27–31 July 2014. [Google Scholar]
- Gerbex, S.; Cherkaoui, R.; Germond, A.J. Optimal Location of Multi-Type FACTS Devices in a Power System by Means of Genetic Algorithms. IEEE Trans. Power Syst. 2001, 16, 537–544. [Google Scholar] [CrossRef]
- Padron, E.U.; Jakubek, M.; Jaworski, W.; Kłos, M. Pre-selection of the optimal siting of phase shifting transformers based on an optimisation problem solved within a coordinated cross-border congestion management process. Energies 2020, 13, 3748. [Google Scholar] [CrossRef]
- COMMISSION REGULATION 2017/1485 Establishing a Guideline on Electricity Transmission System Operation. Available online: https://eur-lex.europa.eu/legal-content/EN/TXT/PDF/?uri=CELEX:32017R1485&from=EN (accessed on 3 August 2020).
- COMMISSION REGULATION 2015/1222 Establishing a Guideline on Capacity Calculation and Congestion Management. Available online: https://eur-lex.europa.eu/legal-content/EN/TXT/PDF/?uri=CELEX:32015R1222&from=EN (accessed on 3 August 2020).
- Guo, J.; Fu, Y.; Li, Z.; Shahidehpour, M. Direct Calculation of Line Outage Distribution Factors. IEEE Trans. Power Syst. 2009, 24, 1633–1634. [Google Scholar]
- FutureFlow [Project]. D1.2. Cross-Border Balancing and Redispatching Mechanisms Tailored to Congested Borders Situation and Design of a Common Activation Function. Public Report. 2016. Available online: https://futureflow.eu/wp-content/uploads/2020/02/FutureFlow-WP1-D1.2-Cross-border-balancingand-redispatching-mechanisms-tailored-to-congested-borders-situation-and-design-of-a-Common-Activa.pdf (accessed on 3 August 2020).
- Chychykina, I.; Klabunde, C.; Wolter, M. Redispatch with power flow decomposition and power transfer distribution factors methods. In Proceedings of the International Universities Power Engineering Conference, Coimbra, Portugal, 6–9 September 2016. [Google Scholar]
- Pavesi, M.; van Casteren, J.; de Graaff, S.A. The full line decomposition method—A further development for causation-based cost sharing. Cigre Sci. Eng. 2017, 9, 27–43. [Google Scholar]
- Klos, M.; Wawrzyniak, K. Comparing Load Flow Decomposition Methods for Cost Sharing of Coordinated European Redispatch. In Proceedings of the 16th International Conference on the European Energy Market (EEM), Ljubljana, Slovenia, 18–20 September 2019. [Google Scholar]
- EU-SysFlex [Project]. D2.2. Models for Simulating Technical Scarcities on the European Power System with High Levels of Renewable Generation. Public Report. 2019. Available online: http://eu-sysflex.com (accessed on 31 July 2020).
- EU-SysFlex [Project]. D2.3 EU-SysFlex Scenarios and Network Sensitivities. Public Report. 2019. Available online: http://eu-sysflex.com (accessed on 31 July 2020).
- EU-SysFlex [Project]. D2.4. Technical Shortfalls for Pan European Power System with High Levels of Renewable Generation. Public Report. 2020. Available online: https://eu-sysflex.com (accessed on 31 July 2020).
- Laine, C.R. The Herfindahl-Hirschman Index: A Concentration Measure Taking the Consumer’s Point of View. Antitrust Bull. 1995, 40, 423–432. [Google Scholar] [CrossRef]
- ABB. ABB Jako Pierwsza Dostarczy Przesuwniki Fazowe Zaprojektowane i Wyprodukowane w Polsce. Available online: https://new.abb.com/news/pl/detail/27657 (accessed on 31 July 2020). (In Polish).
- ACER/CEER. Annual Report on the Results of Monitoring the Internal Electricity and Natural Gas Markets in 2017. Public Report. 2018. Available online: https://www.acer.europa.eu/Official_documents/Acts_of_the_Agency/Publication/MMR%202017%20-%20ELECTRICITY.pdf (accessed on 3 August 2020).
© 2020 by the authors. Licensee MDPI, Basel, Switzerland. This article is an open access article distributed under the terms and conditions of the Creative Commons Attribution (CC BY) license (http://creativecommons.org/licenses/by/4.0/).


