ENSO Related Seasonal Range Prediction over South America †


1
Atmospheric Science Program, School of Natural Resources, University of Missouri, Columbia, MO 65211, USA
2
IIDEPROQ, Facultad de Ingeniería, Universidad Mayor de San Andres, La Paz, BO 591, USA
3
Rural Sociology Program, Division of Applied Social Sciences, University of Missouri, Columbia, MO 65211, USA
*
Author to whom correspondence should be addressed.
†
Presented at the 2nd International Electronic Conference on Atmospheric Sciences, 16–31 July 2017; Available online: http://sciforum.net/conference/ecas2017.
Proceedings 2017, 1(5), 682; https://doi.org/10.3390/ecas2017-04140
Published: 17 July 2017
(This article belongs to the Proceedings of Proceedings of the 2nd International Electronic Conference on Atmospheric Sciences)
Abstract
:Seasonal range prediction over North America has been based on intraseasonal and interannual variability related to the Pacific North America (PNA) pattern and El Niño and Southern Oscillation (ENSO), respectively. These phenomena have an impact on the occurrence of atmospheric blocking and the long-term conditions for North America. Similar relationships may be found for seasonal range prediction over South America. Previous studies have examined ENSO-related variability of the South Pacific Jetstream as well as atmospheric blocking. Using the National Centers for Environmental Prediction/National Center for Atmospheric Research (NCEP/NCAR) reanalyses, the character of the monthly circulations were studied over the South Pacific/South America sector from 2000–2016. Initial results show that there is a negative correlation in the upper air circulation over the East Pacific and South America during winter for ENSO. Also, the interannual variability in the jet-stream pattern for the region as related to ENSO shows a 180° phase difference. Finally, there is evidence that the circulation pattern for the 2000–2016 may be different from that of the latter part of the 20th century as indicated by a recent reversal of the interdecadal variability of atmospheric blocking over the South Pacific Region.
Keywords:
seasonal forecasting; South Pacific; teleconnections; South America; ENSO; blocking; precipitation1. Introduction
Recently, seasonal range forecasting up to two seasons ahead has been performed successfully for the Missouri USA region with skill better than climatology [1,2,3]. Also, [1] demonstrated that atmospheric blocking occurring over the Pacific Region can have a strong influence on the character of warm season conditions over the Missouri USA region. Additionally, the work of [4,5,6] demonstrated a strong tendency for summer season conditions to depend on the direction of the El Niño and Southern Oscillation (ENSO) transition. The work of [5] demonstrated a similar transition based dependence in western Russia, and [5,6] confirmed the tendency for atmospheric blocking to influence growing season conditions. Then [3] used this information along with time series analysis of crop yields to generate tendencies for soybean and corn yields based on the transition phase of ENSO.
The work of [1] was based on that of [7] (and references therein) who demonstrated that the monthly surface conditions of the Missouri Region are based on the impact that seven different monthly Sea Surface Temperature (SST) clusters on the jet stream in the Pacific North American (PNA) region from 1955-1992. These SST clusters generally corresponded to phases of ENSO including El Niño, La Niña, and Neutral. The work of [1] updated the earlier work of [7] to include all months up to 2007 and demonstrated that a change in the phase of the Pacific Decadal Oscillation (PDO) in 1977 and 1998 could be identified by the presence of certain SST clusters. They [1] also constructed PDFs of temperature and precipitation from surface data in Missouri finding statistical tendencies toward warm or cool, and/or wet or dry conditions corresponding to these SST clusters. Then [2] expanded on the work of [1] to include several cities across the central USA from 1900 to 2005. These statistical relationships became the basis for the work of [3]. However, ENSO variability can be somewhat localized [8,9,10] and the relationships found in [1,3] are generally applicable for much of Missouri and adjacent regions. Indeed [2,11] demonstrated that ENSO and PDO variability in southwest Missouri can be different from that of regions to the north and east.
Finding similar teleconnective relationships for seasonal range prediction in South America should also be possible as it is well-known that ENSO has a stronger impact on South American weather and climate as well (e.g., [12]). This is especially true for the western and eastern coastal regions, and intraseasonal and interannual variability can be found in the precipitation, as well as temperatures, and the upper level winds [12]. Additionally, the Pacific South American (PSA) Pattern (e.g., [13]), which is analogous to the PNA, can influence the weather and climate of the western coast. The PSA was described by [14] as having two primary modes (wave numbers three and four), and [15] associated the wave number three pattern as being associated with longer-term ENSO variability and wave number four pattern associating with quasi-biennial time-scales. Additionally, the intraseaonal variability in the PSA region can be impacted by the Madden Julian Oscillation [16] as well as influences from the Hadley region [13]. On the other hand, the South Pacific region is the primary location for Southern Hemisphere blocking (e.g., [17]) which can reflect the internal dynamics of the region including the association of blocking with Rossby Waves [18,19]. A trend toward fewer blocking events and more zonal flow was found by [17], but there is evidence that blocking activity has been increasing since 2000. However, [20] states that there has been no trend in blocking immediately upstream of South America during the winter season.
The goal of this work is to examine upper air data in the Pacific South America sector and relate this to surface data in Bolivia, in particular the Altiplano region, in order to determine if there are relationships that can be found between surface information and the general teleconnective activity in the PSA region. This information can then be used to make seasonal range forecasts for the study area. The methodologies of [1,2,3] are applied to determine if significant interannual variability exists in the region and can relate to variability in the PSA or South Pacific Region blocking. The initial results suggest that interannual variability related to ENSO exists in the region for the summer season, and that circulation differences in the winter transition seasons may be useful indicators of summer conditions.
2. Data and Methods
2.1. Data
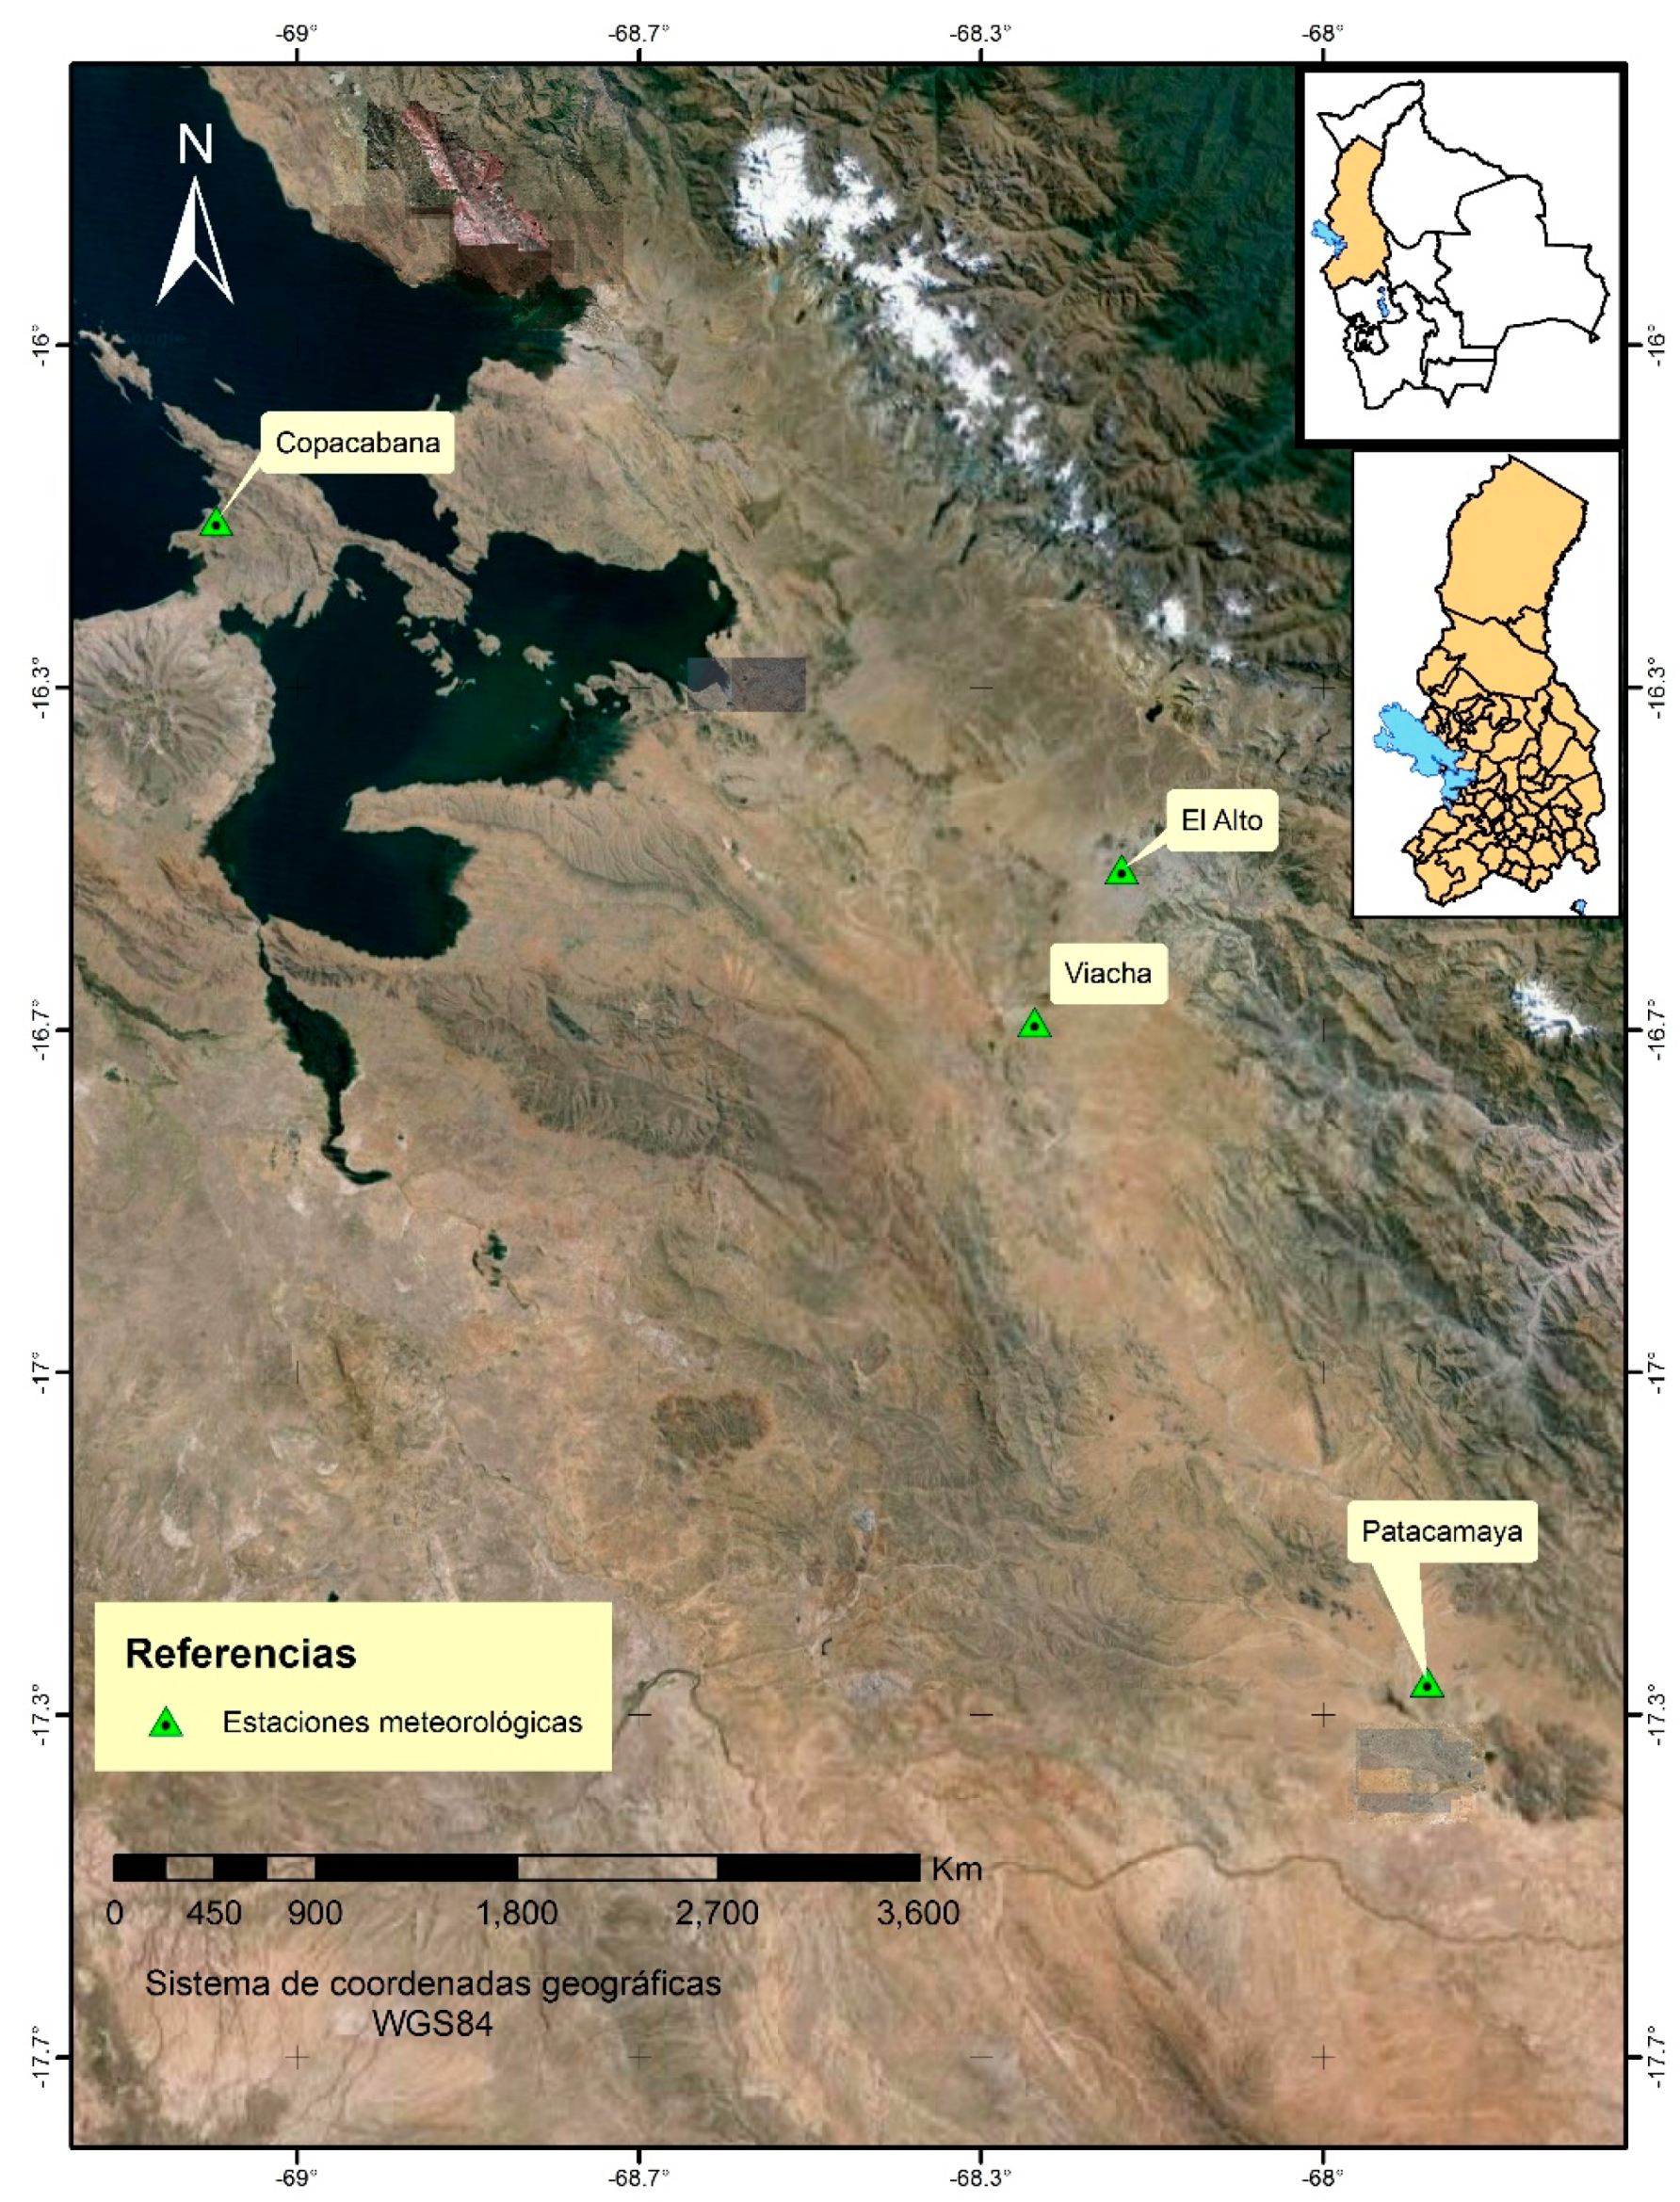
The monthly surface data was available for four weather stations across the study region (Figure 1) were available from 1976 to 2017. The area of Bolivia is more than 1 M km2, which is about six times greater than that of the state of Missouri in the USA, thus, ENSO variability could be different on different parts of the nation. However, the four stations used are in a region called the Altiplano (High Plateau) Region (see Figure 1) which has an area roughly the same size as Missouri, USA. Additionally, the complex terrain may complicate the strength and/or coherence of any ENSO signal found here. The surface data provided were temperature (°C) and precipitation (mm).
The upper air data are provided by the National Center for Environmental Prediction/National Center for Atmospheric Research (NCEP/NCAR) reanalyses [21,22]. They are available on a 2.5° × 2.5° latitude/longitude grid and are available at 6-h intervals from 1948 to present. This study will use the 1200 UTC time period since these data include the most observations, and the heights (m), temperature (K) and wind (m s−1) information will be the primary variables used here. Blocking data is provided by the University of Missouri blocking archive [23].
2.2. Methodology
The methods of [1] will be applied here to examine the monthly surface records for each station. Probability density functions (PDF) were created for each month and then El Niño and La Niña years were identified using the Japanese Meteorological Agency (JMA) definition. The El Niño and La Niña data were tested for skewness to determine if each sample represented different probabilities for warm or cold conditions or wet and dry conditions in particular months/seasons. Then composites of the upper air data were made using the NCEP/NCAR reanalyses.
The definition for ENSO used here is described in [6] and references therein and only a short description is given here. The JMA ENSO index is available through the Center for Ocean and Atmospheric Prediction Studies (COAPS) from 1868 to present [24]. The JMA classifies ENSO phases using SST within the bounded region of 4° S to 4° N, 150° W to 90° W, and defines the inception of an ENSO year as 1 October, and its conclusion on 30 September of the next year. This index is widely used in other published works (see [6] and references therein) and a list of years is given in (Table 1). Also, [25] found that while the JMA index is more sensitive to La Niña events than other definitions, it is less sensitive than other indices to El Niño events. The definition used to identify blocking is found also in [6] or [17], and blocking in the eastern part (160° W–60° W) of the Pacific Domain defined by [17] is examined here.
3. Results
Circulation from 2000 to 2016 and Blocking
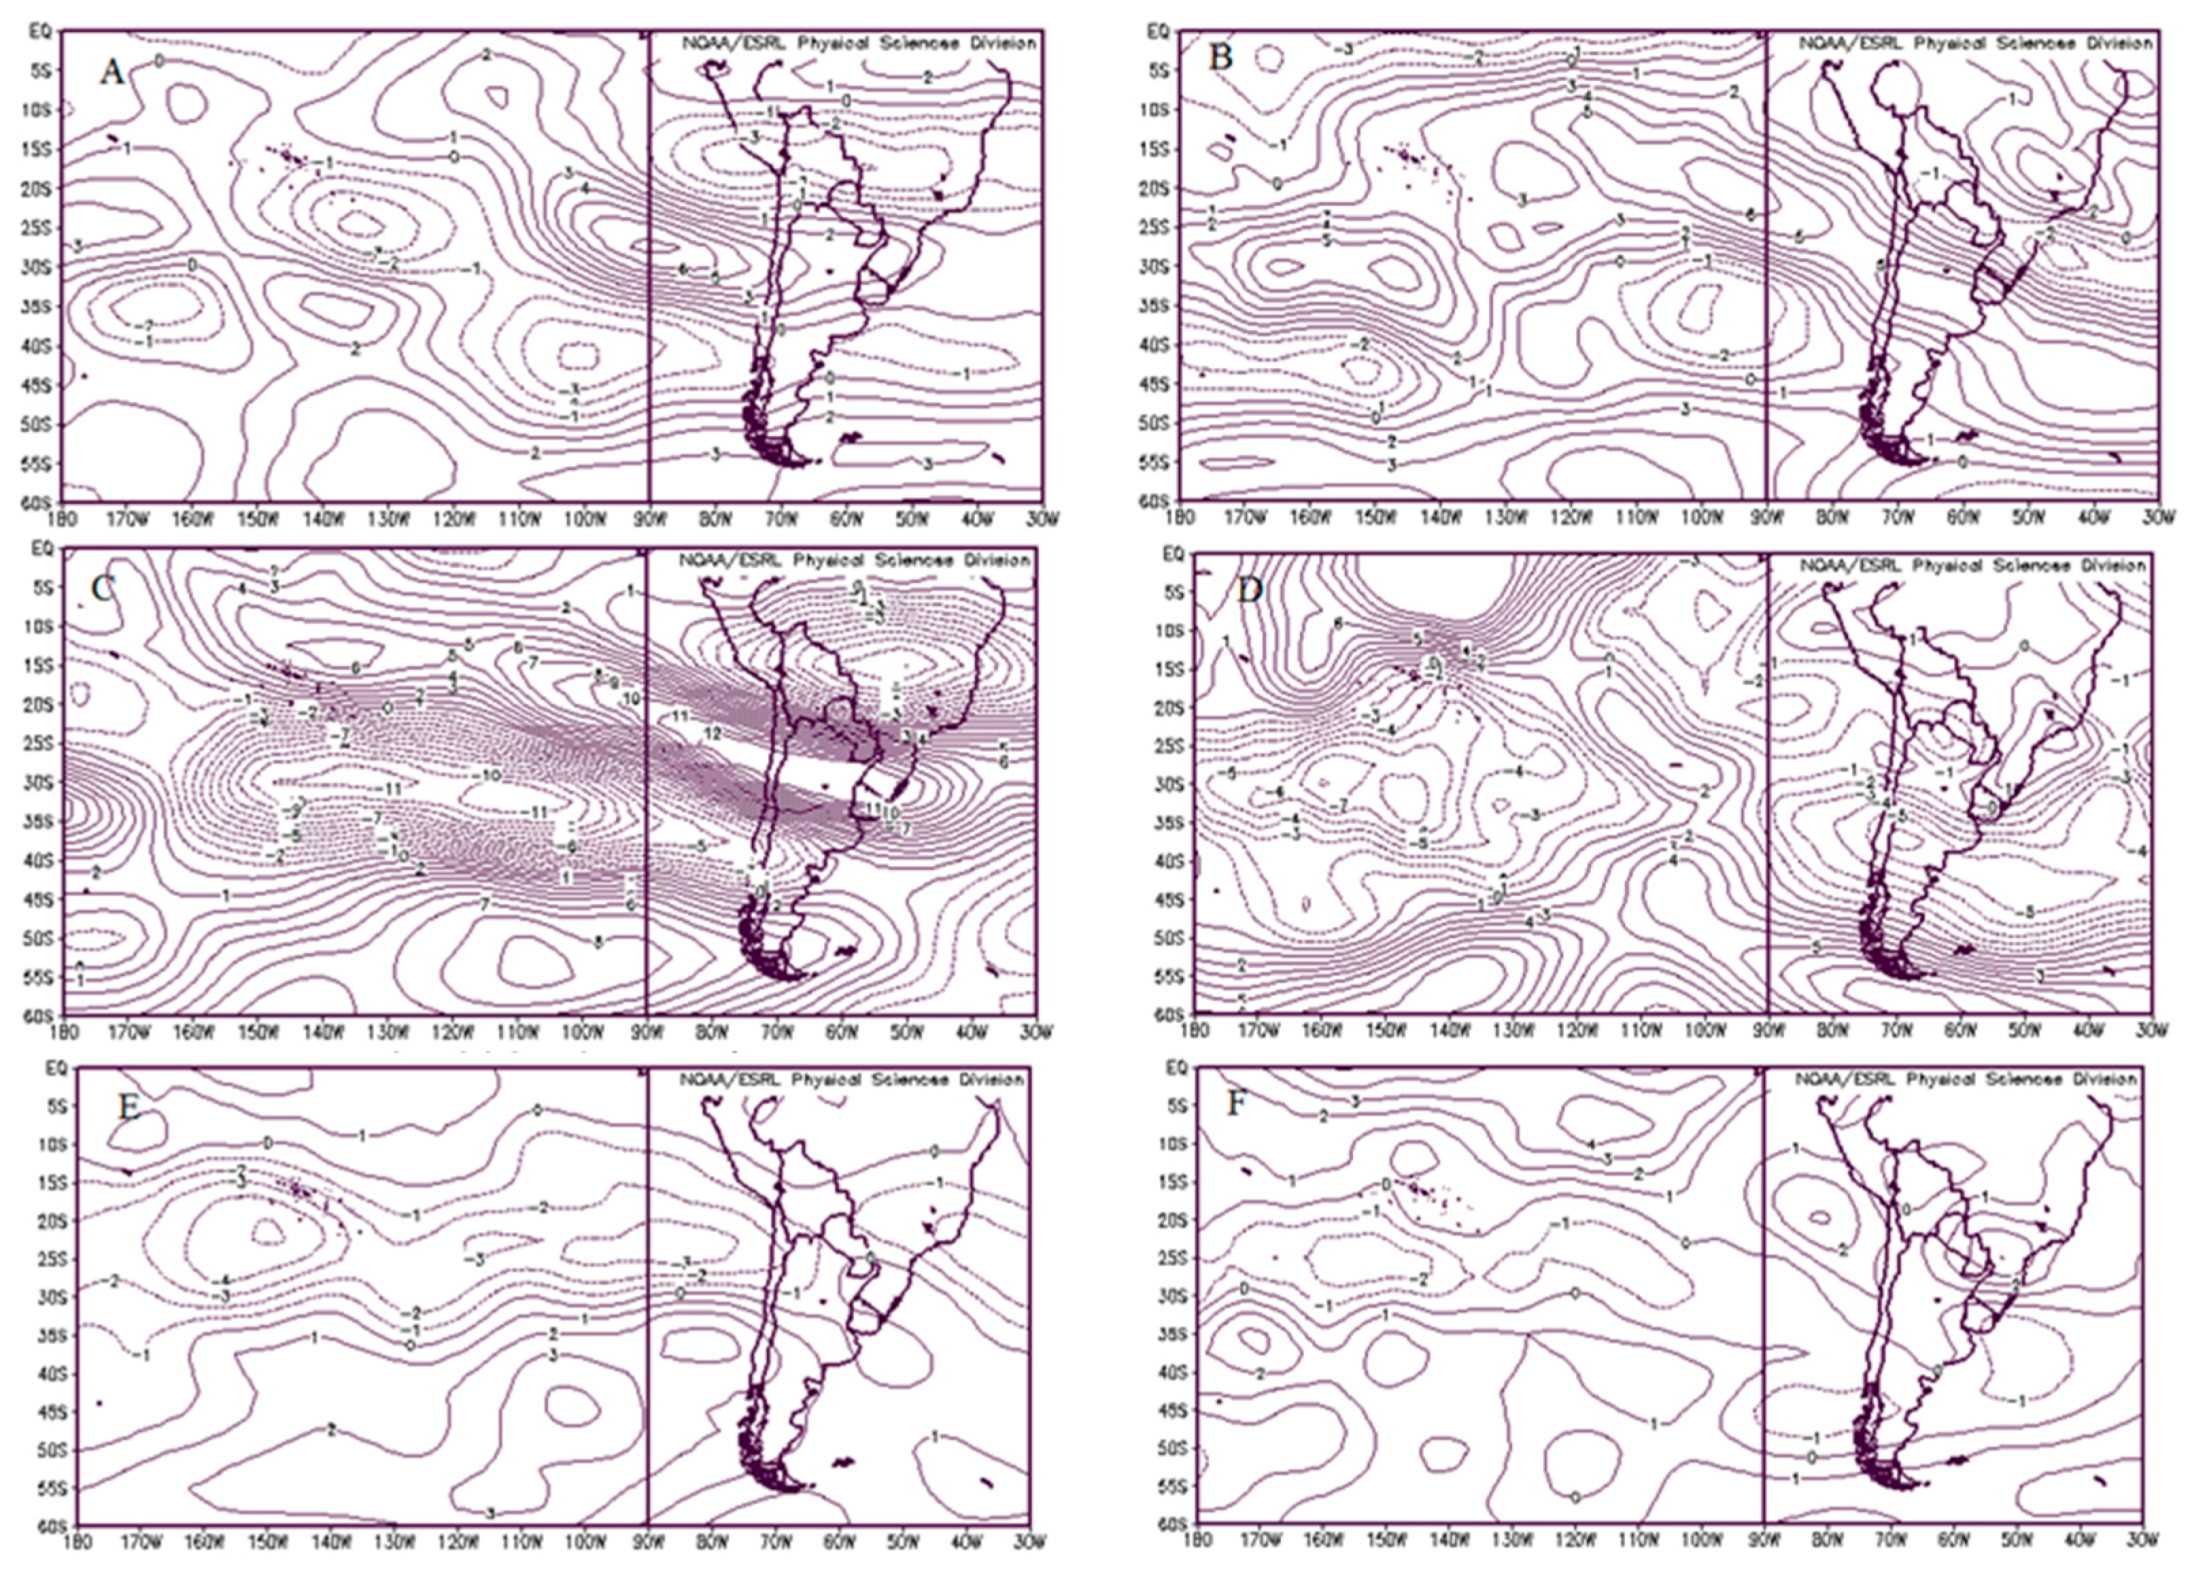
An initial examination of the general circulation was performed by analyzing the 500 hPa height fields for the years 2000–2016, which followed the years examined by [17] or a change in the phase of the PDO as cited above. Since this time there have been five El Niño and two La Niña events, and an example of their composites as well as the anomalies are shown in Figure 2. The example chosen here is the February composites since these are generally representative of the January–February part of the summer season which is close to the critical time for agricultural production. Additionally, the analysis of the surface data will demonstrate that these months show strong interannual variability.
Note that the polar front jet stream is poleward of the Bolivian Altiplano region (Figure 2a,c,e), but that in El Niño (Figure 2a) and La Niña years (Figure 2c), the phase difference is nearly 180° upstream of South America with ridging in El Niño years (Figure 2a) and troughing in La Niña (Figure 2c) years near 110° W. The anomaly maps (Figure 2b,d) elucidates this difference and a trough-ride-trough pattern is very clear for El Niño years (Figure 2b) while the opposite occurs for La Niña years (Figure 2d). The 200 hPa wind anomalies (Figure 3b,d) for these two phases of ENSO are also nearly opposite over the Eastern Pacific and South American region. Note in Figure 3b the enhanced westerlies along the downstream flank of the South American trough in Figure 2b, with slightly weaker westerlies over the Altiplano region. In Figure 3d weaker westerlies (or enhanced easterlies) associated with the poleward side of the positive anomaly over South America and slightly enhanced westerlies for the Altiplano region. The Neutral years (Figure 2e) indicate a more zonal pattern and the anomalies (Figure 2f) show only weak features. The 200 hPa wind anomalies for these years (Figure 3f) also show little structure.
Based on local casual observations and the work of [3,5,6], an examination of the June mean monthly 500 hPa heights is performed here (Figure 4). The polar front jet is located approximately 15° further equatorward as expected, meaning that the region may be impacted by cyclones and their attendant fronts. However, surface observation will show that this season is associated with less precipitation. Here years are stratified by the direction of the transition as in [3,5], or [6] (Figure 4) reveals that for a negative transition (in the direction of warmer SST anomalies) (Figure 4a,b) weak high pressure located upstream and downstream of South America, with weak low pressure over the mid-latitude South America. The Bolivian Altiplano region is located within an area of weak height anomalies, and weaker westerlies (Figure 3a) with an area of enhanced westerlies poleward of the region. These years included only four of the five pre-El Niño years (2002, 2006, 2009, 2014) and two pre-Neutral years (2008, 2011). This pattern also resembles the reverse of the summer season drought pattern for North America identified by [26] (and references there in) or the Asian Pacific Oscillation (APO) pattern in [27] (high pressure over the continent and troughs upstream and downstream).
The positive transition years (Figure 4b,c) included both pre-La Niña years (2007, 2010) and one of the pre-Neutral years (2003) and this shows a distinct high pressure over the South American continent implying northwesterly flow over the Altiplano region. This pattern is nearly the opposite that of the negative transitions (high pressure over the continent and low pressure over the adjacent oceans) but with a shorter wavelength. This strong anticyclonic anomaly is also associated with a weaker westerly/stronger easterly wind anomaly in the meridional near the Altiplano region (Figure 3c). While located similar to El Niño years (Figure 3a) their magnitude is nearly double which is consistent with the strong anticyclonic 500 hPa height anomaly. The years with no transition (Figure 4e,f) included five pre-Neutral years and the one year that featured consecutive El Niños (2015). The pattern shows anomalous high pressure over the mid latitude regions and lower pressure both poleward and equatorward of the region. A band of slightly weaker 200 hPa westerlies (Figure 3e) is located along the equatorward side of the height anomaly encompassing much of central South America.
In order to test the robustness of the results shown in Figure 2, the February maps were reanalyzed using the same years as those for Figure 4. These results are shown in Figure 5 and they are similar overall to the results of Figure 2. The only differences are the El Niño pattern shows stronger ridges and a weaker East Pacific trough (Figure 5a,b) and the neutral years show more coherent high pressure anomalies poleward of the South American continent (Figure 5e,f).
Figure 4 shows strong high pressure upstream of South America for all the June (winter season) 500 hPa height maps, which is during the period when blocking maximizes in the Pacific Region (May, June). An examination of the Southern Hemisphere blocking (Table 2) suggests that the occurrence of blocking has increased substantially hemisphere-wide since 2000 while the durations have increased only marginally. Obviously, this also represents a substantial increase in the number of blocked days, but the smallest increases have occurred within the Pacific Region. The intensity of Southern Hemisphere blocking was virtually unchanged from 2.82 pre-2000 to 2.86 post-2000.
Separating out the East Pacific blocking only from 1970 to 2016 would show that 36% of the Pacific region of the total number of events over the entire domain occurred between 160° W and 60° W. Stratifying the results to conform to the years used by [6] and others for the PDO (Table 3) shows that East Pacific blocking accounted for 34% of the blocking events in positive PDO years and 37% in negative PDO years, a difference that is not statistically significant and consistent with the results of [13,20] who also found no statistically significant changes in the relative frequency of east and west Pacific blocking. Stratifying the results by ENSO phase only for the entire period showed that 41% of all Pacific region blocking events occurred in El Niño years, compared to 36% and 27% of all events in any other year, and this result is consistent with [20] who found a tendency for more east Pacific blocking during El Niño years. However, when separating ENSO phases by PDO as well demonstrates that in the East Pacific El Niño year blocking is a substantially larger fraction of the overall events. This result may partly be a result of persistent ridging in the east Pacific shown in Figure 2b, and when these years are included the fraction of Pacific region blocking events that are Eastern Pacific events is 47%. There is little difference in the duration of East Pacific blocking versus West Pacific blocking during any time frame.
As stated above, the summer season (January–February) is associated with a minimum of blocking in the Southern Hemisphere, but since 2000 summer season occurrences have increased in a fashion consistent with the overall statistics shown in Table 2. The period for June (winter) is associated with the maximum number of Southern Hemisphere blocking and seasonal increases across each region are also similar to that shownin Table 2.
4. Discussion, Summary, and Conclusions
The study examined the interannual variability with respect to ENSO for the East Pacific and South American region with a focus on the Bolivian Altiplano region. There is interest in developing statistical techniques for generating long-range forecasts to aid the agricultural community. The techniques used in [1,2,3] and references therein were used to identify relationships between upper air and surface data that can be used for developing these forecasts and eventually correlating these to agricultural production as in [3]. As part of the analysis Southern Hemisphere blocking, especially the event occurring in the Pacific region were examined. The NCEP/NCAR reanalyses were used for the upper air analysis, blocking data was provided by [23], and surface data provided by the Universidad Mayor de San Andres, La Paz, BO. Studying interannual variability for this region is not as straightforward due to the elevation and the location further into the Hadley region of the tropics than areas previously studied in [1,2,3,4,5,6] who looked at mid-latitude locales.
The initial analyses of the upper air data began with the period 2000 to 2016 since a change in the phase of the PDO occurred just before these years. The 500 hPa height fields and 200 hPa wind fields showed strong interannual variability that is linked to ENSO for the summer season, and, as implied by [13] the east Pacific storm track appears to be most sensitive to interannual variability in this region. Indeed the composites found here bear resemblence to the EOF1-5 patterns found in [13]. In this respect, summer season interannual variability should be strong since ENSO peaks in the Southern Hemisphere summer similar to the strong ENSO signal we ind in North American weather for the winter season. The surface data in the Altiplano region show the most distinct variability in January and February.
In the Northern Hemisphere, summer season is thought to be a time of little ENSO variability, however, earlier work [3,4,5,6] found distinct summer season signals to be associated with the change in phase of ENSO, i.e. whether the transition is toward El Niño, La Niña, or a continuation of the previous phase. A similar approach was used here in order to examine the June variability since the local agricultural community looks to this period for indications of the upcoming rainy seasons. When analyzing strictly by ENSO phase, such signals were diffcult to establish. However, when stratifying the data by negative (toward El Niño), positive (toward La Niña), and no-change, more promising results emerge. The La Niña winter pattern was distictly stronger than the El Niño or Neutral pattern.
A possible explanation for the importance in the change of ENSO phase being important in the winter (summer) in the Southern (Northern) Hemisphere is the change in the surface diabatic heating associated with changes in ENSO phase. The work of [28] showed the impact of surface diabatic heating on maintaining a blocking circulation using a vorticity equation, and many have shown the impact of surface heating or cooling on circulation changes. Then, [29] used non-equilibrium thermodynamics to demonstrate the impact of a warm anomaly on enchaning the surface entropy production which impacts the total entropy since the diabatic term could change signs (see [30]).
Changes in Southern Hemisphere blocking were found from 2000–2016 showing increases in all basins of block occurrence and duration, but no change in intensity. These results do not agree with those of [13] or [20] who found no changes Southern Hemisphere blocking. However, these studied slightly longer time periods and our result may be capturing interannual variability associated with the PDO since the period 1970–1976 also showed more blocking than 1977–1998. In agreement with [20] this study showed more east Pacific blocking in El Niño years compared to La Niña and Neutral years and this was particularly pronounced in the recent period (and 1970–1976).
Finally, the information gathered here will provide a robust statistical data base for making long range forecasts for the Bolivian Altiplano region.
Author Contributions
M.G., J.G. and K.R. conceived and A.R.L. designed the experiments; A.R.L. and K.R. performed the experiments; all four co-authors analyzed the data; and A.R.L. wrote the paper. All authors have read and agreed to the published version of the manuscript.
Acknowledgments
The authors acknowledge the reviewer for their time and effort in examining this manuscript.
Conflicts of Interest
The authors declare no conflict of interest.
References
- Lupo, A.R.; Kelsey, E.P.; Weitlich, D.K.; Davis, N.A.; Market, P.S. Using the Monthly Classification of Global SSTs and 500 hPa Height Anomalies to Predict Temperature and Precipitation Regimess One to Two Seasons in Advance for the Mid-Mississippi Region. Nat. Weather Dig. 2008, 32, 3–23. [Google Scholar]
- Birk, K.; Lupo, A.R.; Guinan, P.E.; Barbieri, C.E. The interannual variability of Midwestern temperatures and precipitation as related to the ENSO and PDO. Atmósfera 2010, 23, 95–128. [Google Scholar]
- Henson, C.B.; Market, P.S.; Lupo, A.R.; Guinan, P.E. ENSO and PDO-related climate variability impacts on Midwestern United States crop yields. Int. J. Biometeorol. 2017, 61, 857–867. [Google Scholar] [PubMed]
- Ratley, C.W.; Lupo, A.R.; Baxter, M.A. Determining the spring to summer transition in the Missouri Ozarks using synoptic scale data. Trans. MO. Acad. Sci. 2002, 36, 55–62. [Google Scholar]
- Lupo, A.R.; Mokhov, I.I.; Chendev, Y.G.; Lebedeva, M.G.; Akperov, M.G.; Hubbart, J.A. Studying summer season drought in western Russia. Adv. Meteorol. 2014, 1–9. [Google Scholar] [CrossRef]
- Newberry, R.G.; Lupo, A.R.; Jensen, A.D.; Rodriges-Zalipynis, R.A. An analysis of the spring-to-summer transition in the West Central Plains for application to long range forecasting. Atmos. Clim. Sci. 2016, 6, 375–393. [Google Scholar]
- Kung, E.C.; Chern, J.G. Prevailing anomaly patterns of the global sea surface temperatures and tropospheric responses. Atmósfera 1995, 8, 99–114. [Google Scholar]
- Gershunov, A.; Barnett, T.P. Interdecadal modulation of ENSO teleconnections. Bull. Am. Meteorol. Soc. 1998, 79, 2715–2725. [Google Scholar] [CrossRef]
- Palecki, M.A.; Leathers, D.J. Spatial Modes of Drought in the Central United States. In Proceedings of the 12th Conference on Applied Climatology, Asheville, NC, USA, 8–11 May 2000. 4p. [Google Scholar]
- Mo, K.C. Interdecadal Modulation of the Impact of ENSO on Precipitation and Temperature over the United States. J. Clim. 2010, 23, 3639–3656. [Google Scholar] [CrossRef]
- Lupo, A.R.; Market, P.S.; Akyuz, F.A.; Allmeyer, C.L.; Albert, D.; Hearst, R. Interannual variability of snowfall events of Southwest Missouri and snowfall-to-liquid water equivalents at the Springfield WFO. Natl. Weather Dig. 2005, 29, 13–24. [Google Scholar]
- Hurrell, J.W.; van Loon, H.; Shea, D.J. The Mean State of the Troposphere; NCAR Tech Memo # NCAR/CAS/95-08; Karoly, D., Vincent, D., Eds.; American Meteorological Society: Boston, MA, USA, 1995; p. 83. [Google Scholar]
- O’Kane, T.J.; Monselesan, D.P.; Risbey, J.S. A Multiscale Reexamination of the Pacific-South American Pattern. Mon. Weather Rev. 2017, 145, 379–402. [Google Scholar] [CrossRef]
- Lau, K.M.; Sheu, P.J.; Kang, I.S. Multiscale low frequency circulation modes in the global atmosphere. J. Atmos. Sci. 1994, 51, 1169–1193. [Google Scholar] [CrossRef]
- Mo, K.C. Relationships between low-frequency variability in the Southern Hemisphere and sea surface temperature anomalies. J. Clim. 2000, 13, 3599–3610. [Google Scholar] [CrossRef]
- Mo, K.C.; Paegle, J.N. The Pacific South-American modes and their downstream effects. Int. J. Climatol. 2001, 21, 1211–1229. [Google Scholar] [CrossRef]
- Wiedenmann, J.M.; Lupo, A.R.; Mokhov, I.I.; Tikhonova, E.A. The climatology of blocking anticyclones for the Northern and Southern Hemisphere: Block intensity as a diagnostic. J. Clim. 2002, 15, 3459–3474. [Google Scholar] [CrossRef]
- Renwick, J.A.; Revell, M.J. Blocking over the South Pacific and Rossby wave propagation. Mon. Weather Rev. 1999, 127, 2233–2247. [Google Scholar] [CrossRef]
- Renwick, J.A. Persistent positive anomalies in the Southern Hemisphere circulation. Mon. Weather Rev. 2005, 133, 977–988. [Google Scholar] [CrossRef]
- Oliveira, F.N.M.; Carvalhoc, L.M.V.; Ambrizzi, T. A new climatology for southern hemisphere blockings in the winter and the combined effect of ENSO and SAM phases. Int. J. Climatol. 2014, 34, 1676–1692. [Google Scholar] [CrossRef]
- Kalnay, E. Coauthors, “The NCEP/NCAR 40-year reanalysis project. ” Bull. Am. Meteor. Soc. 1996, 77, 437–471. [Google Scholar] [CrossRef]
- NCEP/NCAR Reanalyses Project. 2016. Available online: http://www.esrl.noaa.gov/psd/data/reanalysis/reanalysis.shtml (accessed on 27 June 2017).
- University of Missouri Blocking Archive. Available online: http://weather.missouri.edu/gcc (accessed on 26 June 2017).
- Center for Ocean and Atmosphere Prediction Studies. Available online: http://www.coaps.fsu.edu (accessed on 21 June 2017).
- Hanley, D.E.; Bourassa, M.A.; O’Brien, J.J.; Smith, S.R.; Spade, E.R. A Quantitative Evaluation of ENSO Indices. J. Clim. 2003, 16, 1249–1258. [Google Scholar] [CrossRef]
- Lupo, A.R.; Bosart, L.F. An analysis of a relatively rare case of continental blocking. Q. J. R. Meteor. Soc. 1999, 125, 107–128. [Google Scholar] [CrossRef]
- Wang, Y.; Lupo, A.R. What does the APO mean? Tellus A Dyn. Meteorol. Oceanogr. 2016, 68, 31779. [Google Scholar] [CrossRef]
- Tilly, D.E.; Lupo, A.R.; Melick, C.J.; Market, P.S. Calculated Height Tendencies in Two Southern Hemisphere Blocking and Cyclone Events: The Contribution of Diabatic Heating to Block Intensification. Mon. Weather Rev. 2008, 136, 3568–3578. [Google Scholar] [CrossRef]
- Jensen, A.D. The Nonequilbrium Thermodynamics of Atmospheric Blocking. Atmos. Chem. Phys. Discuss. 2016. [Google Scholar] [CrossRef]
- Li, J.; Chylek, P.; Zhang, F. The dissipation structure of extratropical cyclones. J. Atmos. Sci. 2014, 71, 69–88. [Google Scholar] [CrossRef]
Figure 1.
A map of the Bolivan Altiplano region and the four weather stations used here. The insets show the region studied compared to the entire country. The four weather stations are; (1) Copacabana; (2) El Alto; (3) Patacamaya; and (4) Viacha.
Figure 1.
A map of the Bolivan Altiplano region and the four weather stations used here. The insets show the region studied compared to the entire country. The four weather stations are; (1) Copacabana; (2) El Alto; (3) Patacamaya; and (4) Viacha.

Figure 2.
The composites for February following the onset of (A) El Niño years; (C) La Niña; (E) Neutral years since 2000; and (B,D); and (F) their differences from the 1981–2010 climatology, respectively. The contour intervals are (A,C,E) 60 dam, and (B,D,F) 10 dam.
Figure 2.
The composites for February following the onset of (A) El Niño years; (C) La Niña; (E) Neutral years since 2000; and (B,D); and (F) their differences from the 1981–2010 climatology, respectively. The contour intervals are (A,C,E) 60 dam, and (B,D,F) 10 dam.

Figure 3.
The 200 hPa wind speed anomalies (m s−1) for (A,C,E) June prior to the years used in Figure 2; and (B,D,F) years corresponding to Figure 2. The contour intervals are 1 m s−1.

Figure 4.
As in Figure 2 except for the composites of all June years for (A,B) negative transitions; (C,D) positive transitions; and (E,F) steady state conditions.
Figure 4.
As in Figure 2 except for the composites of all June years for (A,B) negative transitions; (C,D) positive transitions; and (E,F) steady state conditions.


Table 1.
List of ENSO years used here. The years are taken from [24].
Table 1.
List of ENSO years used here. The years are taken from [24].
| El Niño | Neutral | La Niña |
|---|---|---|
| 1976 | 1977–1981 | 1975 |
| 1982 | 1983–1985 | 1988 |
| 1986–1987 | 1989–1990 | 1998–1999 |
| 1991 | 1992–1996 | 2007 |
| 1997 | 2000–2001 | 2010 |
| 2002 | 2003–2005 | |
| 2006 | 2008 | |
| 2009 | 2011–2013 | |
| 2014–2015 | 2016 |
Table 2.
Character of Southern Hemisphere blocking events per year as a function of region and season for all characteristics since the Wiedenmann et al. (2002) study. The change in the value is expressed as a percentage.
Table 2.
Character of Southern Hemisphere blocking events per year as a function of region and season for all characteristics since the Wiedenmann et al. (2002) study. The change in the value is expressed as a percentage.
| Region | Occurrence | Duration |
|---|---|---|
| Atlantic | 1.8/+81.4 | 6.6/+11.4 |
| Pacific | 11.3/+43.1 | 8.4/+9.4 |
| Indian | 2.5/+181.1 | 7.3/+9.8 |
| Total | 15.9/+59.9 | 8.0/+9.6 |
Table 3.
Character of Southern Hemisphere blocking with respect to ENSO and PDO following [17].
Table 3.
Character of Southern Hemisphere blocking with respect to ENSO and PDO following [17].
| ENSO Phase | Occurrence | Duration | % East Pacific Events |
|---|---|---|---|
| Positive PDO | 1977–1998 | ||
| El Niño (5) | 9.0 | 7.0 | 28 |
| Neutral (15) | 9.5 | 7.1 | 36 |
| La Niña (2) | 6.0 | 6.7 | 45 |
| Total (22) | 9.0 | 7.1 | 34 |
| Negative PDO | 1970-6, 1999-p | ||
| El Niño (8) | 14.8 | 8.4 | 47 |
| Neutral (9) | 16.0 | 7.8 | 37 |
| La Niña (5) | 12.0 | 7.6 | 24 |
| Total (25) | 14.3 | 8.0 | 37 |
Publisher’s Note: MDPI stays neutral with regard to jurisdictional claims in published maps and institutional affiliations. |
© 2017 by the authors. Licensee MDPI, Basel, Switzerland. This article is an open access article distributed under the terms and conditions of the Creative Commons Attribution (CC BY) license (https://creativecommons.org/licenses/by/4.0/).
Share and Cite
MDPI and ACS Style
Lupo, A.R.; Garcia, M.; Rojas, K.; Gilles, J. ENSO Related Seasonal Range Prediction over South America. Proceedings 2017, 1, 682. https://doi.org/10.3390/ecas2017-04140
AMA Style
Lupo AR, Garcia M, Rojas K, Gilles J. ENSO Related Seasonal Range Prediction over South America. Proceedings. 2017; 1(5):682. https://doi.org/10.3390/ecas2017-04140
Chicago/Turabian StyleLupo, Anthony R., Magali Garcia, Katherine Rojas, and Jere Gilles. 2017. "ENSO Related Seasonal Range Prediction over South America" Proceedings 1, no. 5: 682. https://doi.org/10.3390/ecas2017-04140