Toward Sustainability or Efficiency: The Case of Smallholder Coffee Farmers in Vietnam


1
Department of Agricultural Economics, Faculty of Life Sciences, Humboldt University of Berlin, 10115 Berlin, Germany
2
Faculty of Economics, Tay Nguyen University; Dak Lak 630000, Vietnam
3
Faculty of Agriculture and Forestry, Tay Nguyen University, Dak Lak 630000, Vietnam
*
Author to whom correspondence should be addressed.
Economies 2019, 7(3), 66; https://doi.org/10.3390/economies7030066
Submission received: 2 May 2019
/
Revised: 26 June 2019
/
Accepted: 28 June 2019
/
Published: 4 July 2019
(This article belongs to the Special Issue Productivity and Efficiency Analysis)
Abstract
:This study attempts to uncover the truth behind an increasing number of smallholder farmers participating in sustainable coffee farming in Vietnam. Using stochastic frontier and cost-benefit analysis, a sample of 316 smallholder farmers in Dak Lak was chosen to analyze the economic impacts of sustainable and conventional coffee farming on farmers’ welfare. In addition, we conducted field observation and key informant interviews to describe several farming practices. The results highlight the fact that farmers’ decisions to participate in sustainable coffee farming are mainly driven by economic benefits. Sustainable farming is more cost-effective and profitable than conventional farming, despite the insignificant difference in production efficiency. Improvement of education, farming knowledge, and collective actions could mitigate negative effects of small-scale production for sustainable coffee farmers. Pesticide management, shade coffee encouragement, and reduction of excessive fertilization, over-irrigation, and unproductive coffee varieties are recommended for sustainable development of the sector.
1. Introduction
Despite the fact that Vietnam remains the world’s most competitive coffee producers, thousands of rural coffee farmers are now struggling with price volatility and are losing hope of improving their main source of income. In addition, climate changes such as rising temperature and a longer dry season significantly reduce the land suitable for coffee farming. Further, agricultural intensification such as excessive application of nitrogen-based fertilizers (e.g., urea, generic NPKs) decreases soil microorganism diversity (De Beenhouwer et al. 2014), causes water quality problem (Borbor-Cordova et al. 2006), and produces high N2O emission (Capa Mora et al. 2015). Farmers’ practice of over-irrigation also threatens to deplete the groundwater reserves (Ahmad 2001; Amarasinghe et al. 2015; D’haeze et al. 2005; Technoserve 2013). Deforestation and shade coffee reduction consequently lead to a disappearing refuge for biodiversity (D’haeze et al. 2005; Luong and Tauer 2006; Nguyen and Sarker 2018). Besides, 20 to 30 years old Robusta (Coffea canephora), which accounts for over 30 percent of total coffee plantation has even pushed smallholder farmers into credit trap. In response to these challenges, coffee farmers are encouraged to join sustainable coffee programs in order to ensure stable production, manage environmental resources in a sustainable manner, and to increase earnings. However, less than 10% of Vietnam’s coffee production was certified or verified sustainable by the end of 2012 (Mistiaen 2012). The main reasons behind farmers’ attendance or absence in sustainable coffee farming depends on coffee price premium and market access. In this regard, the question of whether sustainable farming has significantly contributed to farmers’ welfare is left open.
In brief, sustainable production standards seek to reduce or eliminate environmental and social problems (Haggar et al. 2017). Hence, sustainable coffee farmer needs to improve their farming management practices to comply with program standards (Hajjar et al. 2019). Accordingly, sustainable production has not only offered better quality product but also price premiums, better market access, and improved on-farm efficiency or productivity for farmers (Daviron and Ponte 2005; Giovannucci and Ponte 2005; Ponte 2002; Raynolds et al. 2007). However, several studies have identified different impacts of sustainable production on farmer welfare. (Milder and Newsom 2015) found out that Rainforest certified farmers achieved more productivity and profitability than did non-certified farmers. On the other hand, (Van Der Vossen 2005) suggested that organic coffee production has brought lower yields and farmer income compared with conventional farming. Despite many positive impacts in preserving forest and providing important refuge for biodiversity (Moguel and Toledo 1999; Perfecto et al. 1996; Tadesse et al. 2014; Wunderle and Latta 1996), less productive shaded coffee systems in sub-Sahara Africa and Latin America are rapidly converted into conventional coffee production (Jha et al. 2014). In order to promote the conservation of a shaded coffee system, sustainable certification is set to create preferential prices among buyers (V. Dietsch et al. 2004). Hence, the transformation of coffee production systems is more likely driven by economics performance indicators such as yield, costs, and profitability (Bravo-Monroy et al. 2016).
Empirical studies of efficiency reached out in several aspects of agribusiness sectors. Many authors employed the stochastic frontier analysis (SFA) to measure farmers’ production efficiency and its determinants (Bich Hong and Yabe 2015; Huynh et al. 2011; Swain 2016; Suranjan Priyanath et al. 2018; Islam et al. 2016; Poungchompu and Chantanop 2015; Mango et al. 2015; Ho et al. 2014; Tingley et al. 2005). In these applications of SFA, the separation of inefficiency effects from stochastic elements requires a distributional assumption (Bauer 1990; Bich Hong and Yabe 2015; Ho et al. 2014; Huynh et al. 2011; Islam et al. 2016; Mango et al. 2015; Poungchompu and Chantanop 2015; Suranjan Priyanath et al. 2018; Swain 2016; Tingley et al. 2005). The assumption of half-normal and truncated normal distributions for the inefficiency effects model is frequently used because of the ease of estimation and interpretation (Kirkley et al. 1995). Using this approach, plus cost-benefit analysis (CBA), the aim of this study was on the other hand to provide comparative assessment of economic performance between conventional and sustainable coffee farming in Vietnam. This helps to explain the struggle of coffee farmers to maximize profit under rigorous standardized sustainable farming versus intensive conventional farming. In line with SFA and CBA are discussions of main issues regarding farmers’ compliance to sustainable farming requirements. It is common to assume that coffee farmers are rational in deciding which farming system they would prefer in term of overall benefits. However, changes in farmers’ welfare could be significantly different because production intensities, yields, production costs and coffee price vary between two coffee farming systems (Bacon 2005; Daviron and Ponte 2005). Therefore, the nature of this study is to guide policymakers to make decisions towards the promotion and conservation of sustainable coffee farming in Vietnam.
This study used the sample of 316 coffee farmers in Dak Lak province, Vietnam. Prior to SFA and CBA, we conducted a semi-structured questionnaire, key informant interview, and document analysis to elicit several aspects of farmer socioeconomic characteristics, farming practices, factors of production, problems and concerns regarding sustainable production management. The structure of this paper consists of four sections, as follows: the first section provides the literatures on efficiency and stochastic frontier production function. The next section outlines the overview of research area, data collection method, and empirical model. The main findings and discussion, conclusion, and the direction of future research are in the final sections.
2. Materials and Methods
2.1. Theoretical Framework
Measurement of economic efficiency (EE) can be decomposed into technical efficiency (TE) and allocative efficiency (AE) (Farrell 1957). According to Coelli et al. (2005), technical efficiency refers to the ability to produce as much as possible of one output from a given and obtainable technology, while allocative efficiency tries to use input in optimal proportion with respective prices. There are also two types of technical efficiency: output-oriented efficiency and input-oriented efficiency. The output approach addresses the question of how much a firm can increase its output while keeping its inputs unchanged. On the other hand, the input approach aims to answer the question of how much a firm can reduce its inputs while keeping its outputs fixed (Coelli et al. 2005). The efficient frontier is known as either an output orientation or an input orientation (Tingley et al. 2005).
The two methods widely used in the existing literatures to measure efficiency of production are data envelopment analysis (DEA) and stochastic frontier analysis (SFA). (Charnes et al. 1978) first proposed data envelopment analysis (DEA) considered as a non-parametric approach or mathematic programing. Its advantage is that multiple inputs are converted into multiple outputs, especially when inputs and outputs can be quantified using different units of measurement. DEA is commonly used, because efficiency is easy to compute and does not require a functional relationship between inputs and outputs. However, DEA approach cannot separate the effects of noise and inefficiency during the calculation of technical efficiency (Coelli 1995). SFA approach is stochastic and parametric, which was independently and simultaneously proposed by Aigner et al. (1977) and Meeusen and van den Broeck (1977). In this paper, we apply the SFA estimation approach for the following reasons. First, one of the advantages of SFA approach is its ability to separate the effects of noise with the effects of inefficiency and avoids confounding the effect of misspecification of functional form with inefficiency (Coelli et al. 2005). Second, SFA can provide the statistic tests of the variables determining efficiency. Third, coffee production in the chosen study area is characterized as single output and multiple-input production. Fourth, the measure of farm specific inefficiency is not in relation to the most productive farm, as it is in DEA approach. However, the biggest disadvantage of SFA approach is that it requires one to make assumptions regarding the functional form of the inefficiency effects model.
Under stochastic production framework, recent applications of SFA used either single-step (Coelli et al. 2005; Huang and Liu 1994) or two-step procedure (Pitt and Lee 1981) to analyze the determinants of technical efficiency. According to (Coelli 1995), there is a significant problem in the two-step procedure. In this regard, the assumptions of inefficiency effects used in either stage are violated as they are assumed to be independently and identically distributed in the first stage, while in the second stage inefficiency effects are assumed to be a function of a number of farm-specific factors, which implies that they are not identically distributed. This inconsistency problem and specification of stochastic frontier models were also in research papers of (Kumbhakar et al. 1991). Therefore, the application of one-step approach proposed by Battese and Coelli (1995) allows exogenous variables to incorporate directly into the efficiency error component (Huang and Liu 1994; Reifschneider and Stevenson 1991). The production frontier model proposed by Battese and Coelli (1995) is below:
where yi is the production of the ith farm as i = 1, … n; xij is the vector of j inputs used by ith farm; βj is a vector of parameters to be estimated; Vi − Ui is the error term. The symmetric randomness Vi (i.e., two-side error) captures the effects of statistical noise, which are assumed to be independently and identically distributed as [Vi ~|N (0,)|]. The non-negative randomness Ui (i.e., a one-sided residual) causes technical inefficiency in the production of ith farm, which are assumed to be independently and identically distributed as [Ui ~|N (0,)|].
yi = f(xij; βj) · exp(Vi − Ui)
SFA uses a composed error model that contains several possibilities regarding the specification of the inefficiency term, which is usually assumed to follow a truncated-normal (Stevenson 1980), half-normal (Aigner et al. 1977), exponential (Meeusen and van den Broeck 1977), or gamma (Greene 1980, 1990; Greene 1993). These specifications hold a strong assumption that it is independent of random deviation term and the other regressors (Parmeter and Kumbhakar 2014). However, there is no priori justification for the choice of any specific distributional form of technical inefficiency, as different specifications lead to different estimates of cost inefficiency (Førsund et al. 1980). In practice, this choice was made for reasons of computational convenience. Therefore, if Ui equals to zero, the farm’s technical inefficiency is nonexistent (i.e., the farm obtained the maximum output with the set of given inputs) and vice versa. The two noise components Vi and Ui are also assumed to be independent together. The deterministic production function is written as f (xi; β), while [f (xij; βj).exp {Vi}] is the stochastic production frontier.
Technical efficiency of the ith farm can be determined by using the following equation:
The TE score is between zero and one. A farm is fully efficient if it equals to one and fully inefficient if its value is zero. The TE score smaller than one provides a measure of a shortfall of observed output from maximum feasible output in an environment characterized by exp {Vi}, which is allowed to vary across farmers.
The ratio variation parameters γ that relates to the variability of Ui to total variability δ2, defined by the following equation:
The parameter gamma (γ) can range between zero and one, explaining the impact of inefficiency factors on the independent variable. If γ equals to zero, the difference between actual farmer yield and efficient yield is due to statistical noise. Meanwhile, the value close to one implies that the random component of the inefficiency effects makes a significant contribution to the analysis of the production system.
The technical inefficiency effects (Coelli and Battese 1995) are defined as:
where the non-negative randomness Ui are assumed to be independently and identically distributed as [Ui ~|N (0,)|]. One aspect of using truncated normal is the implications it presents regarding inefficiency for the industry as a whole. The truncated normal density has mode at 0 only when μ ≤ 0, but otherwise has mode at μ (Parmeter and Kumbhakar 2014). As the truncated normal distribution reduces to the half-normal distribution on Ui when μ = 0, the estimation of provides the average level of technical inefficiency in the sample (unconditional mean of Ui). However, if interest lies in the level of inefficiency for a given farmer, knowledge of is not enough, because it does not contain any individual farmer-specific information. It is worth noting that the truncated normal distribution depends on two parameters; μ and , which affords more flexibility in the shape of the density (Parmeter and Kumbhakar 2014). Hence, the identification of the under-performing farmer, or farmers, using the best practices in production, demands for further investigation. In addition, assuming production and distribution shocks, estimation results do not entirely represent inefficiency. The solution for these concerns is the JLMS (Jondrow, Lovell, Materov & Schmidt) efficiency estimator that was first proposed by (Jondrow et al. 1982). The method is to estimate Ui from the expected value of Ui conditional on the composed error of the model εi ≡ Vi − Ui. The composed error contains individual farmer-specific information leading to the observation-specific value of the inefficiency from conditional expectation. Since the conditional density function (Jondrow et al. 1982) of Ui given εi is known, we can derive observation-specific of the efficiency index (Battese and Coelli 1988). The efficiency index ranges between 0 and 1, with a value of 1 indicating a fully efficient farmer.
TEi = exp(−Ui)
2.2. Research Area
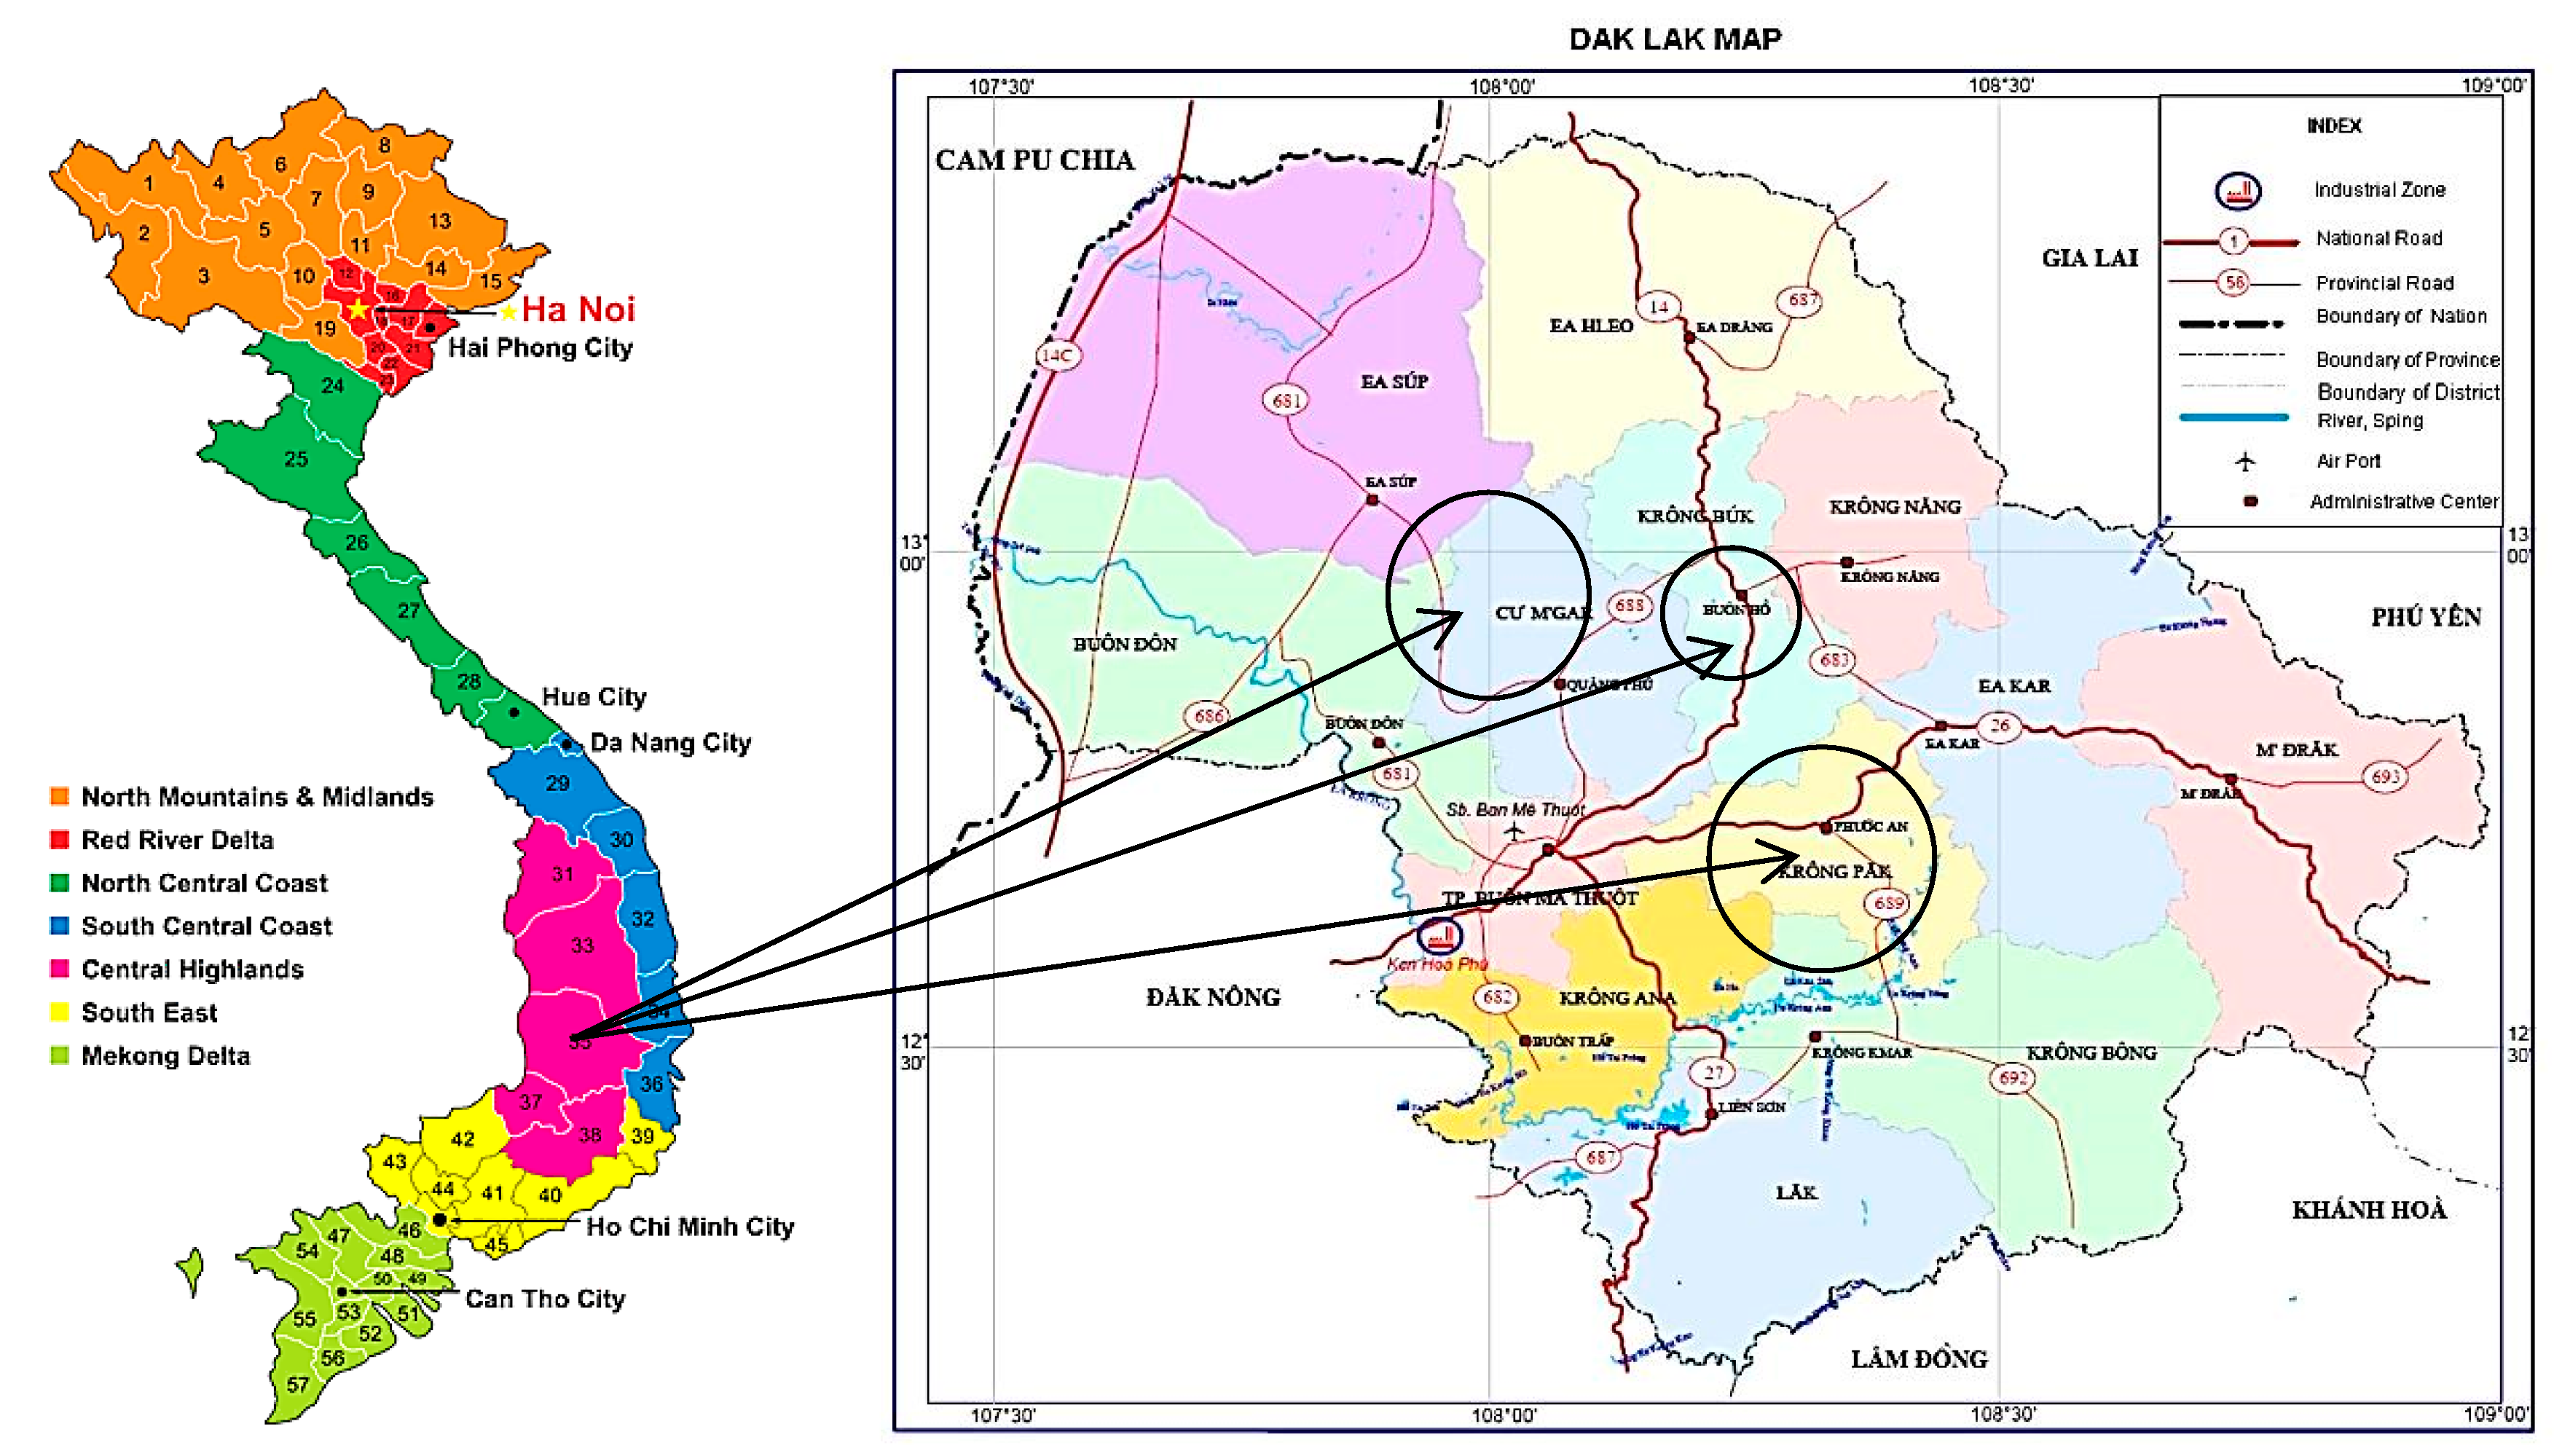
The study was conducted in the Dak Lak province, Vietnam. The Dak Lak province is located in the western end of Truong Son Range, Central Highland (Figure 1). The provinces’ geographic coordinates are from 107°28′57″ to 108°59′37″ east longitude and from 12°9′45″ to 13°25′06″ north latitude with an average elevation about 400–800 m. The total land area of the province are 13,125.37 square kilometers endowed with Acrisols, Ferralsols and other types of soil, such as Fluvisols, Gleysols, and Luvisols, etc. The climate of the whole province is significantly different in two sub regions. The North West is hot and dry, and the South East is cool and pleasant. There are two distinct seasons in Dak Lak, rainy and dry season. The rainy season starts from May and ends in October with 90% of annual rainfall. The dry season appears from November to April next year with a negligible amount of rainfall. The whole province consist of six agro-ecological zones that including Ea Sup plateau sub-region (28.43% of natural area); Buon Me Thuot–Ea H’Leo plateau (16.17%); M’Drak hill and plateau (15.82%); Krong Ana–Srepok river plateau (14.51%); Chu Yang Sin mountainous area (3.98%); and Rlang Dja mountainous area (3.88%). The river-lake networks in Dak Lak are described as three river system distributions (Srepok River, Ba River, and Dong Nai River) along with hundreds of reservoirs and 833 streams with a length of more than 10 km. Due to unique geographical location and favorable natural conditions with rich basaltic soil and high altitude, Dak Lak has been the center of coffee production in Central Highland regions, accounting for more than 30% of total coffee production area in the whole country. Coffee trees in Dak Lak can grow strong and provide cherries with high quality and distinctive flavor. With the brand name Buon Ma Thuot coffee, Dak Lak symbolizes as the world top producer of Robusta coffee. Up to now, the coffee sector in Dak Lak has provided employment for over 400,000 rural labors, which greatly contributes to the economic and social development of the region.
2.3. Data Source and Sampling
This study used both primary and secondary sources to collect quantitative and qualitative data. The methods of data collection were direct interview, key informant interview, and field observation in 2017 crop year. The survey covered 350 farmer households, however, final 324 questionnaires were completed due to the response rate was 92.57%. However, eight cases having five or more missing values were excluded from data filtration (cross tabulation and ANOVA). Therefore, the final empirical estimation was based on 316 sample farmers. We designed the semi-structured questionnaire into several sections. First, the respondents provide the information regarding the socio-economic characteristics of the farmer household, such as age of farmer, gender, education level, ethnic group, farming experience, household size, farm size, household labor, cooperative membership, access to extension services, and investment in coffee production. The second section focuses on coffee farming practices and input management. Production cost and farmers’ income generated from coffee production are in the third section (i.e., NPK fertilizer, organic fertilizer, manure, pesticide, irrigation water, hired labor, family labor, depreciation of assets, other costs of production, and coffee sale volume and selling price). The final section uncovers the farmers’ problems and concerns related to sustainable farming (pest and disease control, inputs management, access to credit, access to extension service, market access, collective actions, etc.). We conducted interviews at the farmers’ home, operational place or at the field. The observation was supplementary to the interviews, which is described as “unobtrusive observation” (Robson 2002). Key informants were selected via a process of “theoretical sampling” (Glaser and Strauss 1967) based on their potential to offer distinct and important perspectives on the overview of coffee farming in Dak Lak and recent issues regarding sustainable certified production. The key informants involved Dak Lak People Committee and DARD officials, WASI (Western Highlands Agro-Forestry Scientific and Technical Institute) staffs, Buon Ma Thuot Coffee Association (BMTCA) members, and heads of village. Furthermore, reports and documents regarding Dak Lak coffee sector were collected from local DARDs, WASI (Western Highlands Agro-Forestry Scientific and Technical Institute), Buon Ma Thuot Coffee Association (BMTCA), and VICOFA (Vietnam Coffee Cocoa Association).
In this study, we employed a two-stage sampling method. The first stage involved a purposive sampling of 350 coffee farmers that have been practicing sustainable coffee farming from Krong Pak, Cu M’gar, and Buon Ho districts of Dak Lak. In this area, coffee production is the main source of farmers’ income. The second stage was to identify the sustainable certified and non-sustainable certified (conventional) farmers. In the sample selection process of sustainable certified coffee farmers, we consulted official experts in local authorities, extension center, and Dak Lak Department of Agriculture and Rural Development (DARD). The heads of each local village are also involved in the finalizing process of respondents list.
2.4. Data Analysis and Model Specification
Methods of data analysis such as descriptive statistics; cross tabulation and chi-square test; t-test were utilized by Statistical Package for Social Sciences (SPSS 22.0). Another statistic program Frontier 4.1 (Coelli 1996) was used to obtain maximum likelihood estimates of a subset of the stochastic frontier production and cost function. Pooling the sample sustainable and non-sustainable coffee farmers and regressing with output would give the impact of farmers’ participation in sustainable coffee production on productivity. However, the results of Chow test (F = 2.304, Probability >F = 0.013) suggested that the sample should be split (Table A2). Accordingly, two separate regression models were specified for sustainable certified farmers and non-sustainable certified farmers. However, sample selection might be an issue, because there exist unobservable variables that are correlated with both Wi and Vi, which would lead to bias estimates of stochastic production frontier. According to (Greene 2010), the choice of technology (if based on some aspect of inefficiency) is influenced by correlation between Wi and Vi (random error), then, the different form of sample selection issues arise.
In order to obtain unbiased estimates, we conducted a number of test statistics. First, a multicollinearity test was done using the variance inflation factor (VIF) and Eigen values and the results ruled out the presence of multicollinearity among the independent variables. The VIF procedure applied to detect multicollinearity was preferred over the correlation coefficient method, which fails to yield conclusive results (Pindyck and Rubinfeld 1981). If the VIF is greater than 10, then there is a potential multicollinearity problem (Wurst et al. 1989). The variance inflation factor (VIF) ranges from 1.212 to 2.659 and 1.235 to 5.528 in SCP and non-SCP model. Similarly, the tolerance values range from 0.376 to 0.825 and 0.181 to 0.810 in SCP and non-SCP model. Eigen values for SCP and non-SCP model are 17.971 and 18.169, respectively (Table A1). No serious multicollinearity problems among variables in the sample were detected by the VIF test. Second, the Koenker test was employed to detect the presence of heteroscedasticity and the test result indicated no problem of heteroscedasticity (P-value = 0.196 and 0.620 for non-SC and SC model respectively). Ignoring the heteroscedasticity of Vi and Ui might cause biased estimates of technical efficiency as well as the frontier function parameters (Parmeter and Kumbhakar 2014).
The stochastic frontier production function used to specify the technology of the coffee farmers was described as below. All parameters in the models were computed by the one-stage estimation under the Frontier 4.1 Program.
where subscript i refers to the ith coffee farm in the sample; yi is the coffee yield (ton/hectare); xij are j (j = 1, …, 9) input variables per hectare used by ith farm, which refer to nine independent variables; and all other variables are as defined earlier. Accordingly, x1 is NPK fertilizer (1000 VND/hectare), x2 is organic fertilizer (1000 VND/hectare), x3 is manure (1000 VND/hectare), x4 is pesticide (1000 VND/hectare), x5 is water (1000 VND/hectare), x6 is hired labor (man-days/hectare), x7 is family labor (man-days/hectare), x8 is depreciation (1000 VND/hectare), and x9 is other cost (1000 VND/hectare). The technical inefficiency effects (Coelli and Battese 1995) are defined as:
where Zi are farm-specific variables (i = 1, 2, …, 11). Among others, Z1 is age of farmer (years). Z2 is gender (dummy). Z3 is education level (years in school). Z4 is ethnic group (dummy). Z5 is farming experience (years in coffee production). Z6 is household size (number of household member). Z7 is farm size (hectare). Z8 is ratio of labor to land (labor/land). Z9 is cooperative membership (dummy). Z10 is access to extension services (dummy). Z11 is formal credit (million VND). δ0 is the intercept of the model. δi denotes the unknown parameters to be estimated. Variable Wi is a random error, defined by the truncation of the normal distribution with mean zero and variance.
ln(yi) = β0 + ∑βj ln(xij) + Vi − Ui, i = 1, 2, ..., n
|Ui| = δ0 + δ1Z1 + δ2Z2 + δ3Z3 + … + δ11Z11 + Wi
The use of generalized likelihood ratio test is essential to examine assumption related to model specification. The hypothesis was that all coefficients of the inefficiency effect model were simultaneously equal to zero (H0: = δ0 = δ1 = δ3, …, = δ11 = 0). This is to test whether the explanatory variables in the inefficiency effects model contribute significantly to the technical inefficiency variations among coffee farmers. The generalized likelihood-ratio test statistics is defined by the following equation:
where L (H0) is the value of the log likelihood function of a restricted frontier model specified by a null hypothesis H0; and L (H1) is the value of the log likelihood function of unrestricted model (alternative hypothesis). The test statistics has an X2 or mixed X2 distribution with degree of freedom equal to the difference between the number of parameters involved in H0 and H1. The likelihood-ratio test statics were found to be greater than critical values (93.616 and 27.499 for SC and non-SC model). Hence, the null hypothesis of no inefficiency effects in coffee production was rejected for both SC and non-SC farmers. An analysis of cost and revenue of the coffee farm based on gross margin is to determine whether the sustainable certified farmer is profiting from coffee production more than the non-sustainable certified. The gross margin and rate of return are given as:
λ = −2log [L (H0)/L (H1)]
GM = TR − TVC
ROR = GM/TVC
GM, TR, TVC, and ROR indicate gross margin, total revenue, total variable cost, and rate of return, respectively.
3. Results
3.1. Socioeconomic Characteristics of Coffee Farmer
Table 1 presents the descriptive statistics of specific socio-economic characteristics for surveyed coffee farmers in two different farming systems. These were sustainable certified coffee production (SC) with 183 surveyed farmers and non-sustainable certified coffee production (non-SC) with 133 surveyed farmers. The frequency analysis showed that 33.3% of SC farmers and 30.1% of non-SC farmers were female. Kinh-ethnic farmers (80% of the SC farmers and 63.2% of the non-SC farmers) dominated coffee farming in both farming systems. The total 32.8% of SC farmers and 51.9% of non-SC farmers were members of cooperatives. Farmers in both groups also had access to extension services (56.8% of SC farmers and 28.6% of non-SC farmers).
The average age of SC farmers and non-SC farmers were 44.6 and 43.08. SC farmers acquired a slightly higher educational level than non-SCP farmers did. The average years of educational level were 9.66 for the SC farmers and 9.17 for the non-SC farmers respectively. Farming experience for the SC farmers and non-SC farmers were 8.74 years and 16.21 years on the average. This is because more farmers at a younger age tend to participate in the SC program in Dak Lak, while the older ones are satisfied with conventional farming. Coffee farmers cultivated in the average area of 1.4 hectare under the SC system and 1.61 hectare under the non-SC system, which indicates a small-scale operation in both farming systems. The average household sizes of coffee farmer in both systems were not significantly different (4.7 for the SC and 4.63 for the non-SC). They financed their coffee production activities by the average formal credit of 51.923 million and 59.887 million VND (Vietnamese Dong) in the SC and non-SC systems. The farmer’s average labor-land ratios in both SC and non-SC systems were 2.26 and 2.47, respectively (Table 2).
3.2. Coffee Farming Practices
There are four popular types of sustainable certified coffee in Dak Lak including 4C (Common Code for the Coffee Community), UTZ Certified, RFA (Rainforest Alliance), and Fair trade. The widespread implementation of certified coffee production was initiated by large processors/exporters (Armajaro, Thang Loi, Phuoc An, Dak Man, Nedcoffee, Volcafe, MTV, Trung Nguyen, Intimex, 2/9, An Thai, etc.) those who have made efforts to integrated coffee farmers into their own supply system. By the end of 2014, the total number of farmers involved in sustainable certified coffee production was 49,680, which covers an area of 67,808 ha with total output of 222,711 tons. Accordingly, this accounts for 33.3% of the total coffee land area and 48.2% of total coffee yield in Dak Lak. 4C was the most popular certification with 32,706 farmers and an area of 43,802 ha, resulting in production of 141,447 tons. UTZ Certified accounted for 12,937 farmers and an area of 17,446 ha with production of 55,840 tons. The total 3823 farmers followed RFA certification, which accounts for an area of 6143 ha with production of 23,793 tons. Finally, there was only a small number of 214 farmers who applied the Fair Trade certification in an area of approximate 417 ha with production of 1631 tons (DakLakDARD 2016). The initial success of sustainable coffee production has brought many benefits for coffee farmers in term of production risk mitigation, quality product improvement, and better market access. However, many farmers have still not paid much attention to the application of organic fertilizer, bio-diverse farming practices, and coffee agro-ecosystem in their farm. We discussed the details of different coffee farming practices in term of replantation, coffee varieties, fertilizers application, irrigation, coffee pruning, pest and disease management, and use of shade trees in the coffee farm in the following sections.
3.2.1. Replantation
In 2013, People’s Committee of Dak Lak province issued the Decision No. 2729/QD-UBND in order to replant 27,775 ha, which were estimated areas of old, low-yield, and poor-quality coffee. The specific plan from 2014 to 2020 was 3758 hectares in 2014, 4423 hectares in 2015, 3497 hectares in 2016, 3769 hectares in 2017, 4259 hectares in 2018, 4110 hectares in 2019, and 3959 hectares in 2020 (DakLakDARD 2016). In this program, Dak Lak DARD updates the progress of coffee replanting on a daily basis through reports of the local DARDs. Despite the provincial efforts, the replanting process has been facing many challenges, especially the farmers’ shortage of capital, lack of technical assistance, and usage of old varieties. According to Dak Lak AgriBank, a small amount of money in coffee-replanting credit contracts were disbursed for coffee farmers and disbursement schedule was not aligned with cropping season (DakLakDARD 2016). It is ironic that coffee replanting needs a large investment of 160–230 million VNDs per hectare (approximately a three times investment for a crop year). In addition, most of ethnic minority farmers in remote areas are now facing a lack of capital, but are not eligible for loans, which hamper their efforts to replace old and unproductive trees. Besides, farmers who were able to go on with replantation still used the same old varieties, while good cultivars only account for about 10%. Furthermore, the replantation success rate depends on whether farmers continue with short-term crop rotation from two to three years after uprooting old coffee trees or replant immediately. In fact, farmers shortened the conversion period by using bio-nutrients (i.e., Emina, Rootbio, Bio99, Kurojiru) for soil quality improvement, which resulted in lower yield and coffee quality.
3.2.2. Coffee Varieties
According to Dak Lak DARD, the use of old coffee varieties is common practice. Old varieties are not resistant to Hemileia vastatrix disease, yet also provide the bean weight of merely 13–15 g. Most varieties in the certified production areas were still old varieties accounting for approximate 80%, while cultivars accounted for only 13.6%. The certified production area of new varieties (TR4 and TR9) with high yield only accounted for 6.4%, even though these varieties significantly influence coffee yield and quality. To widen the choices for farmers, WASI has recently supplied the high-yield clonal Robusta coffee lines such as TR5, TR6, TR7, TR8, TR11, TR12, TR13, TR14, TR15, and TR16 (Bau 2015). These clones provide the productivity of 4–6 tons per hectare with good quality bean and percentage of R1 seed-size over 80%. They are also highly resistant to Hemileia vastatrix disease, ripen evenly, and are suitable to the natural conditions of the province. In addition, late ripening varieties were used, such as 2/1, 12/1, and 11/12, which could lengthen the harvest time to December. This is convenient for harvesting, drying, and reducing the amount of watering for coffee in the dry season.
3.2.3. Fertilizer
Dak Lak DARD and WASI have recommended coffee farmers the amount of fertilizer for one hectare of Robusta coffee grown in the Central Highlands red basaltic soil. With a productivity of 3 tons per hectare, farmers should apply 220–250 kg of nitrogen (N), 80–100 kg of phosphorus (P205), and 200–230 kg of potassium (K2O) (Bau 2015). If the productivity is more than 3 tons per hectare, coffee farmers must apply an additional amount of 70 kg N, 20 kg P205, and 70 kg K20 for additional 1 ton per hectare. On the other way around, if coffee productivity reaches about 4 tons per hectare, farmers should apply 220–230 kg N, 75–80 kg P205, and 230–240 kg K2O with additional 5 tons of manure, 60–70 kg of Calcium (Ca), and 30–40 kg of Magnesium (Mg) (Bau 2015). In fact, coffee farmers still fertilized higher than the yield level. Farmers excessively used 10% of nitrogen (34 kg per hectare), 20% of phosphorus (34 kg per hectare) and 3% of potassium (10 kg per hectare) (DakLakDARD 2016). However, using excessive amount of NPK fertilizer helped farmers to save labor cost of tillage. Estimated numbers of tilling after fertilizer application for four times per year were about 12–16 man-days per crop year. Farmer barely used organic fertilizers, because they are more expensive and do not bring a high coffee yield. Intensive farmers also used an addition of bioactive micro nutrition such as sulfur (S), zinc, and bore, which bring coffee yield improvement and could cure leaf curling and falling on coffee plant.
3.2.4. Irrigation
Unlike the other coffee growing regions in the world, the dry season in Dak Lak lasts 5 to 6 months starting from November to April of the following year. Water is crucial for growth of the coffee during dry season. Irrigation has become a decisive measure to coffee yield. Many studies suggested that water stress with lower irrigation could still ensure expected coffee yield (Amarasinghe et al. 2019; Amarasinghe et al. 2015; Crisosto et al. 1992). During the cherry development period, coffee farmer should irrigate 390 L/plant/round with the cycle of 22–24 days/round for coffee with average yield of 3.5 tons/ha. If the cycle is 30 days/round, the amount of irrigation water should be equivalent to 530 L/plant (Bau 2015). However, the reports of Dak Lak DARD show that more than 80% of coffee farmers irrigated an average of 400–600 L/plant/round. The number of farmers with low irrigation was 12.67% and about 7% irrigated more than 600 L/plant/round. This increased irrigation cost and caused misuse of water resources. Although dripping irrigation has many advantages such as: suitable for the coffee plant physiology, saving about 20% of water and fertilizer, and reducing labor cost, many coffee producers however refused to apply this, because it requires a large investment. About 60% of coffee growers applied the dripping irrigation method and a few applied sprinkler irrigation due to significant high investment. Further, the capacity of the existing irrigation system in the province only met 26% of the total coffee area, which led to massive drilling of wells during the times of drought. This is seriously depleting the groundwater reserves (DakLakDARD 2016).
3.2.5. Pruning
In coffee growing, pruning is a compulsory technique with the aim of creating a balanced canopy of coffee trees, fully exploiting the individual space of each tree, creating a balance between growth, flowering, fruiting, and stable yield. There were two main coffee pruning methods in Dak Lak that are multi-stemmed pruning (with products mainly harvested on basic stems) and single stem pruning (cutting off the plant top at a height of about 2 m with the main product harvested on secondary stems) (Bau 2015). In the condition of adequate irrigation in the dry season, Robusta coffee plants in Dak Lak are able to generate many secondary stems (level 2 and level 3), which is technically suitable for single stem pruning. When pruning a single stem, farmers kept coffee trees at a height of about 2 m, creating favorable conditions for cutting, pest control, and harvesting. Application of single stem technique allowed Dak Lak coffee farmers to exploit local advantages such as fertile soil, low labor cost, and high intensive farming. Therefore, most of household farmers in the province applied single stem pruning method. However, this method requires large labor cost of an average of 30 to 40 man-days/hectare/crop year. In fact, many farmers in Dak Lak were still pruning based on own experience (35.4% of the coffee area). This leads to improper structure of stems that reduces productivity.
3.2.6. Pest and Disease Management
Farmers’ coffee pest and disease management was based on multi sources of information such as own experiences, advices from local pesticide agent, different training program, or other coffee farmers. Dak Lak DARD reports that approximate 78.5% of farmers used pesticides through self-experience and only 21.5% could apply IPM skills acquired from the training. The percentage of farmers using chemical pesticides was 96%, while only 4% used bio-pesticide. Coffee farmer using pesticide two times in crop year accounted for 45% of the total. The decrease rate of pesticide overuse plus pesticide use only at the pest and disease outbreak indicates that farmers have changed their awareness. Better pest and disease management not only helped farmers to save the cost of using pesticides, but also contributed to environmental protection and farmers’ welfare. However, there were still over 60% of coffee farmers in the province using pesticides for the entire farm even if pests or diseases only occur in small production area (DakLakDARD 2016). In recent years, the situation of pests and diseases threatening coffee production has been complicated. Some major pests on coffee trees include Saissetia hemisphaerica, Planococcus kraunhiea, Coccus viridis, Planococcus lilacinus, Stephanoderes hampei, Xyleborus morstatti, Cephonodes hylas, and Toxoptera aurantii, etc. Accordingly, major diseases such as Hemileia vastatrix, Colletotrichum, Pratylenchus coffeae, Fusarium oxysporum, Fusarium, Corticium salmonicolor, Rhizoctonia solani, Cercospora coffeicola, and Colletotrichum were still major challenges for sustainable coffee farmers. Besides, the pest and disease managerial skills and knowledge of local DARDs officials and consultants (pesticide agents) are still limited.
3.2.7. Shade Trees
Shade trees regulate the humidity of coffee plants and improve water retention and nutrients in the deeper soil horizon. The shade tree also restricts light and radiating (Van Long et al. 2015), regulates the temperature, and limits the destruction of soil texture (Perfecto et al. 1996). Besides, deep-rooted trees do not compete with the coffee for water and other nutrients. Many researches also highlight the positive impacts of shade trees on coffee yield (Brombini Santos and Mazzafera 2012; Staver et al. 2001) and disease control (Soto-Pinto et al. 2002; Staver et al. 2001). However, most of the coffee production area in Dak Lak has no shade trees. Currently, the area of shade coffee production in the province only accounted for 35.47% (DakLakDARD 2016). In fact, many farmers in Dak Lak were not aware of the important role of shade trees. Selected shade trees were avocado, acacia, sennaha, leucaena, macca, durian, pepper, etc. In shade coffee farming, for example, pepper was intercropped with acacia trees with a distance of 9–12 × 3 m and density of 280–370 pillars per hectare, durian trees was planted with a distance of 12 × 9 m and density of 92 trees per hectare, and avocado or macca trees with density of 60–100 trees per hectare (Bau 2015). The low percentage of shade coffee area was one of many reasons contributing to the unsustainable coffee production in Dak Lak.
3.3. Factors of Production
According to Dak Lak DARD, the problem of low-quality inputs often causes large expenses on bad harvest for smallholder farmers in coffee production. Table 2 presents the statistically significant differences of inputs used between sustainable certified (SC) and non-sustainable certified (non-SC) coffee system. On the average, the largest expense of 14.6 million VNDs/ha was for NPK fertilizer, which accounted for 41.1% of total variable cost (TVC) for SC farmers. This cost was significantly higher in non-SC farming system (16.6 million VNDs/ha and 25.5%, respectively). Due to different farming techniques, SC farmers applied twice the amount of organic fertilizer compared to non-SC farmers (6.5 million VNDs/ha vs. 3.2 million VNDs/ha). The proportion of SC farmers’ expense on organic fertilizer accounted for 14.8% of total variable cost, while it was 8.1% for non-SC farmers. Pesticide cost was significantly higher in SC farming compared to non-SC farming (1.788 million VNDs/ha vs. 1.282 million VNDs/ha). Both SC and non-SC farmers used a significant amount of manure to compost with coffee shell, nitrogen, phosphorus and lime powder. This practice helps to improve soil texture, provide organic nutrients, enhance coffee yield, and reduce input costs. In this regard, the proportions of the farmers’ expense on manure for SC and non-SC farming were 13.1% and 9.8%, respectively. As previously mentioned, irrigation is crucial for coffee production, which explains the cost of 3.946 million VNDs/ha (9% of TVC) for SC farmers and 4.556 million VNDs/ha (11.3% of TVC) for non-SC farmers. With lower family labor cost, the SC farmers spent a significantly higher amount of money on hired labor than the non-SC farmers (10.105 million VNDs/ha vs. 6.612 million VNDs/ha). Other costs occur during the coffee production when coffee farmers hire necessary tools, equipment, and machines, or pay different fees, also contribute to a remarkable proportion in the total variable cost. This cost respectively was 1.225 million VNDs/ha and 4.110 million VNDs/ha, which accounted for 2.8% and 10.2% of total variable cost for SC and non-SC farmers. Depreciation of assets for SC farmers was significantly higher than non-SC farmers (2.070 million VNDs/ha/crop-year vs. 1.520 million VNDs/ha/crop-year).
3.4. Coffee Yield
The data in Table 3 reveals wide variation and significant difference in average yields of sustainable certified (SC) and non-sustainable certified (non-SC) coffee farmers. SC farmers obtained an average yield of 3.216 tons/ha, while it was around 2.933 tons/ha for non-SC farmers. The least productive SC farmer could only produce 1.2 tons/ha, while the most productive farmer could reach 5.4 tons/ha. The similar statistics were 0.867 tons/ha and 5.915 tons/ha in case of the non-SC farming system. In term of yield range, there were 21.5% of surveyed SC farmers achieving a yield level lower than 3 tons/ha, while there were 16% for the non-SC farmers. Most of the farmers in both farming systems achieved the coffee yield level from 3 tons/ha to 4 tons/ha (23.7% and 18% for SC and non-SC farmers, respectively). The data also revealed that the number of farmers that could reach the yield level of more than 4 tons/ha was higher in the case of sustainable coffee farming than conventional farming (12.7% and 6% for SC and non-SC farming respectively). This indicates that the sustainable farming system effectively enables farmers to maximize the potential yield of Robusta coffee.
3.5. Maximum Likelihood Estimates
3.5.1. Stochastic Frontier Production Model
The maximum likelihood parameter estimate of the stochastic frontier production model and the inefficiency function for the SC and non-SC coffee production are presented in Table 4. The results indicate that the slope coefficients in the production functions for SC coffee production were positive, as expected. For the SC model, estimated variables NPK fertilizer, organic fertilizer, manure, family labor, and irrigation water had significant positive effects on the variation of the SC coffee output. Partial production elasticity of NPK fertilizer, organic fertilizer, manure, family labor, and irrigation water are 0.409, 0.076, 0.072, 0.080, and 0.105, respectively. The return to scale value was 0.7417, which was the summation of significant estimated parameters. This means that a 1% increase of these variables lead to a 0.7417% increase in SC coffee output. For the non-SC model, NPK fertilizer, organic fertilizer, and hired labor had significant positive effects on the non-SC output. Partial production elasticity of NPK fertilizer, organic fertilizer, and hired labor are 0.456, 0.133, and 0.049, respectively. The return to scale in this case was 0.6387, meaning a 1% increase of these variables lead to 0.6387% increase in non-SC coffee output. The variability in usage of manure, water, and family labor inputs was higher in the SC than the non-SC model. Meanwhile, the variability of using hired labor input was higher in the non-SC than the SC model. Pesticide, depreciation, and other cost had insignificant effects on coffee output in both models. Both production systems were at the stage of decreasing return to scale.
3.5.2. The Inefficiency Effects Model
The variance parameters in the stochastic production frontier are represented by sigma squared (σ2) and Gamma (γ). The estimated sigma squared for SC and non-SC were 0.0491 and 0.0679, which also was significant at 0.05 and 0.01 level. This indicates a good fit and correctness of the specified distributional assumption of the error terms. The Gamma parameters associated with the variance in stochastic frontier production function were estimated to be 0.9179 and 0.7168 for the SC and non-SC model. This indicates 91.79% and 71.68% of the variation in coffee farmers’ output was due to difference in technical inefficiencies in two models, respectively. The null hypothesis was successfully rejected in favor of the alternative hypothesis, which states that the explanatory variables associated with inefficiency effects model are simultaneously different from zero. Hence, these variables simultaneously explain the differences in inefficiency effects among coffee farmers in both SC and non-SC models (Table 4). The results of the inefficiency effects in the stochastic production frontier show that education, household size, cooperative membership, and credit had significant positive effects on technical efficiency of the SC coffee farmers. This means that an increase in educational level, household size, and cooperative membership participation lead to a higher level of technical efficiency for coffee farmers in SC farming system. In addition, estimated variables such as ethnic and credit also had significant positive impacts on technical efficiency of non-SC coffee farmers, which indicates that an increase in ethnic and credit lead to more technical efficient production of non-SC coffee farmers. The estimated coefficients of credit indicate significant positive effects of this variable on technical efficiency in both farming systems.
3.6. Technical Efficiency
Frequency analysis of technical efficiency level indicates the existence of a difference in the efficiency level among farmers in SC and non-SC farming system (Table 5). The statistics reveal that the technical efficiency ranged from 45.5% to 98.0% for SC farmers and 49.1% to 97.2% for non-SC farmers. Most coffee farmers in both systems achieved the technical efficiency score of more than 90% (59% of SC farmers and 59.4% of non-SC farmers). The MLE results show that the average technical efficiency score for SC farmers was 88.24%, which was not significantly different from the average technical efficiency score of 87.69% for the non-SC farmers (from independent samples t test with t = 0.491). This suggests that coffee farmers in both farming systems could increase coffee output by approximately 12% with the same level of inputs if the coffee farmers would have been in their most efficient frontier. Here, SC farmers could reach 9.97% of cost saving (i.e., 1 − 45.5/98.0 × 100) if they achieve the technical efficiency level of their most efficient counterparts. The value of 9.8% of cost saving was calculated for non-SC farmers. The distribution of technical efficiency levels in both farming systems increases in the upper intervals.
The average technical efficiency scores across different farm sizes in Table 6 reveal that there was a direct relationship between farm size and technical efficiency score in the case of SC farmers. The larger farm size, the higher level of technical efficiency the SC coffee farmers could attain. However, the result is consistent with our hypothesis that a large farm-size induces higher technical efficiency level. The pattern was slightly similar in the case of non-SC farmers, as the non-SC farmers with a large farm size obtained the highest technical efficiency of 91.12%, while it was a lower average technical efficiency score for the medium and small farmer in non-SC system.
3.7. Cost-Benefit Analysis
Cost-benefit analysis in Table 7 reveals the significant differences in selling price, total variable cost, and gross margin of SC and non-SC coffee farmers in Dak Lak provinces. However, cost-benefit analysis in this table excluded family labor cost. The rates of returns are supposed to be different if family labor cost are included for both farming systems. The fact is that each farming system requires different labor-intensive needs due to different practices. Through our survey, we were able to ask the farmer to provide the reasonable price per person-day at farm. The approximate calculation of family labor cost was based on expenses on hired labor that the farmer paid at each stage of coffee production during the crop year. Hence, on the average, the significantly different family labor costs for SC and non-SC farmers respectively were 19.027 million VNDs/ha and 24.860 million VND/ha (from independent samples t test with t = −8.749). Family labor cost accounted for 27.8% and 43.7% of the gross margin for SC and non-SC farmers respectively.
SC farmers were able to receive a price premium that was significantly higher than the price received by the non-SC farmers (34.82 thousand VNDs/kg vs. 33.14 thousand VNDs/kg, from independent sample t test with t = 9.236). With the average yields of 3215.77 and 2933.25, SC and non-SC coffee farmers achieved the revenue of 112.35 million VNDs/ha and 97.229 million VNDs/ha. Gross margin per hectare for both coffee-farming systems were 68.365 million VNDs and 56.763 million VNDs respectively. Profit was realized in both systems, but the gross margin was significantly higher in sustainably certified coffee production. However, there was no significant difference in rates of return between these farming systems, as t-statistics was 1.343. As previously explained, inclusion of family labor cost provided significantly different rate of returns of 0.78 and 0.49 for SC and non-SC farmers (t = 7.336). The results suggest that SC farmers were not only able to reduce family labor cost but also more efficient in production. Trading off family labor resource plus excessive use of fertilizer to maximize gross output is no longer a productive practice in this case.
4. Discussion
In order to explain farmers’ struggle for sustainable production, this study estimated technical efficiency of sustainable and conventional coffee farmers in the Dak Lak province of Vietnam using a parametric approach. Technical efficiency levels were found to be insignificantly different in both farming systems (from an independent sample t test with t = 0.491). This is contradictory to our hypothesis that conventional farmers would be more technically efficient due to their excessive inputs uses. The average technical efficiency levels of sustainable and conventional coffee farmer were 88.24% and 87.69%, respectively, which refers to an opportunity for sustainable and conventional coffee farmers to increase 11.76 % and 12.31% in their coffee outputs by applying better practices. In addition, the results indicate that Vietnamese coffee production is relatively more efficient than in Costa Rica (Wollni and Brümmer 2009), Kenya (Kamau et al. 2017), and Indonesia (Widjaya et al. 2017), but less efficient than Cameroon (Nchare 2007) and Nepal (Poudel et al. 2015). The technical efficiency score across farm size confirm that larger coffee production scale achieves higher level of technical efficiency. This contradicts the findings of Bardhan (Bardhan 1973) who stated that small farmers use more inputs due to market imperfection, and hence produce more output.
4.1. Determinants of Technical Efficiency
Existing literatures suggest that several socioeconomic factors might have significant effects on farming efficiency, such as: age of farmer (Binam et al. 2004; Dessale 2018, 2019; Kamau et al. 2017; Sriboonchitta and Wiboonpongse 2004); gender (Bich Hong and Yabe 2015; Sriboonchitta and Wiboonpongse 2004); education (Dessale 2018, 2019; Ho et al. 2014; Tun and Kang 2015); and ethnicity (Gaitán Cremaschi et al. 2018; Ho et al. 2014). In addition, farming experience (Poudel et al. 2015; Sriboonchitta and Wiboonpongse 2004); household size (Bati et al. 2017; Binam et al. 2004; Okoruwa et al. 2006); extension service (Poudel et al. 2015); cooperative membership (Bich Hong and Yabe 2015); and credit (Dessale 2019; O Nyagaka et al. 2009).
In a conventional farming system, a factor positively affecting technical inefficiency for a coffee farmer was age, which indicates that aging farmers are less technically efficient than are their younger counterparts. The result highlights the fact that old farmers neglected to new production techniques under the transition process of the coffee sector, which is consistent with findings of Kamau et al. (2017). However, it is contradictory to Sriboonchitta and Wiboonpongse (2004) and Dessale (2018, 2019) who argued that old farmers with cumulative knowledge, skills, and more farming experience could have efficient use of inputs. Ethnic variable had a significant and negative impact on technical inefficiency, which means increased participation of ethnic minority farmers in the conventional coffee farming leads to higher efficient level of coffee production. The result is similar to findings of Ho et al. (2014) and Gaitán Cremaschi et al. (2018). This contradicts our hypothesis that ethnic minority farms are less favorable for coffee production (Gaitán Cremaschi et al. 2018), for example, most of ethnic minority farmers in remote areas are facing a lack of capital but are not eligible for loans to replace old and unproductive coffee trees (DakLakDARD 2016). Hence, the reason could be farmers’ high dependency on coffee production (Gaitán Cremaschi et al. 2018) or effects of multiple environmental factors (Ho et al. 2014).
In sustainable farming system, variable education had a negative and significant effect on inefficiency of sustainable coffee farming, hence a higher-educated farmer is more technical efficient in sustainable farming system. This result is similar to the findings of Ho et al. (2014), Dessale (2018, 2019), and Binam et al. (2004) at the point that farmers benefit from schooling through higher level of technical efficiency. Well-educated farmers easily acquire and utilize skills and knowledge through trainings and successfully transfer it into efficient production. Variable household size had a significant and positive effect on efficiency of sustainable coffee farming, indicating that a larger household farmer obtains a higher level of technical efficiency in sustainable coffee farming. The result refers to the efficient use of family labor in sustainable coffee farming, which significantly contributed to the increase of coffee output (t = 3.8133). For a small household, labor is a family resource or is available at a rate lower than a market rate (Swain 2016). This is also in line with the findings of Okoruwa, Ogundele, and Oyewusi (Okoruwa et al. 2006), Bati et al. (2017), and (Ateka et al. 2018) who stated that the coffee sector is labor-intensive and family labor resource can help to exploit the existing potential for increasing efficiency. The cooperative membership variable was negatively associated with technical inefficiency, which indicates the positive spillover effects on efficient production in the sustainable coffee farming. The result is in line with findings of Bich Hong and Yabe (2015) that participation in cooperative enable efficient production through better farming techniques, inputs management, pest and disease control, market access, and knowledge exchange with other farmers. In both farming systems, variable credit had a positive and significant effect on efficiency of coffee production. Credit availability enables farmers to make a timely purchase of inputs regarding production cycle. Otherwise, shortage of liquidity leads to farmers’ misuse of proper fertilizer, pesticide, or recommended varieties in coffee replantation. Ho et al. (2014), Binam et al. (2004), Nyagaka et al. (2009), and Dessale (2019) also found a positive relationship between credit and technical efficiency in their findings, which is in line with this study.
4.2. Factors Influencing Coffee Output
In coffee production, yield is a function of NPK fertilizer, organic fertilizer, manure, pesticide, irrigation water, hired labor, family labor, depreciation, and other cost. For sustainable farming system, NPK fertilizer is the most important input and is positively associated with the coffee yield. For that reason, it accounts for 41.1% of total variable cost. Explanations for direct relationship between the application rate of NPK fertilizer and coffee yield are in the studies of (Castro-Tanzi et al. 2012) and Capa Mora et al. (2015). The estimated coefficient of NPK fertilizer was positive and significant at 1% level, which indicates that with an increase in the use of NPK fertilizer by 0.4092%, the coffee yield increases by 1%. However, excessive use of NPK fertilizer severely causes environmental problem, such as emission of greenhouse gas, soil degradation, and water pollution. Another important factor contributed to coffee yield is family labor. Increasing family labor cost by 0.1053% leads to an increase of coffee yield by 1%. Coffee sector is labor-intensive, and a shortage of skill labor is a common problem, especially during the harvest season. The positive relationship between family labor and coffee output is consistent with the previous findings of this study that larger household are able to utilize family labor resource to obtain higher efficient production. This is also in line with the findings of (Ho et al. 2014). Variables organic fertilizer, manure, and irrigation water altogether have the positive impacts on coffee yield but in approximately similar magnitude. The small impact of irrigation water on coffee yield found in this study is different from findings of Ho et al. (2014) due to environment factors such as rainfall or availability of groundwater.
For conventional coffee farming, NPK fertilizer is also a key factor for coffee farming as its estimated coefficient was 0.4564 and significant at 1% level. Despite that the family labor cost is significantly higher (from an independent sample t test with t = −9.9213), hired labor cost had significant effect on coffee yield at 1% level. This is contrary to sustainable farming that hired labor cost is significantly higher (from an independent t test with t = 5.609). It seems that sustainable farming is family labor cost-effective and conventional farming is hired labor cost-effective otherwise. Use of organic fertilizers is among the key attributes of sustainable coffee production. Organic fertilizers had a great impact on a coffee yield for conventional farmer, which is contradictory to findings of Ho and Niekdam (2016). They argued that there was no direct relationship between coffee output and organic fertilizers in a crop year, but in two years instead. Although irrigation water is increasingly becoming important in conventional coffee production, the effect of irrigation water on coffee yield was insignificant. This implies that irrigation water may be favorable for some farmers, while others find it more difficult. Unreliable rainfall is also another factor that rules out the effect of irrigation water on coffee output for conventional farm (Ho and Niekdam 2016).
4.3. Challenges Facing Sustainable Coffee Production
Detected main issues regarding sustainable coffee production are aged coffee, excessive application of fertilizer, misuse of water resource, and pesticide overuse. First, many pests and diseases are severely harming coffee production such as saissetia hemisphaerica, planococcus kraunhiea, coccus viridis, planococcus lilacinus, stephanoderes hampei, hemileia vastatrix, colletotrichum, pratylenchus coffeae, and fusarium oxysporum. However, coffee farmers inadequately practiced effective pest and disease control. Coffee farmers’ pest and disease management skills are most often based on own experiences. The frequency of 78.5% of farmers who use pesticides by self-experience and the other 21.5% are by knowledge and skills acquired from the training. The major concern is that chemical pesticides are still being used in large scale (96%). Pesticide used in sustainable farming system was ironically higher than the conventional (from independent sample t test with t = 3.55). This practice of excessive pesticide use pose a potential risk to farmers, leads to destruction in agricultural biodiversity, and causes water and soil contamination that is later becoming a major contributor to climate change (FAO 2003).
Second, 15 to 20 years and over 20 years coffee trees still account for 32.88% and 31.48% of the total production despite the efforts of local governments in replantation program. Aged coffees are not resistant to many diseases and provide low yield, while replantation confronts farmers with a large investment (160–230 million VNDs/ha) and patience (2 to 3 years). During the conversion stage, whether farmers should replant, switch to a new crop, or leave the land idle come the second problem. These decisions of farmers are based on future expected price (Cong Thang et al. 2009). In fact, some farmers use soil bio-nutrients (Emina, Rootbio, Bio99, Kurojiru, etc.) to shorten conversion period, which later results in lower coffee yield and quality. Moreover, farmers replanted old varieties (approximate 80%) while good cultivars (higher yield and disease resistance) were not significantly used. This most likely brings coffee farmers back to their struggle at the first place.
Last, overuse of fertilizers and over-irrigation prevail in most coffee areas. Excessive application of NPK fertilizer has been a common habit of coffee farmers in Dak Lak. Coffee farmers overused 10% of nitrogen (34 kg per hectare), 20% of phosphorus (34 kg per hectare) and 3% of potassium (10 kg per hectare). This farming practice not only lead to changes in soil chemistry (acidification or depletion of other nutrient) but also to environmental problems such as eutrophication, greenhouse gases, and nitrous oxide (N2O) emission (Borbor-Cordova et al. 2006; Capa Mora et al. 2015; De Beenhouwer et al. 2014). Further, over-irrigation from pumping groundwater threatens to deplete the whole regions’ groundwater reserves (Ahmad 2001; Amarasinghe et al. 2015; D’Haeze et al. 2003).
5. Conclusions
Under the trend of market-oriented reform and industrialization process, sustainable coffee production provides opportunities for smallholder farmers to integrate successfully into the high value markets. Most farmers realize the positive impacts of sustainable farming in term of economic efficiency, environmental protection, and social welfare. However, farmers’ involvement in sustainable certified coffee production stems from the typical problems of limited access to capital and technical assistance, and competitive domestic buyers. Therefore, a productive coffee farmer could either continue traditional intensive farming due to his availability of resources or adapt the rigorous sustainable practices and look for overall benefits in the future. The results of this study provide evidences that sustainable farming is actually more profitable and cost-effective than conventional farming, although there was no significant difference of production efficiency in both farming systems. Yet, some main issues to question the long-term sustainability of coffee production are excessive fertilization, over-irrigation, aged coffee, and pesticide management. Moving toward sustainability is necessary for Vietnamese coffee industry in term of economic, ecological, and social benefits. In addition, improvement of education, farming knowledge, and collective actions are essential for sustainable coffee farmers to mitigate the effect of small-scale production.
This is not necessarily a criticism for choosing one distribution of the inefficiency term over another (Parmeter and Kumbhakar 2014). The model proposed by Battese and Coelli with generalized truncated-normal distribution assumption was the choice in this empirical study due to its computational simplicity as well as its ability to examine the effects of various specific variables of farmer household on technical efficiency (Sharma 1999). However, if the inefficiency effects follow a half-normal distribution, a parameterization approach can be deployed to allow for potential heteroscedasticity in the noise term (Parmeter and Kumbhakar 2014). Therefore, a parameterization approach is better in investigating exogenous influences on efficiency of a truncated-normal model. Another limitation of this study is that the correlation between random error in the selection and frontier models due to unobserved variables or choice of technology is based on some aspect of inefficiency, which might lead to bias estimates (Greene 2010). In addition, if selection of non-SC and SC coffee farmers is an issue, which is sometimes called heterogeneity bias, “failure of common support” or “spillover effects” to the comparison group would have been a prominent concern in evaluating the impacts of the sustainable coffee production program (Ravallion 2008). Finally, due to the results pertain from the research sample, the study was not extrapolated to the entire coffee sector. For that reason, further researches in regards of the preceding as well as measure of social and environmental impacts of sustainable farming could complement this study.
Author Contributions
W.B formulated research idea and provided instructions for the research design and approach. N.H.A collected data through surveys in Vietnam, developed and improved the paper, and provided responses for the journals’ reviewers and editorial board. D.T.N provided suggestions on questionnaire design, survey methods, and contributed data on coffee farm. N.V.M collected data through survey in Vietnam and provided suggestions on research sample. All the authors read and approved the final manuscript.
Funding
The authors are grateful to Vietnam International Education Development (VIED) and German Academic Exchange Service (DAAD) for funding of this study.
Acknowledgments
My deepest respect and sincere gratitude are expressed to my supervisor Prof. Dr. Wolfgang Bokelmann. Appreciation goes to staff members of WASI, Dak Lak DARD, and Dak Lak Peoples’ Committee. Special thanks also extended to Vietnam International Education Development (VIED) and German Academic Exchange Service (DAAD) for funding and support.
Conflicts of Interest
The authors declare no conflict of interest.
Appendix A

Table A1.
Collinearity diagnostics.
| Variables | Parameter | SCP | Non-SCP | ||
|---|---|---|---|---|---|
| Tolerance | VIF | Tolerance | VIF | ||
| NPK fertilizer | β1 | 0.663 | 1.509 | 0.520 | 1.923 |
| Organic fertilizer | β2 | 0.630 | 1.588 | 0.633 | 1.579 |
| Manure | β3 | 0.825 | 1.212 | 0.784 | 1.276 |
| Pesticide | β4 | 0.785 | 1.274 | 0.756 | 1.323 |
| Water | β5 | 0.639 | 1.565 | 0.535 | 1.869 |
| Hired labor | β6 | 0.580 | 1.724 | 0.572 | 1.749 |
| Family labor | β7 | 0.685 | 1.460 | 0.434 | 2.303 |
| Depreciation | β8 | 0.582 | 1.719 | 0.422 | 2.371 |
| Other cost | β9 | 0.759 | 1.318 | 0.810 | 1.235 |
| Constant/intercept | δ0 | 0.438 | 2.284 | 0.598 | 1.671 |
| Age of farmer | δ1 | 0.806 | 1.240 | 0.741 | 1.350 |
| Gender | δ2 | 0.686 | 1.458 | 0.623 | 1.604 |
| Education level | δ3 | 0.522 | 1.918 | 0.361 | 2.770 |
| Ethnic | δ4 | 0.386 | 2.594 | 0.181 | 5.528 |
| Farming experience | δ5 | 0.742 | 1.347 | 0.542 | 1.846 |
| Household size | δ6 | 0.376 | 2.659 | 0.341 | 2.934 |
| Farm size | δ7 | 0.532 | 1.880 | 0.328 | 3.052 |
| Labor to land ratio | δ8 | 0.693 | 1.443 | 0.245 | 4.088 |
| Coop. membership | δ9 | 0.619 | 1.615 | 0.572 | 1.748 |
| Extension | δ10 | 0.441 | 2.268 | 0.359 | 2.789 |
| Formal credit | δ11 | 0.663 | 1.509 | 0.520 | 1.923 |
Note: Eigen values for SCP and non-SCP model are 17.971 and 18.169, respectively.
Table A2.
Chow test.
| Source | Sum of Squares | df | Mean Square | F | Sig. |
|---|---|---|---|---|---|
| Contrast | 0.702 | 10 | 0.070 | 2.304 | 0.013 |
| Error | 9.025 | 296 | 0.030 |
References
- Ahmad, Alia. 2001. An Institutional Analysis of Changes in Land Use Pattern and Water Scarcity in Dak Lak Province, Vietnam. Copenhagen: NIAS Press, Available online: http://dlc.dlib.indiana.edu/dlc/bitstream/handle/10535/7903/ahmadviet.pdf?sequence=1 (accessed on 20 January 2019).
- Aigner, Dennis, C. A. Knox Lovell, and Peter Schmidt. 1977. Formulation and estimation of stochastic frontier production function models. Journal of Econometrics 6: 21–37. [Google Scholar] [CrossRef]
- Amarasinghe, Upali A., Chu Thai Hoanh, Dave D’Haeze, and Tran Quoc Hung. 2015. Toward sustainable coffee production in Vietnam: More coffee with less water. Agricultural Systems 136: 96–105. [Google Scholar] [CrossRef]
- Amarasinghe, Upali, Lal Muthuwatta, and Ramaswamy Sakthivadivel. 2019. Water Scarcity Variations within a Country: A Case Study of Sri Lanka. Colombo: International Water Management Institute, Available online: https://EconPapers.repec.org/RePEc:iwt:rerpts:h024897 (accessed on 23 January 2019).
- Ateka, Josiah, A. Onono, and Perez Martin Etyang. 2018. Technical Efficiency and its Determinants in Smallholder Tea Production: Evidence from Nyamira and Bomet Counties in Kenya. Global Journal of Science Frontier Research: D Agriculture and Veterinary 18: 43–54. [Google Scholar]
- Bacon, Christopher. 2005. Confronting the Coffee Crisis: Can Fair Trade, Organic, and Specialty Coffees Reduce Small-Scale Farmer Vulnerability in Northern Nicaragua? World Development 33: 497–511. [Google Scholar] [CrossRef] [Green Version]
- Bardhan, Pranab K. 1973. Size, Productivity, and Returns to Scale: An Analysis of Farm-Level Data in Indian Agriculture. Journal of Political Economy 81: 1370–86. [Google Scholar] [CrossRef]
- Bati Mustefa, Alemu Ayele, Mulugeta Tilahun, and Raja Kumar Parabathina. 2017. Studies on Economic Efficiency of Coffee Production in Ilu Abbabor Zone, Oromia Region, Ethiopia. Journal of Agricultural Economics and Rural Development 3: 293–306. [Google Scholar]
- Battese, George E., and Timothy Coelli. 1988. Prediction of firm-level technical efficiencies with a generalized frontier production function and panel data. Journal of Econometrics 38: 387–99. [Google Scholar] [CrossRef]
- Bau, Le Ngoc. 2015. Ứng dụng tiến bộ kỹ thuật để phát triển bền vững ngành cà phê Việt Nam. Institute of Agricultural Science for Southern Vietnam. Available online: http://iasvn.org/homepage/Ung-dung-tien-bo-ky-thuat-de-phat-trien-ben-vung-nganh-ca-phe-Viet-Nam-7133.html (accessed on 3 March 2019).
- Bauer, Paul W. 1990. Recent developments in the econometric estimation of frontiers. Journal of Econometrics 46: 39–56. [Google Scholar] [CrossRef]
- Bich Hong, Nguyen, and Mitsuyasu Yabe. 2015. Technical Efficiency Analysis of Tea Production in the Northern Mountainous Region of Vietnam. Global Journal of Science Frontier Research: D Agriculture and Veterinary 15: 31–42. Available online: https://pdfs.semanticscholar.org/96b3/f6649f94d6c6be2d4c7459a7939df21ec00b.pdf (accessed on 23 January 2019).
- Binam, Joachim Nyemeck, Jean Tonyè, Njankoua wandji, Gwendoline Nyambi, and Mireille Akoa. 2004. Factor affecting the technical efficiency among smallholder farmers in the slash and burn agriculture zone of Cameron. Food Policy 29: 531–45. [Google Scholar] [CrossRef]
- Borbor-Cordova, Mercy J., Elizabeth Boyer, William McDowell, and Charles Hall. 2006. Nitrogen and phosphorus budgets for a tropical watershed impacted by agricultural land use: Guayas, Ecuador. Biogeochemistry 79: 135–61. [Google Scholar] [CrossRef]
- Bravo-Monroy, Simon Potts, and Joseph Tzanopoulos. 2016. Drivers influencing farmer decisions for adopting organic or conventional coffee management practices. Food Policy 58: 49–61. Available online: http://www.sciencedirect.com/science/article/pii/S0306919215001359 (accessed on 2 March 2019). [CrossRef] [Green Version]
- Brombini Santos, Adriana, and Paulo Mazzafera. 2012. Dehydrins Are Highly Expressed in Water-Stressed Plants of Two Coffee Species. Tropical Plant Biology 5: 218–32. [Google Scholar] [CrossRef]
- Capa Mora, Edwin Daniel, Javier Pérez-Esteban, and Alberto Masaguer. 2015. Unsustainability of recommended fertilization rates for coffee monoculture due to high N2O emissions. Agronomy for Sustainable Development 35: 1551–59. [Google Scholar] [CrossRef]
- Castro-Tanzi, Sebastian, Thomas Dietsch, Natalia Urena, Lucia Vindas, and Mark Chandler. 2012. Analysis of management and site factors to improve the sustainability of smallholder coffee production in Tarrazú, Costa Rica. Agriculture, Ecosystems & Environment 155: 172–81. [Google Scholar]
- Charnes, A., W. W. Cooper, and E. Rhodes. 1978. Measuring the efficiency of decision making units. European Journal of Operational Research 2: 429–44. [Google Scholar] [CrossRef]
- Coelli, Timothy. 1995. Recent developments in Frontier modelling and efficiency measurement. Australian Journal of Agricultural Economics 39: 219–45. [Google Scholar] [CrossRef]
- Coelli, Tim J. 1996. A Guide to FRONTIER Version 4.1: A Computer Program for Stochastic Frontier Production and Cost Function Estimation. CEPA Working Paper 96/7. Armidale, Australia: University of New England. [Google Scholar]
- Coelli, Timothy, and George Battese. 1995. A Model For Technical Inefficiency Effects in a Stochastic Frontier Production Function for Panel Data. Empirical Economics 20: 325–32. [Google Scholar]
- Coelli, Timothy, D. S. Rao, Christopher O’Donnell, and George Battese. 2005. An Introduction to Efficiency and Productivity Analysis. Berlin/Heidelberg: Springer Science & Business Media. [Google Scholar]
- Cong Thang, Tran, Michael P. Burton, and Donna C. Brennan. 2009. Optimal replanting and cutting rule for coffee farmers in Vietnam. Paper presented at the 2009 Conference (53rd), Cairns, Australia, February 11–13; Available online: https://ideas.repec.org/p/ags/aare09/47638.html (accessed on 1 March 2019).
- Crisosto, Carlos H., David A. Grantz, and F. C. Meinzer. 1992. Effects of water deficit on flower opening in coffee (Coffea arabica L.). Tree Physiology 10: 127–39. [Google Scholar] [CrossRef]
- D’Haeze Dave, Jozef Deckers, Dirk Raes, Tran An Phong, and Nguyen Dang Minh Chanh. 2003. Over-irrigation of Coffea canephora in the Central Highlands of Vietnam revisited: Simulation of soil moisture dynamics in Rhodic Ferralsols. Agricultural Water Management 63: 185–202. [Google Scholar] [CrossRef]
- D’haeze Dave, Jozef Deckers, Dirk Raes, Tran An Phong, and Hugo Loi. 2005. Environmental and socio-economic impacts of institutional reforms on the agricultural sector of Vietnam: Land suitability assessment for Robusta coffee in the Dak Gan region. Agriculture, Ecosystems & Environment 105: 59–76. [Google Scholar]
- DakLakDARD. 2016. Dak Laks’ Sustainable Coffee Plan Till 2020 and Vision to 2030. Buon Ma Thuot: Dak Lak Peoples’ Committee. [Google Scholar]
- Daviron Benoit and Stefano Ponte. 2005. The Coffee Paradox: Global Markets, Commodity Trade and the Elusive Promise of Development. London: Technical Centre for Agricultural Rural Cooperation, Zed Books. [Google Scholar]
- De Beenhouwer, Matthias, Diriba Muleta, Bram Peeters, Maarten Van Geel, Bart Lievens, and Olivier Honnay. 2014. DNA pyrosequencing evidence for large diversity differences between natural and managed coffee mycorrhizal communities. Agronomy for Sustainable Development 35: 241–49. [Google Scholar] [CrossRef]
- Dessale, Moges. 2018. Measurement of Technical Efficiency and Its Determinants in Wheat Production: The Case of Smallholder Farmers in Wogidi District, South Wollo Zone Ethiopia. Food Science and Quality Management 81: 86–93. [Google Scholar]
- Dessale, Moges. 2019. Analysis of technical efciency of small holder wheat-growing farmers of Jamma district, Ethiopia. Agriculture and Food Security 8: 1–8. [Google Scholar] [CrossRef]
- Dietsch, Thomas V., Stacy M. Philpott, Robert A. Rice, Russell Greenberg, Peter Bichier, Timothy G. O’Brien, and Margaret F. Kinnaird. 2004. Conservation Policy in Coffee Landscapes. Science 303: 625–26. [Google Scholar] [CrossRef] [PubMed]
- FAO. 2003. World Agriculture: Towards 2015/2030: An FAO Perspective. London: Earthscan Publications Ltd., Available online: http://www.fao.org/3/a-y4252e.pdf (accessed on 1 March 2019).
- Farrell, Michaeal James. 1957. The Measurement of Productive Efficiency. Journal of the Royal Statistical Society. Series A (General) 120: 253–90. [Google Scholar] [CrossRef]
- Førsund Finn, Knox Lovell, and Peter Schmidt. 1980. A survey of frontier production functions and of their relationship to efficiency measurement. Journal of Econometrics 13: 5–25. [Google Scholar] [CrossRef]
- Gaitán Cremaschi, Daniel, Frits van Evert, Don Jansen, Miranda Meuwissen, and Alfons Oude Lansink. 2018. Assessing the Sustainability Performance of Coffee Farms in Vietnam: A Social Profit Inefficiency Approach. Sustainability 10: 4227. [Google Scholar] [CrossRef]
- Giovannucci, Daniele, and Stefano Ponte. 2005. Standards as a new form of social contract? Sustainability initiatives in the coffee industry. Food Policy 30: 284–301. [Google Scholar] [CrossRef]
- Glaser, Barney. G., and Anselm. L. Strauss. 1967. The Discovery of Grounded Theory: Strategies for Qualitative Research. Venice: Aldine. [Google Scholar]
- Greene, William. 1980. Maximum likelihood estimation of econometric frontier functions. Journal of Econometrics 13: 27–56. [Google Scholar] [CrossRef]
- Greene, William H. 1990. A Gamma-distributed stochastic frontier model. Journal of Econometrics 46: 141–63. [Google Scholar] [CrossRef]
- Greene, William. 1993. The Econometric Approach to Efficiency Analysis. In The Measurement of Productive Efficiency: Techniques and Applications. Edited by Harold. O. Fried and Shelton. S. Schmidt. Oxford: Oxford University Press. [Google Scholar]
- Greene, William. 2010. Testing hypotheses about interaction terms in nonlinear models. Economics Letters 107: 291–96. [Google Scholar] [CrossRef]
- Haggar, Jeremy, Gabriela Soto, Fernando Casanoves, and Elias de Melo Virginio. 2017. Environmental-economic benefits and trade-offs on sustainably certified coffee farms. Ecological Indicators 79: 330–37. [Google Scholar] [CrossRef]
- Hajjar Reem, Peter Newton, Daniel Adshead, Meghan Bogaerts, Victoria Maguire-Rajpaul, Louis F. G. Pinto, Constance McDermott, Jeffrey Milder, Eva Wollenberg, and Arun Agrawal. 2019. Scaling up sustainability in commodity agriculture: Transferability of governance mechanisms across the coffee and cattle sectors in Brazil. Journal of Cleaner Production 206: 124–32. [Google Scholar] [CrossRef]
- Ho, Thong, and Hoa Niekdam. 2016. Labor Dependence, Income Diversification, Rural Credit, and Technical Efficiency ofSmall-Holder Coffee Farms: A Case Study of Cu M’gar District, Dak Lak Province, Vietnam. Journal of Economics Development 23: 22–41. [Google Scholar]
- Ho, Thong, Prabodh Illukpitiya, and John F. Yanagida. 2014. Factors Affecting Technical Efficiency of Small-holder Coffee Farming in the Krong Ana Watershed, Vietnam. Asian Journal of Agricultural Extension, Economics & Sociology 3: 37–49. [Google Scholar]
- Huang, Clief J., and Jin Tan Liu. 1994. Estimation of a Non-Neutral Stochastic Frontier Production Function. Journal of Productivity Analysis 5: 171–80. [Google Scholar] [CrossRef]
- Huynh, Viet, Huynh Khai, and Mitsuyasu Yabe. 2011. Technical efficiency analysis of rice production in Vietnam. Journal of ISSAAS 17: 135–46. [Google Scholar]
- Islam, Gazi, Shzee Yew Tai, and Mohd Noh Kusairi. 2016. A stochastic frontier analysis of technical efficiency of fish cage culture in Peninsular Malaysia. SpringerPlus 5: 1127. [Google Scholar] [CrossRef]
- Jha, Shalene, Christopher Bacon, Stacy Philpott, V. Méndez, Robert Rice, and Peter Laderach. 2014. Shade Coffee: Update on a Disappearing Refuge for Biodiversity. Bioscience 64: 416–28. [Google Scholar] [CrossRef]
- Jondrow, James, C. Lovell, Ivan S. Materov, and Peter Schmidt. 1982. On the estimation of technical inefficiency in the stochastic frontier production function model. Journal of Econometrics 19: 233–38. [Google Scholar] [CrossRef]
- Kamau, Victor, Josiah Ateka, Robert Mbeche, and Kavoi M. Muendo. 2017. Assesment of technical efficiency of smallholder coffee farming enterprises in Muranga, Kenya. Journal of Agriculture Science and Technology 18: 12–23. [Google Scholar]
- Kirkley, James E., Dale Squires, and Ivar E. Strand. 1995. Assessing Technical Efficiency in Commercial Fisheries: The Mid-Atlantic Sea Scallop Fishery. American Journal of Agricultural Economics 77: 686–97. [Google Scholar] [CrossRef]
- Kumbhakar, Subal, Soumendra Ghosh, and J. Thomas McGuckin. 1991. A Generalized Production Frontier Approach for Estimating Determinants of Inefficiency in U.S. Dairy Farms. Journal of Business & Economic Statistics 9: 279–86. [Google Scholar]
- Luong, Quoc V., and Loren Tauer. 2006. A real options analysis of coffee planting in Vietnam. Agricultural Economics 35: 49–57. [Google Scholar] [CrossRef] [Green Version]
- Mango, Nelson, Clifton Makate, Benjamin Hanyani-Mlambo, Shephard Siziba, and Mark Lundy. 2015. A stochastic frontier analysis of technical efficiency in smallholder maize production in Zimbabwe: The post-fast-track land reform outlook. Cogent Economics & Finance 3: 1117189. [Google Scholar]
- Meeusen, Wim, and Julien van den Broeck. 1977. Efficiency Estimation from Cobb-Douglas Production Functions with Composed Error. International Economic Review 18: 435–44. [Google Scholar] [CrossRef]
- Milder, J. C., and D. Newsom. 2015. SAN/Rainforest Alliance Impacts Report: Evaluating the Effects of the SAN/Rainforest Alliance Certification Systems on Farms, People, and the Environment. New York: SAN/Rainforest Alliance, p. 115. [Google Scholar]
- Mistiaen, V. 2012. A Better Future Is Percolating for Vietnam’s Coffee. The Guardian. March 26. Available online: www.theguardian.com/global-development/poverty-matters/2012/mar/26/better-future-vietnam-coffee-growth (accessed on 23 January 2019).
- Moguel, Patricia, and Víctor Toledo. 1999. Biodiversity Conservation in Traditional Coffee Systems of Mexico. Conservation Biology 13: 11–21. [Google Scholar] [CrossRef]
- Nchare, Amadou. 2007. Analysis of Factors Affecting the Technical Efficiency of Arabica Coffee Producers in Cameroon. African Economic Research Consortium, Research Papers. Available online: https://www.semanticscholar.org/paper/Analysis-of-Factors-Affecting-the-Technical-of-inNchare/5b15916f558900da4da97a5354533d8cc573e802 (accessed on 12 March 2019).
- Nguyen, Giang N. T., and Tapan Sarker. 2018. Sustainable coffee supply chain management: A case study in Buon Me Thuot City, Daklak, Vietnam. International Journal of Corporate Social Responsibility 3: 1. [Google Scholar] [CrossRef]
- Nyagaka Daniel, Gideon Obare, and Wilson Nguyo. 2009. Economic Efficiency of Smallholder Irish Potato Producers in Kenya: A Case of Nyandarua North District. Paper presented at the 27th Conference of the International Association of Agricultural Economists (IAAE), on The New Landscape of Global Agriculture, Beijing, China, August 16–22. [Google Scholar]
- Okoruwa, Victor O., Olorunfemi O. Ogundele, and B. O. Oyewusi. 2006. Efficiency and Productivity of Farmers in Nigeria: A Study of Rice Farmers in North Central Nigeria. Paper presented at the 2006 Annual Meeting, Queensland, Australia, August 12–18; Available online: https://ageconsearch.umn.edu/record/25248 (accessed on 3 March 2019).
- Parmeter, Christopher F., and Subal C. Kumbhakar. 2014. Efficiency Analysis: A Primer on Recent Advances. Foundations and Trends® in Econometrics 7: 191–385. [Google Scholar] [CrossRef]
- Perfecto, Ivette, Robert Rice, Russell Greenberg, and Martha Van der Voort. 1996. Shade Coffee: A Disappearing Refuge for Biodiversity. BioScience 46: 598–608. [Google Scholar] [CrossRef] [Green Version]
- Pindyck, Robert S., and Daniel L. Rubinfeld. 1981. Econometric Models and Economic Forecasts. New York: McGraw-Hill. [Google Scholar]
- Pitt, Mark, and Lung-Fei Lee. 1981. The measurement and sources of technical inefficiency in the Indonesian weaving industry. Journal of Development Economics 9: 43–64. [Google Scholar] [CrossRef]
- Ponte, Stefano. 2002. The ‘Latte Revolution’? Regulation, Markets and Consumption in the Global Coffee Chain. World Development 30: 1099–122. [Google Scholar] [CrossRef]
- Poudel, Krishna Lal, Thomas G. Johnson, Naoyuki Yamamoto, Shriniwas Gautam, and Bhawani Mishra. 2015. Comparing technical efficiency of organic and conventional coffee farms in rural hill region of Nepal using data envelopment analysis (DEA) approach. Organic Agriculture 5: 263–75. [Google Scholar] [CrossRef]
- Poungchompu, Supaporn, and Supawadee Chantanop. 2015. Factor affecting technical efficiency of smallholder rubber farming in Northeast Thailand. American Journal of Agricultural and Biological Science 10: 83–90. [Google Scholar] [CrossRef]
- Ravallion, Martin. 2008. Evaluating Anti-Poverty Programs. Edited by T. Paul Schultz and John A. Strauss. Amsterdam: Elsevier, pp. 3787–846. [Google Scholar]
- Raynolds, Laura T., Douglas Murray, and Andrew Heller. 2007. Regulating sustainability in the coffee sector: A comparative analysis of third-party environmental and social certification initiatives. Agriculture and Human Values 24: 147. [Google Scholar] [CrossRef]
- Reifschneider, David, and Rodney Stevenson. 1991. Systematic Departures from the Frontier: A Framework for the Analysis of Firm Inefficiency. International Economic Review 32: 715–23. [Google Scholar] [CrossRef]
- Robson, Colin. 2002. Real World Research: A Resource for Social Scientists and Practitioner-Researchers, 2nd ed. Oxford: Blackwell Publishers Ltd. [Google Scholar]
- Sharma, Khem R. 1999. Technical efficiency of carp production in Pakistan. Aquaculture Economics & Management 3: 131–41. [Google Scholar] [CrossRef]
- Soto-Pinto, Lorena, Ivette Perfecto, and Javier Caballero. 2002. Soto-Pinto, Lorena, Ivette Perfecto, and Javier Caballero. 2002. Shade over coffee: Its effects on berry borer, leaf rust and spontaneous herbs in Chiapas, Mexico. Agroforestry Systems 55: 37–45. [Google Scholar] [CrossRef]
- Sriboonchitta, Songsak, and Aree Wiboonpongse. 2004. The Effects of Production Inputs, Technical Efficiency and Other Factors on Jasmine and Non-jasmine Rice Yields in Thailanda. Asia-Pacific Productivity Conference 5: 14–16. [Google Scholar]
- Staver, Charles, Falguni Guharay, D. Monterroso, and Reinhold Muschler. 2001. Designing pest-suppressive multistrata perennial crop systems: Shade-grown coffee in Central America. Agroforestry Systems 53: 151–70. [Google Scholar] [CrossRef]
- Stevenson, Rodney E. 1980. Likelihood functions for generalized stochastic frontier estimation. Journal of Econometrics 13: 57–66. [Google Scholar] [CrossRef]
- Suranjan Priyanath, Hunuwala Malawarage, S. P. Premaratne, Amina Yoosuf, and D. Maurice. 2018. Technical Efficiency for Tea Smallholder Farmers under UTZ Certification System in Sri Lanka: A Stochastic Frontier Approach. SEISENSE Journal of Management 2: 1–19. [Google Scholar] [CrossRef]
- Swain, Braja. 2016. Does Technological Linkage in Contract Farming Increase Farm Productivity and Efficiency? The Case of Hybrid Paddy Seed Cultivation in Undivided Andhra Pradesh. Agricultural Economics Research Review 29: 211. [Google Scholar] [CrossRef]
- Tadesse, Getachew, Erika Zavaleta, and Carol Shennan. 2014. Coffee landscapes as refugia for native woody biodiversity as forest loss continues in southwest Ethiopia. Biological Conservation 169: 384–91. [Google Scholar] [CrossRef]
- Technoserve. 2013. Vietnam: A Business Case For Sustainable Coffee Production. Available online: www.sustainablecoffeeprogram.com/site/getfile.php?id=211 (accessed on 20 January 2019).
- Tingley, Diana, Sean Pascoe, and Louisa Coglan. 2005. Factors affecting technical efficiency in fisheries: Stochastic production frontier versus data envelopment analysis approaches. Fisheries Research 73: 363–76. [Google Scholar] [CrossRef]
- Tun, YuYu, and Hye-Jung Kang. 2015. An Analysis on the Factors Affecting Rice Production Efficiency in Myanmar. Journal of East Asian Economic Integration 19: 167–88. [Google Scholar] [CrossRef]
- Van Der Vossen, H. A. M. 2005. A critical analysis of the agronomic and economic sustainability of organic coffee production. Experimental Agriculture 41: 449–73. [Google Scholar] [CrossRef]
- Van Long, Nguyen, Nguyen Quang Ngoc, Nguyen Ngoc Dung, Paul Kristiansen, Isa Yunusa, and Christine Fyfe. 2015. The Effects of Shade Tree Types on Light Variation and Robusta Coffee Production in Vietnam. Engineering 7: 742–53. [Google Scholar] [CrossRef]
- Widjaya, Dani, Yuli Hariyati, and Djoko Soejono. 2017. Technical and Economic Efficiency of Smallholder Arabica Coffee Farming in Panti Sub-district, Jember. Pelita Perkebunan (a Coffee and Cocoa Research Journal) 33: 51. [Google Scholar] [CrossRef]
- Wollni, Meike, and Bernhard Brümmer. 2009. Productive Efficiency of Specialty and Conventional Coffee Farmers in Costa Rica: Accounting for Technological Heterogeneity and Self-Selection. Göttingen: Universität Göttingen. [Google Scholar]
- Wunderle, Joseph, Jr., and Steven Latta. 1996. Avian abundance in sun and shade coffee plantations and remnant pine forest in the Cordillera Central, Dominican Republic. Ornitologia Neotropical 7: 19–34. [Google Scholar]
- Wurst, John, John Neter, and James Godfrey. 1989. Efficiency of Sieve Sampling in Auditing. Journal of Business & Economic Statistics 7: 199–205. [Google Scholar] [CrossRef]
Figure 1.
Study area.

Table 1.
Socioeconomic characteristics of coffee farmer
| Variables | Definition | SC | Non-SC | Chi-Square | ||
|---|---|---|---|---|---|---|
| Value 0 | Value 1 | Value 0 | Value 1 | |||
| Gender | 1 = male; 0 = female | 61 (33.3) | 122 (66.7) | 40 (30.1) | 93 (69.9) | 0.38 |
| Ethnic | 1 = Kinh; 0 = others | 44 (20.0) | 139 (80.0) | 49 (36.8) | 84 (63.2) | 6.07 * |
| Coop. membership | 1= member of cooperative; 0 = otherwise | 123 (67.2) | 60 (32.8) | 64 (48.1) | 69 (51.9) | 11.62 * |
| Extension | 1 = access to extension service; 0 = otherwise | 79 (43.2) | 104 (56.8) | 95 (71.4) | 38 (28.6) | 24.86 * |
Note: * Significant at P < 0.05. Figures within the parenthesis are percentages. SC indicates sustainable certified coffee farmer and non-SC indicates non-sustainable certified coffee farmer.
Table 2.
Descriptive factors of production.
| Variables | SC | Non-SC | t-Ratio | ||
|---|---|---|---|---|---|
| Mean | Std. Deviation | Mean | Std. Deviation | ||
| Yield | 3215.77 | 805.10 | 2933.25 | 905.95 | 2.9206 * |
| NPK fertilizer | 14,612.24 | 4159.10 | 16,632.28 | 5260.66 | −3.6722 * |
| Organic fertilizer | 6510.76 | 2358.90 | 3289.20 | 2285.84 | 12.1424 * |
| Manure | 5762.84 | 2500.14 | 3983.07 | 2669.15 | 6.0717 * |
| Pesticide | 1788.13 | 1204.13 | 1282.48 | 1310.16 | 3.5507 * |
| Water | 3946.67 | 2313.61 | 4556.26 | 4190.37 | −1.5180 |
| Hired labor | 10,135.25 | 5111.64 | 6612.93 | 6018.77 | 5.6091 * |
| Family labor | 108.91 | 37.00 | 146.24 | 29.80 | −9.9213 * |
| Depreciation | 2070.82 | 1282.15 | 1520.35 | 1609.33 | 3.3811 * |
| Other costs | 1225.90 | 837.74 | 4110.14 | 2986.90 | −10.8309 * |
| Age | 44.60 | 10.03 | 43.08 | 11.70 | 1.2380 |
| Education | 9.66 | 2.45 | 9.17 | 3.07 | 1.5164 |
| Farming experience | 8.74 | 4.18 | 16.21 | 8.05 | −9.7791 * |
| Household size | 4.70 | 1.19 | 4.63 | 1.37 | 0.4705 |
| Farm size | 1.40 | 0.65 | 1.61 | 1.02 | −2.0529 * |
| Labor/land ratio | 2.26 | 1.54 | 2.47 | 2.22 | −0.9384 |
| Credit | 51,923.77 | 23,080.82 | 59,887.22 | 41,428.41 | −2.0024 * |
Note: * Significant at p < 0.05. SC indicates sustainable certified coffee farmer and non-SC indicates non-sustainable certified coffee farmer.
Table 3.
Distribution of coffee yield.
| Yield | SC | Non-SC | Total | |
|---|---|---|---|---|
| <2 ton/ha | 8 (2.5) | 18 (5.7) | 26 (8.2) | |
| 2–3 ton/ha | 60 (19.0) | 39 (12.3) | 99 (31.3) | |
| 3–4 ton/ha | 75 (23.7) | 57 (18.0) | 132 (41.8) | |
| 4–5 ton/ha | 35 (11.1) | 16 (5.1) | 51 (16.1) | |
| >5 ton/ha | 5 (1.6) | 3 (0.9) | 8 (2.5) | |
| Total | 183 (57.9) | 133 (42.1) | 316 (100.0) | |
| Mean | 3.216 | 2.933 | 3.097 | |
| Minimum | 1.200 | 0.867 | 0.867 | |
| Maximum | 5.400 | 5.915 | 5.915 | |
| Standard Deviation | 0.805 | 0.906 | 0.859 | |
| Chi-Square Tests | Value | df | Asymp. Sig. (2-sided) | Exact Sig. (2-sided) |
| Pearson Chi-Square | 10.690 a | 4 | 0.030 | 0.028 |
| Likelihood Ratio | 10.710 | 4 | 0.030 | 0.036 |
| Fisher’s Exact Test | 10.509 | 0.030 | ||
| N of Valid Cases | 316 |
Note: a 2 cells (20.0%) have expected count less than 5. The minimum expected count is 3.37. Figures within the parenthesis are percentages. SC indicates sustainable certified coffee farmer and non-SC indicates non-sustainable certified coffee farmer.
Table 4.
MLE of stochastic production frontier and technical inefficiency model.
| Variables | Parameter | SC | Non-SC | ||||
|---|---|---|---|---|---|---|---|
| Coef. | SE | t-Ratio | Coef. | SE | t-Ratio | ||
| Production frontier | |||||||
| Constant/intercept | β0 | 1.6208 | 0.4035 | 4.0174 * | 1.7320 | 0.5521 | 3.1370 * |
| NPK fertilizer | β1 | 0.4092 | 0.0342 | 11.9549 * | 0.4564 | 0.0530 | 8.6130 * |
| Organic fertilizer | β2 | 0.0757 | 0.0237 | 3.1968 * | 0.1332 | 0.0264 | 5.0484 * |
| Manure | β3 | 0.0716 | 0.0165 | 4.3527 * | 0.0324 | 0.0267 | 1.2104 |
| Pesticide | β4 | 0.0038 | 0.0105 | 0.3650 | −0.0134 | 0.0256 | −0.5225 |
| Water | β5 | 0.0799 | 0.0156 | 5.1305 * | 0.0000 | 0.0232 | 0.0016 |
| Hired labor | β6 | 0.0003 | 0.0163 | 0.0202 | 0.0491 | 0.0235 | 2.0925 * |
| Family labor | β7 | 0.1053 | 0.0276 | 3.8133 * | 0.0567 | 0.0752 | 0.7551 |
| Depreciation | β8 | 0.0152 | 0.0150 | 1.0124 | 0.0018 | 0.0234 | 0.0788 |
| Other cost | β9 | 0.0073 | 0.0156 | 0.4687 | −0.0002 | 0.0207 | −0.0106 |
| Technical inefficiency model | |||||||
| Constant/intercept | δ0 | 0.8404 | 0.2344 | 3.5857 * | 0.1468 | 0.3877 | 0.3787 |
| Age | δ1 | −0.0002 | 0.0027 | −0.0606 | 0.0274 | 0.0139 | 1.9701 * |
| Gender | δ2 | 0.0492 | 0.0731 | 0.6722 | −0.0097 | 0.0912 | −0.1064 |
| Education level | δ3 | −0.0348 | 0.0145 | −2.4029 * | −0.0294 | 0.0207 | −1.4236 |
| Ethnic | δ4 | 0.0882 | 0.0699 | 1.2619 | −0.2834 | 0.1212 | −2.3370 * |
| Farming experience | δ5 | −0.0222 | 0.0130 | −1.7124 | −0.0328 | 0.0181 | −1.8058 |
| Household size | δ6 | −0.0731 | 0.0275 | −2.6579 * | −0.0364 | 0.0337 | −1.0785 |
| Farm size | δ7 | 0.1557 | 0.0880 | 1.7695 | 0.1471 | 0.0893 | 1.6469 |
| Labor/land ratio | δ8 | 0.0442 | 0.0260 | 1.7009 | −0.0543 | 0.0351 | −1.5477 |
| Coop. membership | δ9 | −0.3842 | 0.1892 | −2.0309 * | 0.0023 | 0.0995 | 0.0233 |
| Extension | δ10 | −0.0088 | 0.0522 | −0.1684 | 0.1054 | 0.1340 | 0.7865 |
| Credit | δ11 | −8.96 × 10⁻⁶ | 3.60 × 10⁻⁶ | −2.4845 * | −9.69 × 10⁻⁶ | 4.59 × 10⁻⁶ | −2.1109 * |
| Variance of parameters | |||||||
| Sigma-squared | σ2 | 0.0491 | 0.0192 | 2.5556 * | 0.0679 | 0.0171 | 3.9794* |
| Gamma | γ | 0.9179 | 0.0408 | 22.4995 * | 0.7168 | 0.1146 | 6.2565* |
| Log likelihood function | 140.0706 | 41.0813 | |||||
| LR test of one side error | 93.6163 | 27.4995 | |||||
| Mean of exp (Ui) | 88.2458 | 87.6944 | |||||
Note: * Significant at P < 0.05. SC indicates sustainable certified coffee farmer and non-SC indicates non-sustainable certified coffee farmer.
Table 5.
Efficiency level of coffee farmers.
| Categories | SC | Non-SC | ||
|---|---|---|---|---|
| Farmer | Percentage | Farmer | Percentage | |
| TE < 40 | 0 | 0 | 0 | 0 |
| 40 ≤ TE < 50 | 1 | 0.546 | 1 | 0.752 |
| 50 ≤ TE < 60 | 4 | 2.186 | 2 | 1.504 |
| 60 ≤ TE < 70 | 8 | 4.372 | 5 | 3.759 |
| 70 ≤ TE < 80 | 17 | 9.290 | 16 | 12.030 |
| 80 ≤ TE < 90 | 45 | 24.590 | 30 | 22.556 |
| 90 ≤ TE | 108 | 59.016 | 79 | 59.398 |
| Total | 183 | 100.000 | 133 | 100.000 |
| Min | 45.4635 | 49.1096 | ||
| Max | 98.0241 | 97.2277 | ||
| Mean | 88.245762 | 87.694357 | ||
| SD | 9.8345411 | 9.8835196 | ||
Note: SC indicates sustainable certified coffee farmer and non-SC indicates non-sustainable certified coffee farmer.
Table 6.
Average technical efficiency score across farm size.
| Farm Size | SC | Non-SC |
|---|---|---|
| <1 ha (Small) | 82.11 | 87.38 |
| 1–2 ha (Medium) | 89.43 | 86.90 |
| >2 ha (Large) | 90.81 | 91.12 |
| Total | 88.25 | 87.69 |
Note: SC indicates sustainable certified coffee farmer and non-SC indicates non-sustainable certified coffee farmer.
Table 7.
Production cost and rate of return
| Variables | SC | Non-SC | t-Ratio | ||
|---|---|---|---|---|---|
| Mean | Std. Deviation | Mean | Std. Deviation | ||
| Yield/hectare | 3215.77 | 805.10 | 2933.25 | 905.95 | 2.921 * |
| Coffee price | 34.82 | 2.18 | 33.14 | 0.96 | 9.236 * |
| Input cost | 63,066.83 | 36,162.48 | 58,156.88 | 42,804.93 | 1.102 |
| Input cost/hectare | 43,981.78 | 9550.28 | 40,466.37 | 13,093.32 | 2.629 * |
| Gross output | 161,710.84 | 98,951.60 | 140,635.11 | 97,817.81 | 1.878 |
| Gross output/hectare | 112,347.36 | 30,503.97 | 97,229.38 | 30,176.49 | 4.369 * |
| Gross margin | 68,365.58 | 25,058.52 | 56,763.02 | 22,819.66 | 4.218 * |
| Rate of return | 1.575 | 0.538 | 1.484 | 0.666 | 1.343 |
Note: * Significant at p < 0.05. SC indicates sustainable certified coffee farmer and non-SC indicates non-sustainable certified coffee farmer.
© 2019 by the authors. Licensee MDPI, Basel, Switzerland. This article is an open access article distributed under the terms and conditions of the Creative Commons Attribution (CC BY) license (http://creativecommons.org/licenses/by/4.0/).
Share and Cite
MDPI and ACS Style
Hung Anh, N.; Bokelmann, W.; Thi Nga, D.; Van Minh, N. Toward Sustainability or Efficiency: The Case of Smallholder Coffee Farmers in Vietnam. Economies 2019, 7, 66. https://doi.org/10.3390/economies7030066
AMA Style
Hung Anh N, Bokelmann W, Thi Nga D, Van Minh N. Toward Sustainability or Efficiency: The Case of Smallholder Coffee Farmers in Vietnam. Economies. 2019; 7(3):66. https://doi.org/10.3390/economies7030066
Chicago/Turabian StyleHung Anh, Nguyen, Wolfgang Bokelmann, Do Thi Nga, and Nguyen Van Minh. 2019. "Toward Sustainability or Efficiency: The Case of Smallholder Coffee Farmers in Vietnam" Economies 7, no. 3: 66. https://doi.org/10.3390/economies7030066
Note that from the first issue of 2016, this journal uses article numbers instead of page numbers. See further details here.