1. Introduction
Securing of food quality is currently a major task for the scientific community. In this context, ensuring the absence of harmful substances in foods that can cause cancer is of high relevance. Until the year 2000, the food born toxicant Acrylamide (AA) was not known to be present in food products. That changed when Tareke et al. (2002), stated that carbohydrate rich food products contain AA [
1]. Now nearly two decades after the first discoveries of AA in food, the European Commission [
2] announced a regulation which restricts AA contents in cereal food products and forces the implementation of harm minimization strategies if benchmark levels are exceeded. Since that announcement, the food industry has faced the major challenge of reducing the risk of AA appearing in their food products.
AA is formed during the Maillard reaction in carbohydrate rich material like cereals and potatoes where free asparagine (free Asn) and reducing sugars react under heat treatment [
3,
4,
5]. Up to now, the lowering of AA was mainly achieved by reducing the process temperature and heating time. Further studies investigated the effect of adjusting processing parameters such as pH, changing baking agents, adding additives, or by elucidating the mechanistic pathways of AA formation and eliminating precursors or intermediates [
6,
7,
8,
9,
10,
11,
12,
13,
14].
Also, enzymes like asparaginase are able to reduce free Asn the AA formation that would occur as a result of its reaction with sugars, however the production of enzymes can be expensive and leads to undesired changes in taste and product quality [
15]. Moreover, the efficiency of enzymes is affected by the enzyme dose, reaction time, temperature, and pH [
16], meaning that efficiency of the enzyme asparaginase used to reduce free Asn depends on the food that is produced.
For all foods where free Asn is the factor that limits the formation of AA [
7], all processing strategies aim to prevent the formation of AA by changing or reducing free Asn shortly before or during food processing.
While most of the above-mentioned strategies successfully lead to a lower AA formation, their ability to lower AA depends on the raw material used. Depending on crop management and environmental conditions, the amount of free Asn in foods like cereal flours can highly fluctuate from year to year, which means lowering AA using technological and food processing strategies can fail.
As the amount of free Asn in plants is affected by nitrogen, free Asn might be influenced by crop management strategies like nutrient supply, fungicide treatment, and the choice of cereal species and cultivars [
17,
18,
19,
20]. In crop production, fertilization is a central strategy to raise grain yield and quality traits, but it can affect Asn levels as well. In addition to the nitrogen application content, the timing of nitrogen fertilization and different kinds of nitrogen fertilizer can considerably affect Asn amounts in wheat [
17,
19,
20]. Especially high nitrogen supply during grain maturation which heads to high crude protein concentrations seems to increase free Asn levels significantly [
17]. Postles et al. [
21] found for rye that free Asn was influenced by variety and nitrogen supply. Moreover, sulfur deficiency can dramatically increase Asn accumulation in grain, leading to high AA formation potential [
18,
22]. Furthermore, fungicide treatments increasing green leaf area periods and prolonging senescence can downsize free Asn content in grains [
19]. Further, environmental conditions given by different growing locations can highly change the level of free Asn within wheat genotypes [
23]. Lea et al. [
24] reported in their review that stress conditions during growth like drought, salt, toxic metals, and disease pressure can also lead to an increase in free Asn. However, reference [
25] suggested that some climate conditions that may induce stress conditions like elevated ozone do not seem increase free Asn, although interestingly crude protein content does increase as a result of these conditions.
Further, different investigations revealed that cereal species vary in their Asn levels and as a result in their AA formation potential. Rye normally provides higher Asn amounts in the grain than wheat and spelt [
26,
27,
28]. Additionally, cultivars within cereal species can differ highly in their precursor content of free Asn, which was reported by numerous studies [
21,
26,
27,
28,
29]. A 5-fold range of free Asn within a diversity of European wheat cultivars was reported by Taeymans et al. [
29] while Claus et al. [
26] found up to a factor of three diverse free Asn levels in nine German winter wheat cultivars. Corol et al. [
23] reported almost 5-fold differences between 150 wheat genotypes analyzed as wholemeal samples. Thus, identifying cultivars providing naturally a low Asn content is considered to be a reasonable approach to minimize AA formation potential. Nevertheless, climate conditions (sunshine duration and rainfall) and soil properties can also significantly alter Asn contents [
27,
28], which should be taken into account during cultivar selection.
The studies mentioned above exclusively completed their research using conventional farming methods. Studies investigating free Asn in cereals cultivated under the guidelines of organic farming systems are rare. Kunz [
30] announced that for breeding wheat cultivars under organic farming conditions, plants must have completely different characteristics than under conventional practices, e.g., a higher accumulation of gluten under a lower nitrogen supply, longer stems, a long terminal internode, loose ears or a faster transfer of nutrients into the grain, more weed competitiveness, and compatibility with harrowing and hoeing. Thus, the results of studies done for conventional farming cannot simply be transferred to organically cultivated crops.
In this context, Stockmann et al. [
31] investigated organically and conventionally cropped cereals to determine their content of free Asn. The used species and cultivars were the same for both systems, while only the crop management differed. They found a high impact of the cropping system for wheat in particular, as the organically grown wheat cultivars had a significantly lower level of free Asn.
In addition, Stockmann et al. [
20] examined the effect of nitrogen on free Asn formation by comparing conventional cropping methods with organic ones. They found that the wheat samples produced under organic farming conditions showed no significant increase in free Asn if nitrogen levels were raised. Significantly higher levels of free Asn were only found within the conventionally treated wheat samples when nitrogen amounts of 180 kg N ha
−1 or higher were applied, which led to crude protein contents over 14%. They concluded that until a certain level of nitrogen was reached which included a sufficient protein synthesis, free Asn would not be significantly affected. This is in agreement with Lea et al. [
24], who stated that large amounts of nitrogen during a phase of low protein synthesis will increase free Asn.
In contrast, a set of organically cropped cereal species and cultivars were investigated by Stockmann et al. [
32] for their content of free Asn. The samples were only marginally supplied with nitrogen, however a high range of free Asn comparing species and cultivars within species were reported. Thus, only reducing nitrogen could lead to failure to reduce the levels of free Asn. Particularly if a sufficient baking quality is needed, nitrogen supply should be adequate to help obtain marketable flours. In this context, baking properties are highly related to crude protein (gluten content), the sedimentation value, and falling number since these traits affect the dough preparation and bread volume [
33].
However, nitrogen supply in low input farming systems is generally lower. Hence, strategies are needed to ensure there is a certain amount of crude protein to obtain a good baking quality.
Regarding organic farming, growing wheat in a larger row distance is a known agronomic strategy. In addition to providing better weed control, the main reason for this agronomic management tool is better nitrogen availability for each single plant. Thus, larger row distances can lead to a better baking quality in terms of quality traits like crude protein and the sedimentation value [
34].
In addition, lowering the seed density could also support the effect of a better nutrient supply of the single cereal plant, as different plant densities per unit may change plant architecture in terms of the number of spikes per m2 and grains per spike.
As free Asn is closely related to nitrogen uptake, storage and transport within plants [
24,
35], the question arose whether the level of free Asn and finally AA formation would be affected by a larger row distance and a lower seed density.
As such, a two-year field trial was established to investigate (i) the impact of row distance and seed density on yield, quality aspects and free Asn of two winter wheat cultivars, and (ii) the relation between the grain number per spike, crude protein, free Asn, and AA formation.
2. Materials and Methods
2.1. Experimental Site
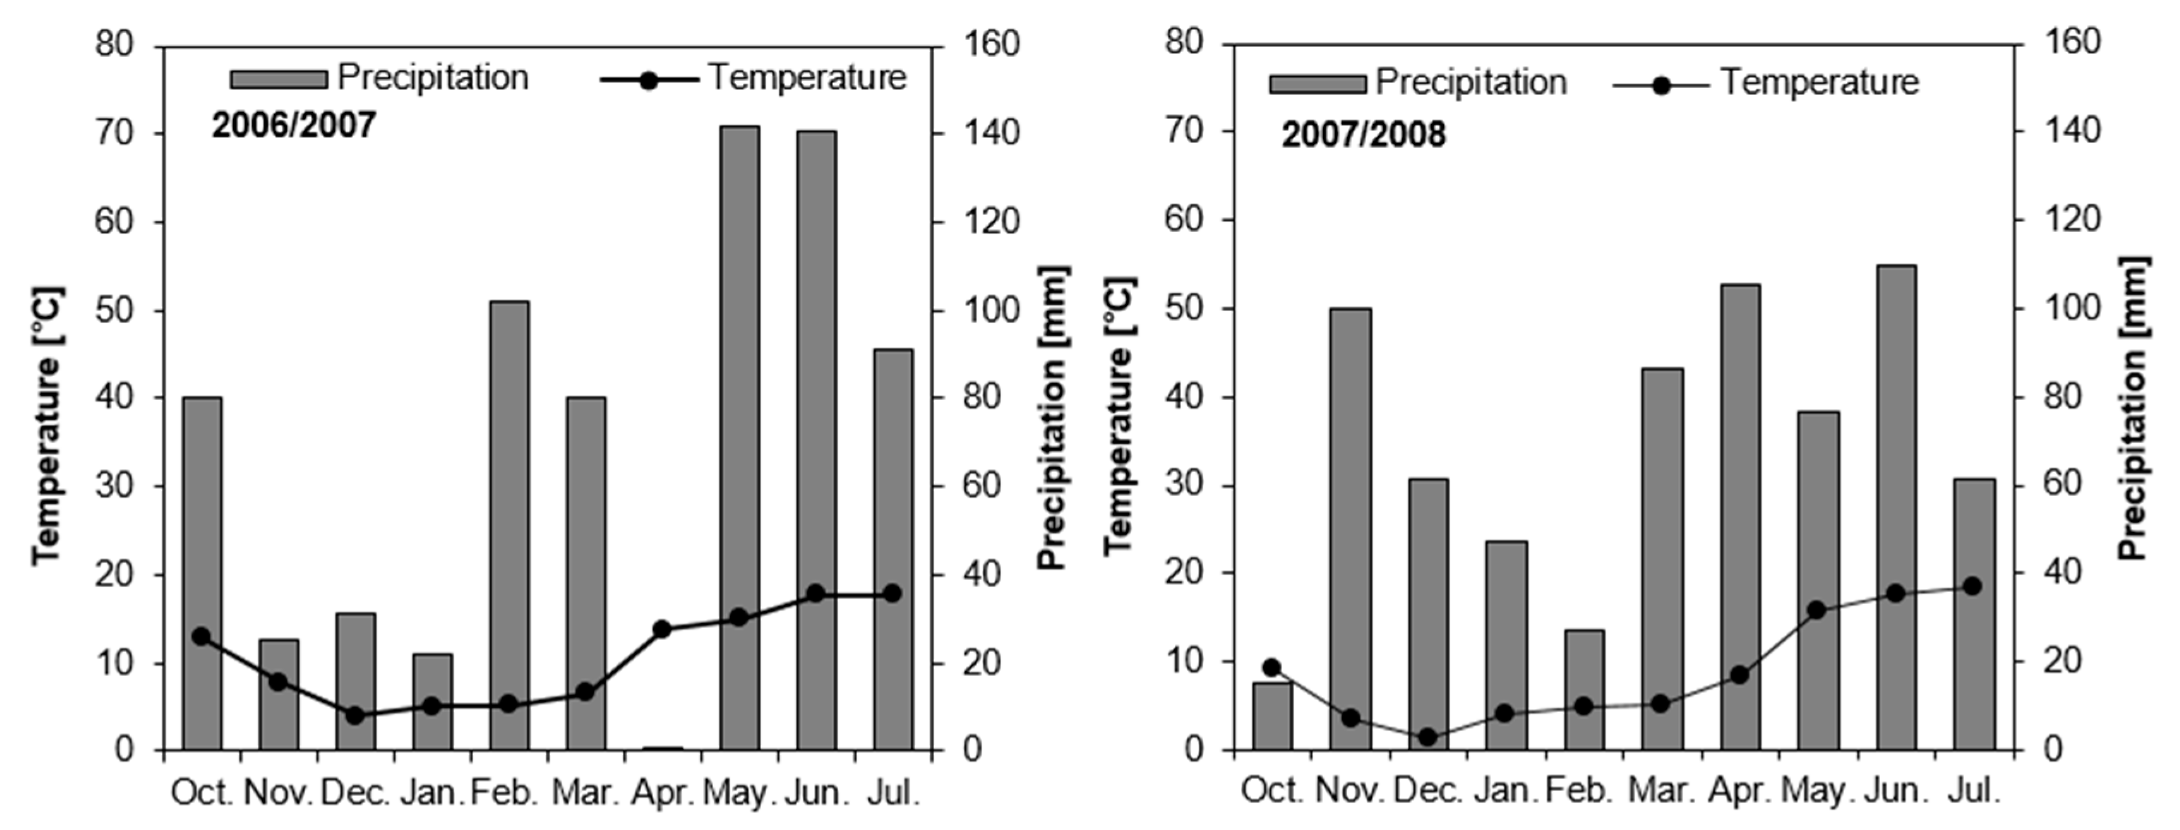
The field trial was carried out over two consecutive growing seasons (2006–2007; 2007–2008) at the experimental station for organic farming of the University of Hohenheim, Kleinhohenheim, Stuttgart (48°44′ N 9°12′ E; average annual temperature 8.8 °C; average annual rainfall 700 mm).
The research station is located 435 m above sea level in the southern peripheral part of Stuttgart, Germany.
Detailed data on temperature and rainfall during the seasons 2006–2007 and 2007–2008 are depicted in
Figure 1.
The soil at the trial site in Kleinhohenheim falls under the Luvisol type. It is characterized by a nearly 2 m thick horizon of loess to loamy clay. Therefore, it features a high-water holding capacity and is well suited for agricultural purposes. In spring 2007, mineral N content was 35 kg ha
−1 within a soil horizon of 0 to 60 cm compared to 62 kg ha
−1 in 2008. In
Table 1, the main results of the soil chemical analysis are presented.
2.2. Experimental Design
The field trial was set up as a randomized block design with three repetitions (plot size 4 × 6 m). As the trial was established according to the standards of organic farming (e.g., no artificial fertilizer, no pesticides). The previous crop in both years was winter wheat, while a 2-yr wheat clover grass mixture was grown in the years before.
Two different winter wheat cultivars (cv. Bussard and cv. Naturastar), two row distances, and two seed densities were tested. The tested treatments are shown in
Table 2.
2.3. Agronomic Practices
Primary tillage was done in both years with a moldboard plough (25 cm depth). Seed bed preparation was accomplished using a power harrow.
Sowing was done on 19 October 2006 and 24 October 2007. In total 100 kg N ha−1 were applied as liquid cattle manure (100 m3 ha−1: 1 kg N m−3 total nitrogen content, 4% dry matter) which was split into two rates of 50 m3 ha−1 at the start of vegetation and at the start of stem elongation.
No pesticides and no growth regulators were applied. If necessary, weeds were treated by a currycomb. Infestation of diseases was monitored, but the outcome showed no significant infestation.
Harvest was accomplished by a Hege 180 plot combine harvester (Hege, Eging am See, Germany) after grains had reached a dry matter content of 85%.
2.4. Analyses of Yield and Yield Components
2.4.1. Yield
Grain yields was determined by weighing the plot yield. Grain samples were dried at 105 °C for 24 h to determine grain moisture. Grain yields given refer to 86% dry matter content.
2.4.2. Thousand Kernel Weight
Thousand kernel weight (TKW) was determined by counting 1000 grains, which were dried to absolute dry matter content by a Contador® seed counter (Pfeuffer GmbH, Kitzingen, Germany).
2.4.3. Test Weight
The test weight was determined by a cereal sampler (Pfeuffer GmbH, Kitzingen, Germany) after drying grain samples to absolute dry matter content by using a grains volume of ¼ L.
2.5. Grain Quality Analyses
2.5.1. Flours
For the determination of quality parameters, the determination of the AA precursor content free Asn, and the AA formation potential, grain samples were milled on a laboratory mill (Quadrumat Junior, Brabender, Duisburg, Germany). Ash content of flours was about 0.5% of flour DM. Flour moisture was calculated from the weight loss before and after drying of about 5 g flour at 105 °C for 24 h.
2.5.2. Crude Protein Content
Total grain nitrogen content was determined by Near-Infrared-Spectroscopy (NIRS, NIRS 5000, FOSS GmbH, Rellingen, Germany). Calibration samples were analyzed according to the Dumas Method [
36] using a Vario Max CNS analyzer (Elementar, Hanau, Germany). The analyzed final nitrogen content was multiplied by a factor of 5.7 [
37] for the wheat samples.
2.5.3. Hagberg Falling Number
The Hagberg falling number was determined in line with ICC standard No. 107 using a PerCon 1600 Falling Number machine (PerCon, Hamburg, Germany) and 7 g of flour (weight adjusted for moisture concentration to 15%).
2.5.4. Zeleny’s Sedimentation Test
Zeleny’s sedimentation test was determined in wheat flours using 3.2 g flour according to ICC standard No. 116. The sedimentation values of the flours were adjusted to a 14% moisture level.
2.5.5. Free Asparagin
For free amino acids, extraction 2 g of wheat flour were mixed with 8 mL of 45% ethanol for 30 min at room temperature. After centrifugation for 10 min at room temperature with 4000 rpm and 10 min at 10 °C and 14,000 rpm, the supernatant was filtered through a 0.2 µm syringe filter and poured into vials. Analysis of free Asn was performed using Merck–Hitachi HPLC components. The pre column derivatization with FMOC [
38] was completely automated by means of an injector program. Subsequently, the derivatized Asn was separated on a LiChroCART Superspher RP 8 column (250 mm × 4 mm, Fa. Merck, Darmstadt, Germany) at a constant temperature of 45 °C. The fluorescence intensity of the effluent was measured at the excitation and emission maxima of 263 and 313 nm.
2.5.6. Acrylamide Formation Potential
The AA formation potential of wheat flour was assessed according to the AA contents of 5 g white flour in 250 mL Erlenmeyer flasks after heating in an oven for 10 min at 200 °C. Due to the complexity of the AA analysis, sample size was reduced to an overall number of 16 samples.
Sample preparation was accomplished according to the test procedure 200L05401 [
39] of the Chemische und Veterinäruntersuchungsamt (CVUA) Stuttgart.
After cooling the heated flour samples down to ambient temperature, 100 mL of bidestilled water and 100 µL of D
3-Acrylamide were added as an internal standard to the heated flour samples in the Erlenmeyer flasks. To completely extract acrylamide from the flour, samples were put in an ultrasonic bath for 10 min at 40 °C. After adding 1 mL of Carrez I and II to each of the samples, and shaking the flasks thoroughly, the samples were filtered using folded filter paper to separate the colloids and flour particles from the aqueous solution. Subsequently, samples were cleaned up by a solid phase extraction in a vacuum chamber after preconditioning the cartridges by 10 mL of bidestilled water and 10 mL methanol. After sample clean-up, around 1 to 2 mL of the eluate from each sample was filled in an autosampler vial and was deep frozen (−18 °C) until AA was determined by LC-MS-MS by the CVUA according to the test procedure 201L01301 [
40]. The eluates were separated by a graphite or RP18-phase and detected by tandem-mass-spectrometer. Quantification was undertaken by using the isotope-labeled internal standard (D
3-Acrylamide).
2.6. Statistical Analyses
For each trait listed in the section above, analysis of variance (ANOVA) was performed using the procedure PROC MIXED of the statistical software package SAS 9.2 (SAS Institute Inc., Cary, NC, USA). ANOVA was done for the main effects of year, treatment (row distance, seed density), cultivar, and all interactions. A mixed-linear model approach was used. All effects were taken as fixed.
In order to ensure normal distribution and equality of variances, the data was transformed if necessary. Means were analyzed for statistically significant differences using the Tukey range test. As a level of significance, α = 0.05 was chosen. For analyzing the coefficient of determination concerning the grains per spike, crude protein, free Asn, and AA, a linear regression was performed using the software package of Sigmastat 4.0 (Systat Software Inc., Cranes Software, San Jose, CA, USA).
3. Results and Discussion
3.1. Yield and Yield Components
Grain yield was significantly affected by year (Y), seed density (SD), and the interaction cultivar (Cv) × row distance (RD) (
Table 3). As the interactions Y × Cv × SD, Cv × SD × RD and Y × Cv × RD × SD were not significant for any tested trait, it was not listed in
Table 3.
Comparing years, in 2007 a grain yield of 3740 kg ha
−1 was harvested while in 2008 the average was 4350 kg ha
−1, around 700 kg ha
−1 higher. In addition to the year, the higher seed density of 350 grains m
−2 led to a significantly higher grain yield. The higher seed density resulted in a grain yield of 4190 kg ha
−1 compared with 4020 kg ha
−1 when using the smaller seed density. This was likely the result of more spikes m
−2 as the number of spikes m
−2 increased by the higher seeding rate (
Table 4). Indeed, less spikes m
−2 could only partially be compensated by an increased number of grains per spike (
Table 4). Similar results were observed by Landon 1994 [
41] and Arduini et al. [
42], who investigated the effect of seeding rate on the grain yield of wheat. Both reported a compensation by either a higher number of grains per spike or a higher kernel weight. Gooding et al. [
43], stated in their study that a lower seed density was compensated by a larger level of tillers and grain numbers per ear. In our work the effect of an increased number of tillers or a higher thousand kernel weight was not determined, while the number of grains per spike increased. However, the number of grains per spike could not compensate for the effect of a lower seed density on yield.
Row distance only had a significant impact on grain yield for some of the cultivars (cv). In this context, grain yield was significantly lower for the larger row distance of 30 cm if cv Bussard was grown and differed by around 300 kg ha
−1. For cv Naturastar, the row distance had no significant effect. Whereat, a yield increasing tendency was observed by enlarging the row distance but without being significant. The different reactions of both cultivars regarding row distance might be related to the varying structure of spikes per m
2 and grains per spike. As shown in
Table 4, cv Bussard responded to the larger row distance with a higher reduction of spikes m
−2 compared to cv Naturastar (
Table 4). Landon et al. [
41] developed a different effect of row distance in their study where increasing the row distance led to a higher grain yield due to an increased number of kernels per spike. However, in this study the number of grains per spike only marginally changed in the case of cv Bussard and the spikes per m
2 decreased (
Table 4). Thus, the larger row distance was not compensated by an increased number of spikes, nor by more grains per spike of cv Bussard (
Table 4).
The Thousand kernel weight (TKW) was significantly affected by the year, the cultivar, and the interaction of both (
Table 3). Neither row distance nor seed density had a significant effect. This is in contrast to a study carried out by Hiltbrunner et al. 2005 [
44], who reported an increase in TKW if the row distance was expanded. Nevertheless, the year had a significant effect as TKW was lower in 2008 (38.4 g) than in 2007 (40.5 g). Across years, the TKW of cv Bussard was 40.9 g, which was significantly higher than Naturastar at 38.0 g. This fits well to the monitored level of grains per spike, which were lowest for cv Bussard (
Table 4). This leads to the assumption that the grains of cv Bussard were bigger and thus a heavier TKW was reached. As cv Naturastar is known for reaching a high grain yield with a higher level of grains per spike, this leads to the suggestion that grains of this cv were generally smaller, leading to a lower TKW.
For the interaction Y × Cv in 2007, the highest TKW of 42.4 g was observed for cv Bussard, while TKW was lowest (37.4 g) for cv Naturastar in 2008. Finally, TKW was much more affected by the cultivar and year than by row distance or seed density.
Older studies reported that test weight can serve as a marker for flour yield [
45]. Newer findings have not supported this statement [
46]. However, test weight is still used in some countries as a quick test for grain quality. Higher amounts indicate rounder grains, leading to a better milling behavior and thus a higher flour yield. In contrast, smaller grains can include an uneven shape and thus provide lower test weights. In our study, test weight was significantly influenced by year, seed density, and the interaction Y × Cv (
Table 3). In 2007, the test weight was 80.9 kg hL
−1, which was significantly higher than for 2008 (78.5 kg hL
−1). Cultivar only had a significant effect in interaction with the year. Compared to Bussard (80.6 kg hL
−1), cv Naturastar in 2007 reached a much higher amount (81.2 kg hL
−1), while in 2008 there was no statistically proofed difference between the two (78.4 and 78.7 kg hL
−1, respectively).
Next to the year, the most relevant factor for test weight was seed density. A lower seeding rate (250 grains m
−2) led to a significantly lower test weight of 79.5 kg hL
−1, while the seeding rate of 350 grains m
−2 provided a test weight of 79.9 kg hL
−1. This can partly be explained by the differences in spikes per m
2 and the grains per spikes. Spikes per m
2 were higher if 350 grains m
−2 were sown, leading to a lower number of grains per spike (
Table 4). This leads to the assumption that grain size was bigger and thus the test weight also increased. This is well guided by the TKW, as cv Bussard with the smaller number of grains per spike reached the highest TKW, which was most likely caused by larger grains. Schuler et al. [
47] investigated the impact of seed and spike characteristics on test weight. They reported that number of seeds in spikes and test weight had a negative correlation of r = 0.41. Hence, if the seeds per spike increased, the test weight decreased. This fits well to the results of this study as lowering seed density to 250 grains m
−2 increased the number of grains per spike, especially for cv Naturastar (
Table 4). We assumed that the higher number of grains per spike led to a smaller grain size, which may explain the lower test weight. Finally, the lower seed density led to less spikes per m
2 and this was likely compensated by a higher rate of grains per spike along with smaller grains.
3.2. Baking Quality Traits
Falling number (FN) is a baking quality trait, as it refers to water absorption during dough preparation. Thus, effective preparation of dough requires a sufficient FN. Delayed grain harvest can cause pre-harvest sprouting causing a higher activity of enzymes (amylase). This may lead to a lower FN as consequence of polysaccharides decomposition (amylose and amylopectin) and thus affecting baking quality [
48]. FN was significantly influenced only by year and cultivar (
Table 3) but was not affected by row distance or by seed density. The mean FN was 244 s (cv Bussard) and 332.5 s (cv Naturastar). Brunner [
49], recommended that for organically produced wheat flours, FN should range between 160 and 280 s. They stated that such flours deliver a sufficient baking quality, including a normal, elastic well pored crumb and an adequate gas holding capacity. Thus, referring to reference [
49] the FN results revealed in our study indicates no negative effect on baking quality.
Crude protein (CP) is the most widely used method for estimating the baking quality of wheat flour other than gluten content. High levels of CP indicate a good preparation of foods such as biscuits. This trait was significantly influenced by year and the interaction Y × RD (
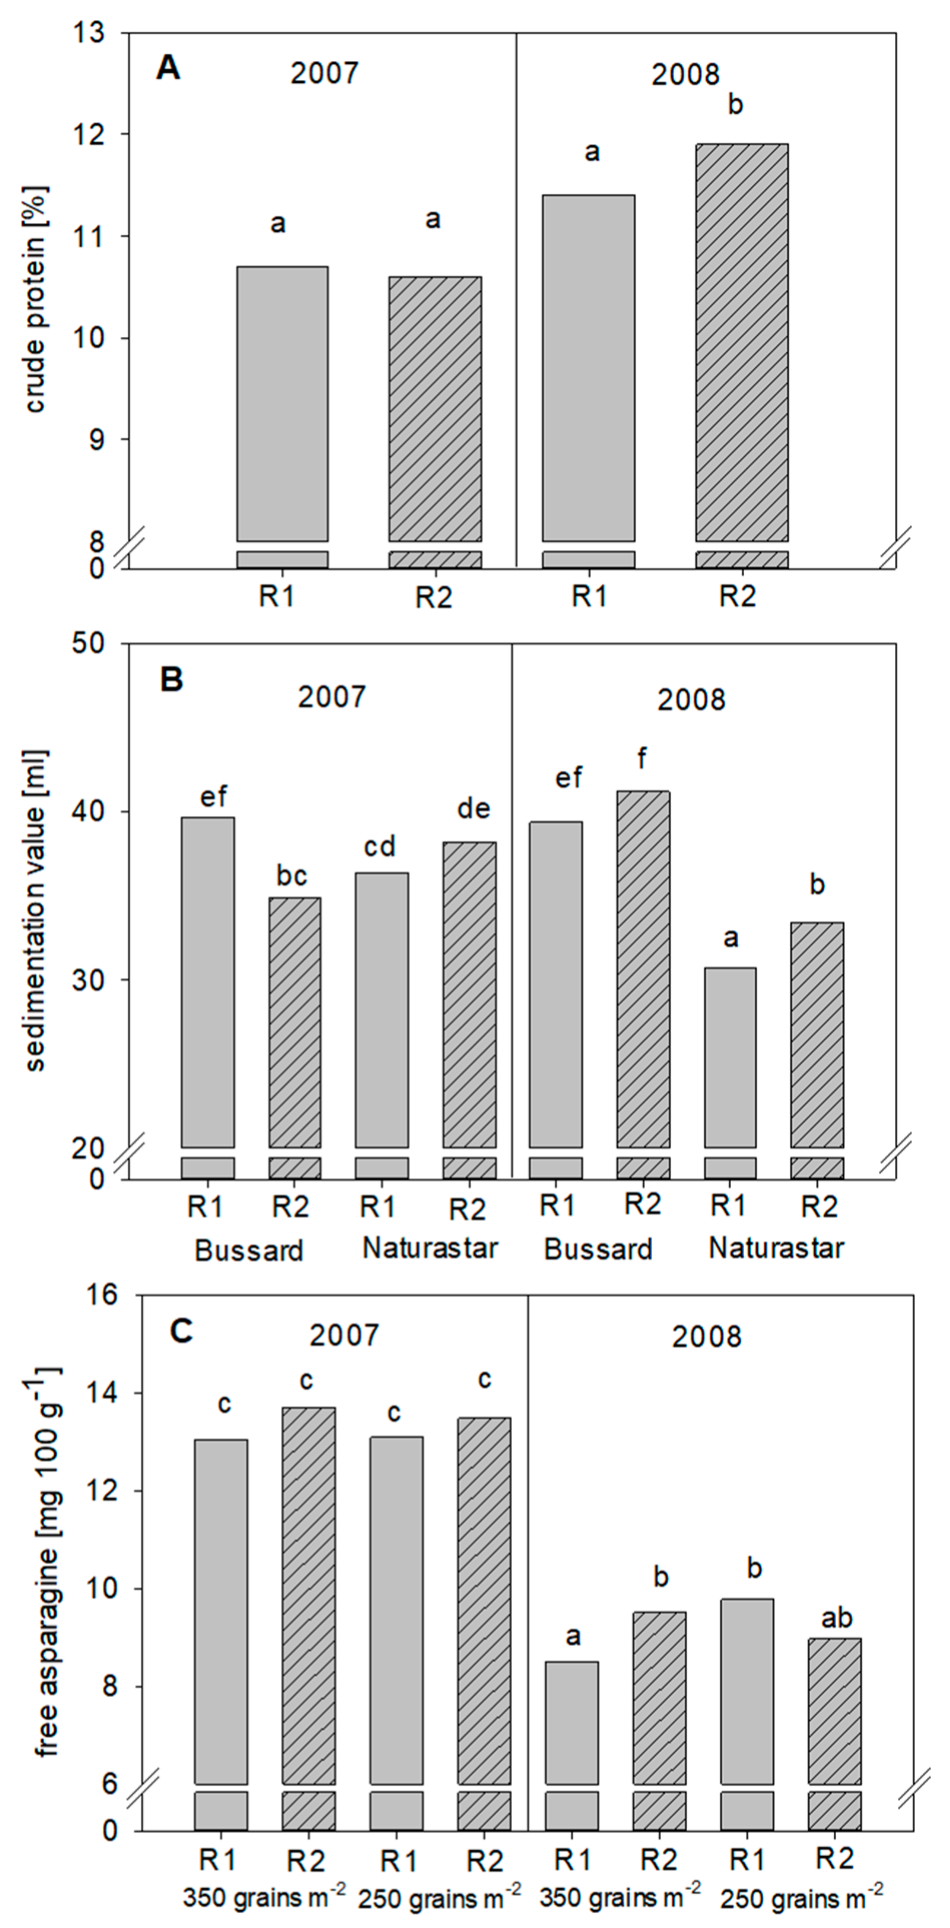
Table 3,
Figure 2A). Neither cultivar nor seed density had a relevant impact.
In 2008, CP content was 11.7% which was around 8% higher than in 2007 (10.6%). In general CP ranged from 10.4% to 12.2%. The high impact of the year can be explained by different weather conditions, especially during grain filling periods. In 2008, the temperature during grain filling period (May–July) was 1.4 °C higher than in 2007 (
Figure 1). This fits well to the corresponding rainfall, which was around 140 mm higher in the period May–July for 2007 compared to 2008. These weather conditions led to a better CP synthesis during 2008 and thus to higher CP values.
That climate conditions especially during grain development can influence grain composition was reported by Fuhrer et al. [
25], Shewry et al. [
50], and Ohm et al. [
51]. Further et al. [
25] reported the effects of ozone on the grain composition. They observed an increased CP level. Shewry et al. [
50] analyzed the impact of temperature and water availability during grain growth on grain composition. After the observation of 26 genotypes grown at different locations, they stated that mean temperature and precipitation was either positively or negatively related to phytochemical contents during grain growth, or to water-soluble arabinoxylan fiber in bran and white flour. As locations are closely related to environmental conditions like rainfall and sunshine, Ohm et al. [
51] observed a significant impact of locations on SDS unextractable polymeric protein parameters.
Nevertheless, as Brunner [
49] and Casagrande [
52] announced that a CP content of at least 10.5% is required to match baking industry needs for organic flours, the CP levels accomplished in this trial were sufficient.
Overall, only row distance had a significant effect on CP if the years were separated. While in 2007 no statistical implication was analyzed, in 2008 the larger row distance of 30.0 cm significantly raised the mean CP content by nearly 12% (
Figure 2A). This was around 5% more than for the smaller row distance, which reached a CP content of 11.4%.
In fact, 12% CP is a well synthesized amount, as the required level of the baking industry [
49,
52] of at least 10.5% was outnumbered by 1.5%. The impact of row distance on CP was also investigated by Becker et al. [
34] and Hiltbrunner et al. [
44]. Both studies revealed a higher protein content if the row distance was enlarged. Thus, it can be assumed that increasing the row distance may provide an opportunity in organic farming to match needed protein concentrations.
Nevertheless, it has to be taken into account that lower grain yields and more weed management efforts must be accepted if raised CP levels are the main target. Selecting a fitting cultivar (cv) could diminish yield loss, as in our study cv Naturastar (A-wheat) did not respond by lower grain yields if row distance was increased. But this might be an effect of different wheat classes.
Sedimentation value (SV) is a key parameter for interpreting quality of CP and therefore is of high relevance for baking quality. Compared to CP, significant effects regarding SV were more distinct as significant differences were obtained for the effect of the year, cultivar, and the interactions Y × Cv, Y × RD, Cv × RD, and Y × Cv × RD (
Table 3).
Concerning years, an SV of 37.3 mL was measured in 2007, while SV in 2008 was significantly lower, reaching 36.2 mL. As already explained in the CP section during grain filling, climate conditions, especially sun duration, could have affected this trait differently over different years.
Regarding the impact of row distance on CP and SV, both increased significantly in 2008 (
Figure 2A,B). However, the effect was more consistent for SV, as a slight trend of increasing SV by a larger row distance of 30.0 cm was obvious in both years (
Figure 2B). In general, SV ranged from 30.0 mL to 42.7 mL. The smallest level was obtained in 2008 for cv Naturastar if cropped in the narrow row distance, while the overall highest level was reached in 2008 by cv Bussard cropped in the larger row distance (
Figure 2B). Expanding the row distance to 30.0 cm increased SV only slightly from 36.5 mL to 37.0 mL. The effect was most notable for cv Naturastar as in both years, SV increased under the larger row distance, although it was only significant in 2008. For cv Bussard, the effect was not consistent.
The impact of row distance on quality trait SV within organic farming systems was also investigated by Becker [
34] and Germeier [
53]. Both studies announced that SV significantly increased if row distances were expanded to either 50.0 cm [
34] or 75 cm [
53]. Indeed, the row distance in our study was only increased to 30.0 cm but partially reached the same result. We suppose that if row distance could be further increased, then the effect on SV could have been more pronounced.
Nevertheless, a mean SV of at least 34 mL seems to be sufficient for the baking industry [
49]. That level was obtained in all treatments of the trial. Finally, larger row distances seem to support the requirements of the baking industry.
3.3. Free Asn and AA Formation Potential
Free Asn as main indicator for AA formation potential in cereals was significantly influenced by the year, the cultivar, and by the interactions Y × Cv, Cv × RD, SD × RD, Y × SD × RD (
Table 3). Neither SD nor RD as single treatment significantly affected the free Asn amount.
In 2007, free Asn was significantly higher than in 2008 (13.3 mg 100 g
−1 vs. 9.2 mg 100 g
−1). Separating years within 2007, the treatments, row distance, and seed density had no effect on free Asn levels at all. This trait ranged from 13.5 mg 100 g
−1 to 13.7 mg 100 g
−1 (
Figure 2C). By contrast, significant changes were observed in 2008. If the higher seed density of 350 grains m
−2 was chosen, increasing the row distance to 30 cm raised free Asn levels significantly from 8.5 mg 100 g
−1 to 9.5 mg 100 g
−1. A lower planting density could have changed grains per spike as was shown in
Table 4, especially for cv Naturastar. This cultivar showed a higher level of grains per spike if the seed density was decreased (30 to 38 and 32 to 38 grains spike
−1). By contrast, cv Bussard did not change the number of grains spikes
−1 if the seed density was lowered.
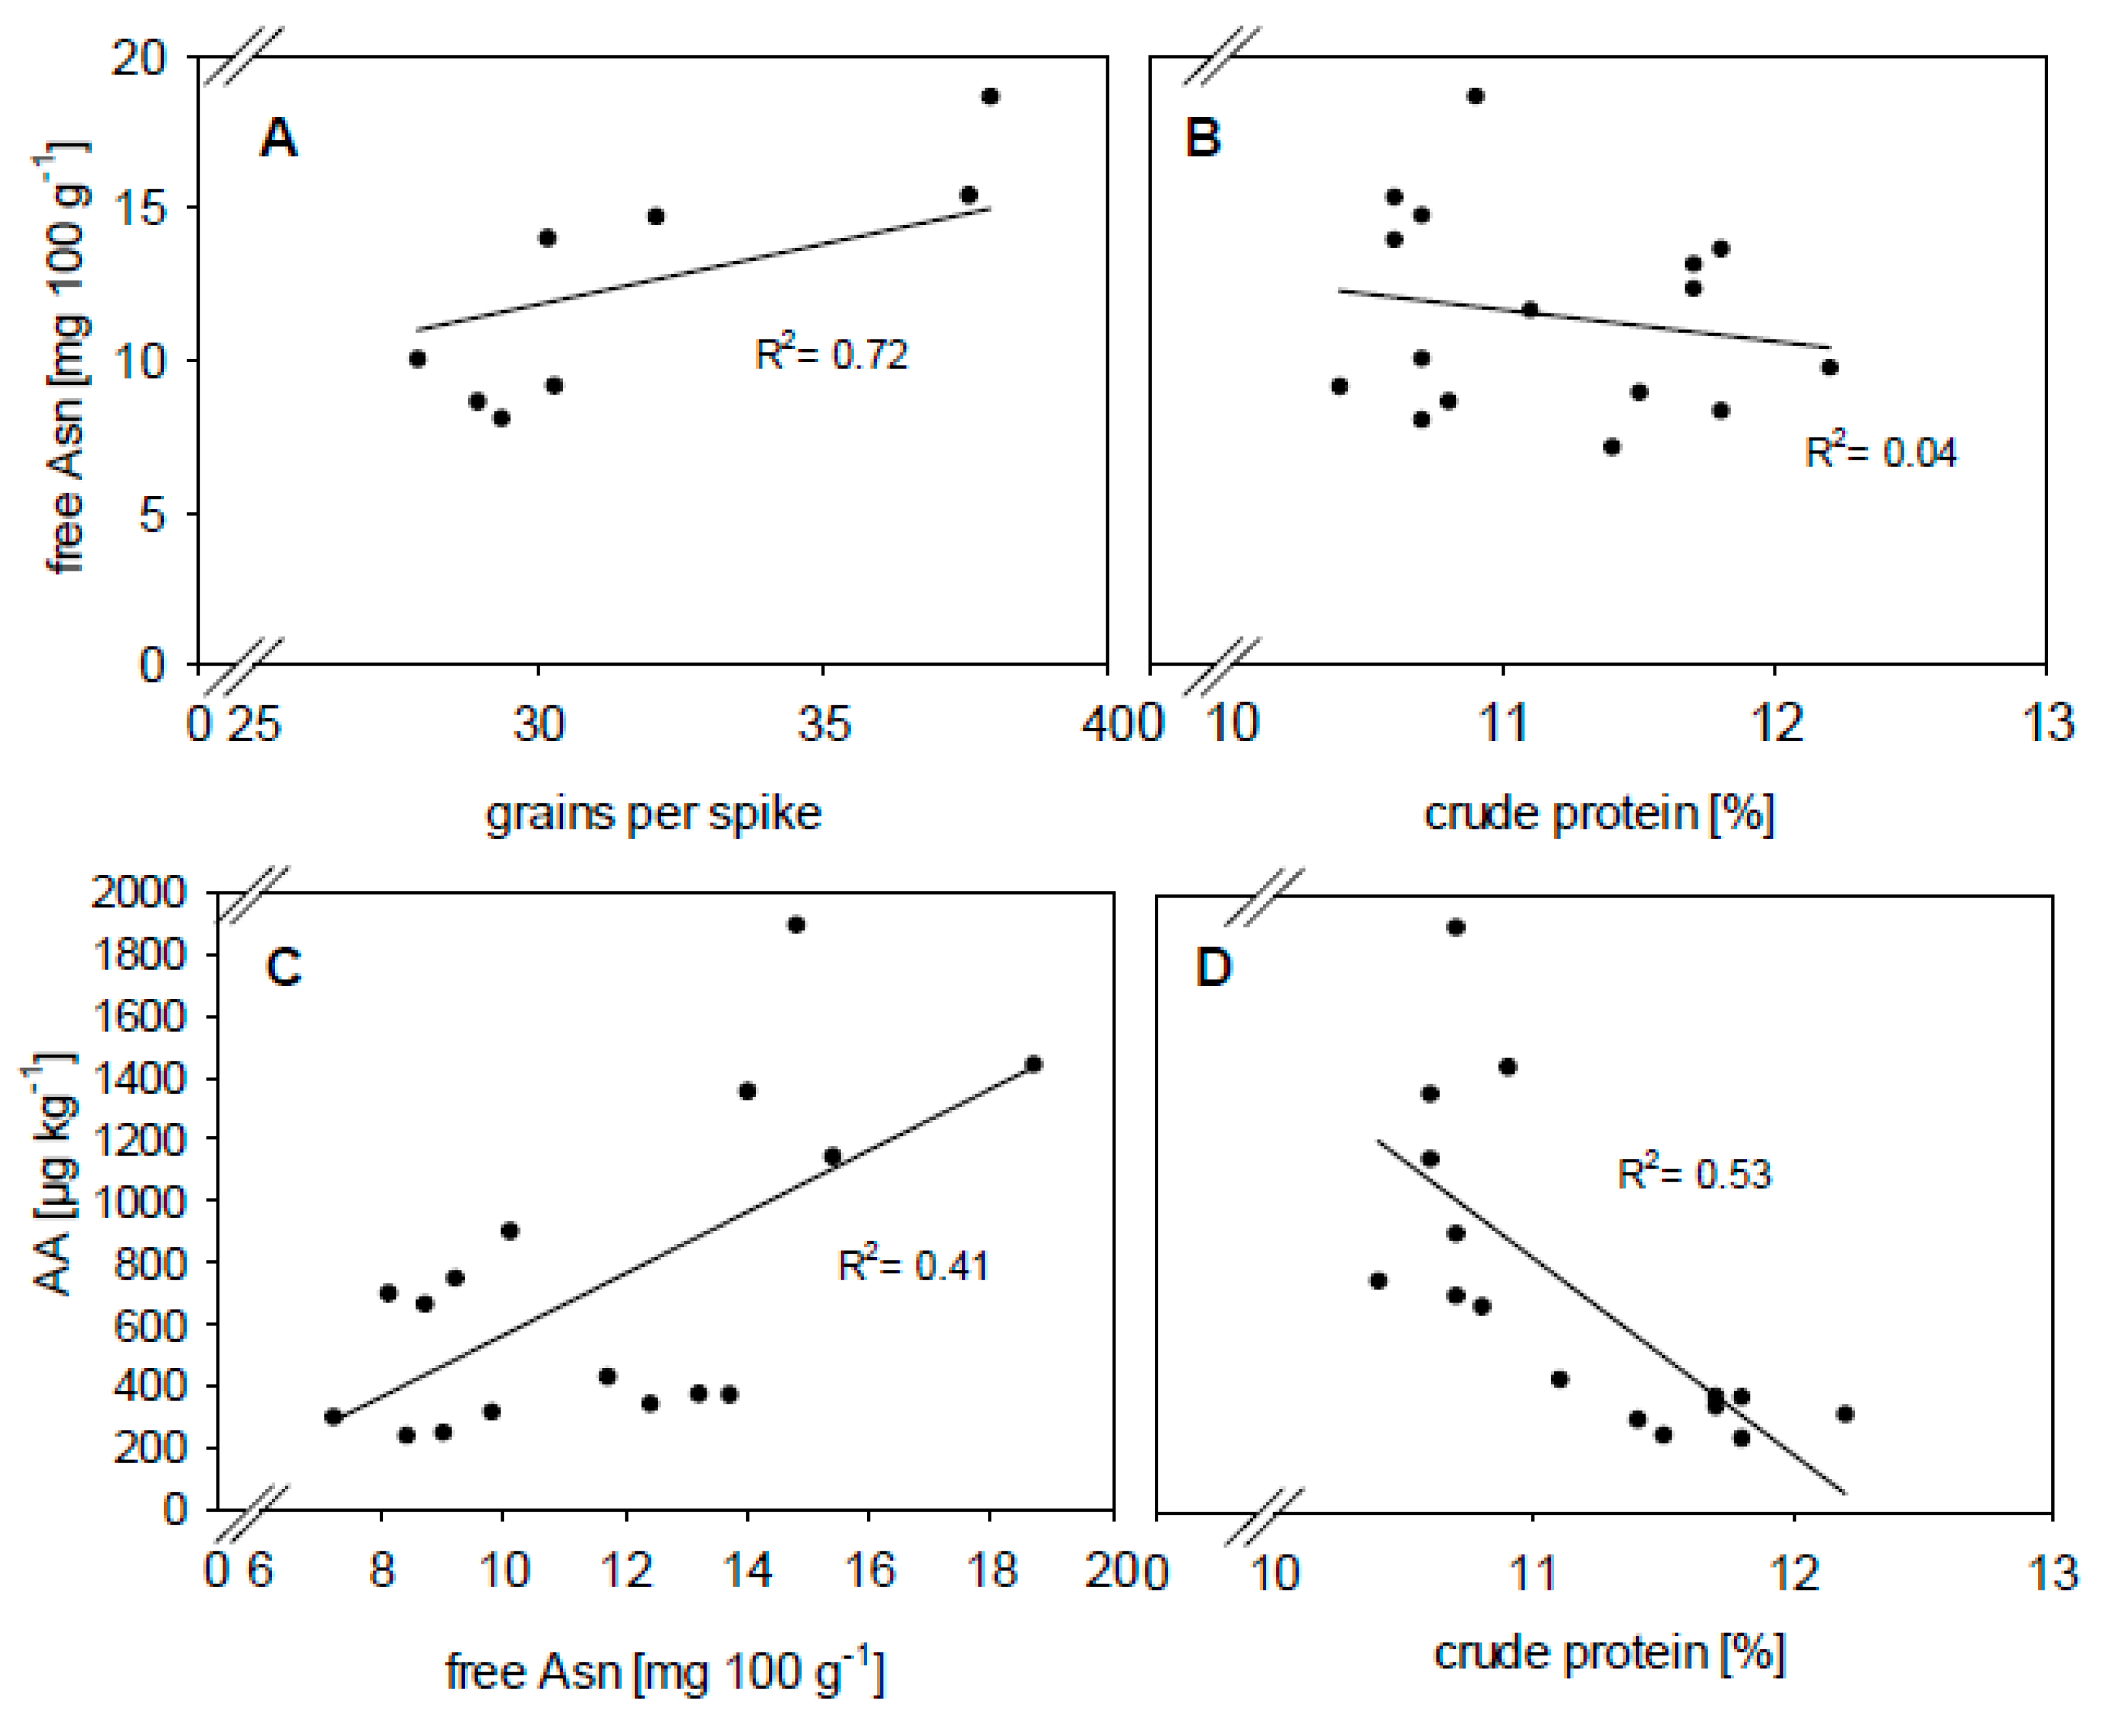
We suppose that smaller grains contain less starch and more soluble nitrogen (N) fractions, leading to higher CP levels or N fractions may be stored as free Asn. This fits well to the test weight, as it was stated above that bigger grains are expected to deliver higher test weights, including more starch. Furthermore,
Figure 3A presents the relation between free Asn and grains spike
−1. In this context, more grains spike
−1 indicates an increase in free Asn. This supports the above-mentioned postulation of higher soluble N fractions in smaller grains.
However, as it is known that wholemeal flour contains more free Asn compared to white flour [
23], the hull/grain ratio could have influenced the free Asn level since the proportion of hull can be higher if grains are smaller. In contrast, compared to the surface, bigger grains may have a lower proportion of hull. We measured the free Asn level of hull in our trial and analyzed a mean of around 53 mg 100 g
−1, and found almost 5-fold more Asn in hull compared to in white flour. This should also be taken into account.
Independent of the highest significant interaction for free Asn, a clear impact of the cultivar was obvious, as the level of free Asn almost was twice as high for cv Naturastar (14.2 mg 100 g
−1) compared to cv Bussard (8.8 mg 100 g
−1) (
Table 5).
Both cultivars differ in their quality class (Bussard: highest baking quality, Naturastar: high baking quality) and grain yield. Naturastar is related to higher grain yields while Bussard is a high protein wheat. We conclude that protein synthesis of Bussard leaves less soluble N in grain until harvest, while Naturastar used N for grain yield formation and lower protein synthesis, leading to the hypothesis of accumulating more soluble N fractions in grain. Those soluble N fractions may contain free Asn. This assumption is supported by the significant impact of cultivars on sedimentation value (SV), as this trait describes protein quality. Generally, SV was significantly higher for cv Bussard than for cv Naturastar (34.6 mL). Additionally, the higher Asn level of cv Naturastar fits well to the stated effect of smaller grains on Asn, since for cv Naturastar, grains per spike−1 were much higher compared to cv Bussard, leading to smaller grains.
Other studies, conducted either under conventional farming or organic farming conditions, also reported that years and cultivars [
19,
20,
21,
23,
26,
27,
28,
29,
31,
32] have a major impact on free Asn levels in cereal grains. In this context free Asn in conventional trials normally indicate a higher level as well as a broader range. Stockmann et al. [
31] reported an average of 15.5 mg free Asn 100 g
−1 in white flour and a range of 12 to 32 mg free Asn 100 g
−1 in conventionally cropped wheat cultivars. Nevertheless, our results of free Asn concentrations fit well to the references and are comparable.
The impacts of row distance and seed density has to date never been investigated before concerning free Asn. Stockmann et al. [
20] investigated the effect of nitrogen (N) supply in organically grown wheat cultivars. They increased the N supply step by step to a maximum of 180 kg ha
−1 and analyzed the impact on baking quality traits and free Asn. It was stated that a raised N supply increased protein significantly, but the free Asn level did not change significantly. Additionally, a high impact of cultivars under different N treatments was reported. The same was found in our study, as above all row distances were able to increase N availability and could have similar effects to those of N treatments.
Hence, those results support the assumption that raising nutrient supply by increasing row distance will increase the protein content and sedimentation value without elevating free Asn.
3.4. Relationship between Baking Quality, Yield Components, Free Asn, and AA
Free Asn as precursor of AA formation potential was not related to crude protein (
Figure 3B, R
2 of 0.04). Thus, raising baking quality by using treatments like larger row distances does not increase AA formation potential in the case of free Asn. That is also indicated by the regression of crude protein and AA formation (R
2 = 0.53,
Figure 3D). Studies are available reporting either a clear relation between free Asn and protein [
23] or no such relation [
51]. Thus, further studies investigating the relation between crude protein and free Asn, especially for wheat, are highly important.
The relation between free Asn and AA formation in conventionally cropped cereals was reported in different studies [
7,
54]. However, for cereals grown under organic farming, this relation has not been investigated intensively. Across all treatments free Asn seems to be a main precursor of AA formation, as shown by an R
2 of 0.41 (
Figure 3C). Thus, it seems that in organically grown wheat flours, similar mechanism pathways seem to be present during food processing to those for conventional flours. However, the relation was smaller, wherefore we suppose that other amino acids took part in AA formation. Such findings were also reported by Mottram et al. [
4] and Stadler et al. [
5].
To date, no study investigated the relation between grain number per spike and free Asn amount (
Figure 3A). Interestingly, increasing grain numbers per spike increased the free Asn, as indicated by a close relation of R
2 = 0.72. In this context more grains per spike indicate a smaller grain size as the spike has only a defined size. Thus, it can be assumed that smaller grains might contain more free Asn. These findings correspond well with the results mentioned above, where the level of free Asn was highest for cv Naturastar, while also having a high number of grains. This outcome was additionally assisted by the analyzed sieve grading (data no shown), where grains were separated into four grain sizes (>2.8 mm, >2.5 mm, >2.2 mm, and <2.2 mm). In this context cv Bussard reached the biggest grain size fraction (>2.8 mm) for 60% to 80% of its kernels across various years, while for cv Naturastar the equivalent was only 40%. Most kernels of cv Naturastar were within the smaller grain size fractions. In addition, cv Naturastar also had a lower TKW. Overall, free Asn and TKW reached a negative regression of R
2 = 0.71 (2007) and 0.49 (2008), indicating that smaller grains led to lower TKW and thus an increase in Asn concentration.
Hence, all three traits (TKW, grains per spike, sieve grading) indicate smaller grains with higher free Asn concentrations. Such a relation (grain number per spike vs. free Asn) has not been observed by other studies before.
Nevertheless, it should also be taken into account that bigger grains might contain less free Asn as a consequence of a thinning effect. Transferring starch assimilates the grain short before the harvest could dilute the level of Asn in grain. However, our results do not support this assumption.
Moreover, Navrotskythe et al. [
55] found that thousand kernel weight and kernel size correlated with free Asn by r = 0.3. This is also in contrast to the supposed dilution effect. Further, Navrotskythe et al. [
55], reported that delayed harvest elevated free Asn concentration. Delaying harvest is linked to enhancing the possibility of pre-harvest sprouting, which leads to an increase in free Asn [
56]. Taking these effects into account, the correlation between kernel weight/kernel size and Asn in the study of Navrotskythe et al. [
55] could have been covered by the delayed harvest. However, a falling number was not mentioned in their study, which makes finding common relations between both studies difficult. Additionally, in our study no pre-harvest sprouting seemed to occur, as the falling number was not decreased.
In contrast to our results, no relation between free Asn and TKW respectively kernel weight was reported by Corol et al. [
23]. They stated that free Asn is not determined by grain size and grain number per plant. Further, they found higher levels of free Asn in taller cereal plants. We suppose that taller plants differ in their grain number and structure compared to smaller ones. Moreover, larger stems may differ in their transferring ability of nitrogen during grain development leading to less nitrogen mobilization directed to the grains, which could have affected free Asn assimilation. However, it is worth noting that Corol et al. [
23] investigated wholemeal flour. This was in contrast to our study as we used white flour, wherefore different outcomes can be expected. Nevertheless, it would be interesting to investigate if free Asn in smaller plants is increased by a higher number of grains per spike. Further, as we just cropped two cultivars, additional trials should be carried out, including an enlarged number of wheat cultivars focusing on grain structure and free Asn value.
The fact that smaller grains may contain more Asn can to some extent be explained by the higher proportion of hull in relation to the full grain size [
57]. Studies of Corol et al. [
23] did not support these results as they announced no relation between free Asn and yield of flour and bran. We also analyzed Asn concentration in hull and found up to fivefold higher levels compared to white flour. In addition, rye and einkorn seems to have much higher free Asn concentrations than wheat [
32]. At the same time, both species have much smaller grains than wheat (TKW: rye: 28–36 g, einkorn: 21–35 g, wheat: 40–55 g). Moreover, protein fractions also differ a lot between these cereals, which could explain the different Asn levels.
In summary, the described relations above provide an absolutely new insight of Asn synthesis and interaction with other traits. This forces the need for future studies revealing the interactions of spike/grain structure and free Asn.
4. Conclusions
The study aimed to assess the impact of row distance and seed density on grain quality, yield components, and yield in organically grown wheats. Although all traits were influenced by year and mostly by cultivar, increasing the row distance also increased the baking quality traits of the crude protein level and the sedimentation value, while free Asn concentration was affected only to a minor extent. Thus, we recommend larger row distances as a feasible way of raising baking quality traits without increasing free Asn levels, which act as precursors for AA formation. Seed density seems to be of minor relevance, as it only affected grain yield and test weight. Nevertheless, as seed density may affect plant space, seed density should be taken into account in further studies, since it may lead to changes in baking quality traits. Zhang et al. [
58] reported that increasing plant density had an effect on e.g., grain protein concentration, amount and composition of protein fractions as well as loaf volume in interaction with nitrogen supply. Baking quality traits increased upon increasing the plant density if the plants were highly fertilized with nitrogen, while it decreased if no nitrogen was fertilized. As organic farming is a so-called low input system, the effects of seed density on baking quality must be considered.
Moreover, gluten quality is also important, as described by Augspole et al. [
59]. They reported significantly lower gluten content in wheat grains grown under organic farming conditions, while gluten was significantly stronger compared to conventionally cropped samples. Especially under organic farming conditions, strong gluten quality seems highly important for obtaining a good baking performance.
However, if higher yields are required, then seed density should not be diminished. In addition, the study revealed new relationships between yield components (grain structure, TKW, grains per spike) and free Asn. It seems that smaller grains contain more free Asn, which opens new insights into Asn synthesis during grain development.
Thus, future studies revealing the interaction of spike/grain structure and free Asn would be of great interest.

 ,
, 


