1. Introduction
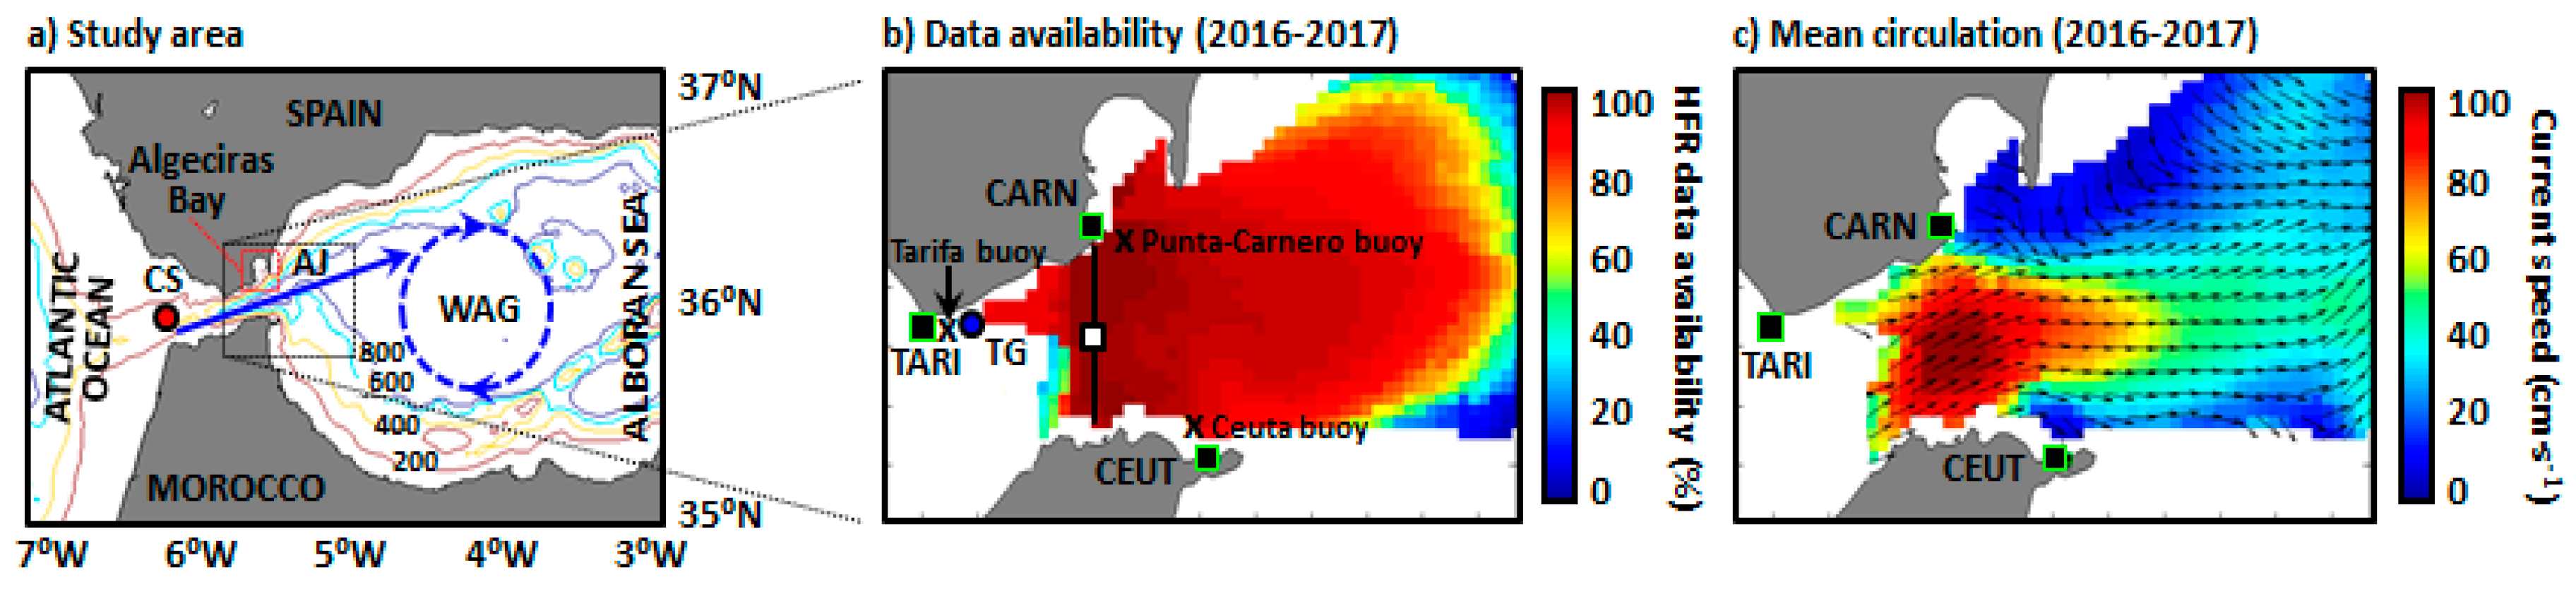
The Strait of Gibraltar (SoG hereinafter), the unique connection between the semi-enclosed Mediterranean basin and the open Atlantic Ocean, is characterized by a two-layer baroclinic exchange which is hydraulically controlled at Camarinal Sill (
Figure 1a). Whilst saltier Mediterranean water flows out at depth, an eastward surface jet of relatively fresh Atlantic water (AJ) flows into the Alboran Sea by surrounding the quasi-permanent Western Anticyclonic Gyre (WAG) and the more elusive Eastern Anticyclonic Gyre (EAG) in a wavelike path. As the WAG owes its existence to the input of new Atlantic waters provided by the AJ, both structures are widely considered to be coupled and usually referred to as the AJ-WAG system [
1]. A significant number of analytical, field and modeling studies have previously attempted to disentangle the AJ-WAG system and properly explain the underlying physical processes [
1,
2,
3].
The position, intensity and direction of the AJ fluctuate in a broad range of temporal scales, driving the upper-layer circulation of the Alboran Sea with subsequent physical and biological implications [
4,
5,
6]. For instance, the presence of an intense AJ close to the northern shore of the Alboran Sea reinforces the coastal upwelling and therefore increases both the nearshore chlorophyll concentration and the spawning of fish in this region [
5,
7]. By contrast, meteorologically-induced inflow interruptions can trigger the weakening and even the decoupling of the AJ-WAG system, the subsequent eastward migration of the WAG and the genesis of a new gyre that coexists with the other two, giving rise to a three-anticyclonic-gyre situation [
8].
Within this context, the AJ pattern has been traditionally described to oscillate between two main circulation modes at seasonal scale [
9,
10]: (i) a stronger AJ flows northeastwards during the first half of the year; (ii) a weaker AJ flows more southwardly towards the end of the year. Sea level pressure (SLP) variations over the Western Mediterranean basin and local zonal wind (U) fluctuations in the Alboran Sea have been usually considered to be the main factors controlling and modulating the AJ [
11,
12]. At higher time scales, diurnal and semidiurnal variations of the mean flow through the SoG are mainly due to interaction of tidal currents with the intricate topography [
13]. In particular, local wind has been largely invoked as the primary driving agent to explain both the intensification of the surface inflow during prevalent westerlies and also extreme AJ collapse events recorded when intense easterlies are predominant [
14]. The zonal wind intensity has been reported to follow an annual cycle with more westerly (easterly) winds during winter (summer) months [
15]. The seasonal variability and occasional interruptions of the Atlantic inflow due to meteorological forcing have been previously investigated with in situ data from fixed moorings [
10,
11]. More recently, a considerable number of satellite tracked drifters were released on both sides of the SoG within the framework of MEDESS-4MS project, thus providing a complete Lagrangian view of the Atlantic waters inflow into the Alboran Sea [
16,
17].
The main goal of this work is twofold: firstly, to build up upon previous works and characterize the AJ dynamic during a 2-year period (2016–2017) by using novel remote-sensed high-resolution current estimations. Secondly, to provide further insight into a singular event: the quasi-permanent full reversal of the AJ surface inflow through the entire selected transect (
Figure 1b) during, at least, 48 h when intense easterlies episodes were prevalent. The triggering met-ocean factors (i.e., the atmospheric and tidal forcing) were explored along with the physical implications in terms of sharp variations in the sea surface temperature during summertime. A variety of full reversal episodes was detected and the related wind-induced circulation patterns were interpreted.
To this end, a High-Frequency radar (HFR) system was used, since it provides quality-controlled hourly maps of the surface currents in this first-order geostrategic spot (
Figure 1b). As shown, data availability was significantly high (almost 100%) in the selected transect for the study period, decreasing in the easternmost sectors of the coverage domain. The accuracy of HFR observations, which are often affected by intrinsic uncertainties (radio frequency interferences, antenna pattern distortions, environmental noise, etc.), was previously assessed by comparing them against in situ data provided by a current meter [
18]. Skill metrics improved when calibrated antenna patterns were used to process radial data. Recent research with this HFR network successfully investigated the water exchange between Algeciras Bay (
Figure 1a) and the SoG [
19], the impact of the atmospheric pressure fluctuations on the mesoscale water dynamics of the SoG and the Alboran Sea [
20], or the dominant modes of spatio-temporal variability of the surface circulation [
21].
As a consequence, this HFR network can be considered to be an appropriate device to effectively monitor the AJ dynamics in near real-time, with current pulses often exceeding 200 cm·s
−1 and time-averaged north-eastward speeds around 100 cm·s
−1 in the narrowest section of the SoG (
Figure 1c). In the same line, this observing platform is also assumed to be capable of reliably portraying the AJ variability and the aforementioned episodic full reversals of the surface flow thanks to its significant spatio-temporal resolution, hence constituting an additional asset for wise decision-making of Algeciras Bay Harbor operators [
22]. A detailed characterization of this unusual phenomenon in the SoG is relevant from diverse aspects, encompassing search and rescue operations (to adequately expand westwards the search area), the management of accidental marine pollution episodes (to establish alternative contingency plans), or safe ship routing (to maximize fuel efficiency).
The paper is organized as follows.
Section 2 outlines the specific instrumentation used in this study.
Section 3 describes the main results obtained. Finally, a detailed discussion of the results, along with future plans, is presented in
Section 4.
2. Materials and Methods
The study domain includes an array of three coastal buoys and a tide-gauge operated by Puertos del Estado (
Figure 1b), providing quality-controlled hourly-averaged observations of sea surface temperature (SST) and sea surface height (SSH), respectively. To ensure the continuity of the data record, occasional gaps detected in time series (not larger than 6 h) were linearly interpolated. Basic features of each in-situ instrument are described in
Table 1.
The HFR system employed in the present study consists of a three-site shore-based CODAR Seasonde network, installed within the framework of TRADE (Trans-regional Radars for Environmental applications) project and supported by European FEDER funding. The system covers the easternmost area of the SoG, including the mouth of the Algeciras Bay and part of the western Alboran Sea (
Figure 1b,c). The sites, currently owned and operated by Puertos del Estado, were deployed in two different stages. The first two sites started data collection on May 2011: Ceuta (39.90° N, 5.31° W) and Punta Carnero (36.08° N, 5.43° W). Afterwards, the third site Tarifa (36.00° N, 5.61° W) was installed in October 2012 in order to properly resolve the baseline between Ceuta and Punta Carnero and also to gain accuracy over the entire radar coverage. Hereafter the sites will be referred to by their four-letter site codes: CEUT, CARN, and TARI, respectively (
Figure 1b).
Each site operates at a central frequency of 26.8 MHz with a 150 KHz bandwidth, providing hourly radial measurements with a cut-off filter of 250 cm·s
−1, a threshold defined according to the historical values observed in the area. The maximum horizontal range and angular resolution are 40 km and 5°, respectively. The estimated current velocities are representative of the upper 0.5 m of the water column. Only calibrated antenna patterns are used to process radial data due to their positive impact in HFR accuracy, as previously proved by Reference [
18]. Radial current measurements from the three sites are geometrically combined with an averaging radius set to 3 km, in order to estimate hourly total current vectors on a Cartesian regular grid of 1 × 1 km horizontal resolution.
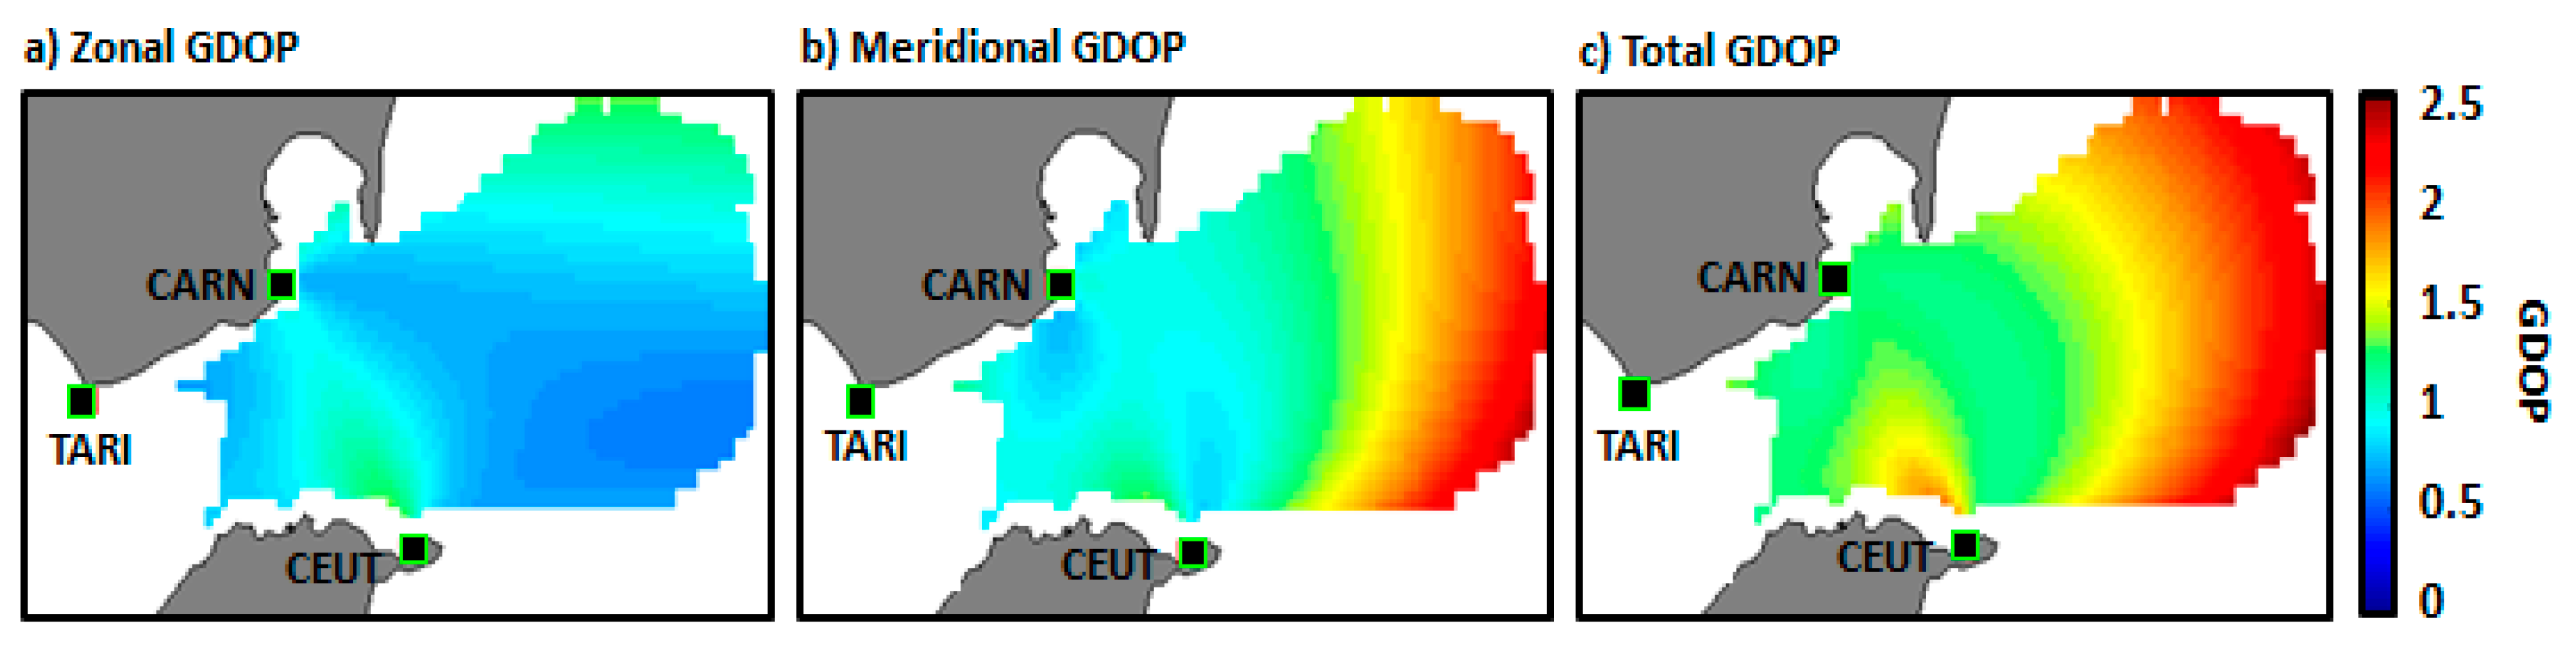
A source of error to be considered in the computation of the total vectors is the so-called Geometrical Dilution of Precision (GDOP). The GDOP is defined as a dimensionless coefficient of uncertainty that characterizes how radar system geometry may impact on the measurements accuracy and position determination errors, owing to the angle at which radial vectors intersect [
23]. Maps of east and north GDOP for an HFR system generally follow a pattern where their values increase with the distance from the radar sites and along the baselines (lines connecting two HFR sites) due to poor intersecting beam geometry, as the combining radial vectors are increasingly parallel and the orthogonal component tends to zero.
Figure 2a,b illustrates the zonal and meridional components of the GDOP over the HFR domain, estimated according to the formulation of Reference [
23]. The values of GDOP in the baselines are low, less than 1.5 for both components. The spatial distribution of the sites allows resolving the central region of the SoG, minimizing the GDOP of the system in this sensitive area. The baseline between CEUT and CARN is resolved using radial vectors from TARI, while the baseline between TARI and CEUT is resolved using radial vectors from CARN. On the other hand, the GDOP for the meridional component increases in the eastern region of the domain, reaching values of 2.5 in the boundary (
Figure 2b). In this area, only radial vectors from CARN and CEUT are used to compute the total velocities and the direction of their radial vectors is almost parallel. In this context, the transect here used to examine the AJ surface inflow was readily selected as the associated total GDOP (
Figure 2c) was reduced (below 1.3) and the spatial and temporal data coverage were optimal during 2016–2017 (
Figure 1b). A similar approach was previously adopted in Reference [
24] to evaluate the water renewal mechanism and the related inshore-offshore exchanges in the Gulf of Naples. From an oceanographic perspective, the election of such transect was also convenient to better characterize both the intensity and direction of the AJ, since its midpoint covers the area where the highest peak of current speed is usually detected and also where the inflow orientation is not influenced yet by the water exchange between Algeciras Bay and the Strait of Gibraltar, as shown in
Figure 1c.
Finally, the prevailing synoptic atmospheric conditions were inferred from three-hourly predictions of sea level pressure (SLP) and zonal wind at 10 m height (U-10), provided by the European Center of Medium Weather Forecast (ECMWF).
3. Results
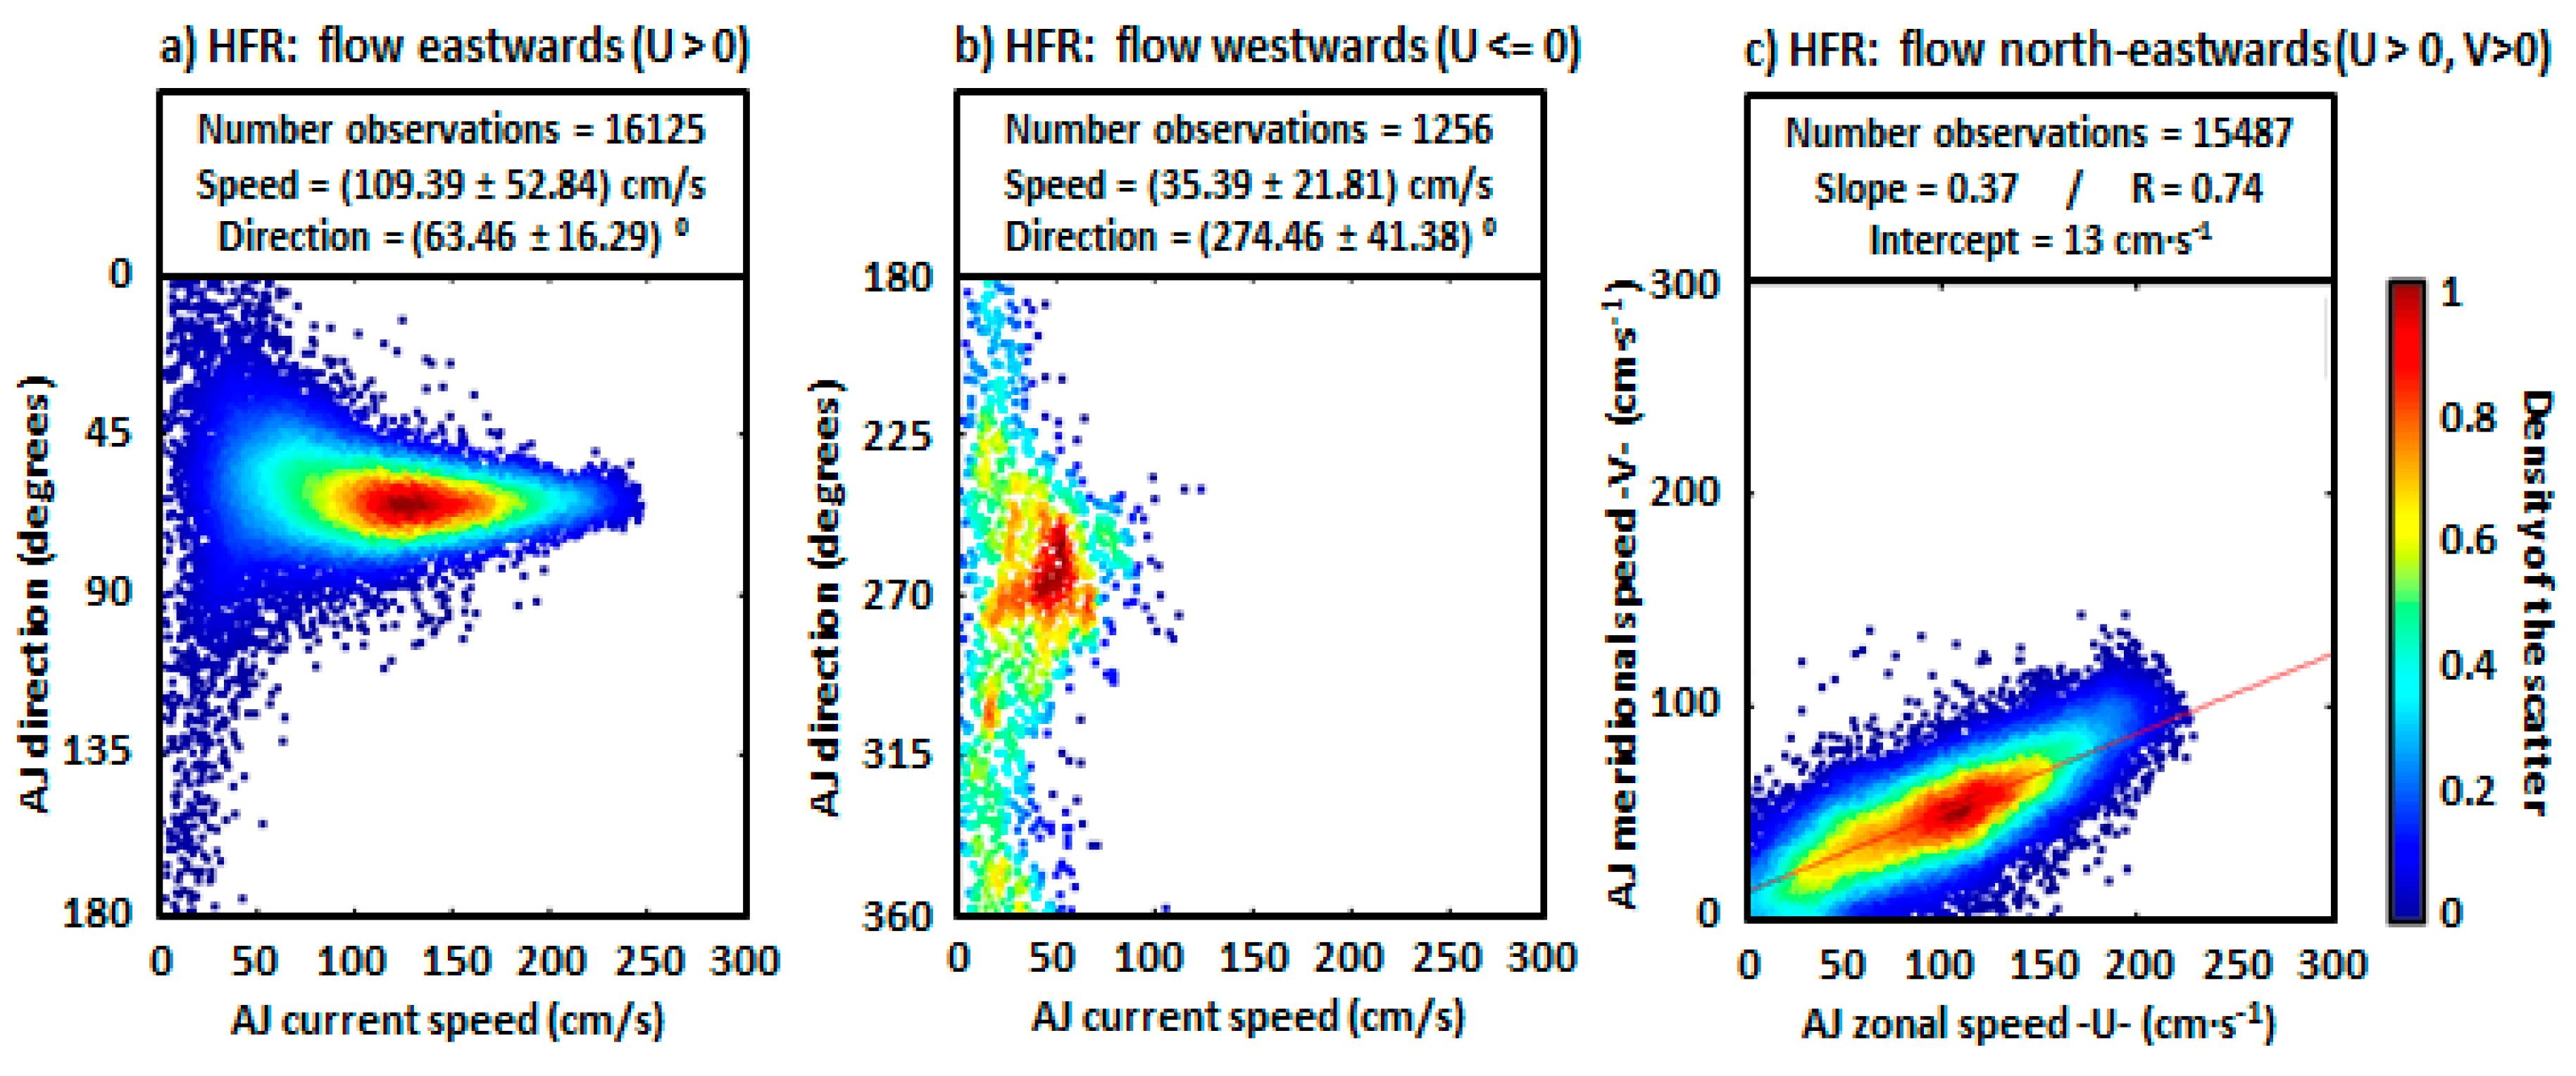
The scatter plot of HFR-derived eastward current speed against direction at the midpoint of the selected transect revealed that currents stronger than 50 cm·s
−1 flowed predominantly towards the North-East, forming, on average, an angle of 63° measured clockwise from the North (
Figure 3a). The mean eastward current speed was 109 cm·s
−1 for the analyzed 2-year period and speed peaks clearly reached values up to 250 cm·s
−1. Velocities below 50 cm·s
−1 were registered along the entire range of eastward directions (0–180°). Westwards currents, albeit minority (1256 hourly observations during 2016–2017, 8% of the time), were also observed and tended to predominantly form an angle of 274° with averaged speeds about 35 cm·s
−1 (
Figure 3b). Higher velocities (>50 cm·s
−1) were scarcely observed for directions ranging from 240° to 290°. Since the AJ flowed predominantly north-eastwards (15,487 observations, 88% of the time), a scatter plot of zonal versus meridional current speed was also computed to infer the relationship between both components in terms of strength of the flow (
Figure 3c). According to the results derived from the best linear fit, they were highly and positively correlated (0.74). Moreover, the zonal velocity component emerged to be, on average, almost three times stronger than the meridional current speed (as reflected by a slope of 0.37), thus highlighting the relevance of the along-shore transport in the water exchange between the Atlantic Ocean and the Mediterranean Basin, in agreement with [
4].
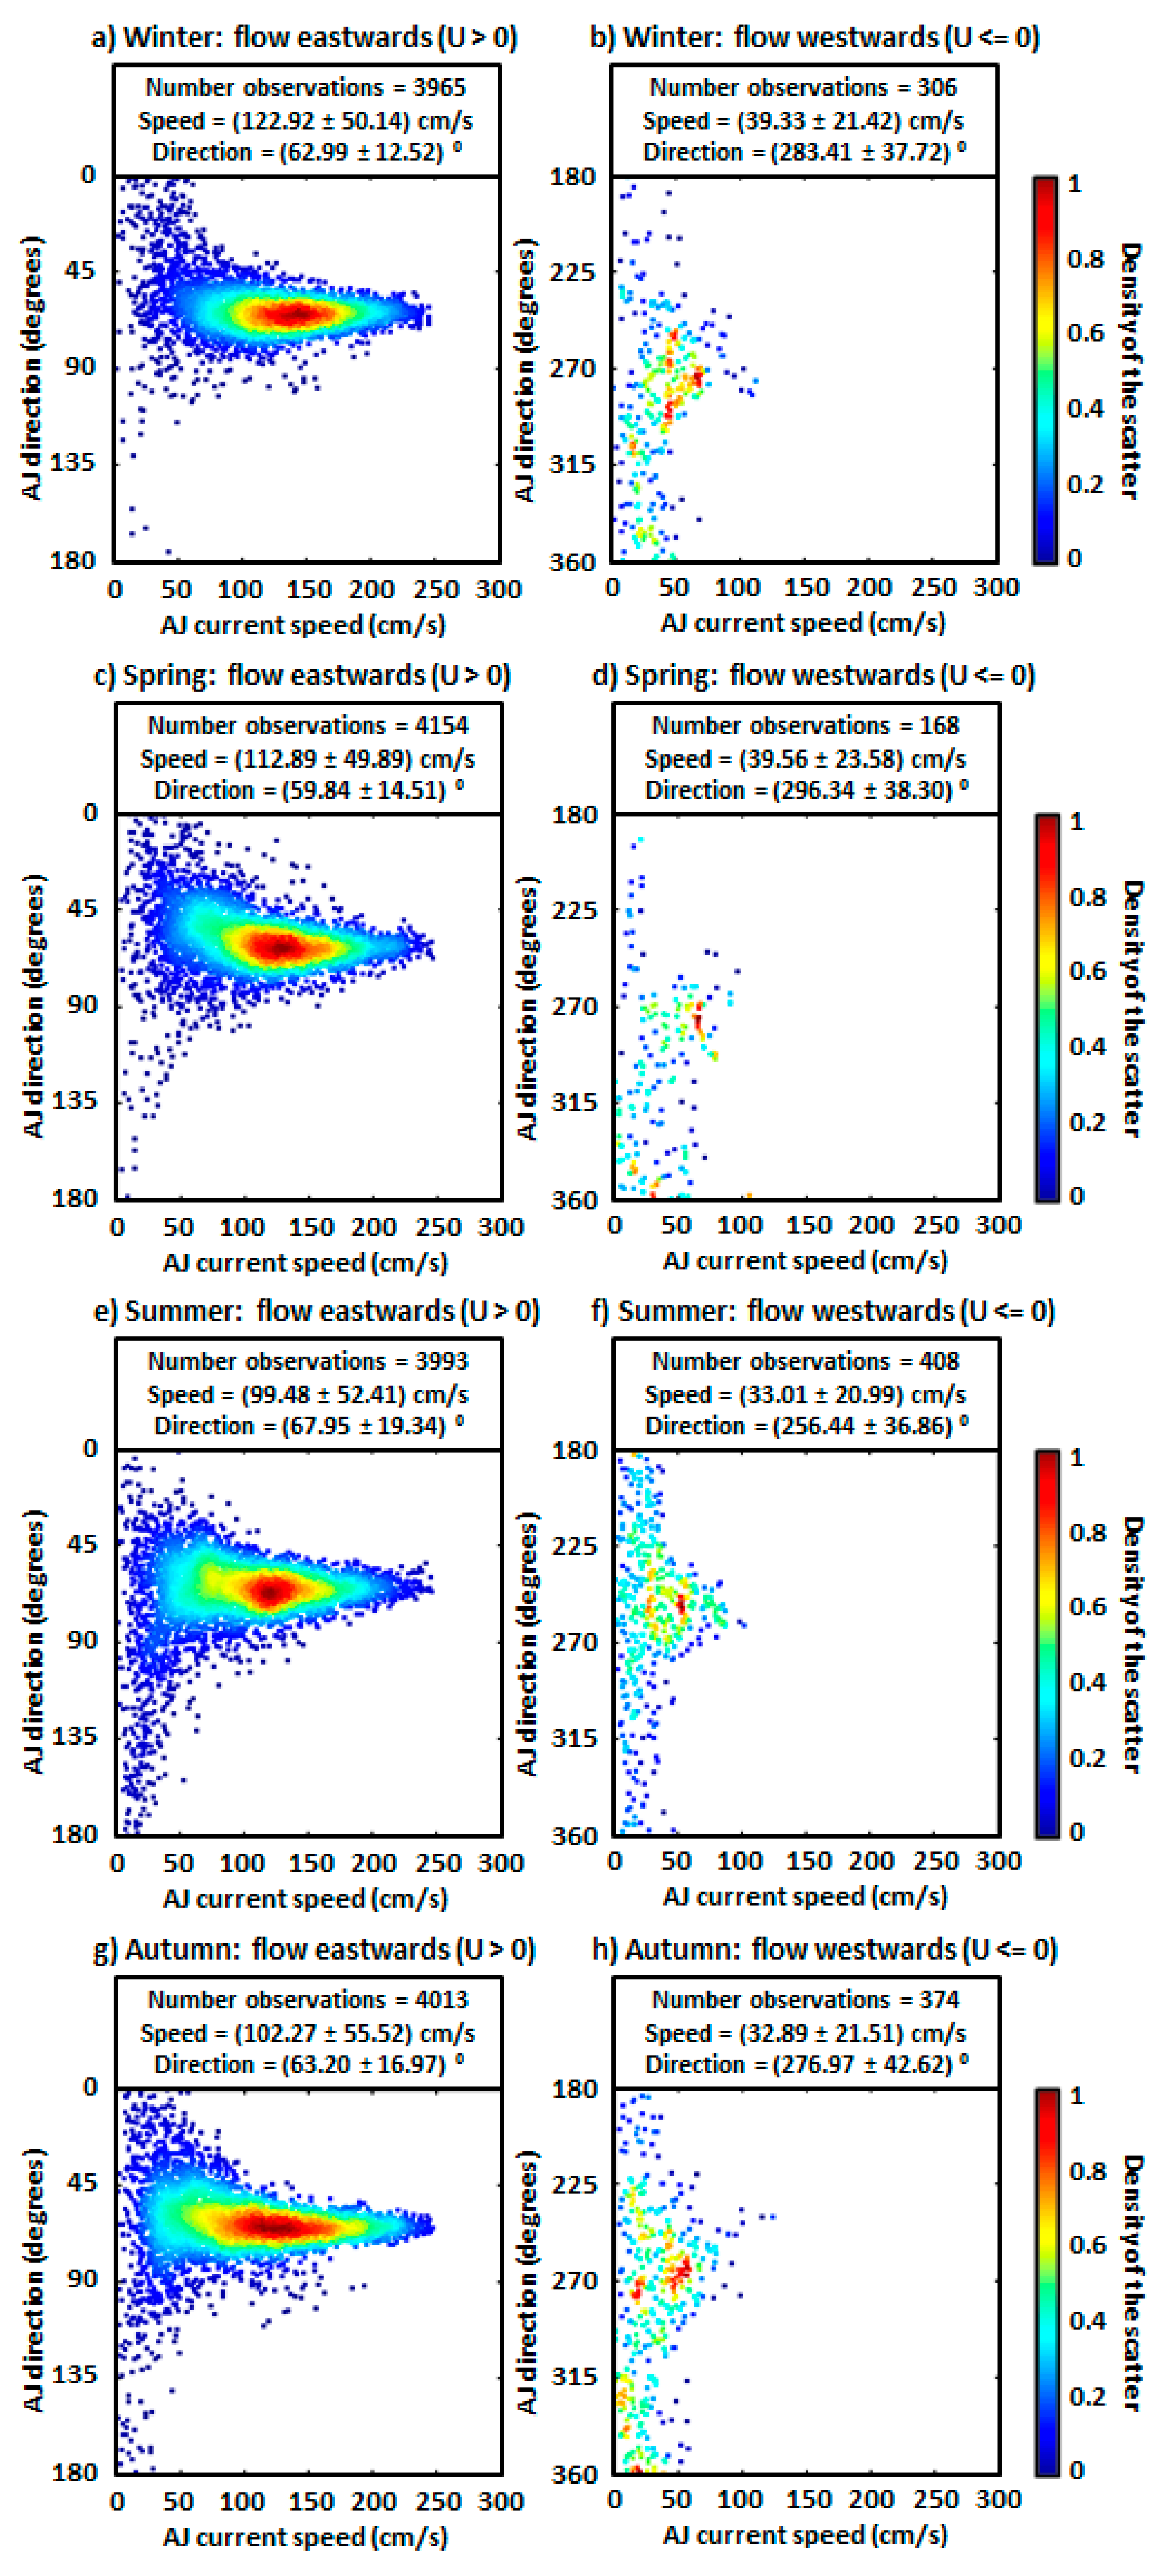
Scatter plots were also computed on a quarterly basis to infer potential differences for each season (
Figure 4). During winter (defined as January-February-March –JFM-), the AJ reached its highest quarterly-averaged speed (123 cm·s
−1) with a related mean orientation of 63° (
Figure 4a). Most of the directional estimations were comprised in the first quadrant (0–90°), whereas only isolated values lay in the range of 90–180° (i.e., flowing towards the South-East). Likewise, weaker westward currents were residually observed (7% of the wintertime), mainly flowing to the NW with a mean angle around 283° (
Figure 4b).
During spring (defined as April-May-June –AMJ-), both AJ mean speed and angle were lower, 113 cm·s
−1 and 60°, respectively (
Figure 4c). Again, the AJ flowed mostly towards the North-East, with scarce observations of surface currents flowing to other quadrants (4% of the time,
Figure 4d). In summer (July-August-September -JAS-) some noticeable differences were observed: the eastward AJ speed (angle) quarterly-averaged value reached a minimum (maximum) of 99 cm·s
−1 (68°), with the AJ directed more southwardly. Higher scatter was detected along the directional axis, with surface currents often flowing towards the South-East (
Figure 4e), the South-West and the North-West (
Figure 4f). By the end of the year (October-November-December -OND-), the AJ mean speed partially recovered (102 cm·s
−1) and the currents were again directed predominantly to the North-East with an averaged angle of 63° (
Figure 4g), thereby completing the annual cycle. Likewise, flow reversals were sporadically observed (9% of the autumn time), with a prevailing direction towards the west, forming an angle of 277° (
Figure 4h).
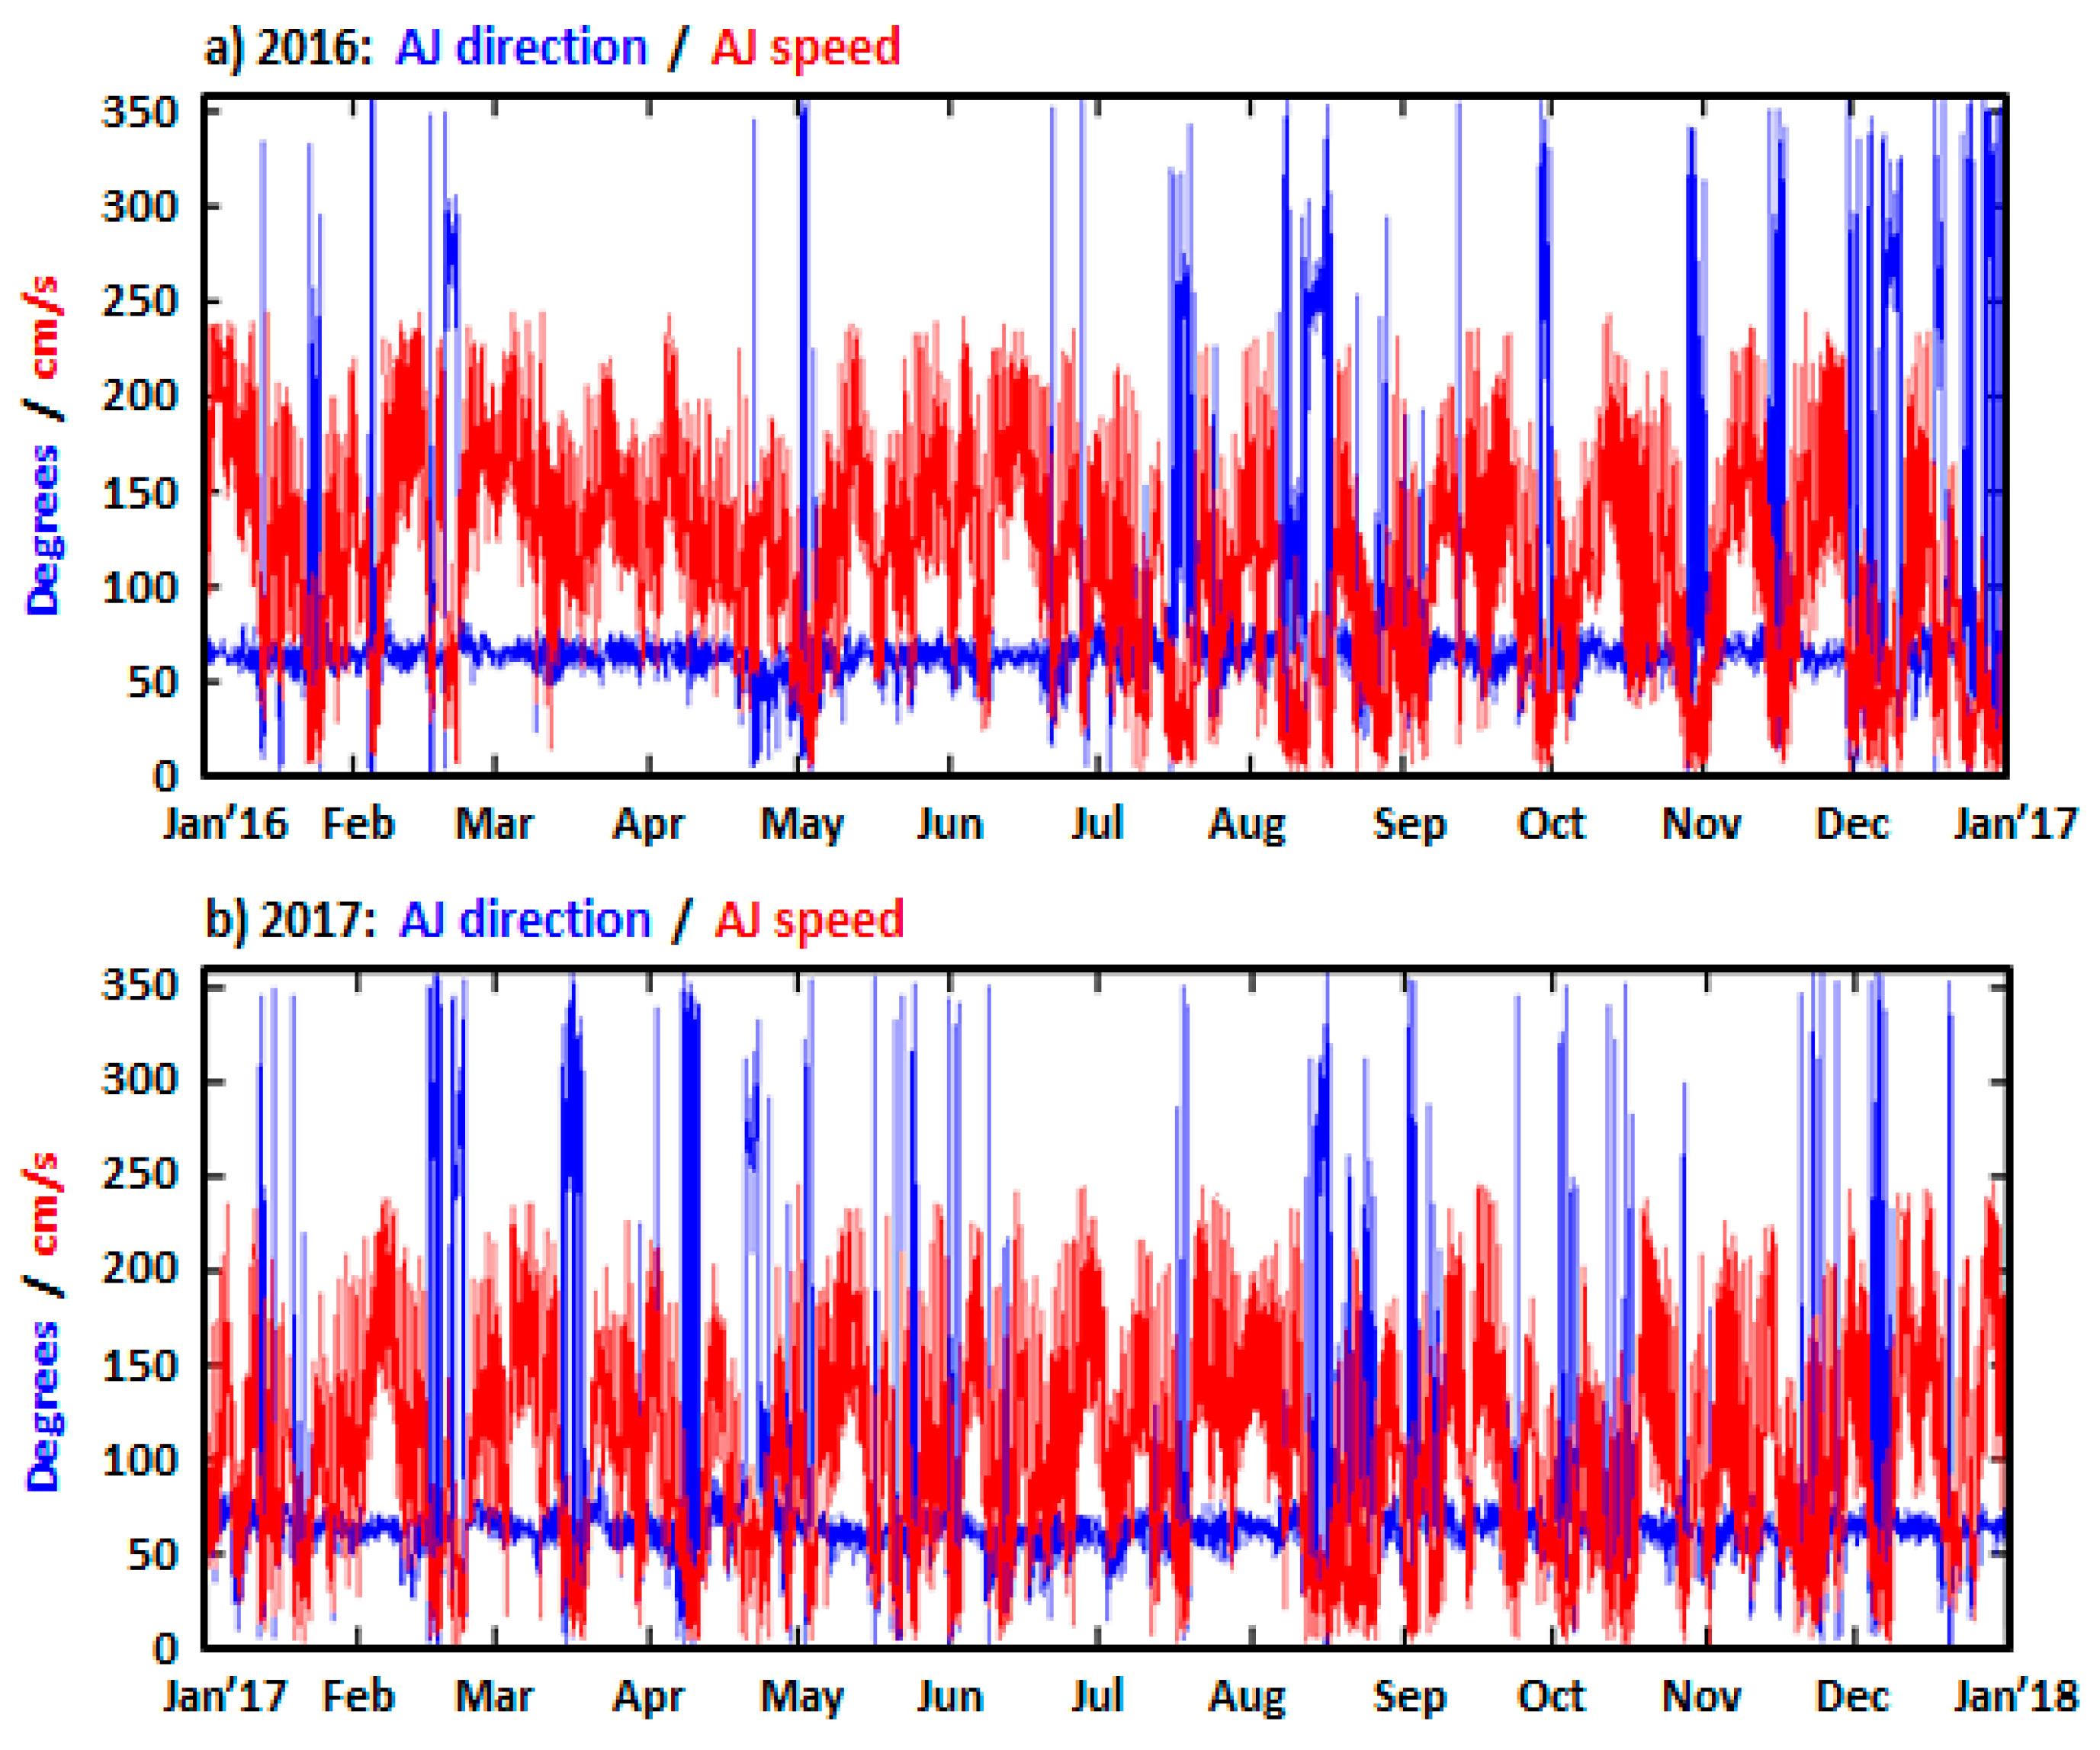
The long-term coastal monitoring of AJ speed and direction at the midpoint of the selected transect is presented in
Figure 5. A strong relationship between remotely observed AJ speeds (red line) and angles (blue line) was revealed: with current velocities above 50 cm·s
−1, the AJ appeared to be locked at an angle around 63°. It is also noticeable that AJ hourly speed usually fluctuated between 50 cm·s
−1 and 170 cm·s
−1, with peaks of 250 cm·s
−1 in the form of eastward pulses. Occasional drops below 50 cm·s
−1 were coincident with abrupt changes in AJ orientation. While some of those sharp variations in directions were of short duration (i.e., a few hours) in response to the joint action of local wind forcing (moderate and/or time-variable easterlies) and tidal currents during the outflow phase [
25], others were persistent enough (lasting more than 48 h) to give rise to full surface inflow reversals.
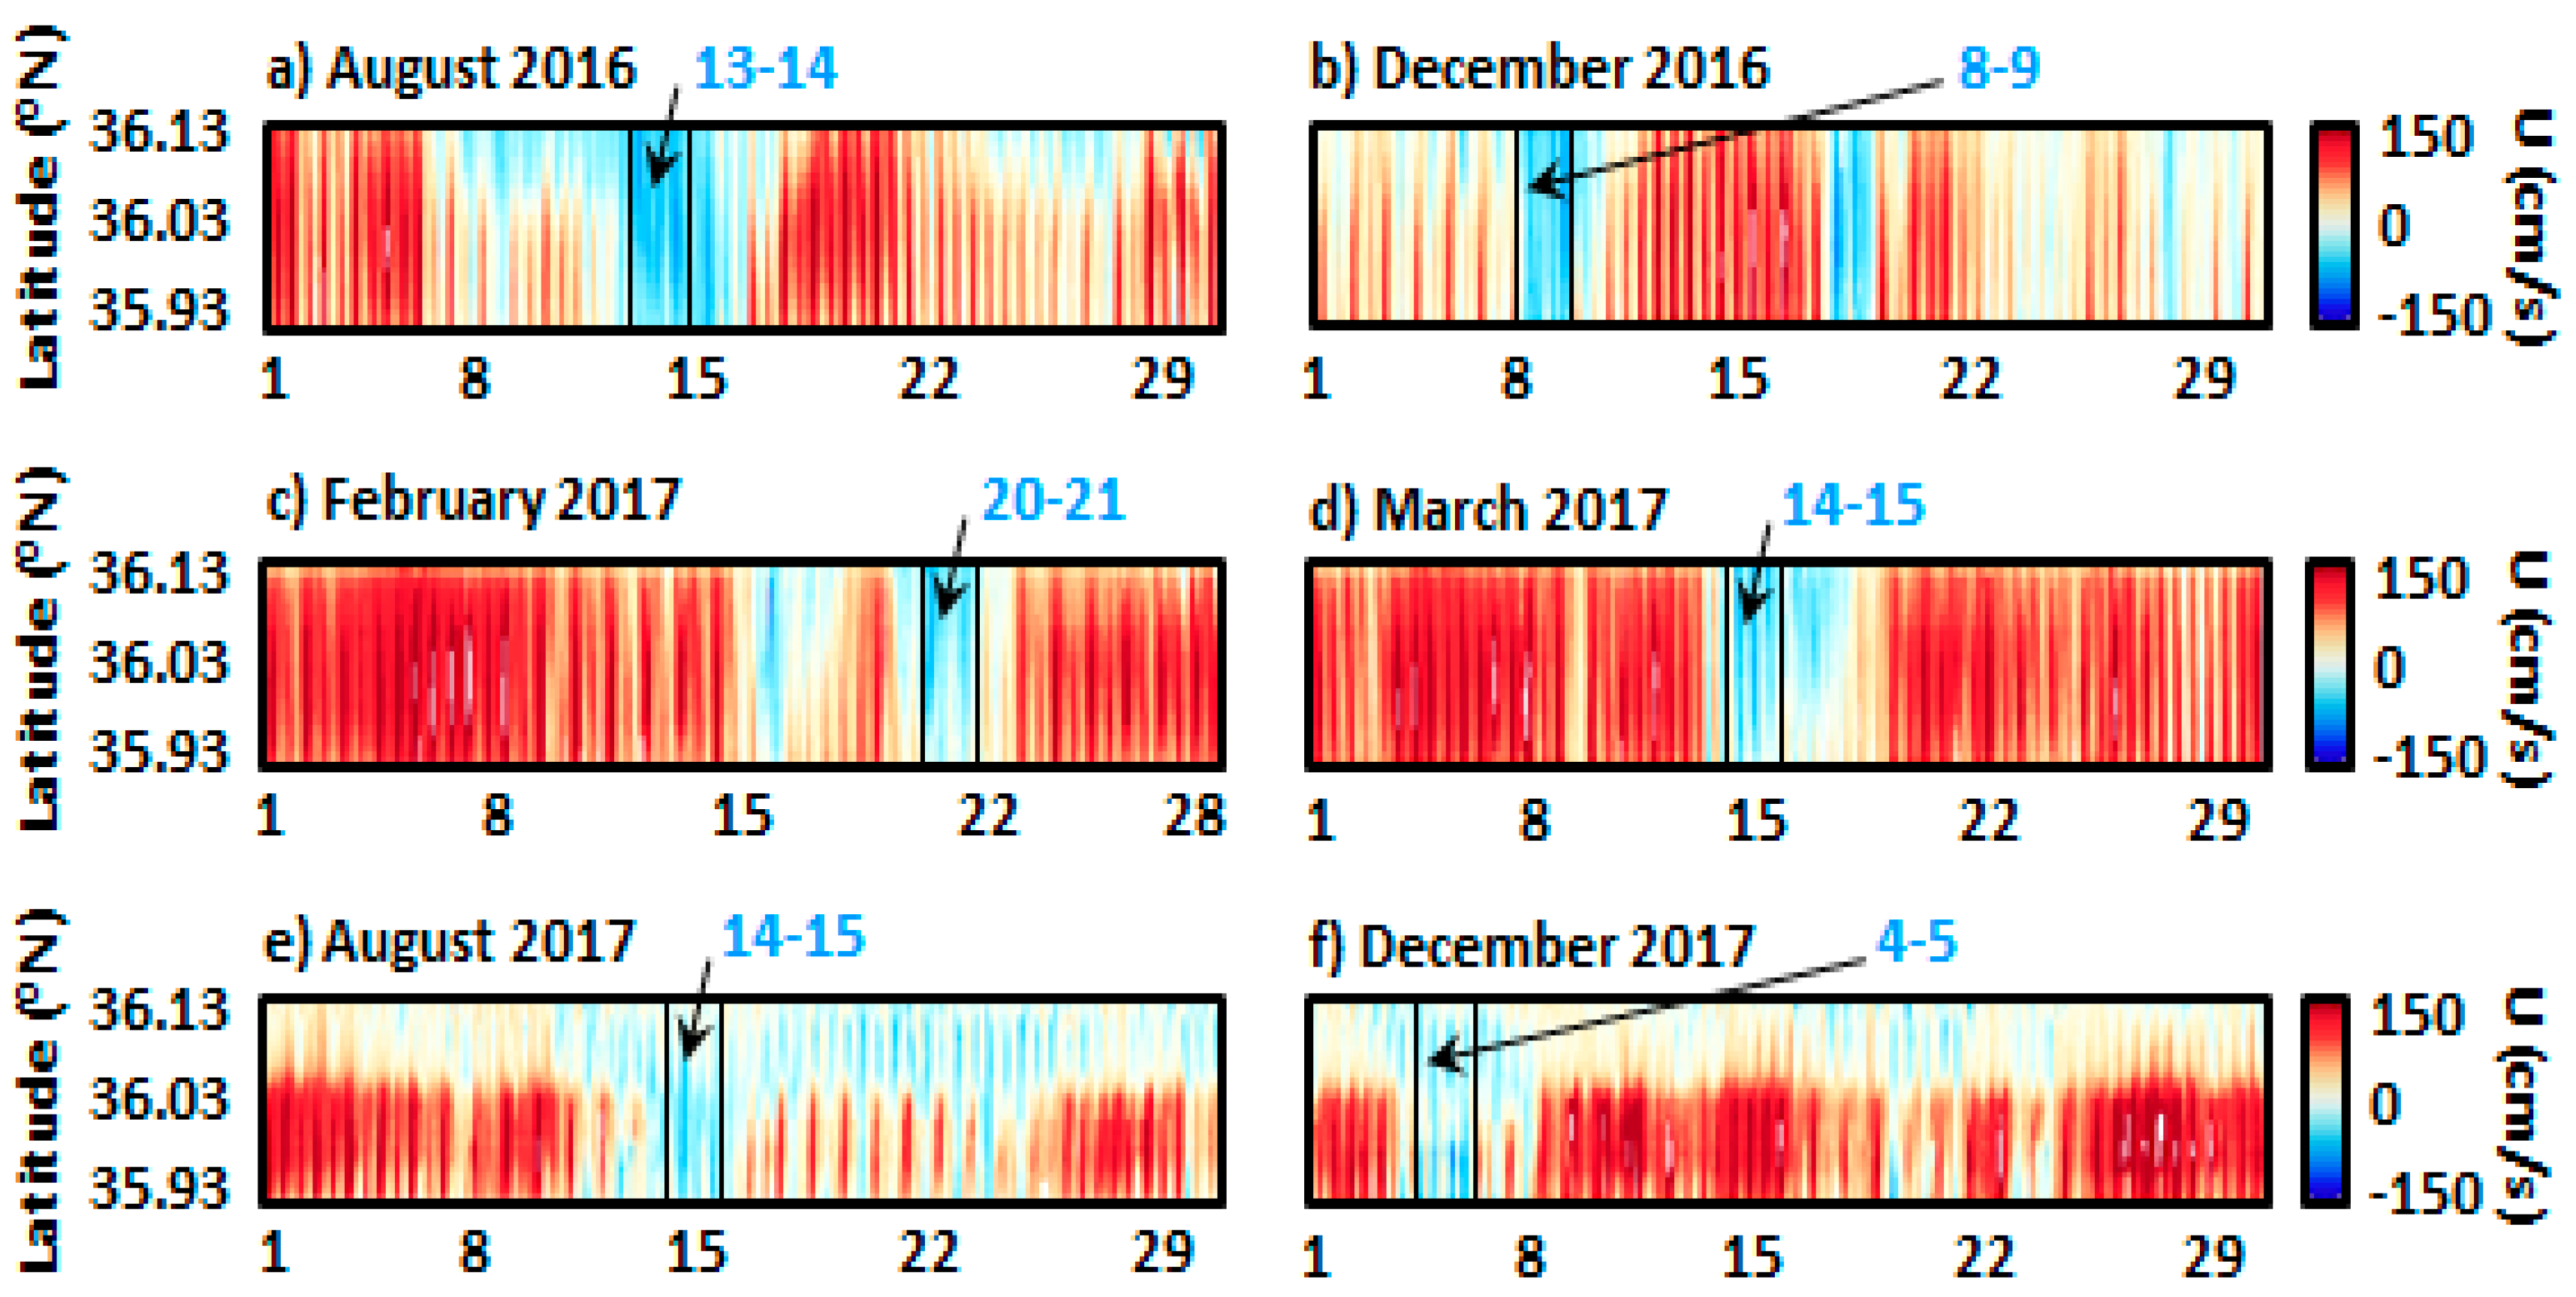
Complete collapse of the AJ and quasi-permanent inversion of the surface inflow during prevalent intense easterlies is a singular phenomenon that deserved detailed exploration. Under this temporal premise, monthly Hovmöller diagrams were computed for HFR-derived zonal currents at the selected transect to easily detect and categorize six 2-day full reversal episodes, represented by black boxes in
Figure 6. In December 2016 (
Figure 6b) and February 2017 (
Figure 6c), brief inversions (related to less intense easterlies) preceded the full reversal of the surface flow. The event detected in March 2017 consisted of an abrupt interruption of the eastward inflow and complete reversal of the surface stream (
Figure 6d). By contrast, in August 2016 (
Figure 6a), August 2017 (
Figure 6e) and December 2017 (
Figure 6f), the classical AJ inflow into the Mediterranean Sea (red color) was only observed in the southern part of the transect, whereas a weaker coastal counter current (CCC) was detected flowing westwards and bordering the northern Spanish shoreline.
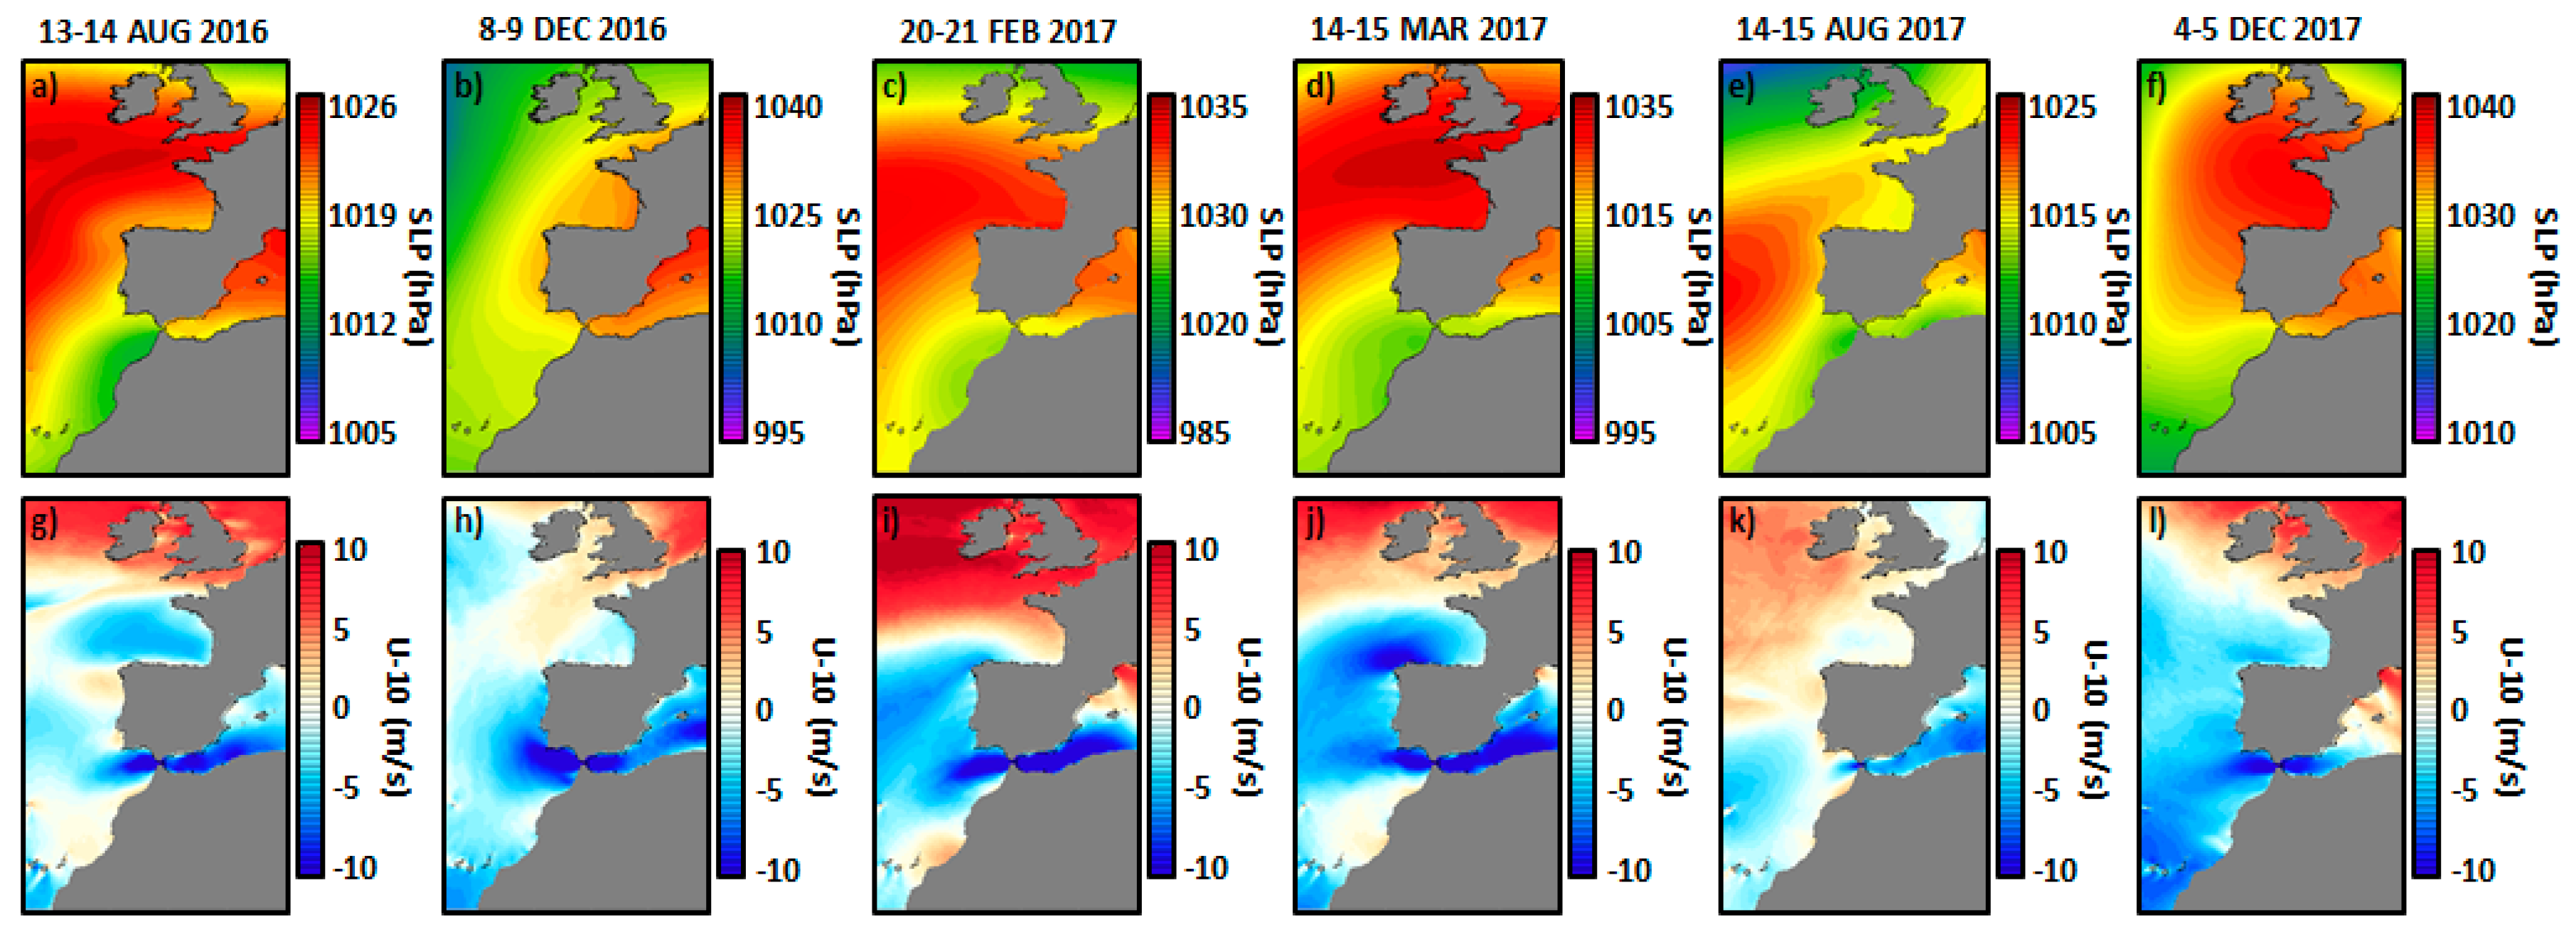
The prevailing atmospheric synoptic conditions were inferred from ECMWF predictions of SLP and U-10, as shown in
Figure 7. A significant latitudinal gradient of SLP was observed in four episodes that took place, respectively, in August 2016, February 2017, March 2017, and December 2017, with high pressures over the Gulf of Biscay and isobars closely spaced in the SoG (
Figure 7a,c,d,f), leading to extremely intense easterlies (above 10 m·s
−1), channeled through the Strait due to its specific geometric configuration (
Figure 7g,i,j,l). In December 2016, high pressures dominated the entire Western Mediterranean (
Figure 7b), equally yielding strong along-shore westward winds along both sides of the SoG (
Figure 7h). In August 2017, the typical summer weather type was observed with Azores High pressures governing the Mid-Atlantic Area (
Figure 7e) with moderate but persistent easterly winds blowing through the entire Western Mediterranean (
Figure 7k).
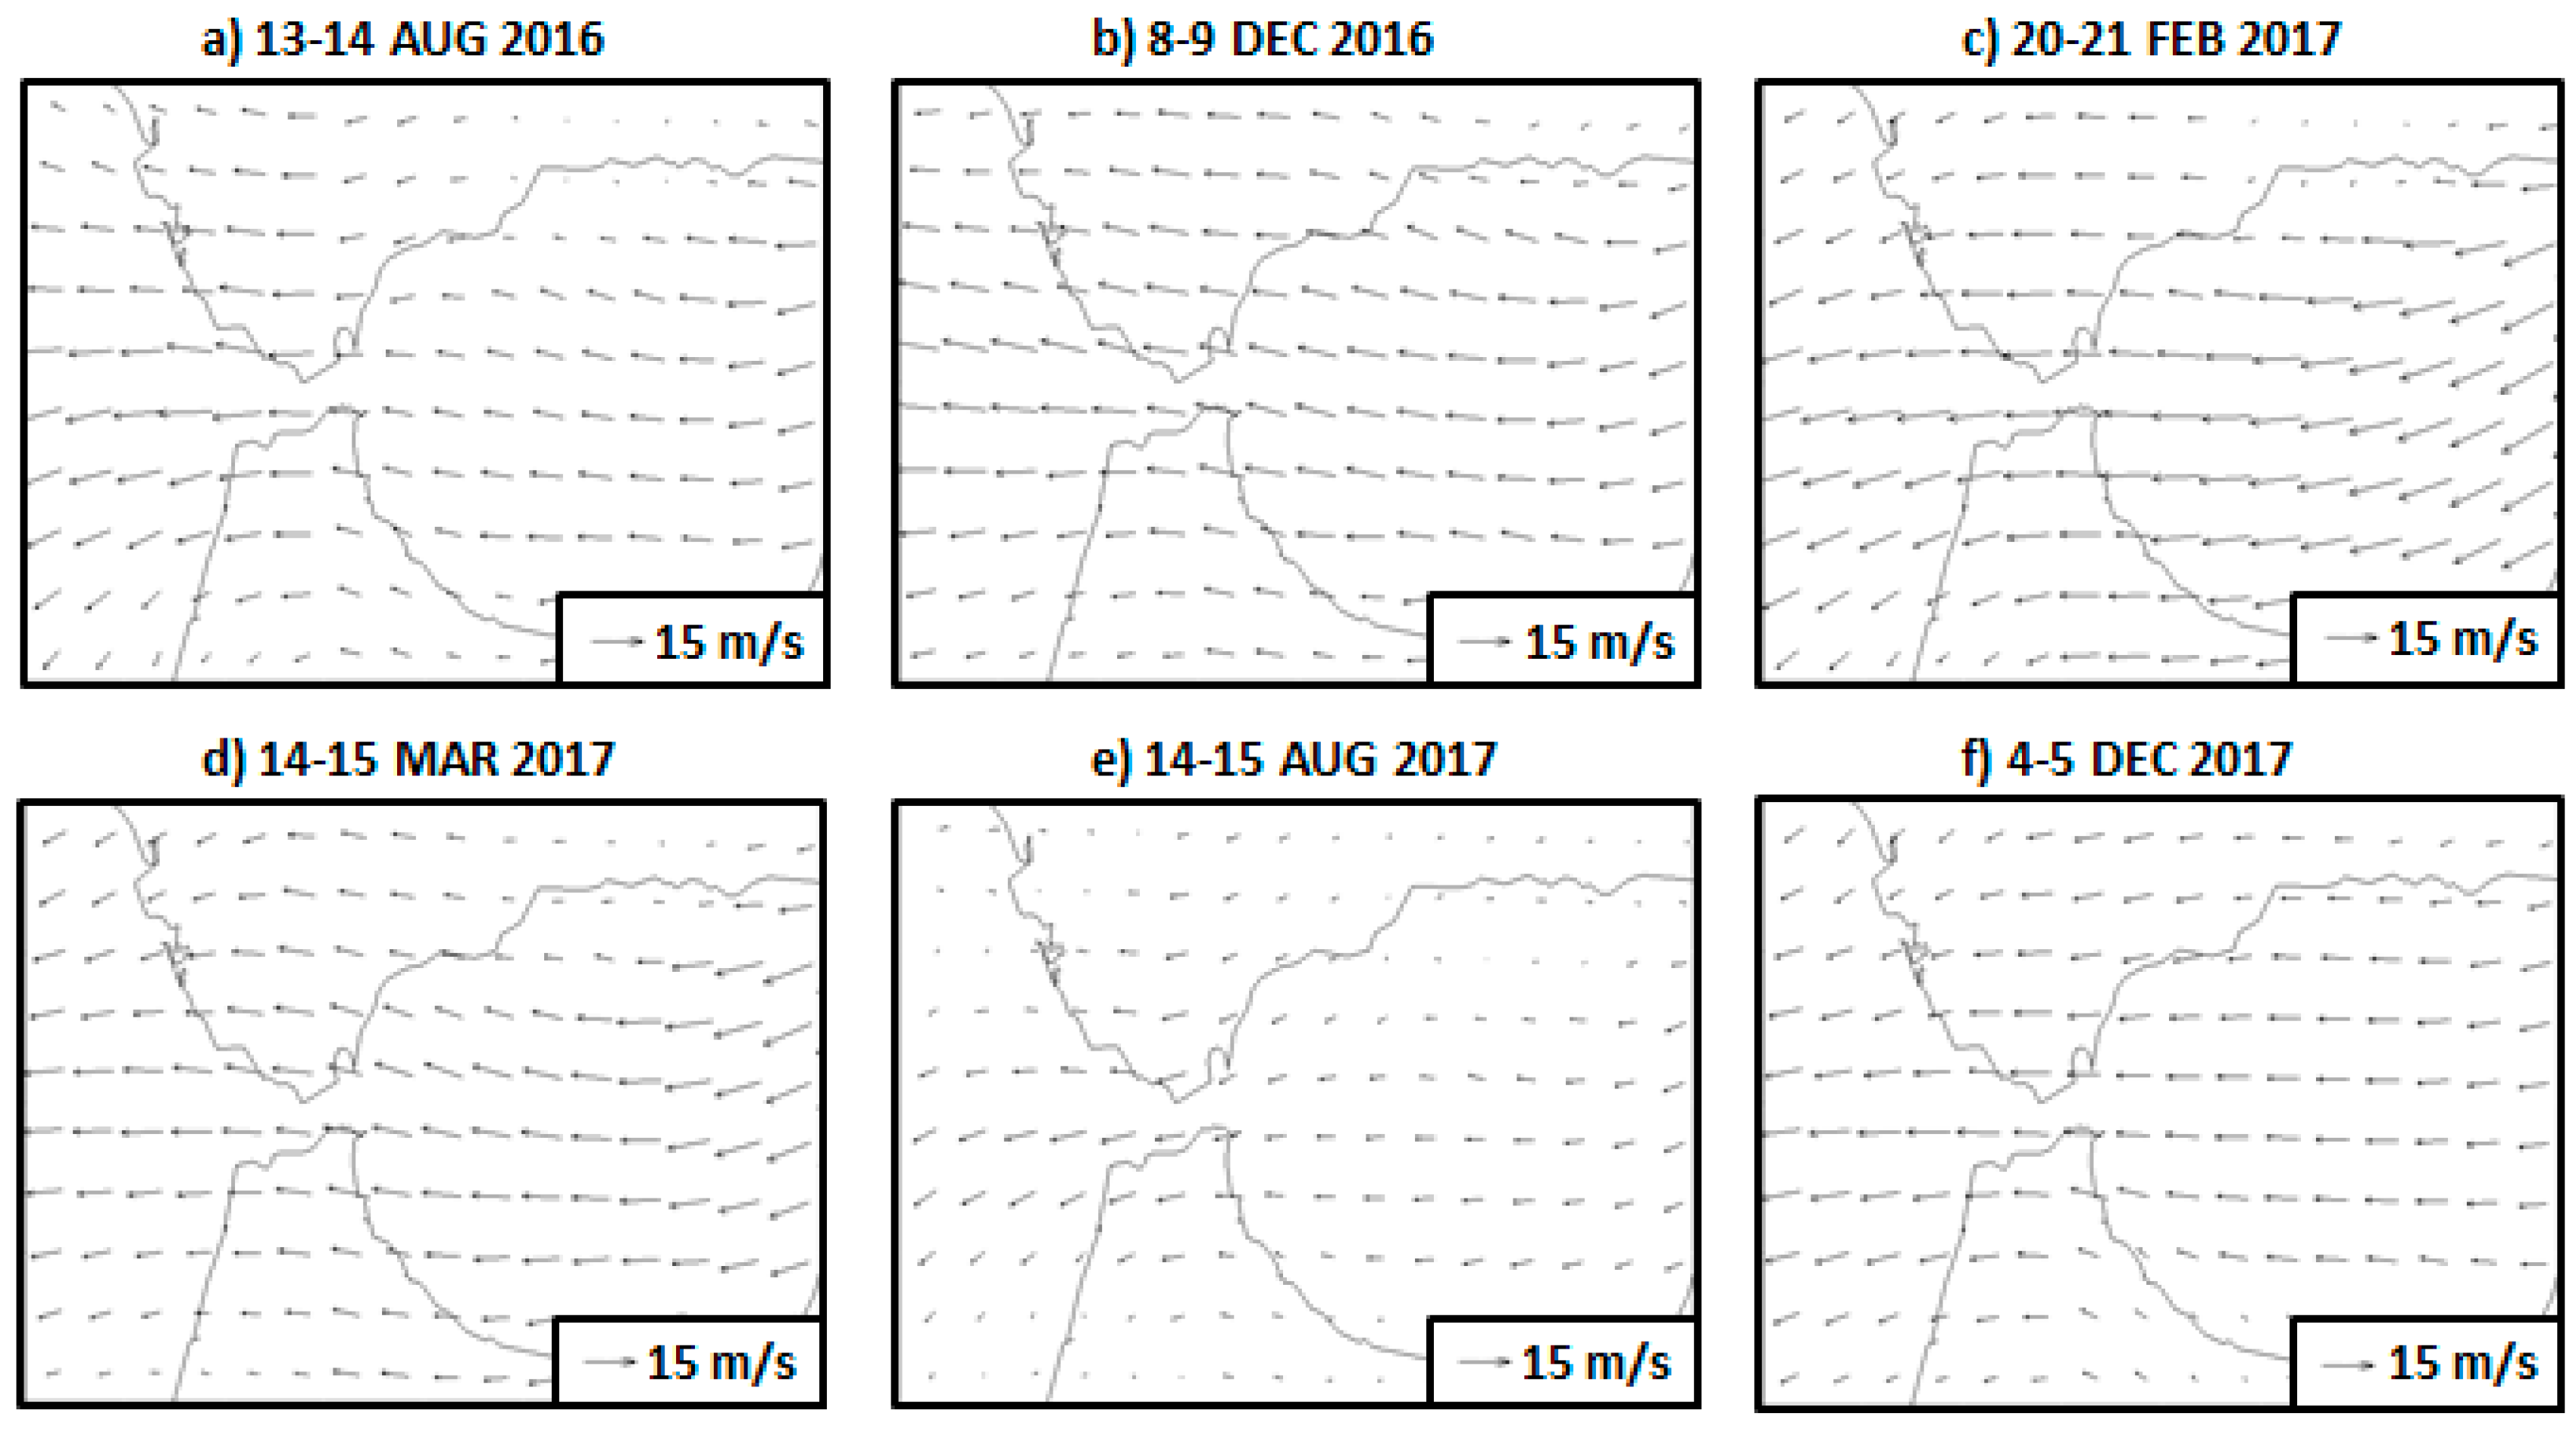
2-day averaged maps of modeled wind field at 10 m height are presented in
Figure 8 for each of the six events analyzed. As shown, intense easterlies prevailed over the entire study domain, with uniform velocities usually above 10 m·s
−1. Only the fifth episode, corresponding to August 2017 (
Figure 8e), exhibited lower wind speed (in accordance with
Figure 7k) and more spatially-variable wind conditions.
Short-lived reversals of the surface inflow have been previously reported to occur almost every tidal cycle in Camarinal Sill (western end of SoG:
Figure 1a) mainly due to the contribution of the semidiurnal tidal component
M2 [
25,
26,
27,
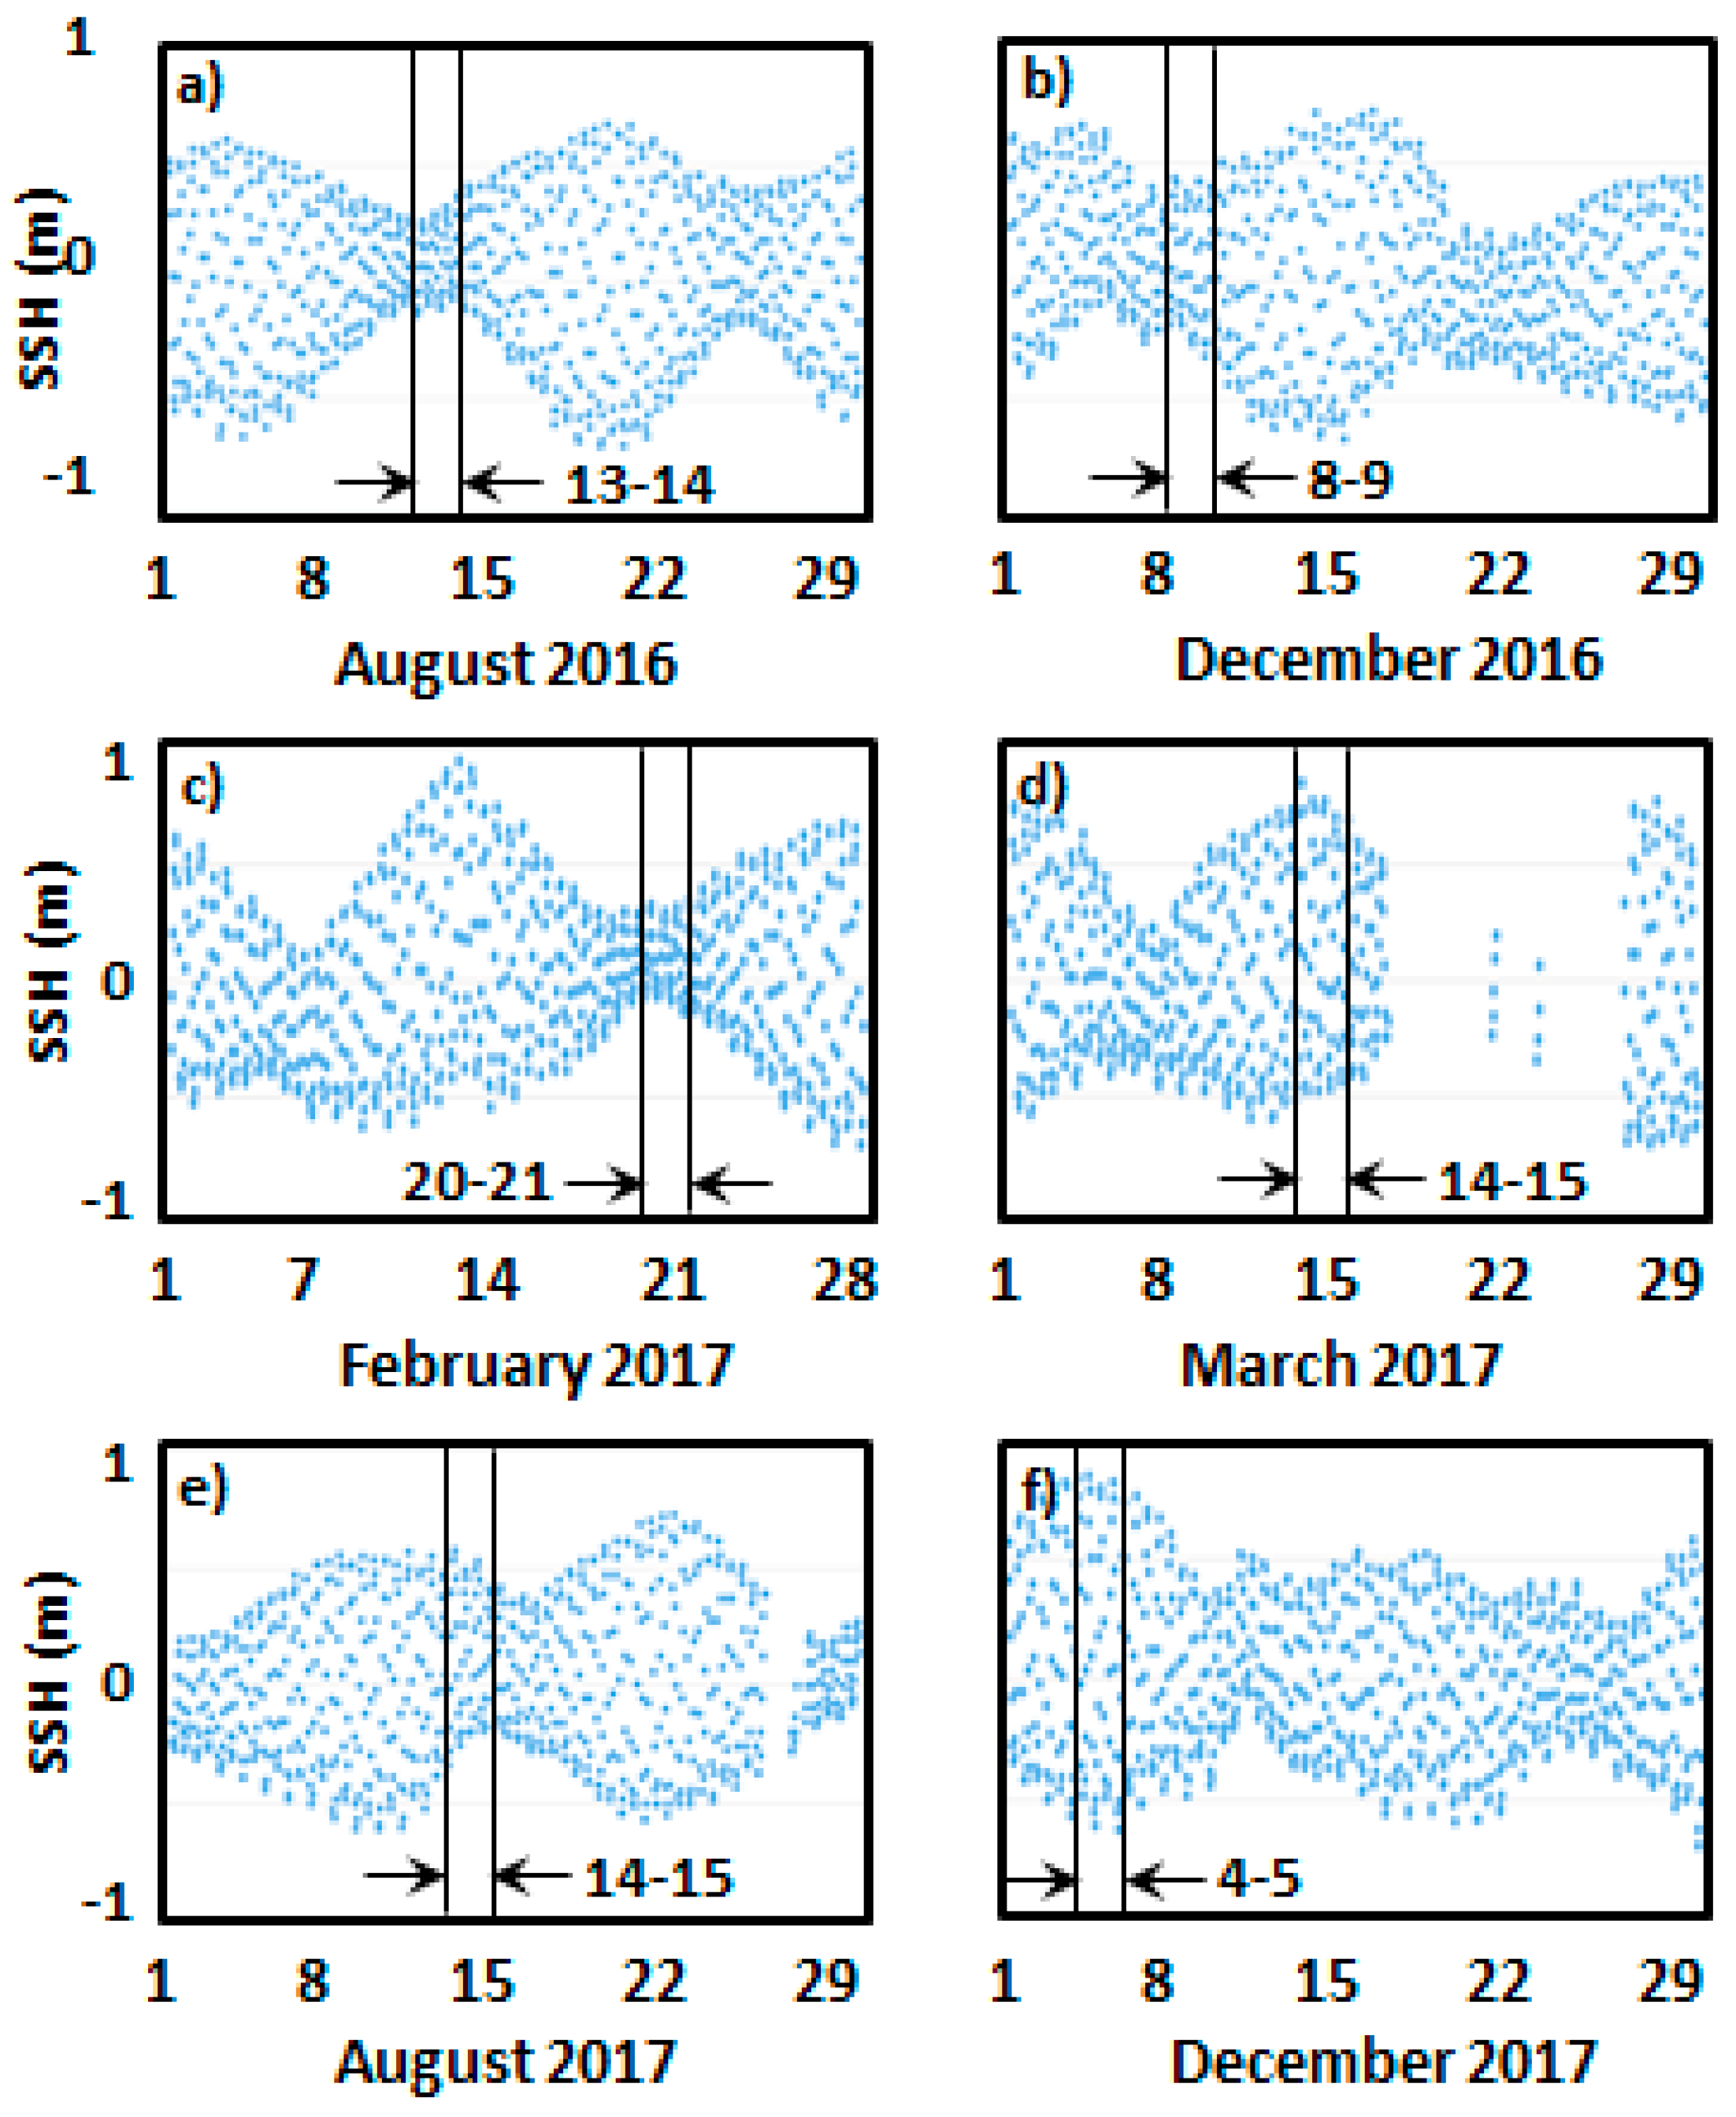
28]. Since the mean inflow of Atlantic water is modulated by barotropic tidal currents, hourly-averaged SSH observations provided by Tarifa tide-gauge were used to elucidate if the six 2-day inflow reversal events in the eastern end of the Strait could have been mostly influenced by spring-neap tidal cycle fluctuations (
Figure 9). Although the fortnightly variability was clearly observable in a monthly time series of SSH, no cause-effect relationship could be visually inferred from the inspection of zonal velocities at the selected transect (
Figure 6). Apparently, evidence of preference for a specific tidal cycle was not observed as the six flow reversal episodes took place during different tidal conditions, ranging from neap tides (
Figure 9a,c) to spring tides (
Figure 9d,f).
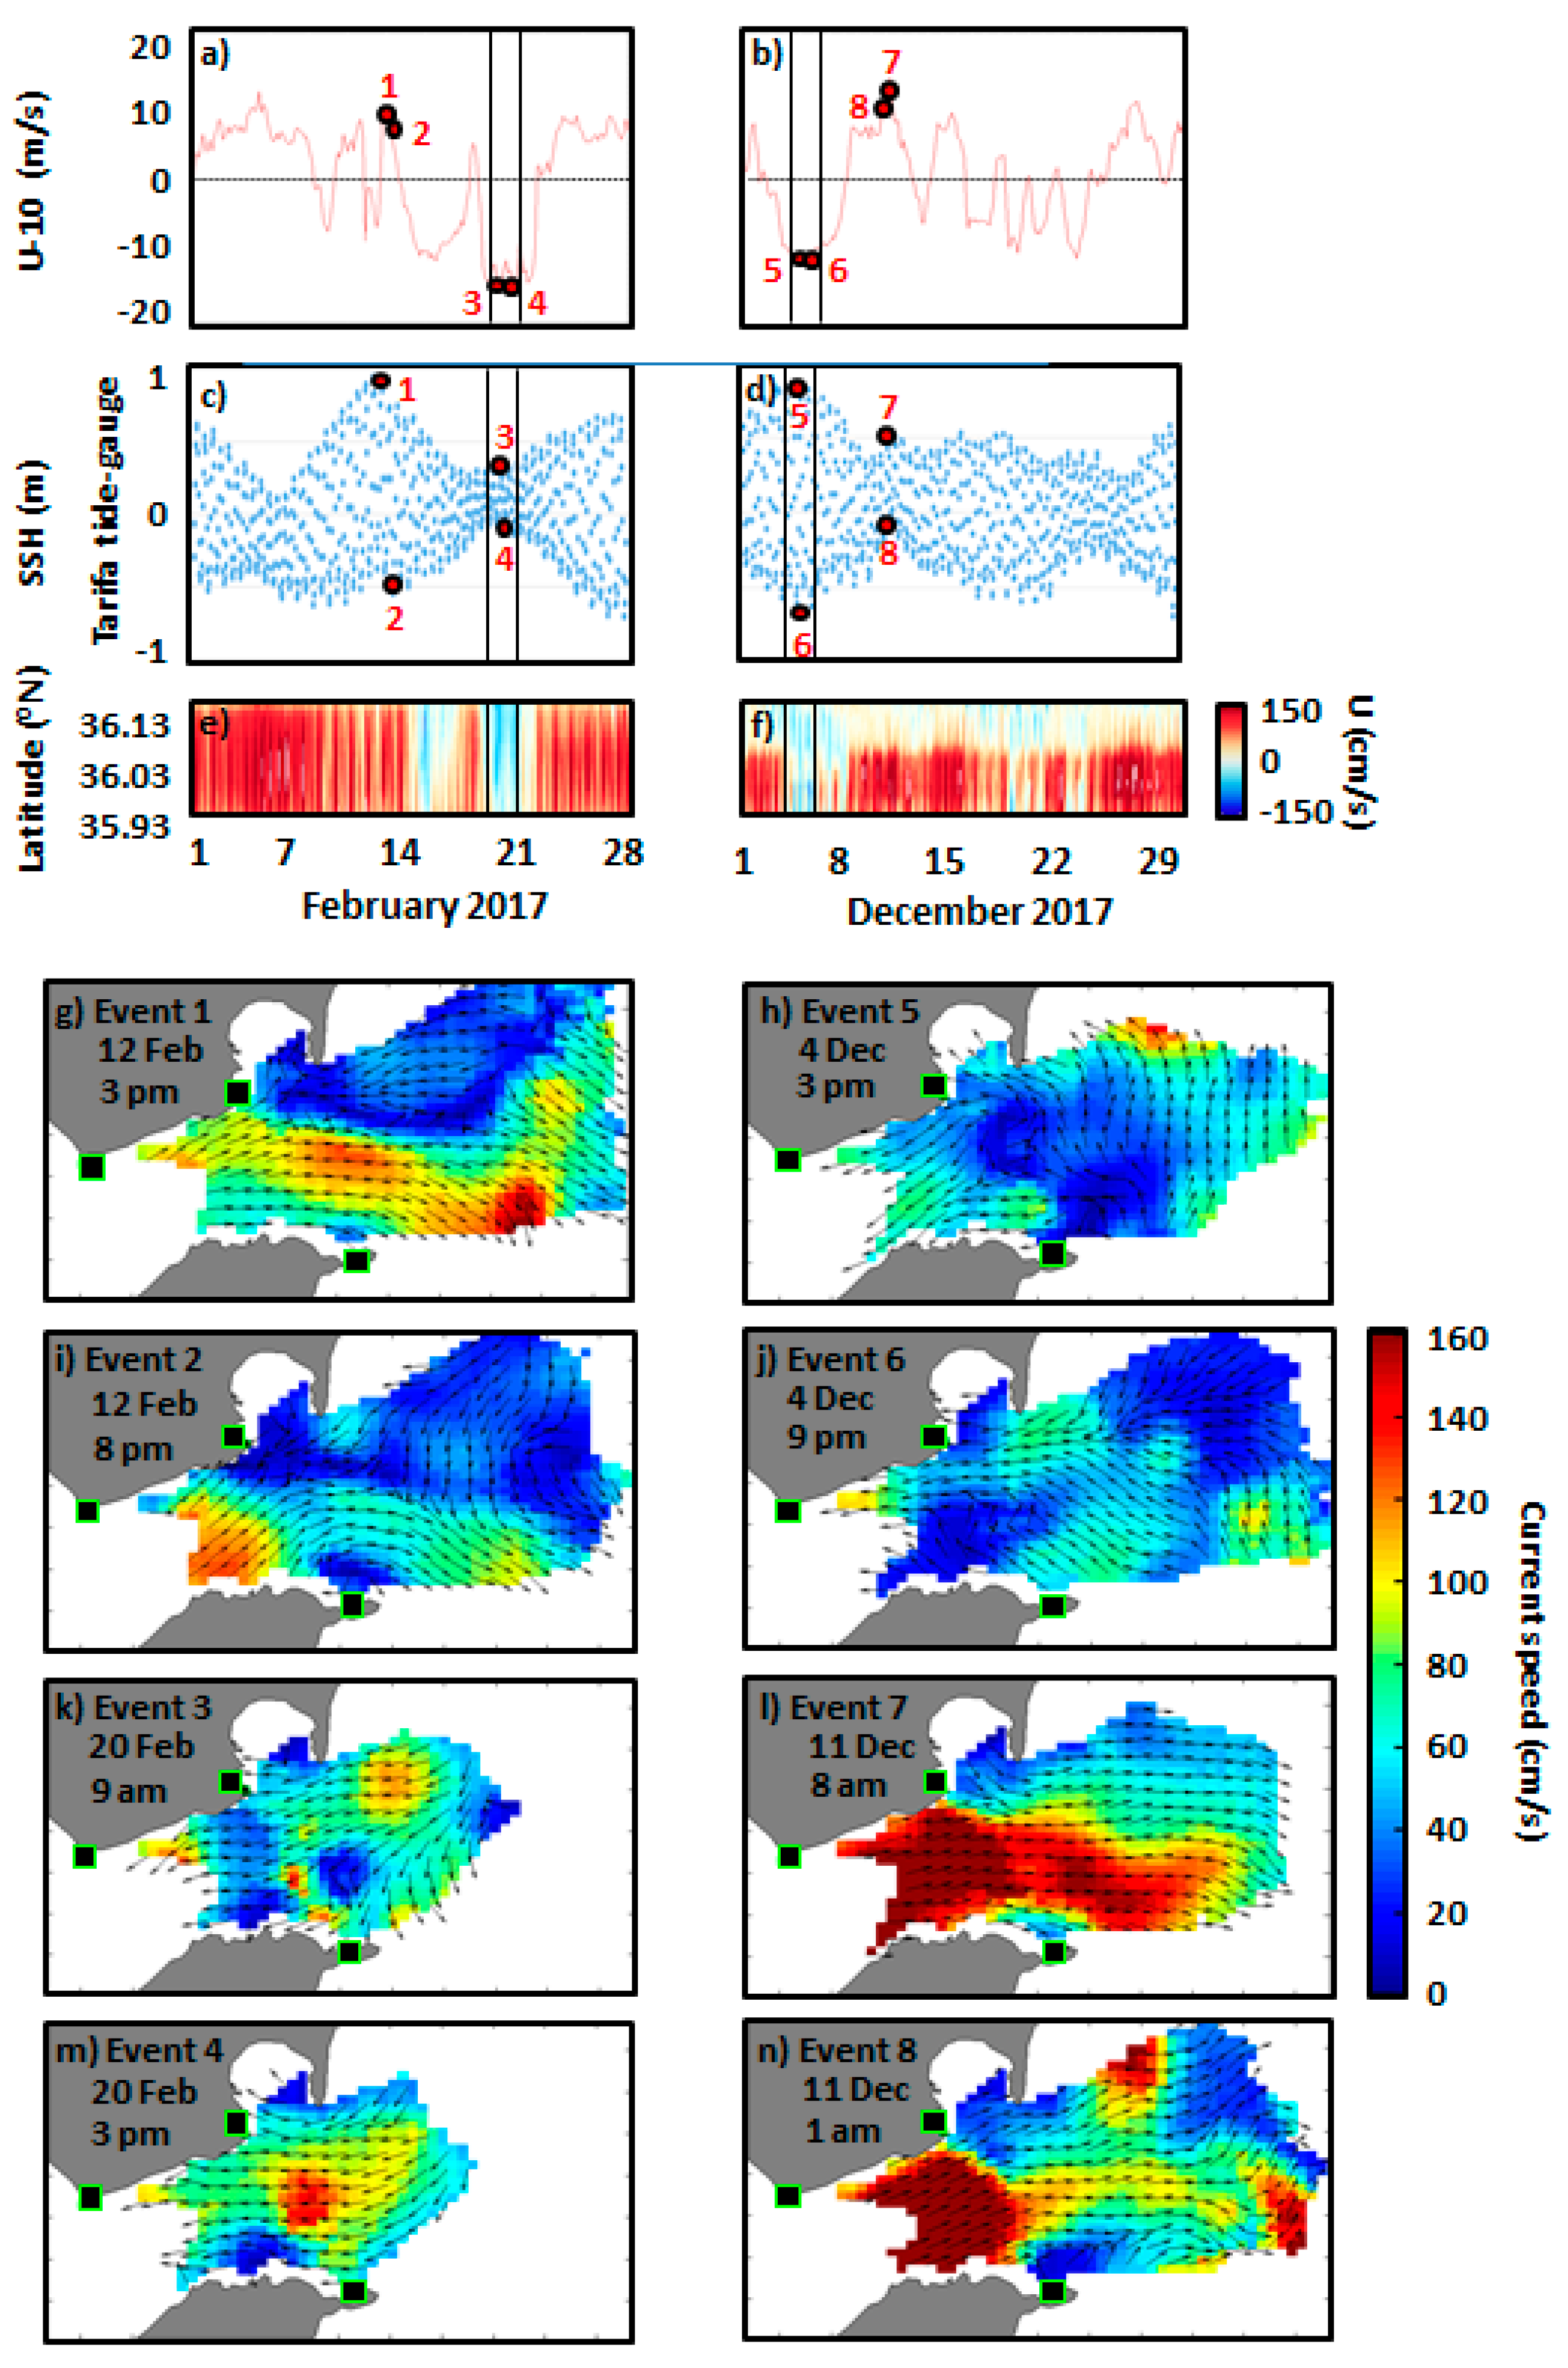
To support the previous statement, hourly maps of HFR-derived surface circulation were depicted for eight different test-cases (
Figure 10), defined according to the prevailing met-ocean conditions (
Table 2). The first two analyzed events took place in February 2017 under strong westerlies (
Figure 10a) during spring tides (
Figure 10c), when the tide was at flood (event 1) and later at ebb (event 2). In both cases, the wind-driven flow was directed eastwards (
Figure 10g,i), although more vigorously in the case of event 1. By contrast, events 3 and 4 occurred under extremely intense easterlies (above 15 m·s
−1) during neap tides. Regardless of the tide height, the surface circulation patterns were similar in both cases (
Figure 10k,m), with a manifest reversal of the main flow towards the west, as reflected in the monthly Hovmöller diagram (
Figure 10e). In December 2017, events 5 and 6 were registered again under strong easterlies (
Figure 10b), but this time during spring tides (
Figure 10d). According to the hourly HFR-derived maps, the westward inversion of the flow was evidenced independently of the tidal phase (
Figure 10h,j). Finally, events 7 and 8 took place during neap tides, when persistent and very intense westerlies were blowing. The associated surface circulation maps exhibited an acceleration of the Atlantic inflow into the Mediterranean (
Figure 10l,n), reaching velocities above 160 cm·s
−1 at the selected transect (
Figure 10f).
The 2-day averaged HFR-derived circulation patterns associated with the six events here studied are depicted in
Figure 11. Some common peculiarities were exposed, such us the westward outflow through the narrowest section of the SoG or the prevalent anticyclonic inflow into the Algeciras Bay (with a direct impact on larger residence times and reduced water renewal). Three case studies revealed a predominant circulation towards the West/South-West, together with a marked acceleration of the flow in the vicinity of Algeciras Bay, reaching speeds above 50 cm·s
−1 (
Figure 11a,c,e). On the contrary, two episodes illustrated how the circulation in the easternmost region of the study domain followed a clockwise rotation, likely feeding the WAG, which was out of the picture (
Figure 11d,f). In the first event, corresponding to March 2017, the anticyclonic gyre was accelerated up to 80 cm·s
−1 (
Figure 11d). The second case (December 2017) was substantially less energetic and exhibited besides a counter-clockwise recirculation structure in the entrance to the strait. (
Figure 11f). The event identified in December 2016 represented an overall cyclonic recirculation cell with a marked intensification of the flow reversal nearby the Algeciras Bay when westward currents were channeled through the narrow SoG (
Figure 11b). Finally, two small-scale counter-clockwise eddies were observed detached from the shore and enclosed in the general westward flow (
Figure 11c,e).
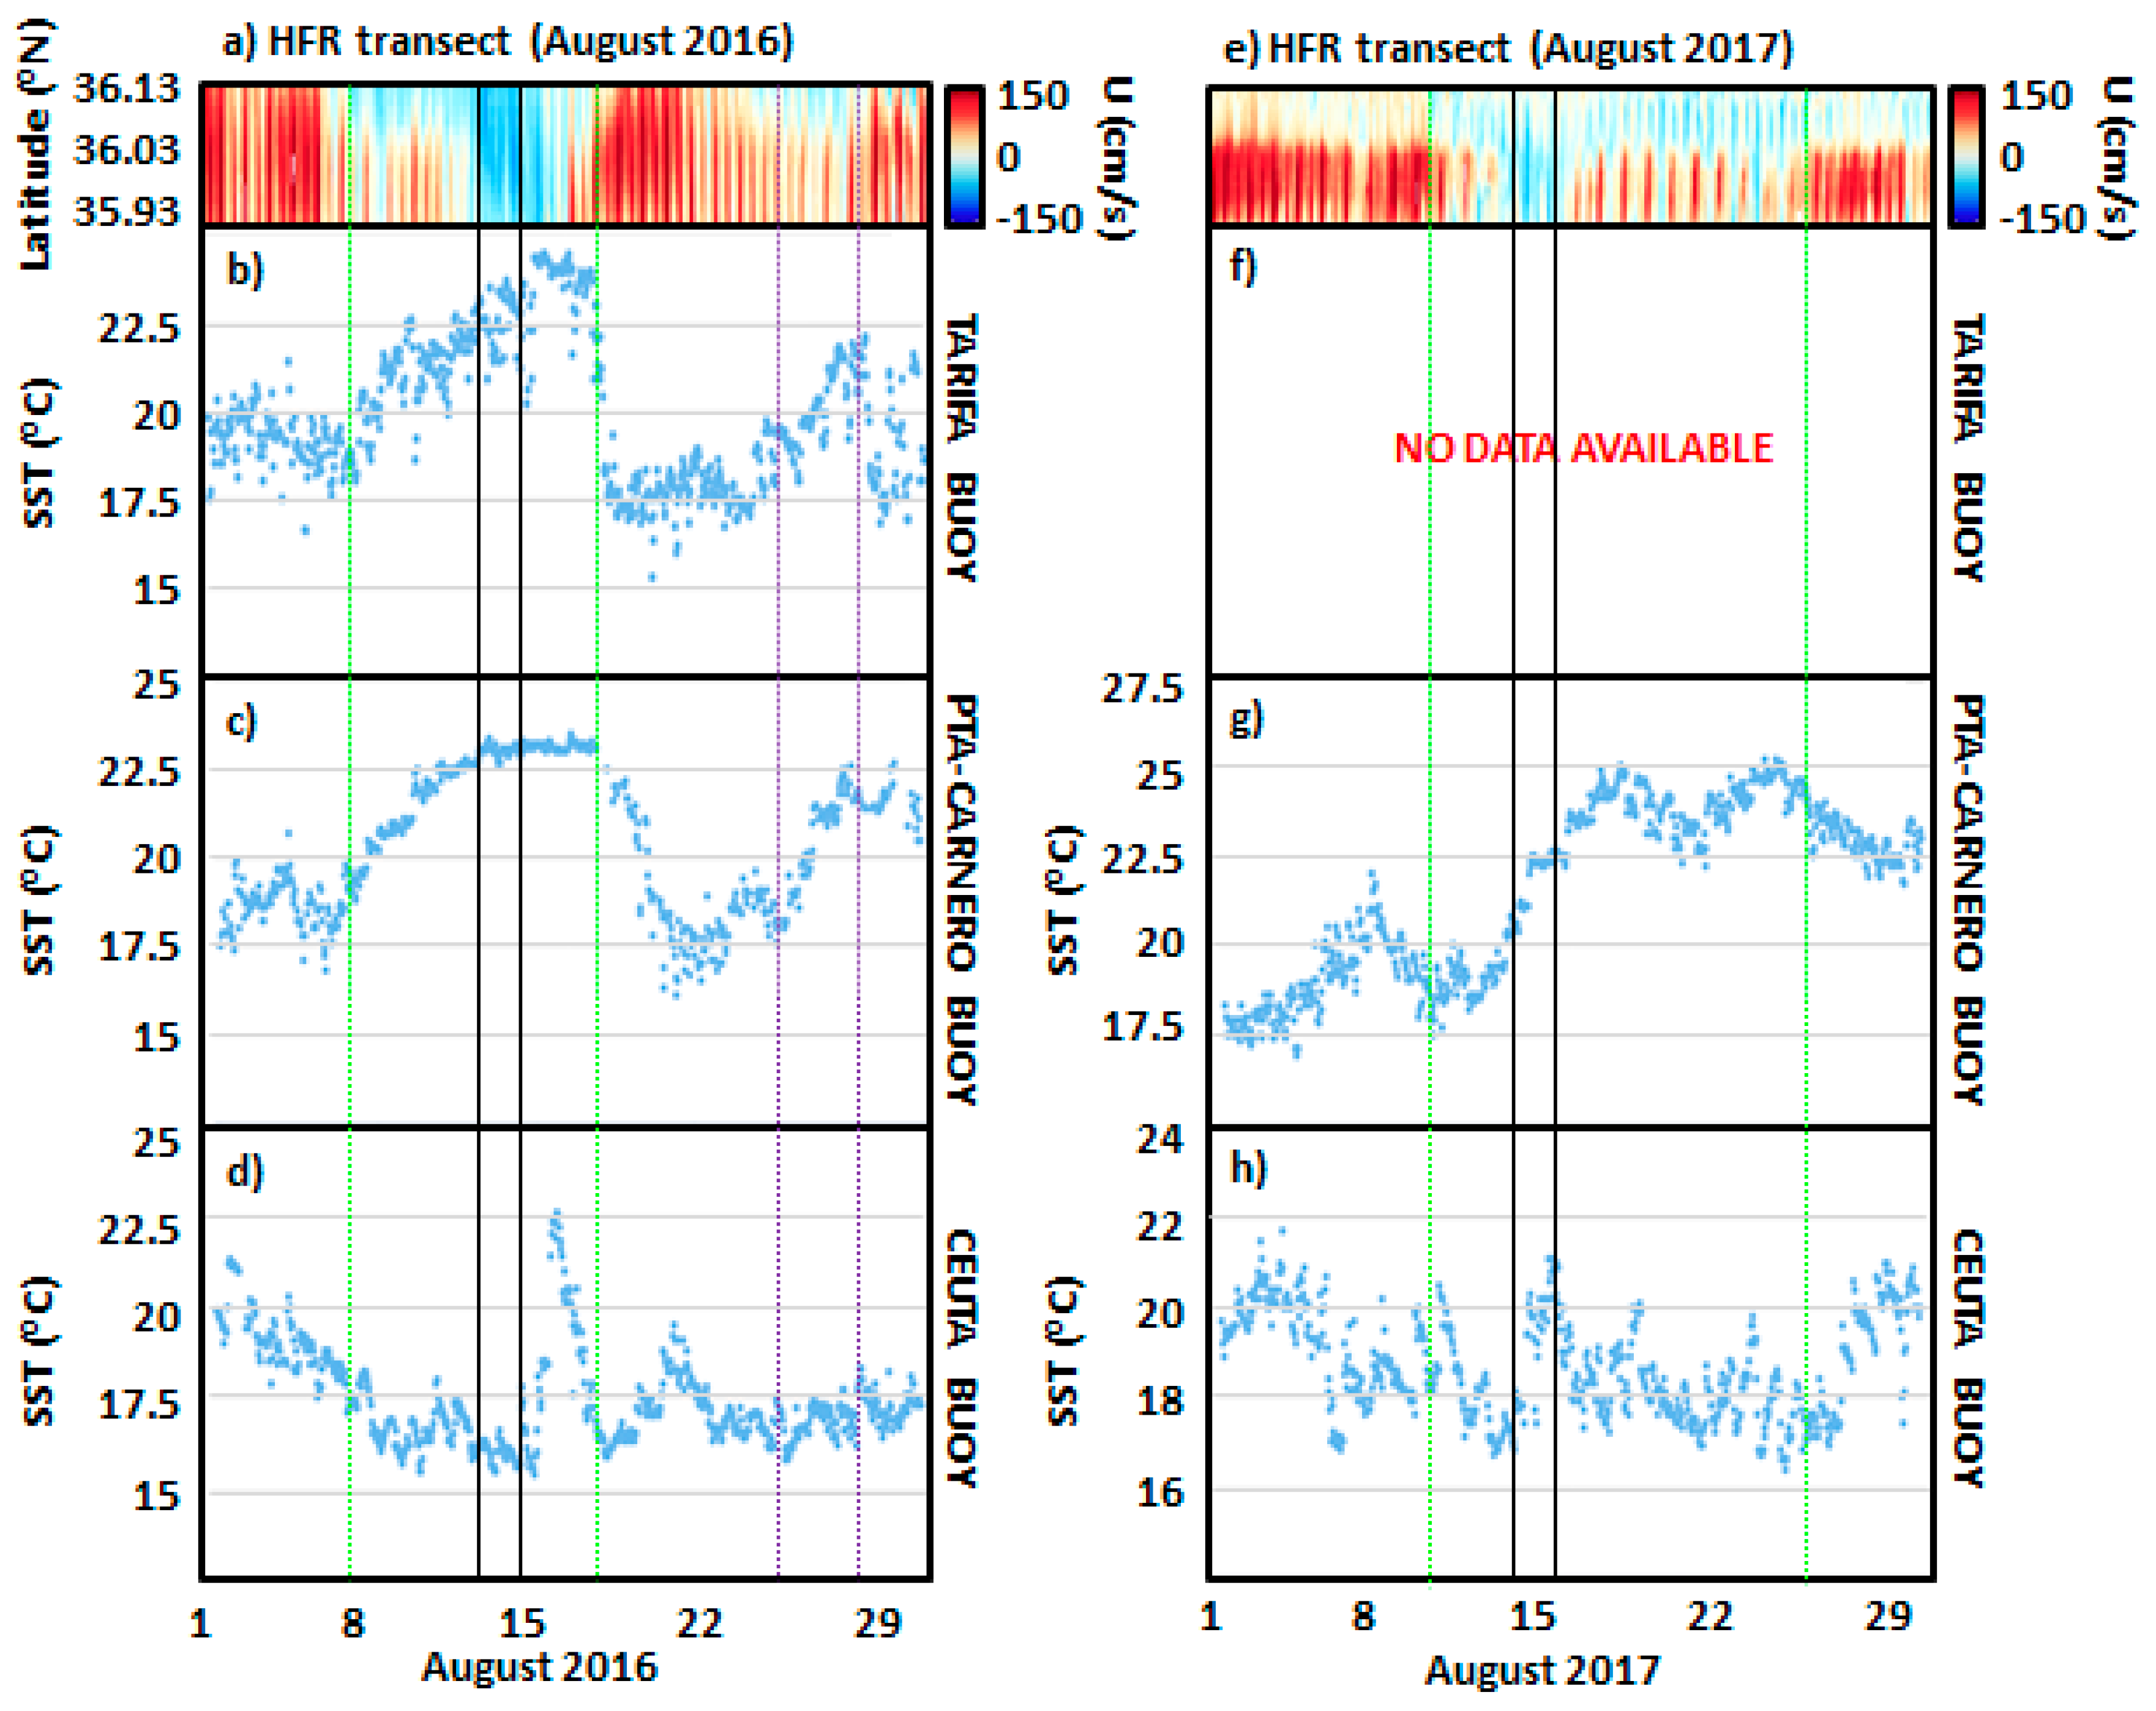
Among the physical implications of the surface inflow reversal, abrupt increases in the SST field were revealed, especially during summertime when warmer Mediterranean waters outflowed into the mild Atlantic Ocean (
Figure 12). During August 2016, the aforementioned CCC showed up the 8th and lasted 10 days (
Figure 12a). During this period (delimited by green dotted lines in
Figure 12a–d), the SST field experienced a net increase of 6 °C, from 18 °C to 24 °C, according to the in situ estimations provided by Tarifa and Punta-Carnero buoys (
Figure 12b,c). Soon afterwards, a sharp decrease to 17 °C was recorded in few hours (steeper in the case of Tarifa buoy), as a consequence of the reestablishment of the intense (above 130 cm·s
−1) AJ flowing eastwards (
Figure 12a). In the southern region, the SST remained rather constant (~16.5 °C) and obviously unaffected by the northern CCC (
Figure 12d). Notwithstanding, as easterly winds progressively dominated the study area and persisted enough, the CCC broadened and the complete inflow reversal transported warmer Mediterranean waters to the west through the entire transect, as reflected by the pronounced SST maximum (~22.5 °C) recorded in Ceuta buoy but surprisingly delayed by several hours. A secondary peak of SST was monitored only in the northern shoreline by the end of the month (delimited by purple dotted lines in
Figure 9b,c). The temperature increased from 18 to 22 °C, approximately, whereas in the southern area of the SoG no relevant changes in SST were noticed (
Figure 12d).
Equally, a similar situation was encountered from 11th to 25th of August 2017 (
Figure 12e), with a progressive warming of 7.5 °C at the upper ocean layer of the northern shoreline (
Figure 12g). The westward CCC was revealed from the 11th towards the end of the month, and confined at higher latitudes except for the already analyzed 2-day event of 14th–15th, when a full flow reversal was documented (
Figure 12e) and an abrupt increase of 4 °C was observed in Ceuta buoy (
Figure 12h).
4. Discussion
Motivated by the critical relevance of AJ over the upper-layer circulation in the Western Alboran Sea, the ability of the HFR system to properly portray the AJ intensity and direction at the midpoint of the selected transect (
Figure 1b) was evaluated. A strong relationship between remotely observed AJ speeds and angles was evidenced: with current velocities above 50 cm·s
−1, the AJ appeared to be locked at an angle around 63° (
Figure 3a and
Figure 5). This finding is in close agreement with previous results reported in Reference [
14], where an averaged angle of 60° was obtained by using satellite-derived observations and hydrodynamic model simulations. The role of the underlying topography (
Figure 1a) on the prevailing current direction is also noteworthy in steeper regions like the SoG since it acts as physical constraint, enclosing the directional variability of the flow.
The AJ speed usually fluctuated between 50 cm·s
−1 and 170 cm·s
−1 (
Figure 3a), with periodic tidal-induced pulses reaching peaks above 200 cm·s
−1 as a result of increases in current speed as they encountered the constrictions of the local bathymetry [
28]. Occasional drops below 50 cm·s
−1 were coincident with abrupt changes in AJ orientation (
Figure 5). A significant direct relationship between the zonal and meridional velocity components was showcased, with the former almost three times stronger than the latter (
Figure 3c). Such dependence was confirmed by a high and positive correlation coefficient of 0.74, thereby explaining the recurrent propagation direction of the surface stream when it was directed towards the North-East.
The AJ pattern was observed to follow a marked seasonal cycle (
Figure 4), in high accordance with the sequence documented in the literature [
9,
14]. A stronger AJ flowed towards the NE during winter, whereas a steady weakening in mean AJ speed was noticed along springtime. A minimum was reached by summer when a weaker AJ was directed more southwardly. During autumn, the AJ intensity partially recovered and the currents flowed again predominantly to the NE. Notwithstanding, the main discrepancy with earlier works lies in the higher AJ intensity here reported: whereas HFR-derived mean speed was about 110 cm·s
−1 (reaching peaks of 200–250 cm·s
−1 regardless of the season), previous modeling works substantially underestimated monthly-averaged AJ speeds, always reporting values below 50 cm·s
−1 [
14].
Six full reversal episodes of the surface inflow through the SoG, persistent during at least 48 h, were detected by means of Hövmoller diagrams of HFR-derived zonal velocity component (
Figure 6) and subsequently analyzed in terms of prevailing synoptic conditions (
Figure 7 and
Figure 8) and wind-driven circulation patterns (
Figure 11). High pressures and intense (above 10 m·s
−1), permanent, and spatially-uniform easterlies prevailed over the entire study domain, inducing a westward outflow through the SoG as revealed by the 2-day averaged HFR circulation maps. Local wind forcing at this scale seemed to play a primary role in explaining such AJ collapse and the related inflow reversals. It has been previously well-documented how the interface fluctuates at the northeastern entrance of the Strait in response to local wind forcing [
25]. Under strong westerlies, the interface depth rises (reducing the upper layer thickness) and the eastward HFR-derived current speed increases, being fully representative of the entire upper layer flow. Conversely, under prevailing intense easterlies, the interface becomes deeper (increasing the upper layer thickness) and HFR estimations are thereby illustrative of only the shallowest part of such a layer. Future efforts should address the synergistic integration of HFR estimations and outputs from a 3D high-resolution coastal model to provide further insight into the entire water column and comprehensively characterize the circulation in the SoG and the water exchanges at different depth levels.
According to both
Table 2 and
Figure 10, tides appeared to play a secondary role in the full flow inversion as the six episodes were observed during strong easterlies, regardless of the tidal phase. The westward inflow reversal was moderately accelerated (decelerated) during the tidal outflow (inflow). On the contrary, the Atlantic inflow into the Mediterranean was favored and intensified under westerlies: the tidal flow only partially sped up or slowed down the eastern flowing current, depending on the phase of the tide. These results are in accordance with previous modeling studies [
26] where the contribution of the semidiurnal tidal component to the transport was proved to be relevant over the Camarinal Sill, (incrementing the mean transport by about 30%, both for the inflow and the outflow), whereas it was almost negligible at the eastern end of the Strait. Equally, Reference [
27] described the structure of the barotropic tide (sea level oscillation) and showed that the amplitude of the prevailing semidiurnal constituents diminished more than 50% from the western to the eastern end of the Strait and had little cross-strait structure.
One of the direct physical consequences of persistent inflow inversion was the sudden and abrupt rise of SST (above 5°) in the SoG during summertime when warmer Mediterranean waters were injected into the mild Atlantic Ocean (
Figure 12). Some of those SST increases were confined to the northern shoreline of the Strait due to the presence of the CCC. Such coastal flow inversion has been previously described and is the subject of further analysis in Reference [
25], where the CCC was demonstrated to exist regardless of the wind direction, being substantially intensified and broadened during predominant strong easterlies.
Ongoing efforts are devoted to conduct a multi-model inter-comparison exercise, ranging from global ocean models to regional and high-resolution coastal models in order to elucidate: (i) the accuracy of each system to characterize the AJ dynamic; (ii) their ability to adequately reproduce the singular and sporadic small-scale coastal ocean process here described, the quasi-permanent full reversal of the AJ surface flow; and (iii) quantify the added-value of dynamical downscaling approaches in coastal areas.
As an essential part of the coastal ocean observing system [
29], HFR only provide information of surface currents. To better study three-dimensional coastal ocean circulation variability, it would be useful to adopt a multi-platform approach by combining HFR estimations with other observational data sets, such as in situ observation from moored ADCPs and satellite remote sensing products [
30,
31].
Finally, it is worth mentioning that the present three-site HFR network is planned to be extended, with the imminent integration of a new site (denominated Camarinal and managed by the University of Cádiz, Cádiz, Spain) to better monitor the coastal ocean dynamics in the westernmost section of the SoG. Within this framework, the top priority issue is not only the maintenance of continued financial support to preserve the infrastructure core service already implemented, but also the pursuit of funding to extend the network for an overall coverage.


