Multi-Year Concentrations, Health Risk, and Source Identification, of Air Toxics in the Venice Lagoon
 Elisa Morabito
 Elena Gregoris2
  Daniele Contini
 Daniela Cesari
 Andrea Gambaro
- 1Department of Environmental Sciences, Informatics and Statistics, Ca’ Foscari University of Venice, Venice-Mestre, Italy
- 2Institute of Polar Sciences, National Research Council of Italy, ISP-CNR, Venice-Mestre, Italy
- 3Institute of Atmospheric Sciences and Climate, National Research Council of Italy, ISAC-CNR, Bologna, Italy
- 4Institute of Atmospheric Sciences and Climate, National Research Council of Italy, ISAC-CNR, Lecce, Italy
This work presents and discusses the results of multi-year measurements of air toxics concentrations from different sites of Venice Lagoon. The aim of the study is the characterization of the air quality of the area, in terms of PM10, PM10-bound metals, and polycyclic aromatic hydrocarbons (PAHs) concentrations, even with the individuation of the related inhalation risk and the identification of the main contaminants’ sources. The study moreover provides an important multi-years trend of chemical characterization of the Venice Lagoon. Sampling for PM10 and its metal content was carried out between 2010 and 2015, using low volume sequential aerosol samplers; V, Cr, Fe, Co, Ni, Cu, Zn, As, Mo, Cd, Sb, Tl, and Pb were measured by ICP-MS. Samples for PAHs concentration in gas and particle phases were collected from 2010 to 2014, using a high-volume air sampler that allows to sample both phases simultaneously. Samples for PAHs determinations were analyzed by GC-HRMS. Concentrations of air toxics have been studied with the use of enrichment factor, the coefficient of divergence, and the Mann-Kendal test, to individuate eventual local divergences, seasonal and other temporal trends. The inhalation risk assessment has been achieved by the calculation of the cumulative incremental carcinogenic risk for all the air toxics analyzed. The sources’ identification and impact evaluation have been carried out using the atmospheric vanadium concentration, to calculate the primary contribution of ship traffic to PM10, the Positive Matrix Factorization, and the Diagnostic Ratios, with the aim of evaluating the impact of construction activities of M.o.S.E, (Modulo Sperimentale Elettromeccanico-Electromechanical Experimental Module) as well as of ship traffic and other possible air toxics’ sources. Temporal trends indicate a slight decrease of PAHs and PM10 and of its content of Pb, Zn, Sb. Sharp increases of As and Cd during 2014 and 2015 may be due to local sources like emissions from the construction yard, ship, and road traffic. The cumulative incremental carcinogenic risk was below the unconditionally acceptable risk; Co and As are the most important contributors among metals, followed by Cd and Ni while the PAH congeners that most contribute to the carcinogenic risk were benzo(a)pyrene and dibenzo(A,H)anthracene.
Introduction
Air pollution may cause effects on visibility and climate, effects on materials, direct and indirect effects on vegetation (Harrison et al., 2014), and nevertheless, particulate air pollution is an important risk factor for cardiopulmonary disease and mortality, both as a result of acute and chronic exposure (Arden Pope and Dockery, 1999). This has shown an association between exposure to particulate matter air pollution and the incidence of lung cancer (Raaschou-Nielsen et al., 2013). Between toxic air pollutants, known or suspected to cause serious health effects, a great deal of interest from scientific community, is addressed to heavy metals and polycyclic aromatic hydrocarbons.
Inorganic elements are present in atmosphere associated with particulate matter, although their origin can be from natural (e.g., Na, Mg, K, Ca, Si, and Al), or anthropogenic (e.g., V, Cr, Mn, Ni, Cu, Zn, Cd, and Pb) emissions. Natural sources of metals and semi-metals are rocks and soils, volcanic emissions, forest fires, sea sprays, and biogenic emissions. Anthropogenic emissions include instead a wide variety of sources, such as agriculture, mining, coal and oil combustion, ceramic and glass production, road traffic, waste incineration, a variety of industrial activities, and human activities. Elements like As, Cd, Pb, Sb, Se, Cr, Co, Cu, Ga, Hg, and Mo are emitted by coal combustion (Bool et al., 1996), while V, Ni, and Pb are emitted mostly by oil combustion (United States Environmental Protection Agency, 1998); V and Ni may also be tracers of ship traffic emissions (Zhao et al., 2013; Viana et al., 2014); Cu, Zn, Pb, and Sb are often associated with traffic emissions and road dust (Han et al., 2011; Contini et al., 2012). Heavy metal associated with atmospheric particles may accumulate in human being via inhalation and may cause dangerous effects on human health: effects on the respiratory system, effects via the cardiovascular system, and carcinogenesis (Harrison et al., 2014).
Another class of very widespread toxic air pollutants is that of polycyclic aromatic hydrocarbons (PAHs). These compounds are produced by incomplete combustion of organic material emitted by a multiplicity of sources, such as industrial activities, motor vehicles, residential heating, forest fires, biomass burning, and shipping activities (Mastral and Callén, 2000; Ravindra et al., 2008; Riva et al., 2011). It has been estimated that emission of PAHs from natural sources, such as non-anthropogenic burning of forests or volcanic eruptions, may be negligible (Wild and Jones, 1995). PAHs are persistent in the environment and ubiquitous, and moreover may bioaccumulate through the food web. For these reasons they constitute a risk for both environment, animal, and human health. PAHs were one of the first atmospheric pollutants identified as suspected carcinogen: the carcinogenic, mutagenic and teratogenic potential of PAHs increases with their molecular weight (ATSDR, 2002; Ravindra et al., 2008). Moreover the vapor/particle phase partitioning of PAHs indeed influences their transport, deposition, and chemical transformation and, as a result, is crucial in terms of reactivity and effects on human health.
For these reasons, a specific issue of interest, as recognized also by EPA, is to identify specific chemicals as well as specific sources that can impact air quality and consequently responsible for health risks.
The studied area in this work is the Venice Lagoon, a fragile highly urbanized costal environment. Due to its position, the Venice Lagoon is subjected to anthropogenic inputs of organic and inorganic pollutants, regarding the whole environment: atmosphere, lagoon water, and sediments. As far as the atmosphere is concerned, the lagoon is subjected to long-range transport of both organic and inorganic contaminants, coming from the Po Valley, one of the most polluted area of Europe, via aerosol. Moreover, it is affected by local anthropogenic emissions produced by different sources such as industrial activities, thermoelectric power plants, petrochemical plants, incinerator plants, domestic heating, ship traffic, glass factories, and vehicular emissions transported from the mainland (Prodi et al., 2009; Stortini et al., 2009; Contini et al., 2012; Valotto et al., 2014; Squizzato and Masiol, 2015; Squizzato et al., 2016). Additionally, since 2005, the Venice Lagoon has been affected by the emissions related to the construction yards of the M.o.S.E. (Modulo Sperimentale Elettromeccanico – Electromechanical Experimental Module), a system of mobile dams, located one for each lagoon inlet (Chioggia, Malamocco, and Lido; Morabito et al., 2014).
The aim of this study is to characterize the air quality of the Venice Lagoon, related to the presence of PM10- bound potentially toxic elements and PAHs. A study of the inhalation risk due to the contaminant analyzed and an evaluation of their possible sources in the Venice air environment, has also been carried out. Sampling was carried out from 2010 to 2015 (for PM10 and its metal content) and from 2010 to 2014 (for the PAHs concentration, in gas and particle phase) in three sites of the lagoon area. Concentrations of pollutants have been studied with the use of enrichment factor, the coefficient of divergence (COD), and the Mann-Kendal test, to individuate eventual local divergences, seasonal, and other temporal trends. The inhalation risk assessment has been achieved by the calculation of the cumulative incremental carcinogenic risk both for potentially toxic elements in PM10 and for PAH in gas and particulate phase. Moreover a deep study to investigate the source identification and apportionment has been carried out, to enhance the principal sources of contamination in the three sites, and to evaluate the impact of construction activities of M.o.S.E, as well as of ship traffic and other possible sources. The sources’ identification and sources’ impact evaluation have been carried out by the use of the atmospheric vanadium concentration, to calculate the primary contribution of ship traffic to PM10, the Positive Matrix Factorization (PMF), and the Diagnostic Ratios (DR). Moreover, by integrating our data with those obtained in other previous studies (Contini et al., 2012; Gregoris et al., 2016), this study provides a significant temporal trend of the characterization of aerosol in the Venice Lagoon in terms of PM10 concentration and its elemental characterization.
Materials and Methods
Sampling
The sampling covers a temporal range of about 5 years, from January 2010 to September 2015. Sampling sites were placed in the vicinity of the three lagoon inlets and next to the M.o.S.E. construction yards: Punta Sabbioni (PS) at the northern lagoon inlet, Malamocco (MM) next to the central lagoon inlet, and Chioggia (CH) at the southern inlet (Figure 1).
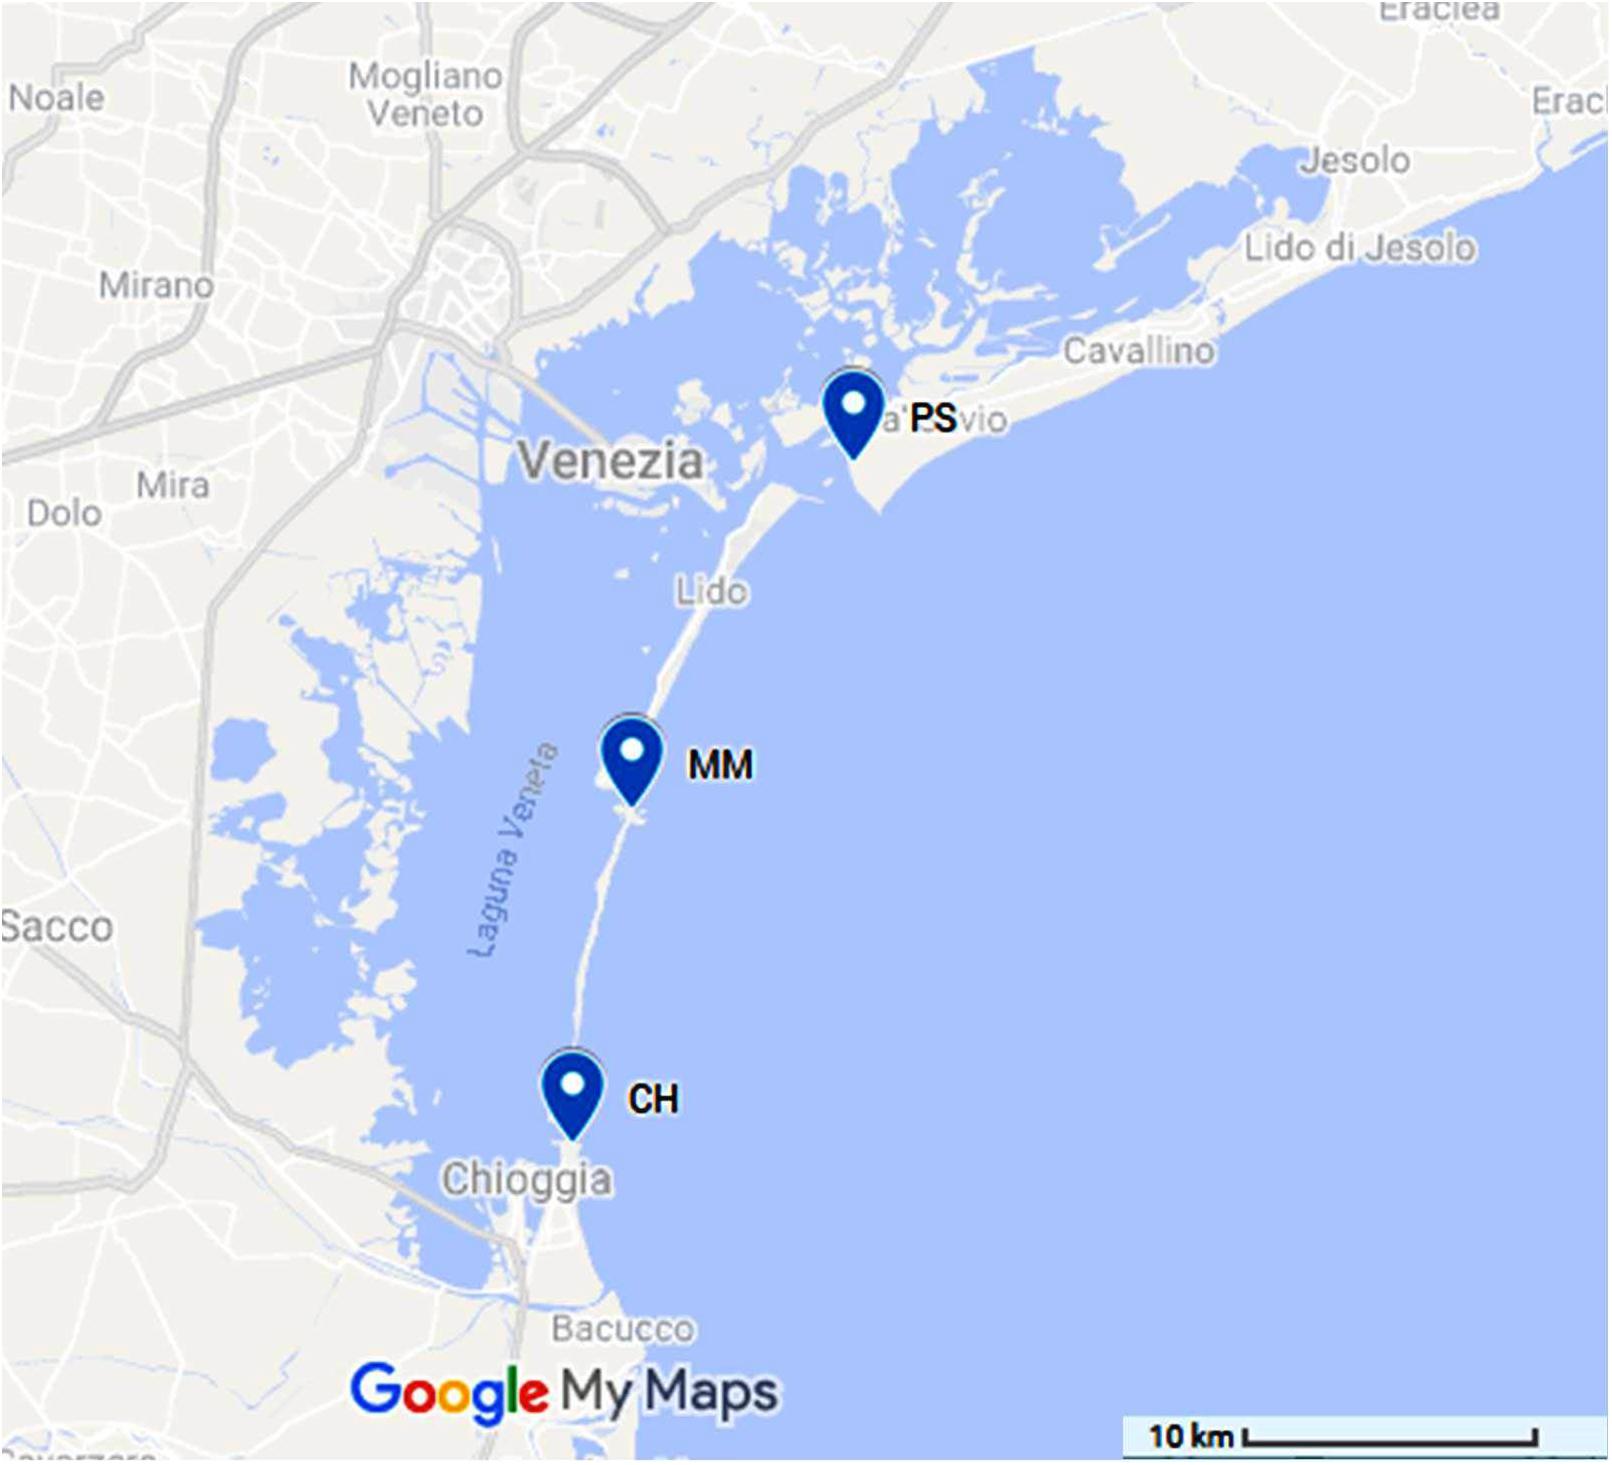
Figure 1. Location of the sampling sites.
Inorganic Pollutants
Sampling of PM10 for the metal content analysis were carried out from January 2010 to September 2015. The sampling was not a continuous activity: each campaign lasted 14 days, with frequency from 2 to 4 campaigns/year. In detail, 16 sampling campaigns were carried out in PS from January 2010 to September 2015, 13 in MM from January 2010 to March 2015, and 11 in CH site from March 2010 to March 2015, with a total of 209, 181, and 144 daily samples in the three sites, respectively. The periods of sampling include different seasons, both holidays and working days. The PM10 samples were collected using low volume sequential aerosol samplers (Skypost PM-TCR Tecora) with an electronically adjustable flow (2.3 m3 h–1), 16 filters capacity, and a sampling module for automatic filter changing after 24 h. Two of the 16 filters were used as field blank, one before and one after the campaign, to control the uncertainties. The filters, in quartz (Sartorius, diameter 47 mm) were weighed three times (%RSD 5–10%) over 24 h, before and after the sampling, using a Sartorius Competence CP64-0CE balance (precision of 0.01 mg) in a nitrogen box glove with controlled humidity (50 ± 5%), and temperature (20 ± 5%).
Organic Pollutants
Sampling of PAHs was carried out from February 2010 to February 2014 in PS and from March 2010 to October 2014 in MM, with a total of 10 sampling campaigns in PS and 13 in MM. Each campaign lasted 14 days and during each campaign, 8 samples, and 8 blanks were collected. The dates of the sampling, together with relative meteorological information (wind direction, wind speed, precipitations, and temperature) are reported in the Supplementary Information (Supplementary Tables SI 1, SI 2). The sampling was conducted using a high volume sampler (AirFlowPUF, Tish Environmental Inc., Village of Cleves, OH, United States), which allows to separate the gas from the particulate phase (TSP, Total Suspended Particles). The latter was collected on quartz fiber filters (QFF, porosity 1 μm, diameter 102 mm, and SKC Inc., United States), while the gas phase was collected on polyurethane foams (PUF, height 75 mm, diameter 65 mm, and SKC Inc., United States). The sampling system maintained a constant flow rate of 0.3 m3 min–1. PUFs and QQFs were replaced every 24–96 h. Before sampling, QFFs were furnace-treated at 400°C for 4 h and PUFs were pre-cleaned by extraction using the Pressurized Liquid Extractor (PLE, Fluid Management Systems Inc., United States) under the following working conditions: 100°C temperature, 1000 psi pressure, 7 min static duration, using toluene (two cycles), and an n-hexane and dichloromethane mixture (1:1; one cycle)2 cycles. Pesticide-grade dichloromethane, n-hexane and toluene (Romil Ltd., Cambridge, United Kingdom) were used. Cleaned QFFs and PUFs were individually wrapped in double aluminum foil until the time of sampling. After the sampling, QFFs and PUFs were individually wrapped again in double aluminum foil and stored at −20°C until preparation for analysis.
Procedures, Analytical Methods, and Materials
Inorganic Pollutants
Each filter was digested by microwave (Ethos1-Milestone) inside a Teflon vessel (100 mL) held in a 10-place high-pressure carousel (Milestone HPR-1000/10S High Pressure), with 6 mL HNO3, 3 mL H2O2, and 1 mL HF (Romil ®Ultra-pure Acid, UpA). The digestion temperature program consisted of a ramp from room temperature to 100°C in 10 min, followed by a time sequence (5 min/step), allowing the maintenance and increase (Δt 20°C) of the temperature to 180°C, after which this value was maintained for 10 min. In all the digestion sessions, one or two vessels were used as a blank to check the quality of the reagent and the procedure. After each digestion program, the vessels were cleaned using a temperature-controlled program (20 min ramp from room temperature to 160°C and 10 min at 160°C) with 10 mL of HNO3 (Romil Suprapur Acid, SpA), and 1 mL of HF (Romil Ultra-pure Acid, UpA). Samples solutions and blanks obtained by the digestion were then diluted to 50 mL (by weight) with ultrapure water and stored at −20°C until instrumental analysis.
Inorganic elements (V, Cr, Fe, Co, Ni, Cu, Zn, As, Mo, Cd, Sb, Tl, and Pb) in PM10 samples were measured by Inductively Coupled Plasma- Quadrupole Mass Spectrometer (ICP-QMS, Agilent 7500). Element concentrations in samples were obtained after subtraction the relative field blank values. The accuracy of the method was controlled using the standard reference material (SRM NIST1648a, Urban Particulate Matter) and the recoveries of the analyzed elements were between 90% and 100%.
All the vessels and materials used during the preparation and the analysis of the samples were acid-cleaned and conditioned following the cleaning procedures described elsewhere (Capodaglio et al., 1994), to minimize sample contamination. For the same reason handling, treatment of the samples, and analysis were carried out in a clean chemistry laboratory (Class 100), an atmosphere-controlled laboratory, along with sample pre-treatment.
Organic Pollutants
Analyses of organic pollutants were carried out in the CSMO (Centro Studi Microinquinanti Organici – Study Center of Organic Micropollutants) laboratory in Voltabarozzo, Padua, Italy, following the EPA 8270 D method.
We determined 16 of the United States Environmental Protection Agency (United States Environmental Protection Agency, 1981) priority PAHs: naphthalene (NAP), acenaphthylene (ACY), acenaphthene (ACE), fluorene (FL), phenanthrene (PHE), anthracene (ANT), fluoranthene (FLA), pyrene (PYR), benzo[a]anthracene (BaA), chrysene (CHR), benzo[b]fluoranthene (BbF), benzo[k]fluoranthene (BkF), benzo[a] pyrene (BaP), benzo[ghi]perylene (BghiP), indeno[1,2,3-c,d]pyrene (IcdP), and dibenzo[a,h]anthracene (DahA), both in QFFs and PUFs.
PUFs and QFFs samples were extracted separately using a Pressurized Liquid Extractor and the same operating conditions used for the cleaning procedure. Blank and samples were spiked before extraction with a known amount of 13C-labeled phenanthrene as internal standard (Cambridge Isotope Laboratories, Andover, MA, United States). The extracts were cleaned by injection onto a packed neutral silica column, previously conditioned with 50 mL of n-hexane, using the automated PowerPrep system (Fluid Management Systems Inc.).
Determination of PAHs were performed with a MAT 95XP (Thermo Finnigan, Bremen, Germany) high-resolution mass spectrometer, coupled with a Hewlett-Packard model 5890 series II gas chromatograph, equipped with a fused silica capillary column (J&W Scientific DB-5MS, 60 m × 0.25 mm O.D. 0.25 μm film thickness). Details of the gas-chromatograph operating conditions are reported in Gambaro et al., 2009. Pesticide-grade dichloromethane, n-hexane and toluene (Romil Ltd., Cambridge, United Kingdom) were used. Recoveries, laboratory and procedural blanks, and further details about the analytical method have been already reported (Gambaro et al., 2009; Contini et al., 2011; Gregoris et al., 2014; Morabito et al., 2014).
Statistical Analysis of Data
Coefficient of divergence (COD)
Some diagnostic statistical analyses have been carried out, In order to investigate any spatial differences in PM10 concentration, in its metals content, and further differences between holidays and working days, or other temporal variations, the COD has been calculated. This coefficient is often used when there is the necessity of investigating the discrepancy between two different datasets, which may be, for example, two sampling sites, two different events, two seasons, years of sampling, as well as variables, like chemical concentrations (Liu et al., 2019; Ramírez et al., 2019; Galindo et al., 2020).
The COD is calculated following the formula (Eq. 1):
Where j and h stand for two sampling sites (or event/non-event, working day/holidays, etc.) Xij and Xih are the average concentrations of the chemical element i, n is the number of the analyzed chemical elements (Wongphatarakul et al., 1998). If the value of COD is zero, there is no divergence, if COD is near 1, there is heterogeneity in the data set. In literature is considered that COD < 0.2 indicates similarity, 0.2 < COD < 0.5 indicates moderate heterogeneity, and COD > 0.5 indicates that the two studied cases are different (Zou et al., 2018).
For these statistical evaluations, the values under MDL were substituted with half MDL, and the variables with more than 50% of samples under MDL have been eliminated from the dataset.
Incremental carcinogenic inhalation risk
The cumulative incremental carcinogenic inhalation risk was calculated for PM10, based on metals concentrations, and for gas and particulate matter, together accounted, based on PAHs concentration. We followed the indications of the United States Environmental Protection Agency (US-EPA) summarized in the report n. EPA-540-R-070-002 (United States Environmental Protection Agency, 2009). The exposure concentration (Ec) of an adult in a residential scenario was calculated for each contaminant using the equation (Eq. 2) for chronic exposure:
where Ca is the air contaminant concentration; Et is the exposure time (24 h/day); Ef is the frequency of exposure (350 days/year); Ed is the exposure duration (30 years); and At is the averaging time corresponding to the lifetime (70 years × 365 days/year × 24 h/day).
The incremental carcinogenic risk was calculated multiplying the exposure concentration of each contaminant i for the corresponding Inhalation Unit Risk (IUR). Used IUR values were tabulated from the Regional Screening Levels (RSLs) – Residential air (United States Environmental Protection Agency, 2016) and corresponded to: 9.0 × 10⁻³ (μg m–3)–1 for Co; 2.6 × 10⁻⁴ (μg m–3)–1 for Ni; 4.3 × 10⁻³ (μg m–3)–1 for As; 1.8 × 10⁻³ (μg m–3)–1 for Cd; 1.1 × 10⁻⁵ (μg m–3)–1 for CHR; 1.1 × 10⁻⁴ (μg m–3)–1 for BaA, BbF, BkF, and IcdP; 1.1 × 10⁻³ (μg m–3)–1 for BaP, and 1.2 × 10⁻³ (μg m–3)–1 for DahA.
Positive matrix factorization (PMF)
Positive Matrix Factorization is a multivariate factor analysis tool for investigating the contribution of sources to atmospheric contaminants. PMF was conducted using the PMF 5.0 software by US-EPA. The dataset was composed of metal concentrations measured in the three sites (CH, MM, and PS together). Data were preliminary refined in order to obtain a robust dataset. Variables with more than 50% of values under MDL were rejected. Values under MDL were substituted by half of MDL. The divergence between data collected in the periods 2010–2013 and 2014–2015, confirmed by CODs > 0.5 in all the monitoring sites (see section “Contaminant concentration”), prevented the convergence of the model: for this reason, data collected in 2014 and 2015 have been excluded from the dataset. As uncertainty, the standard deviation of the field blanks of each campaign was adopted, normalized for the average sampling volumes of each campaign. The uncertainty of values under MDL was 5/6 MDL. An additional uncertainty of 10% was included for all species. Before running the PMF model, discrimination between “strong,” “weak,” and “bad” variables has been made, according to the signal to noise (S/N) ratio criterion, the residual analysis and evaluating the observed/predicted scatter plots. In this dataset V, Co, As, and Cd were categories as “strong,” the other variables as “weak.” In order to individuate the right number of factors, different solutions were explored and the parameters IM (maximum of the average of the scaled residual), and IS (maximum of the standard deviation of the scaled residuals), together with the Q value (goodness of the fit) were examined, following the approach reported in Contini et al. (2012), and Gregoris et al. (2014). The validity of the selected solutions was estimated applying various tests, as suggested in the EPA PMF 5.0 user guide (US-EPA, 2014). In the Bootstrap (BS) error estimation (number of runs 100; min. correlation value 0.6), new datasets are randomly constructed from blocks of the original dataset. A number of BS datasets are then processed with PMF and the BS factors are compared to the base run factors. If each BS factor is correlated to a single base run factor, all factors are considered “mapped” and the solution can be interpreted. Rotational ambiguity was explored using the displacement (DISP) error estimation, which assesses the largest range of source profile values without an appreciable increase in the Q-value. The solution was considered valid only if no swaps were observed for the lowest displacement (dQmax = 4) and if the calculated decrease of Q was not significant (<1%). Additionally, the error estimation by BS-DISP was also conducted, for estimating the errors associated with both random, and rotational ambiguity at the same time. The solution was considered valid only if no swaps were observed for the lowest displacement (dQmax = 0.5) and if the calculated decrease of Q was not significant (<0.5%; US-EPA, 2014).
Results and Discussion
Contaminant Concentration
PM10 and Its Metal Content
In Table 1 samples data related to PM10 concentration and its content in heavy metals is reported. From the gravimetric analyses emerged that PM10 average concentrations, in the whole sampling period, (±standard deviation) in the three sites were 31.1 μg m–3 (2.4–116.9 μg m–3 of range) in PS, 36.5 μg m–3 (7.5–130.9 μg m–3) in MM, and 38.8 μg m–3 (0.7–379.2 μg m–3) in CH. These values are similar to those found in literature in Venice Lagoon (Masiol et al., 2010, 2012a,b; Contini et al., 2011, 2012). The concentrations of all the analyzed metals in PM10 were consistent with those found in the mentioned previous studies in the same area, for all the sites.
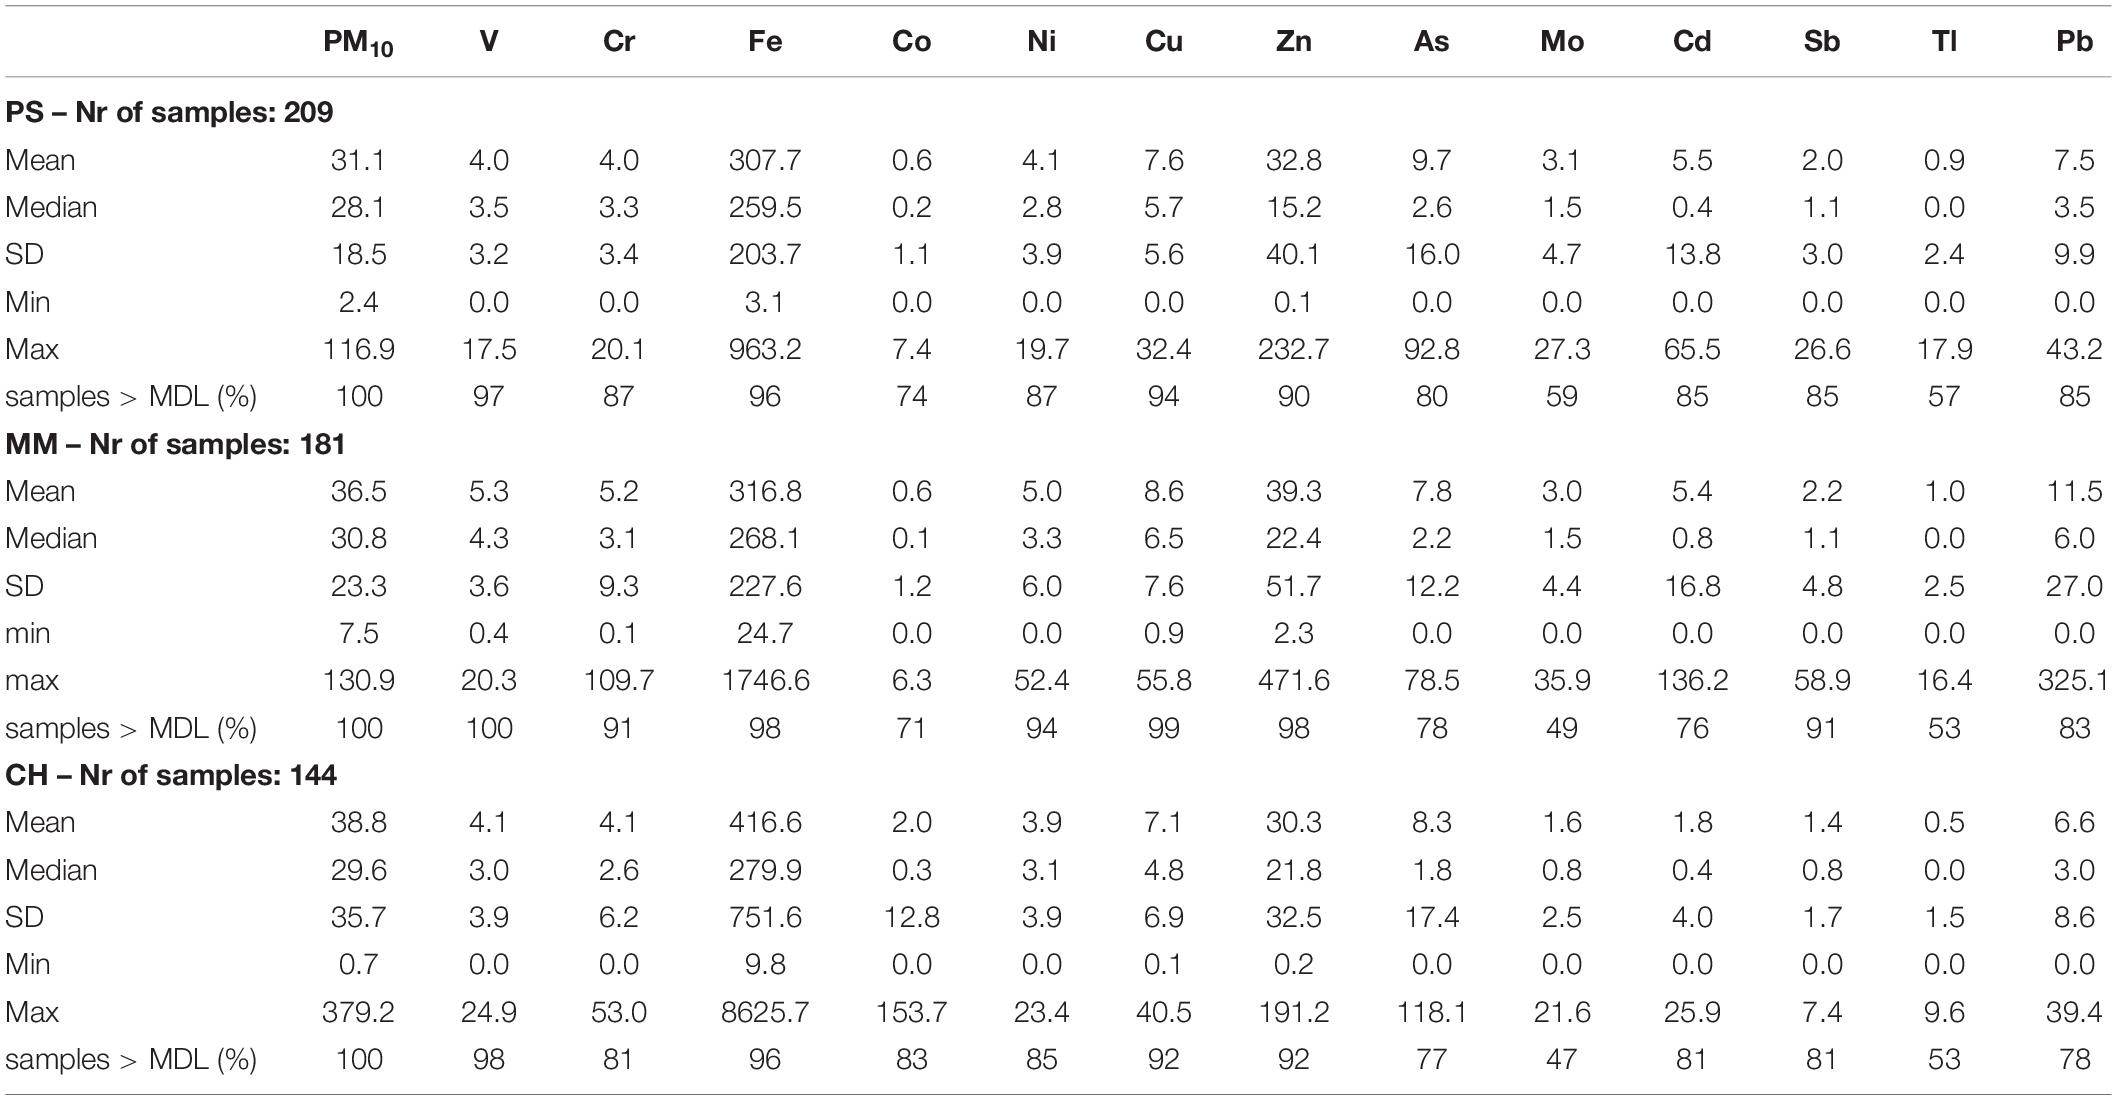
Table 1. PM10 concentration (μg m–3) and its metal contents (ng m–3) in the three sites in the whole sampling period.
Considering the average concentrations and the large range of variation, in the whole sampling period, of both PM10 and elements, there does not appear to be any differences among the three sites (Table 1 and Supplementary Figure SI 1). This has been confirmed by the CODs: 0.1 between PS and MM, which indicates similarity; 0.26 between MM and CH, and 0.24 between CH and PS, which both indicate weak difference. All CODs are reported in Table 2. Mo and Tl, having high percentage of samples < MDL (especially concentrated in few campaigns) were not considered in the CODs evaluation and statistical data elaborations.
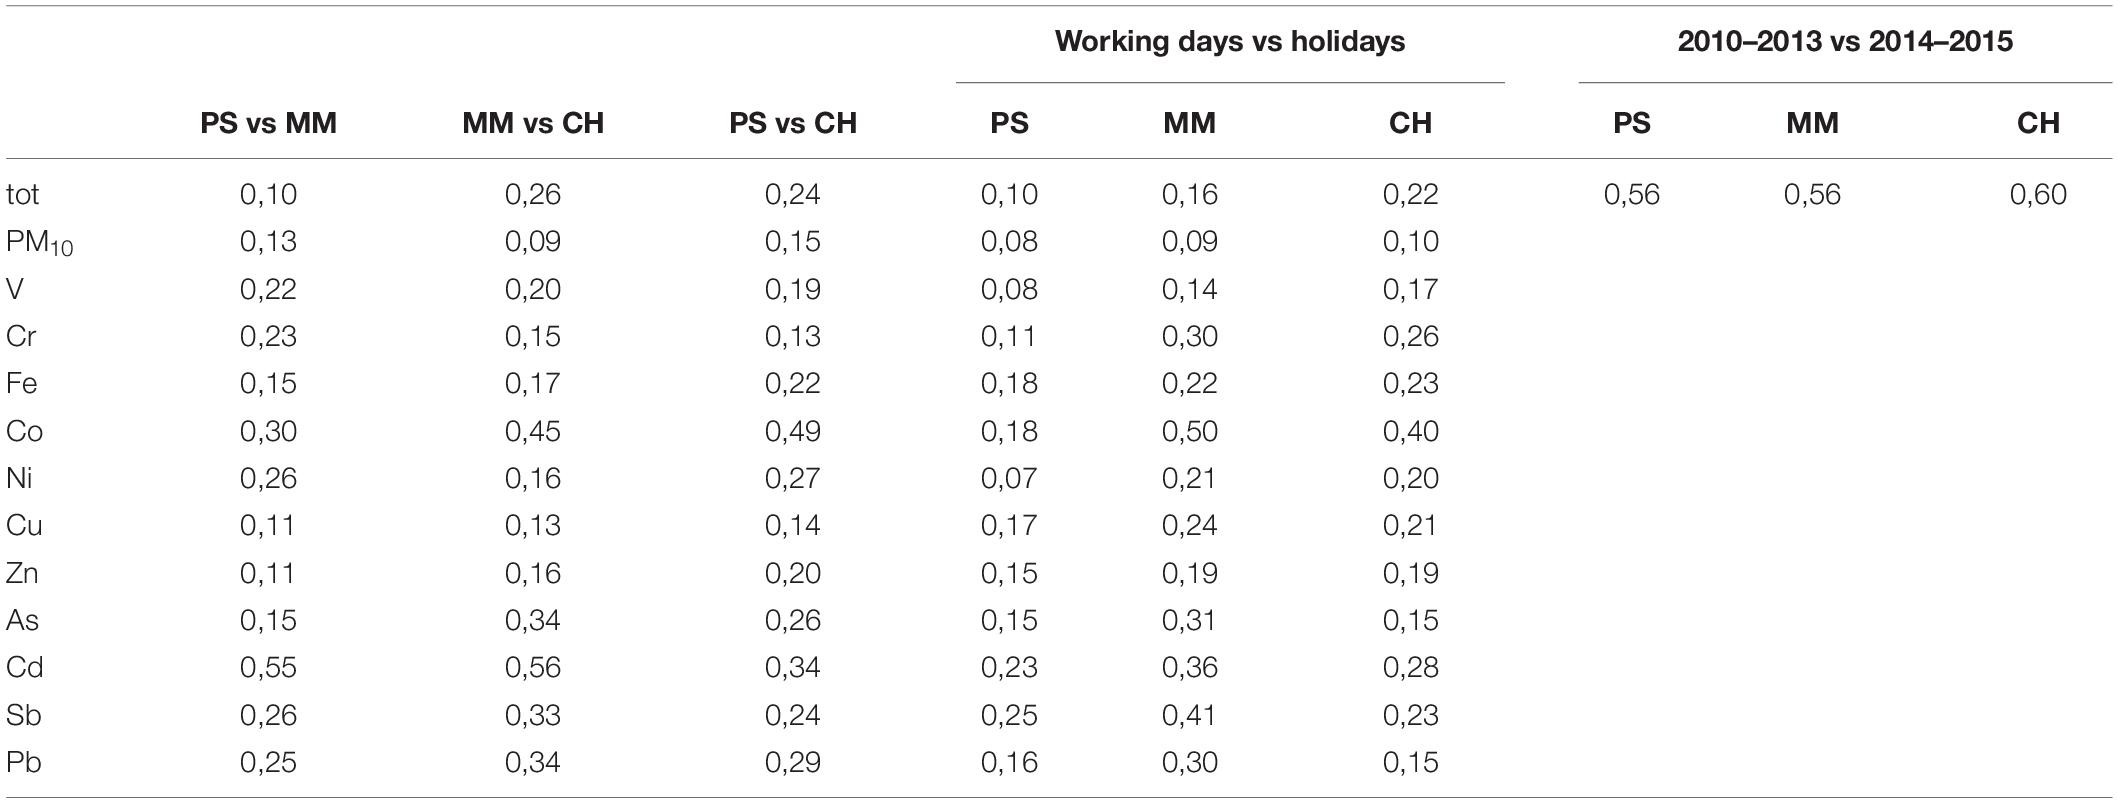
Table 2. Coefficients of divergence between the three sites.
Integrating data obtained in this study with those from previous work carried out by Contini et al. (2012) in the same three sites of the Venice Lagoon, nine-years temporal trends of elements in PM10 are provided. The yearly average concentration of As from 2007 to 2015 highlighted a sharp increase in the last 2 years in all the three sites while, in the same years, the yearly average concentration of Pb has a sharp decrease. Cd shows a “peak” during 2014 in MM, and during 2015 in CH (Figure 2). The trends of yearly average concentrations of the other analyzed elements are reported in the Supplementary Material (Supplementary Figures SI 2, SI 3).
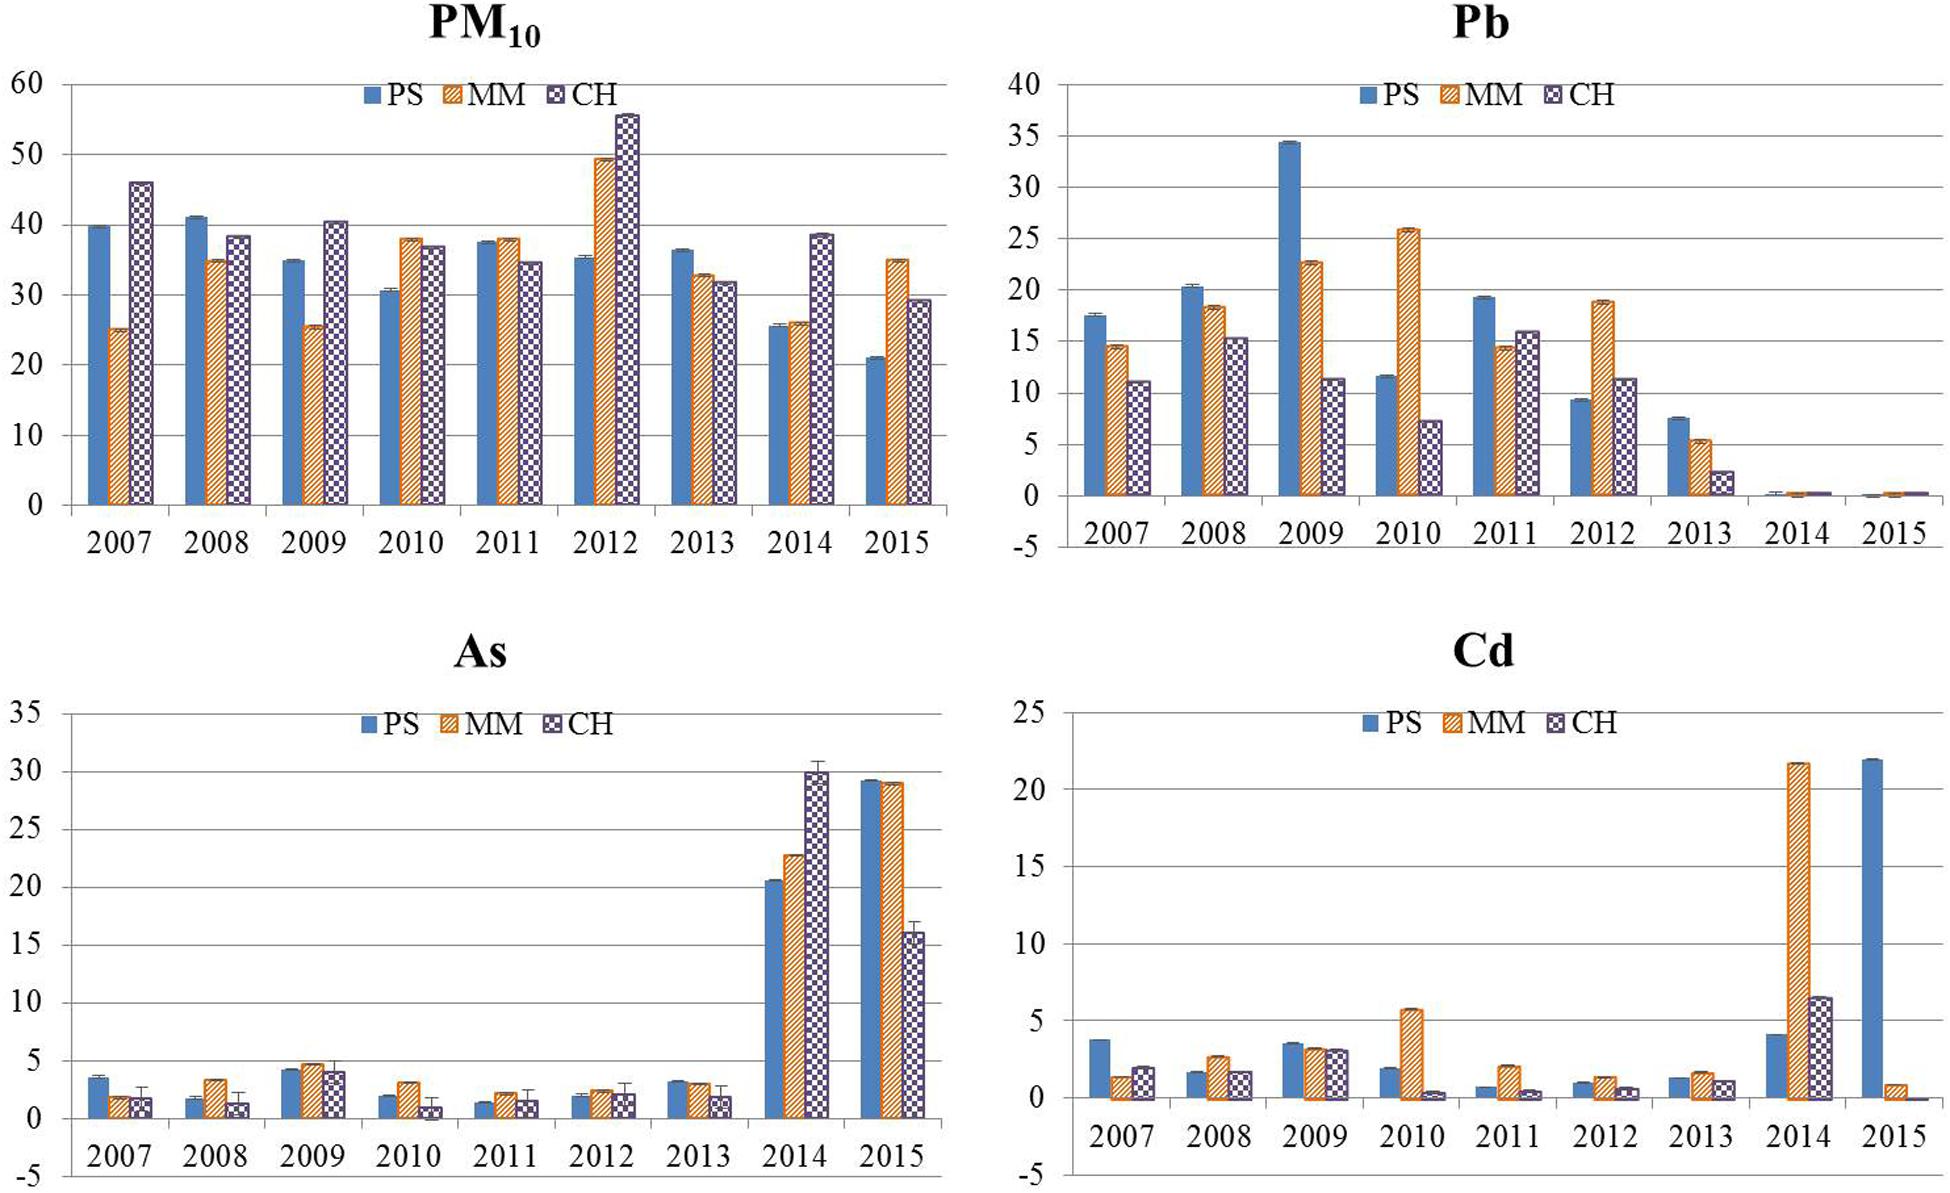
Figure 2. Annual concentration of PM10 (μg m−3) and Pb, As, and Cd in PM10 (ng m−3) from 2007 to 2015.
Monotonic temporal trends of PM10 and its concentrations were evaluated using the non-parametric Mann-Kendall test, based on mean annual values. Results showed a negative monotonic trend of PM10 in PS and CH, with a confidence of 96% and 88%, respectively. As far as elements’ concentration is concerned, negative monotonic trends have emerged for Pb (confidence: 99% in PS, 92% in MM, and 88% in CH), and Sb (confidence: 100% in PS, 100% in MM, 99% in CH) in all the three sites, and for Zn only in PS (confidence: 88%). The Mann-Kendal test does not enhance the sharp increase of As and Cd in the last 2 years, because it evaluates cumulative monotonic trends. As far as Cd in PS is concerned, it should be highlighted that the sampling area is a touristic place and that the location of the air-sampler is near the road. Considering that the sampling campaigns of 2014 and 2015 in PS have been carried out exclusively during warm season, it is likely the rise of Cd concentration in PS is due to an increase of vehicular tourist traffic.
The location of air-sampler in MM, instead, was inside the M.o.S.E. construction site so that, it is more probable that the increase of Cd in MM is due to an increase of yard activities, involving the movement of construction equipment.
The increase in arsenic during 2014 and 2015 occurs at all three sites, suggesting that the source to be long range transport rather than a local emission.
To better understand these sharp decrease (Cd and As) and increase (Pb) in metals concentrations, we compared the yearly average concentrations analyzed in this study, with data from the monitoring station located in the Venice Lagoon and organized by the Regional Environmental Protection Agency (ARPAV; Supplementary Table SI 3). Even if the monitoring station is located close the historical city center (Sacca Fisola), far from our sampling sites, and the methods of concentration acquisition are different, yearly average concentrations of the two data sets are comparable, for all the years, with the exception of 2014 and 2015. Altough the monitoring station detected an increase in As and Cd during these years, it is not as prominent as that analyzed in our study. For these reasons it is more likely that sharp variations highlighted in this study are due to intensity changes of local sources, like emission from the construction yard in the case of MM.
Divergences between sites during the years 2014 and 2015 have been also enhanced by the calculation of the CODs between two sampling periods: 2010–2013 and 2014–2015. The calculated CODs are: 0.56 in PS, 0.56 in MM, and 0.60 in CH (Table 2), indicating a great divergences between the two periods.
To enhance the contribution of construction activities in PM10 and its metals content, CODs between holidays and working days have been calculated. Elements CODs in MM are rather higher than other sites (CODs ≥ 0.3 for Cr, Co, As, Cd, Sb, and Pb). These divergences in elements concentrations between working and no-working days in MM, considering the location of the site, may reflect the influence of the construction activities in the air quality of the sampling area.
The crustal enrichment factors (EFc) for all analyzed elements were also calculated with the aim of assessing the impact of pollution on aerosols by the evaluation of the crustal or anthropogenic origin of the elements. EFc is calculated by the formula (Eq. 3):
comparing the ratios between the concentration of the single element and the reference element in air (samples collected in this study) and in the upper-crust (Wedepohl, 1995). We chose iron as reference element, because this element has been indicated as mainly of crustal origin in the Lagoon of Venice (Masiol et al., 2012a, 2015), and in accordance with another study carried out in the same area (Contini et al., 2012). If EFc is below 10, a crustal origin of the element is more probable, EF < 50 indicates a slightly enriched element, while EF >> 100 indicates exceptionally enriched element. The EFs for all elements in the three sites are reported in Figure 3. From EFs of our data set has emerged: Co, V, (EF ≤ 10) have mainly crustal origin and are slightly enriched; Cr, Ni, Pb, Cu, and Zn (10 < EF < 100) have a predominantly anthropogenic origin, while As, Sb, and Cd are anomalously enriched. In general, except for Co, all the elements have a major enrichment in MM and PS then in CH, and it is extremely evident for Cd. These results are also rather consistent with the previous study of Contini et al. (2012) even if some differences can be noticed as a decrease of the EF of Sb (>1000 in 2012 and <1000 in this study), a slight decrease of the EF of Pb, as confirmed by the negative temporal trend (section “PM10 and its metal content”).

Figure 3. EFs for all the analyzed elements in the three sites.
Polycyclic Aromatic Hydrocarbon (PAHs)
The average concentration of PAHs, as sum of all analyzed congeners was 23.4 ng m–3 (1.1–141.4 ng m–3 of range) and 5.5 ng m–3 (0.5–24.8 ng m–3) in PS and MM, respectively. In both sites the concentration was higher than that previously observed in the summer period in Venice (Contini et al., 2011; Gregoris et al., 2014). The ΣPAHs concentration in PS was very similar to that recorded in a whole-year study in Grenoble (France, Tomaz et al., 2016). ΣPAHs concentration in PS and MM were lower than that measured in a long-term monitoring study in the United States (Liu et al., 2017) and in an 1-year study in India (Kumar et al., 2020).
The period of sampling could highly influence the concentration of PAHs (Hayakawa et al., 2020), since one of the most important anthropogenic source of PAHs is the primary emissions from residential heating, especially biomass burning, during the cold season (Tomaz et al., 2016). Moreover, the high concentration of pollutants in the cold season could also be due to the variation of the thickness of the planetary boundary layer (PBL), the volume of air where the atmospheric pollutants are dispersed. The reduction of the thickness of the PBL in the cold season, due to a reduced solar irradiance, could lead to a rise in the winter concentration of pollutants (Tositti et al., 2014). The seasonal variation of PAHs concentration could be the reason of the great difference between the measured concentration of ΣPAHs in the two sites: in PS 68% of samples have been collected in the heating season (from November to February), while in MM only 22% of them was collected in that period. Moreover, PS is characterized by a greater amount of pollution sources with respect to MM, since PS is more urbanized than MM and it is a tourist destination.
In Figure 4 the ΣPAHs concentration (G + P: gas and particle phases) measured over the period 2010–2014 is shown. The highest average ΣPAHs concentration was observed in PS during the campaign conducted in December 2012 (83 ± 30 ng m–3; Figure 4A); in MM the highest concentration values were measured during the campaign of February 2012 (16 ± 6 ng m–3; Figure 4B). Monotonic trends of the chronological series were estimated using the non-parametric Mann-Kendall test, based on mean annual values, for avoiding the issue of a superimposed seasonal trend. Given the low number of values, we did not use the Z-statistics for the evaluation of trends, thus the Z-score in this case does not satisfy the normal condition, but we referred to the probability values of the S-statistics for number of values under 40 (ISPRA, 2017). Results showed no monotonic trend for data collected in MM and a negative monotonic trend in PS, with 77% of confidence.
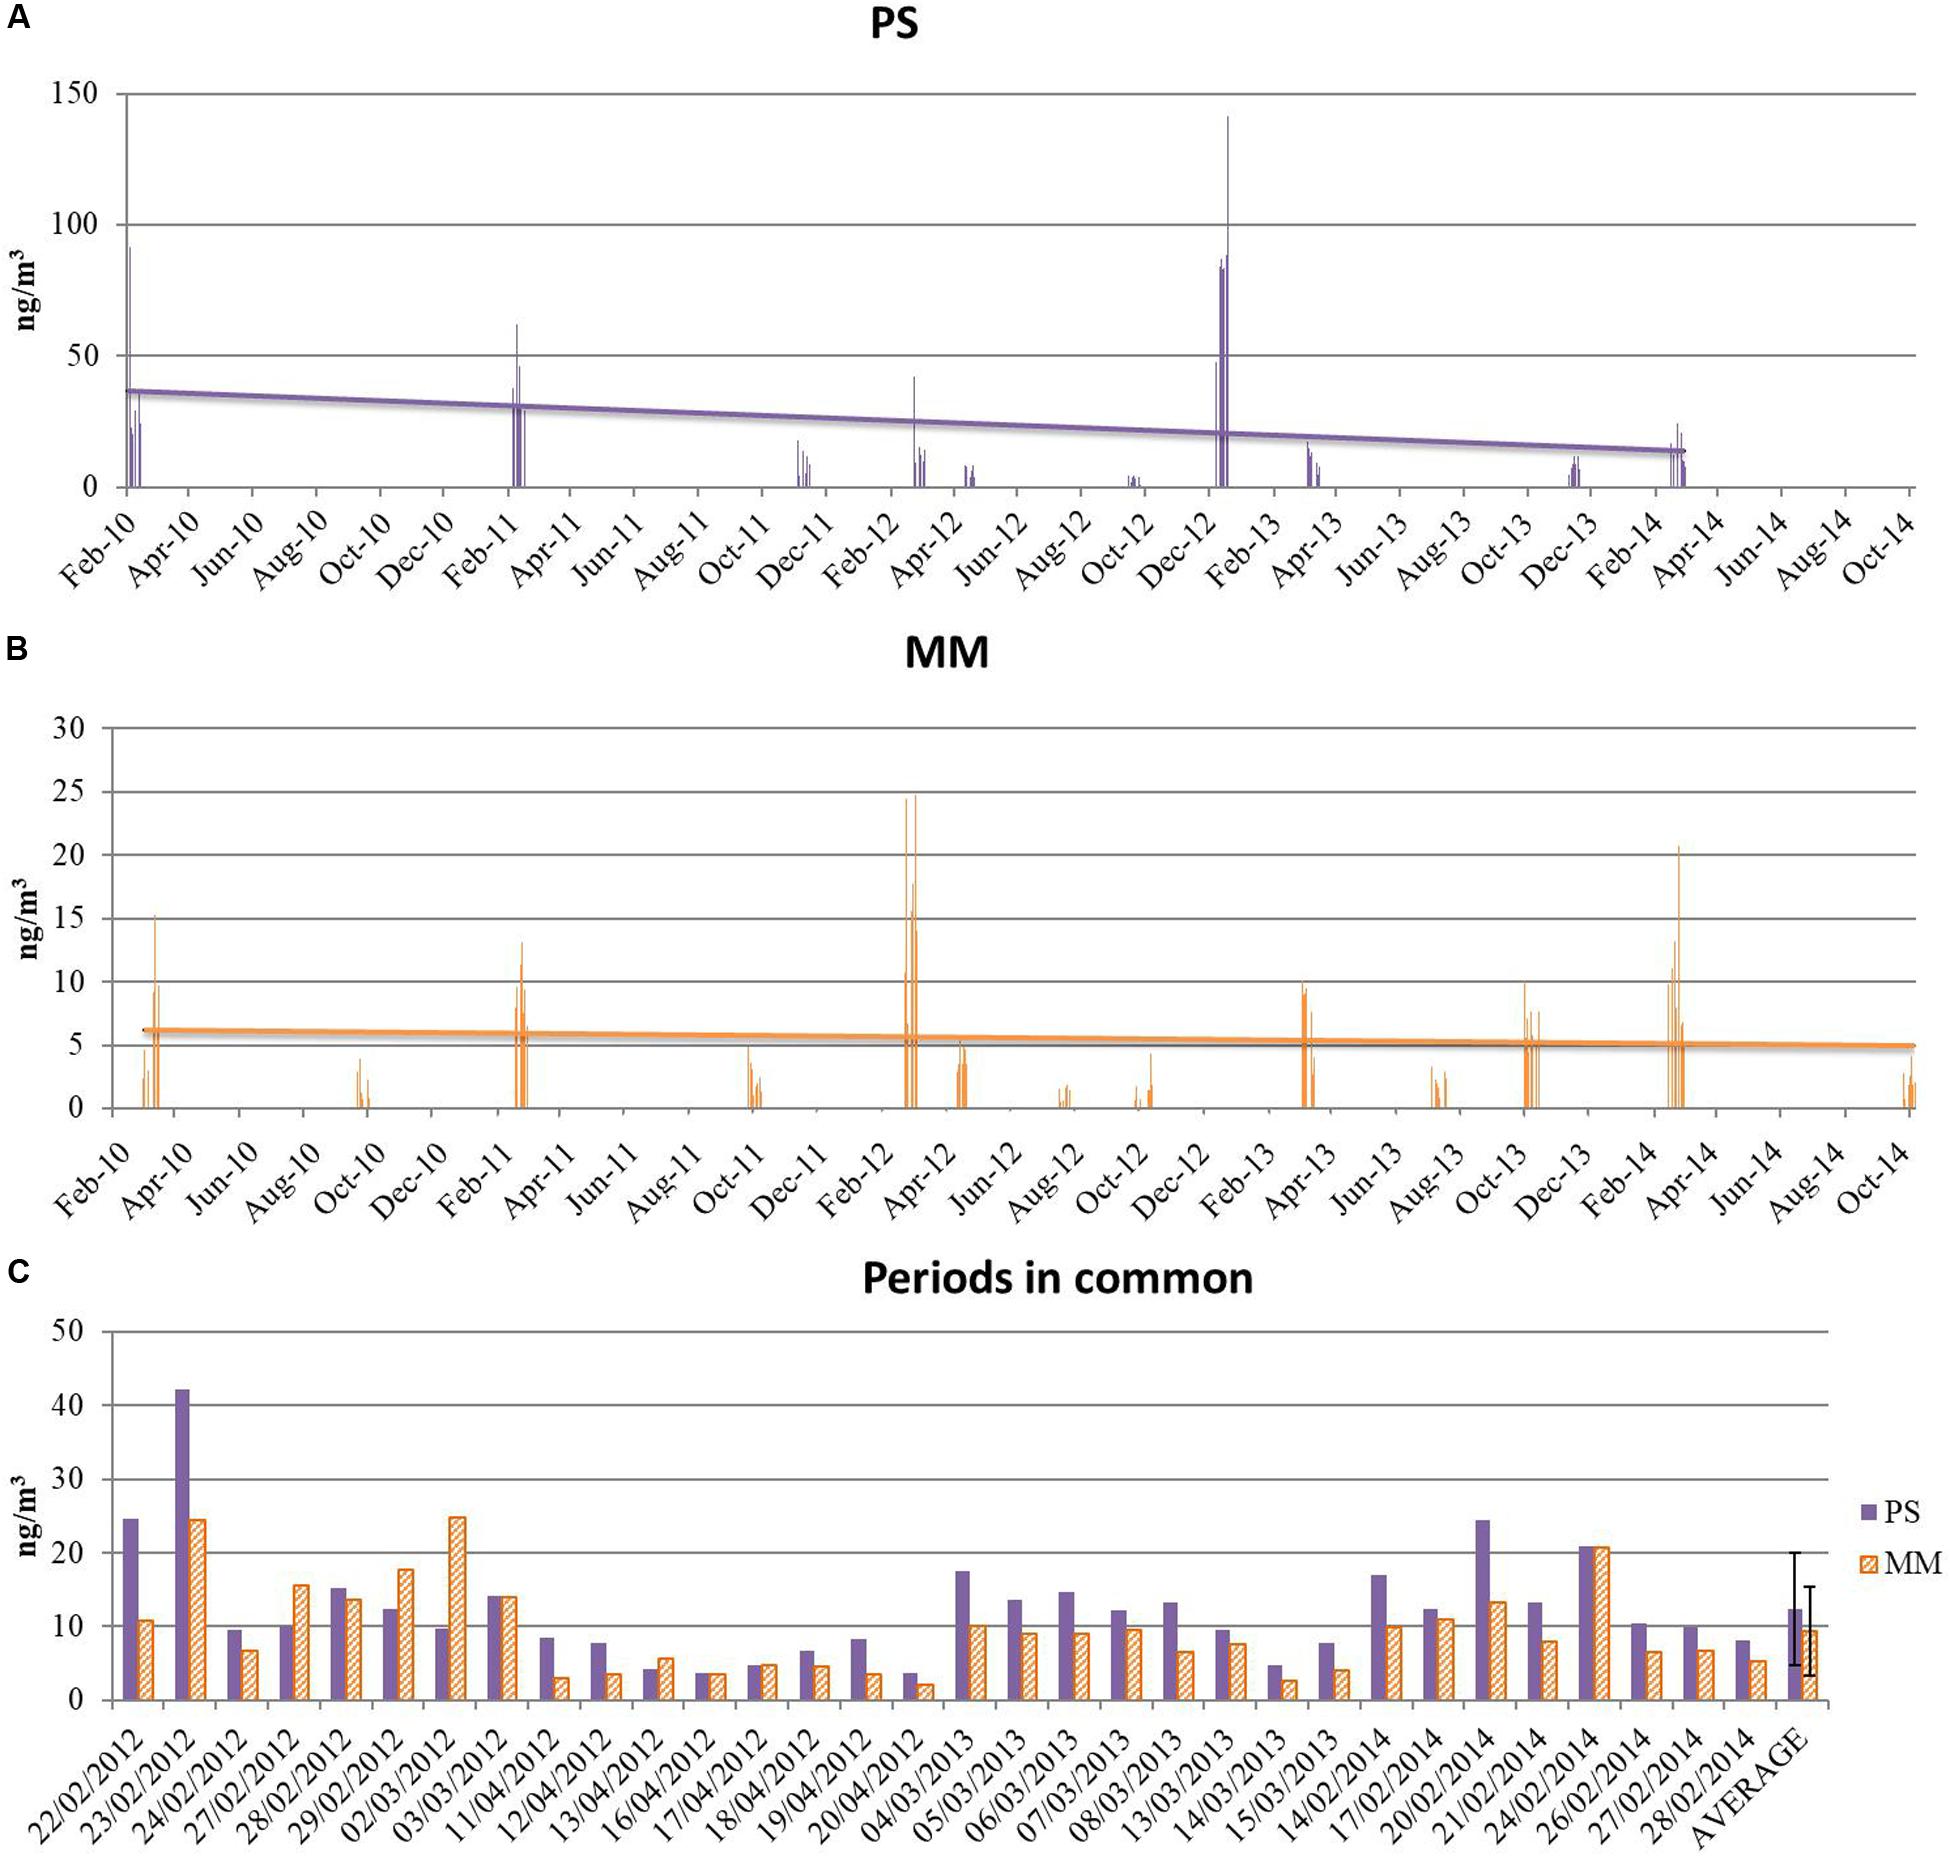
Figure 4. Concentration of ΣPAHs (G + P): (A) in Punta Sabbioni; (B) in Malamocco; and (C) in both sites in the simultaneously monitored periods, with standard deviation as error bars.
Polycyclic aromatic hydrocarbons concentration was measured in the two sites in different campaigns, with only a few days in common. The comparison of ΣPAHs concentration in PS and MM was conducted selecting only the period for which the sampling was simultaneously carried out in the two sites (Figure 4C). The average ΣPAHs calculated in this way in the two sites was similar: 12.4 ± 7.6 ng m–3 in PS and 9.3 ± 6.1 ng m–3 in MM.
The average concentration of particulate PAHs, as sum of all analyzed congeners, was 7.6 ng m–3 (0.2–47.3 ng m–3 of range) in PS and 1.5 ng m–3 (0.1–10.7 ng m–3) in MM; the average ΣPAHs concentration in gas phase was 16.0 ng m–3 (0.9–94.1 ng m–3), and 4.0 ng m–3 (0.02–19.6 ng m–3). The concentration of ΣPAHs in gaseous and particulate phases of all samples is shown in Supplementary Figure SI 4. During the whole period, the concentration of PAHs in gas phase was higher with respect to the TSP phase, with an average contribution of about 67–68% of the gaseous PAHs to the total concentration of PAHs. The G/P ratio in PS and MM (2.1 and 2.6, respectively) was lower than that recorded in a previous work conducted in Venice with summer concentration data (Gregoris et al., 2014), and in Central Europe (Degrendele et al., 2020), and similar to that measured in the Cumalikizik region in Turkey (Gurkan Ayyildiz and Esen, 2020).
In order to have an idea of the seasonal trend of ΣPAHs, we selected the concentration measured in PS site for the year 2012, since in that year and in that site four sampling campaigns were carried out, covering various seasons. In 2012 gaseous PAHs reached the highest total concentration (94 ng m–3) in December and the lowest concentration (0.9 ng m–3) in September. Particulate ΣPAHs ranged from 0.2 ng m–3 (September) to 47 ng m–3 (December). As reported in Figure 5, in both phases ΣPAHs concentration was higher in winter, decreasing moving toward the warm season, as in the classic seasonal trend of organic micropollutants. This trend draws its origin from the sources of the analyzed contaminants, that are mainly emissions from motor vehicles and domestic heating (Tomaz et al., 2016), and in the reduction of the thickness of the PBL in the cold season (Tositti et al., 2014).
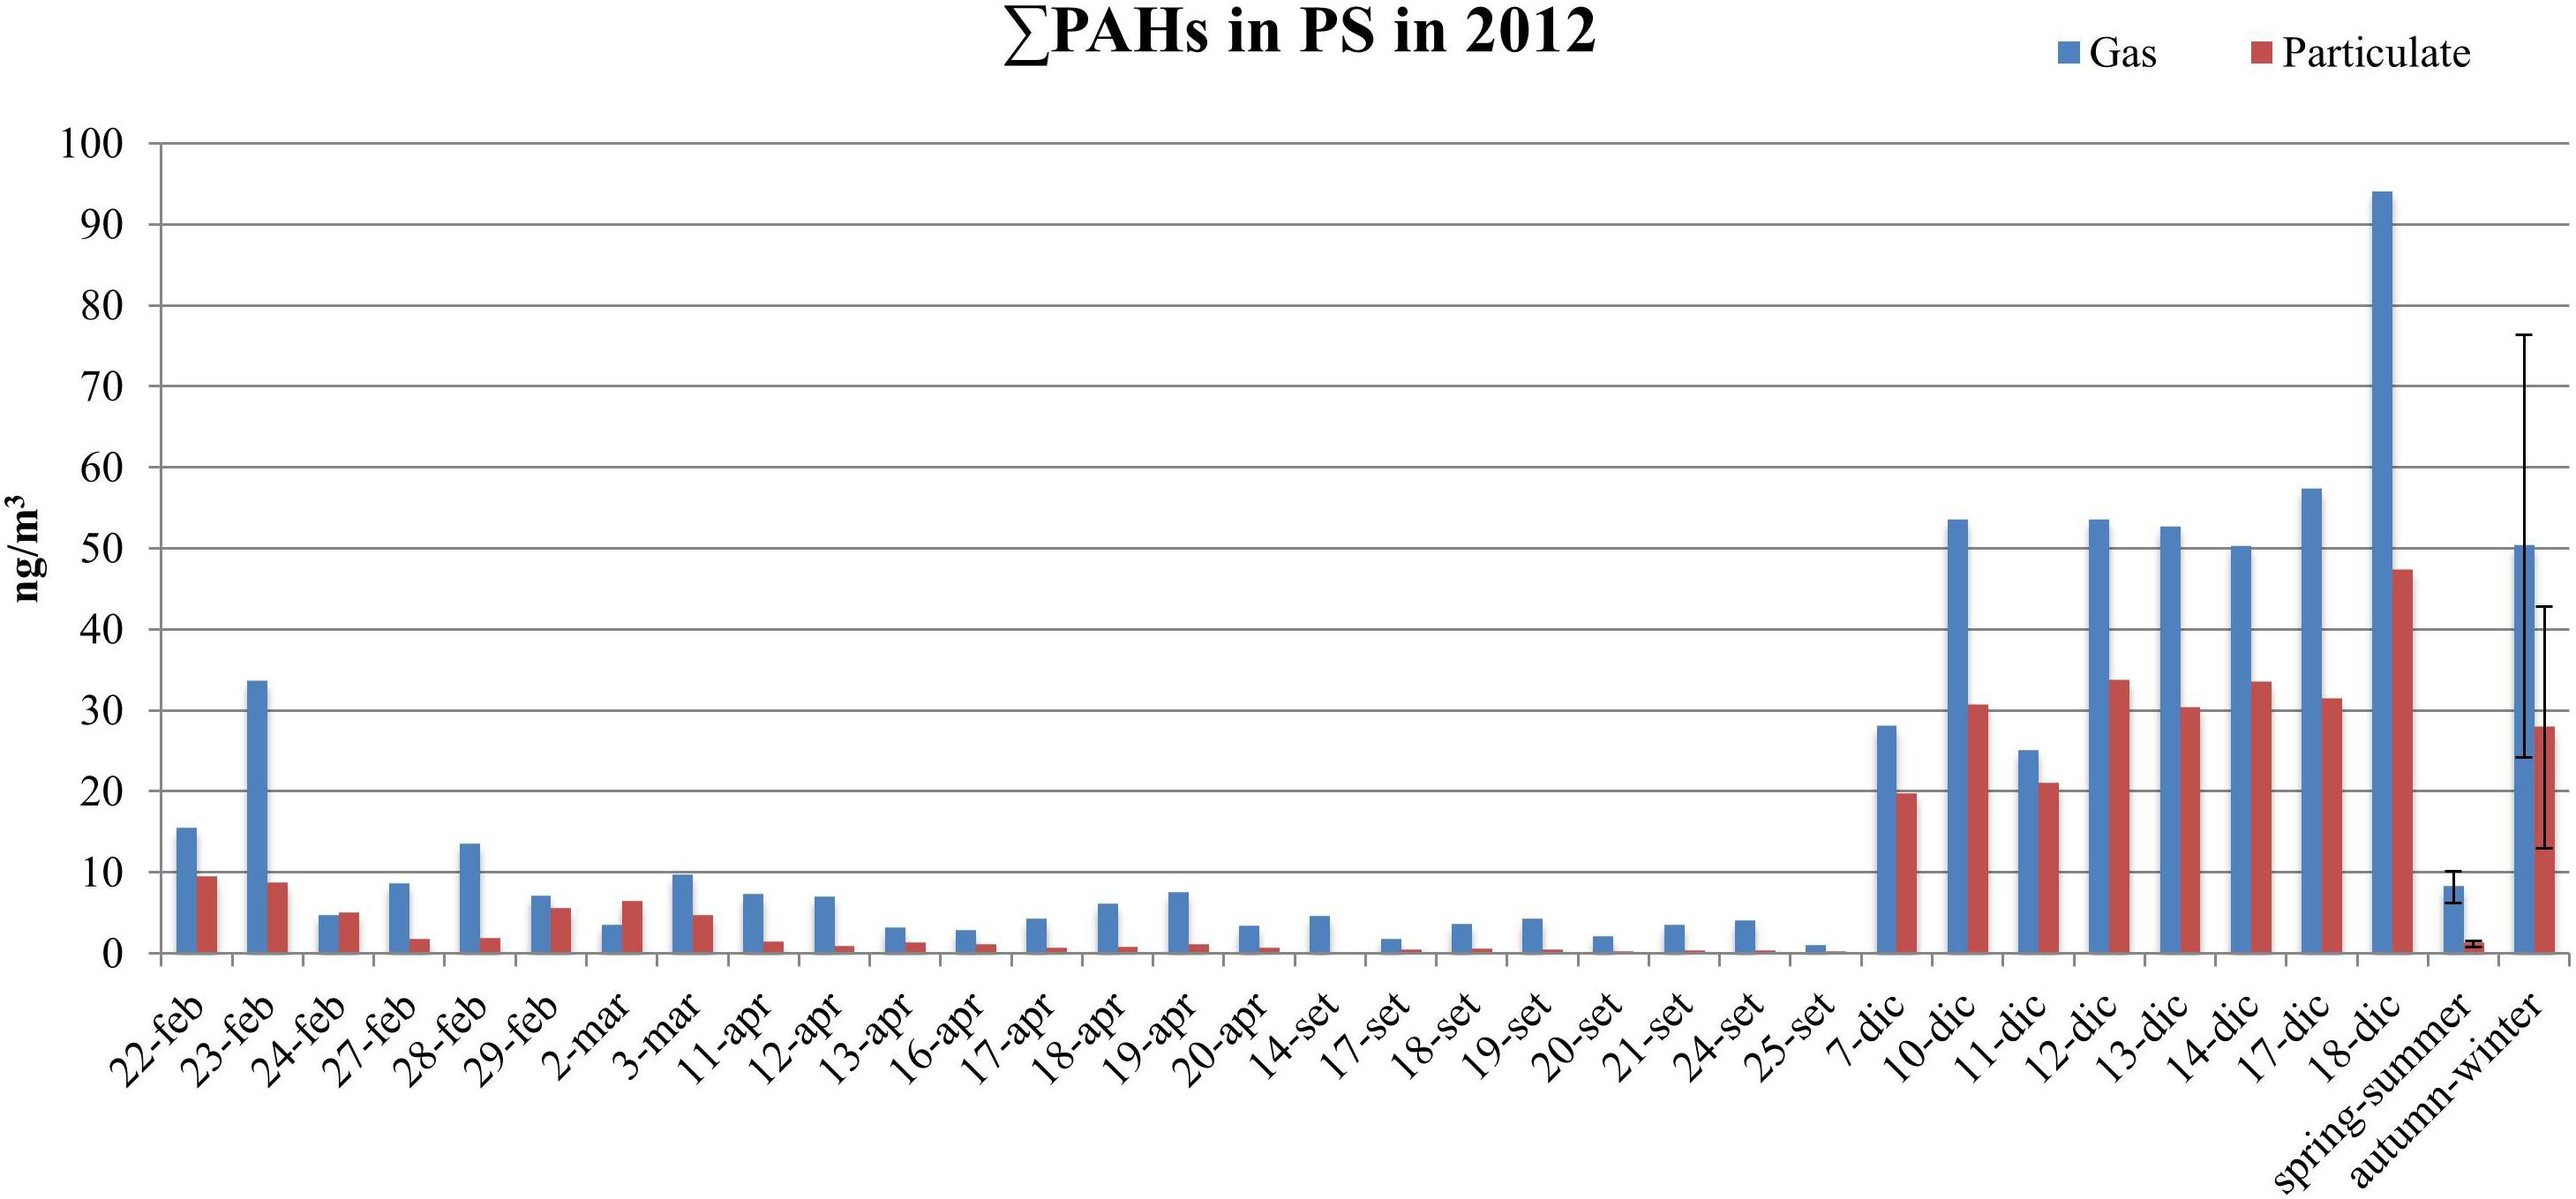
Figure 5. Trend of ΣPAHs in particulate and gas phase, in PS site, for the year 2012, with averages and standard deviations as error bars.
The average concentration of single congeners is reported in the Supplementary Information (Supplementary Figure SI 5). It ranged from a few pg m–3 to a few ng m–3 for PHE in gaseous phase. The composition of samples was similar in the two sites. PHE was the main component in gaseous phase (6.3 ng m–3 in PS, 2.0 ng m–3 in MM, and corresponding to 39 and 48% of total congeners), followed by FL, FLA, and PYR (Figure 6A). PHE, FL, FLA, and PYR accounted together for 75 and 86% to total congeners in gas phase, in PS and MM, respectively. As expected, higher molecular weight PAHs were mainly present in particulate phase. In PS the main constituents of the particulate phase were BaA, CHR, BbF, BkF, and BaP, representing together about 65% of total congeners. FLA, PYR BbF, and BkF were the main present congeners in particulate matter collected in MM, with a contribution of 51% to the total PAHs. The distribution shown in Figures 6B,C is the typical congener profile in PAHs samples, with low molecular weight mainly distributed in the gaseous phase and high molecular weight compounds mainly present in the particulate phase (Gregoris et al., 2014; Tomaz et al., 2016). The distribution of chemicals between the two phases is dependent on the vapor pressure of compounds, which influences their volatilization from the particulate to the gaseous phase. Various factors, including temperature, air humidity, property of adsorption surface, and available adsorption surface, could also influence the vapor pressure and therefore the congener profile (Hassan and Khoder, 2012). The chronological trend of average concentration of PAHs is shown in Supplementary Figures SI 6, SI 7.
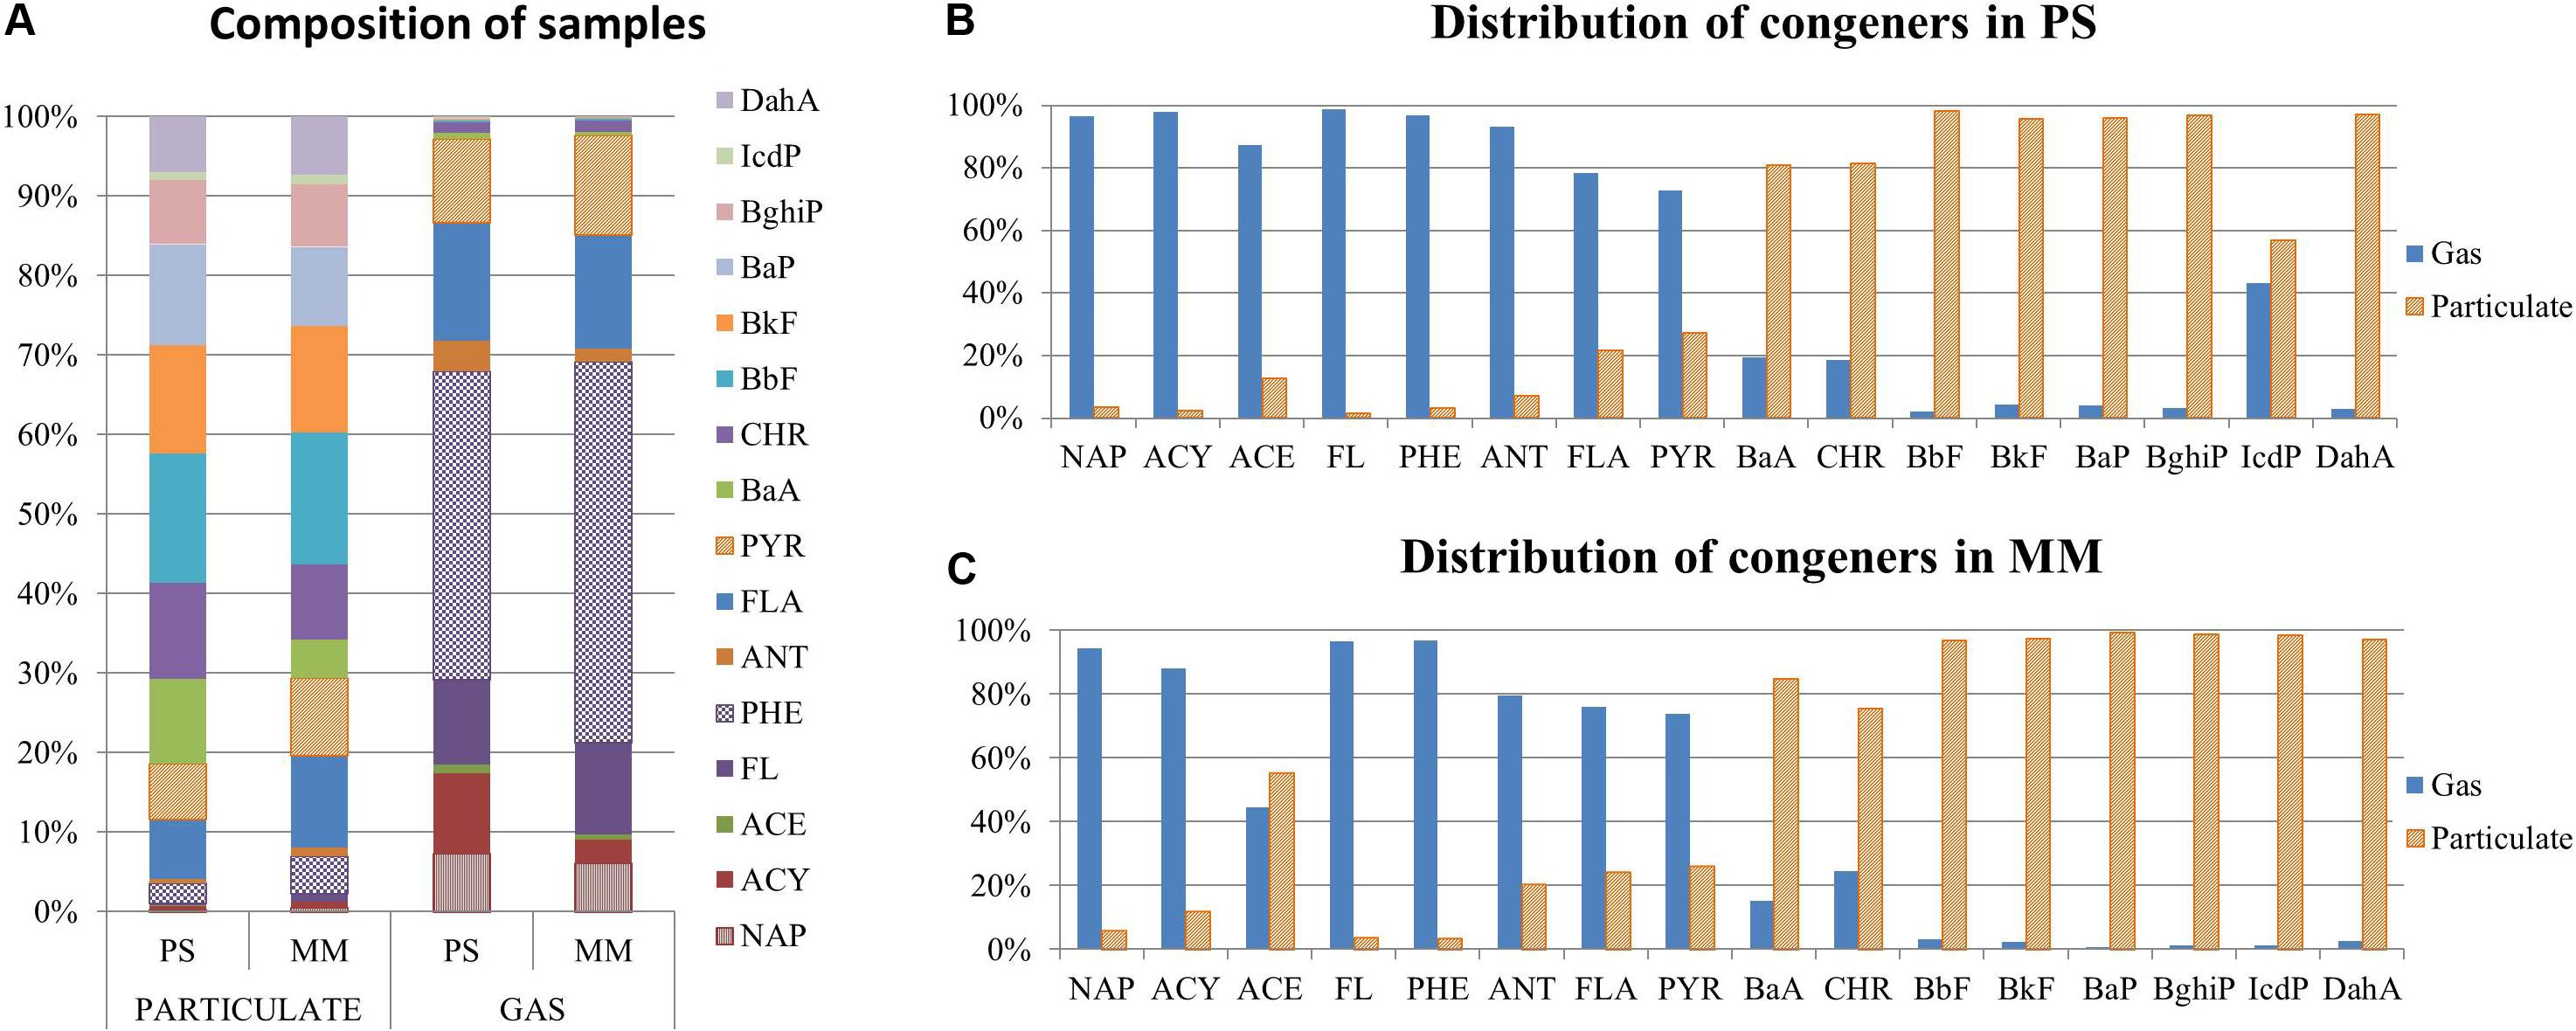
Figure 6. Relative% of PAHs congeners. (A) Composition of gas and particulate samples in PS and MM; relative distribution of congeners among particulate and gas phases in (B) PS and (C) MM.
Inhalation Risk Assessment
The cumulative incremental carcinogenic risk for PM10 was 8.5 × 10⁻⁶ (about one on 118,000), 1.1 × 10⁻⁵ (about one on 92,000), and 1.2 × 10⁻⁵ (about one on 83,000) in PS, MM, and CH, respectively. Values between 1 × 10⁻⁴ and 1 × 10⁻⁶ are generally considerate acceptable by the US-EPA (1999). Co and As are the most important contributors among metals, followed by Cd and Ni. The relative contribution varied among the monitoring sites: the contribution of Co increased passing from 34% in PS, to 40% in MM, and 53% in CH, while the contribution of As, on the opposite, was 47, 39, and 29% in PS, MM, and CH, respectively (Figure 7A).
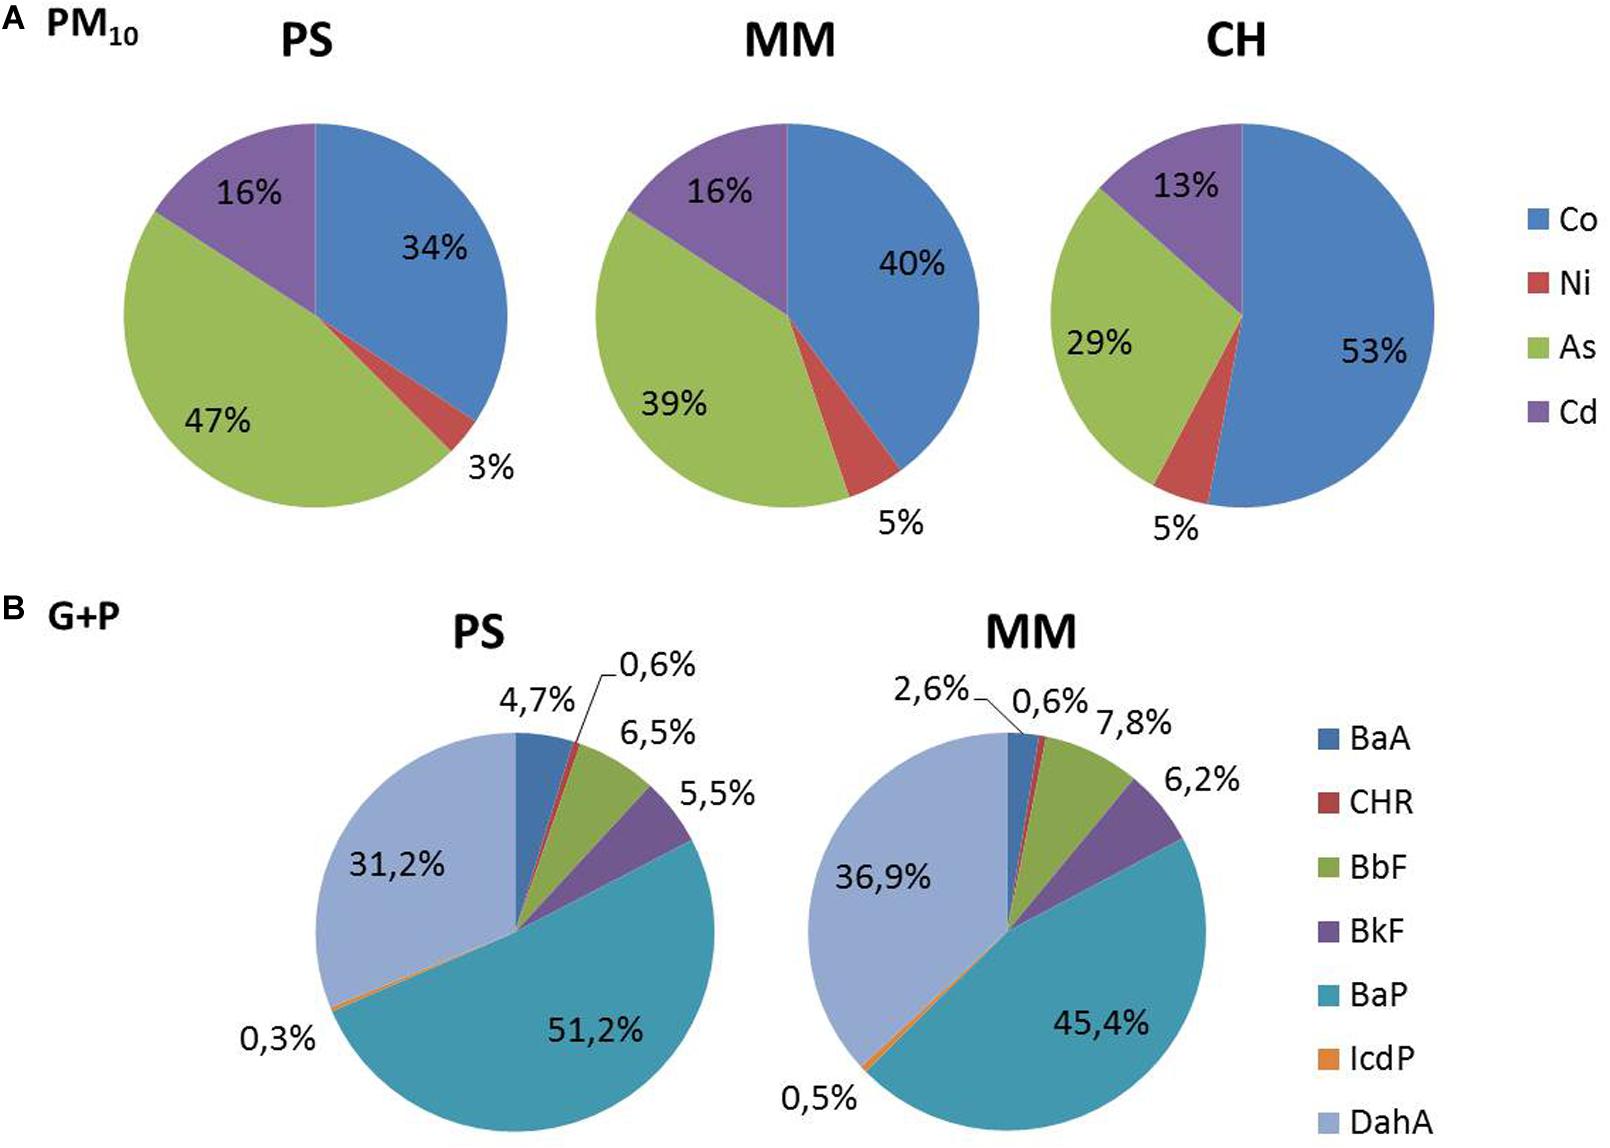
Figure 7. Relative contribution of metals (A) and PAHs (B) pollutants in the incremental carcinogenic risk among the monitoring site.
For PAHs the cumulative incremental carcinogenic risk for G + P was 8.3 × 10⁻⁷ (about one on 1,200,000) and 1.6 × 10⁻⁷ (about one on 6,200,000) for the residential exposure in PS and MM, respectively. In both cases, it was below the unconditionally acceptable risk of one on one million (1 × 10⁻⁶), corresponding to an ample margin of safety (US-EPA, 1999). The congeners that most contribute to the carcinogenic risk were benzo(a)pyrene (51% and 45% in PS and MM) and dibenzo(A,H)anthracene (31% and 37% in PS and MM, Figure 7B), with percentages of contribution very similar to those obtained in previous works, using the TEF method (Gregoris et al., 2014).
Source Identification and Apportionment
Primary Contribution of Ship Traffic to PM10
With the aim of evaluating the input of the source in PM10, the primary contribution of ship traffic to PM10 was quantified, using the atmospheric vanadium concentration, applying the equation (Eq. 4) first introduced by Agrawal et al. (2009).
The constant R has a suggested value of 8205.8 (Agrawal et al., 2009); Va is the ambient vanadium concentration; FV,HFO is a term indicating the typical V content (ppm) in heavy fuel oils (HFO) used by vessels. In this work the value of 65 ± 25 ppm was used, as previously done in the harbors of Venice (Gregoris et al., 2016), and Brindisi (Cesari et al., 2014).
The values of the primary contribution of ship traffic to PM10 in MM and PS were published in Gregoris et al. (2016) as averages of the period 2007–2013. In this work the contribution was updated until 2015, with the additional site of CH. Annual averages from 2007 to 2015 of the primary contribution in the three sites are shown in Figure 8. For the calculation of the contribution in CH, vanadium concentration data previously collected in the same monitoring site was used. An increase of the primary contribution in MM during 2014 is evident, while still remaining in the average of other European cities (Viana et al., 2009, 2014), and seems indicate a change in Venice-port traffic, since MM is on the route of ships entering the lagoon.
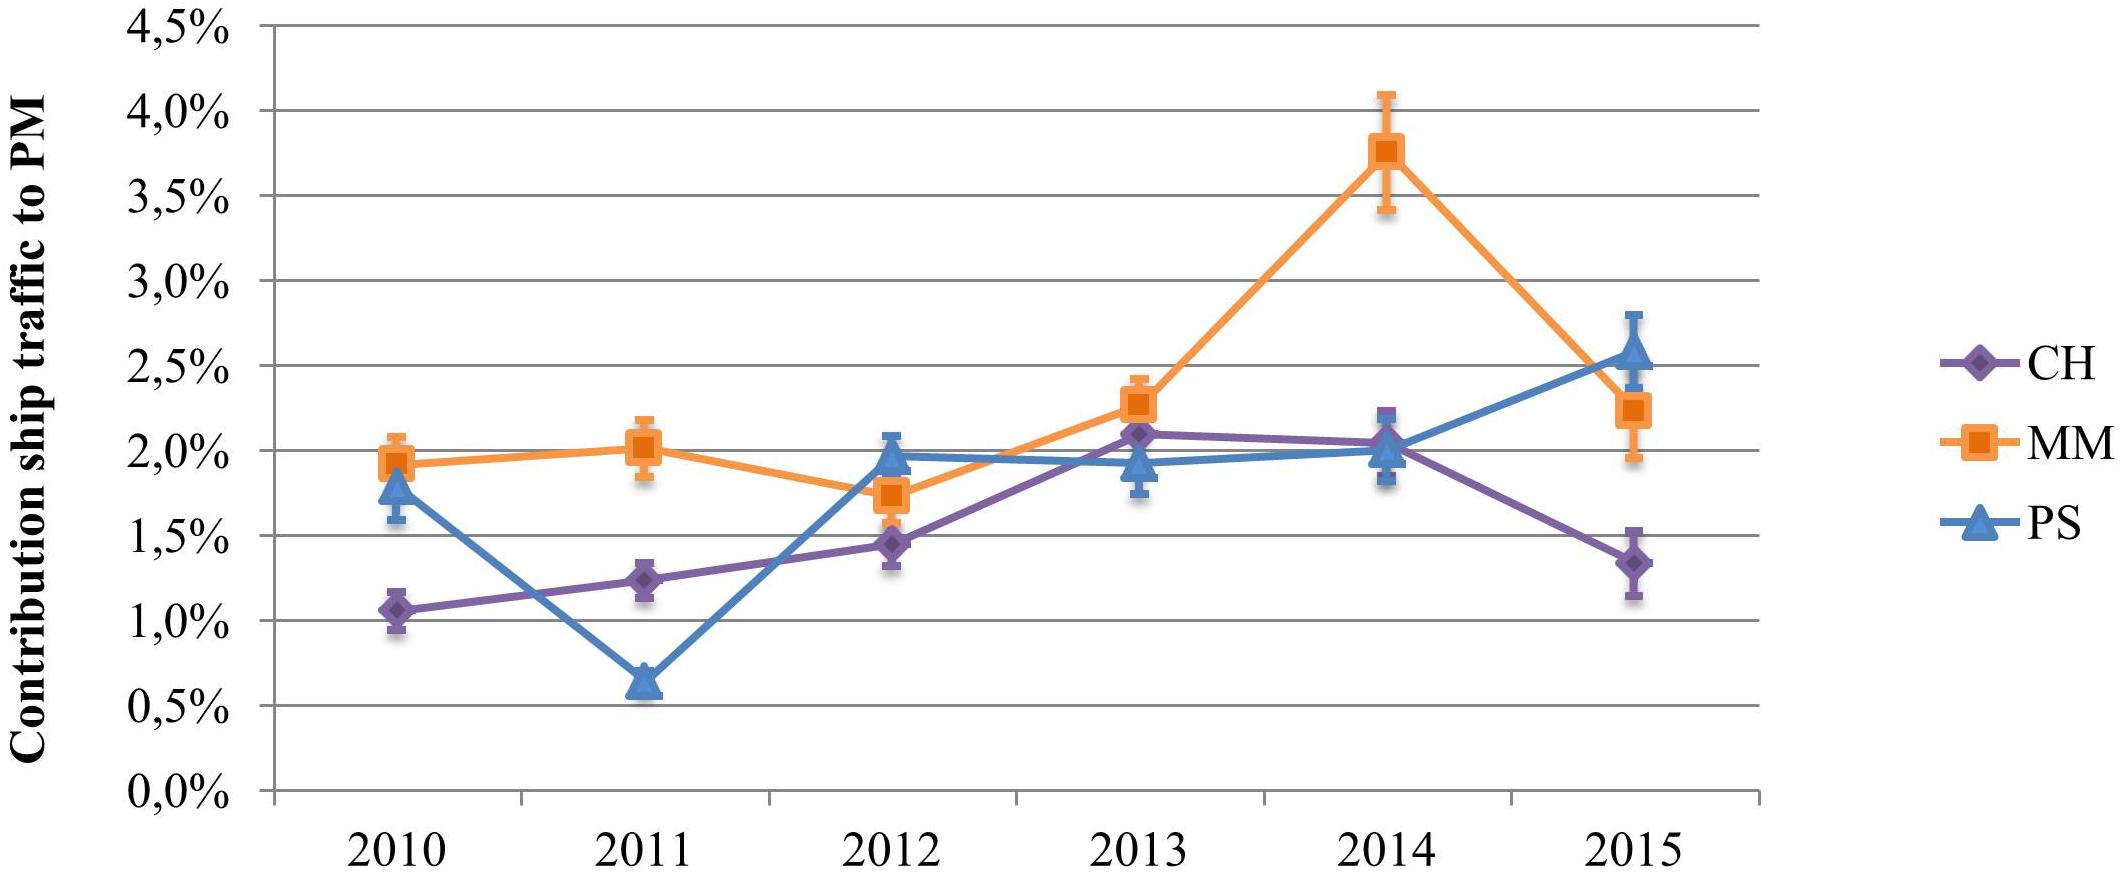
Figure 8. Annual average of the primary contribution of ship traffic to PM10, calculated using the Agrawal equation, in the three monitoring sites of Chioggia (CH), Malamocco (MM), and Punta Sabbioni (PS). The associated error is shown.
Source Apportionment of Metals by PMF
After the preliminary dataset refining, eleven variables were chosen as input for the model. In the final PMF run, the number of samples was 383, considering metals concentration measured from 2010 to 2013 in the three sites together. Since the total of metals represents a very small percentage of total particulate matter (about 1.2%) a source apportionment on PM was not possible. Thus, the PM mass was not included in the dataset and the apportionment was conducted to the sum of the metals analyzed, as previously done in Gregoris et al. (2016). The dataset dimension was in agreement with the suggestion by Henry et al. (1984), requiring that the minimum number of samples should be the one that yields a ratio between degrees of freedom and number of variables higher than 60. Since the number of chemically characterized ambient samples was higher than 50, the dataset agrees with the suggestion of Johnson et al. (2011). Moreover it also met the requirement of Thurston and Spengler (1985), with a number of samples exceeding the number of variables by a factor higher than three.
The solution was robust according to the test conducted using BS, DISP, and BS-DIPS error estimation. The comparison of reconstructed concentration by the PMF and the measured values showed that PMF reconstructed the observed concentrations of the coarse fraction with slope 0.89 and R2 0.64. The graphs of Q, IM, and IS trends, the results of the error estimation, and the graph of observed vs measured concentration are reported in the Supplementary Information (Supplementary Figures SI 8, SI 9 and Supplementary Tables S4, S5). The source profile and their contribution is shown in Figure 9.
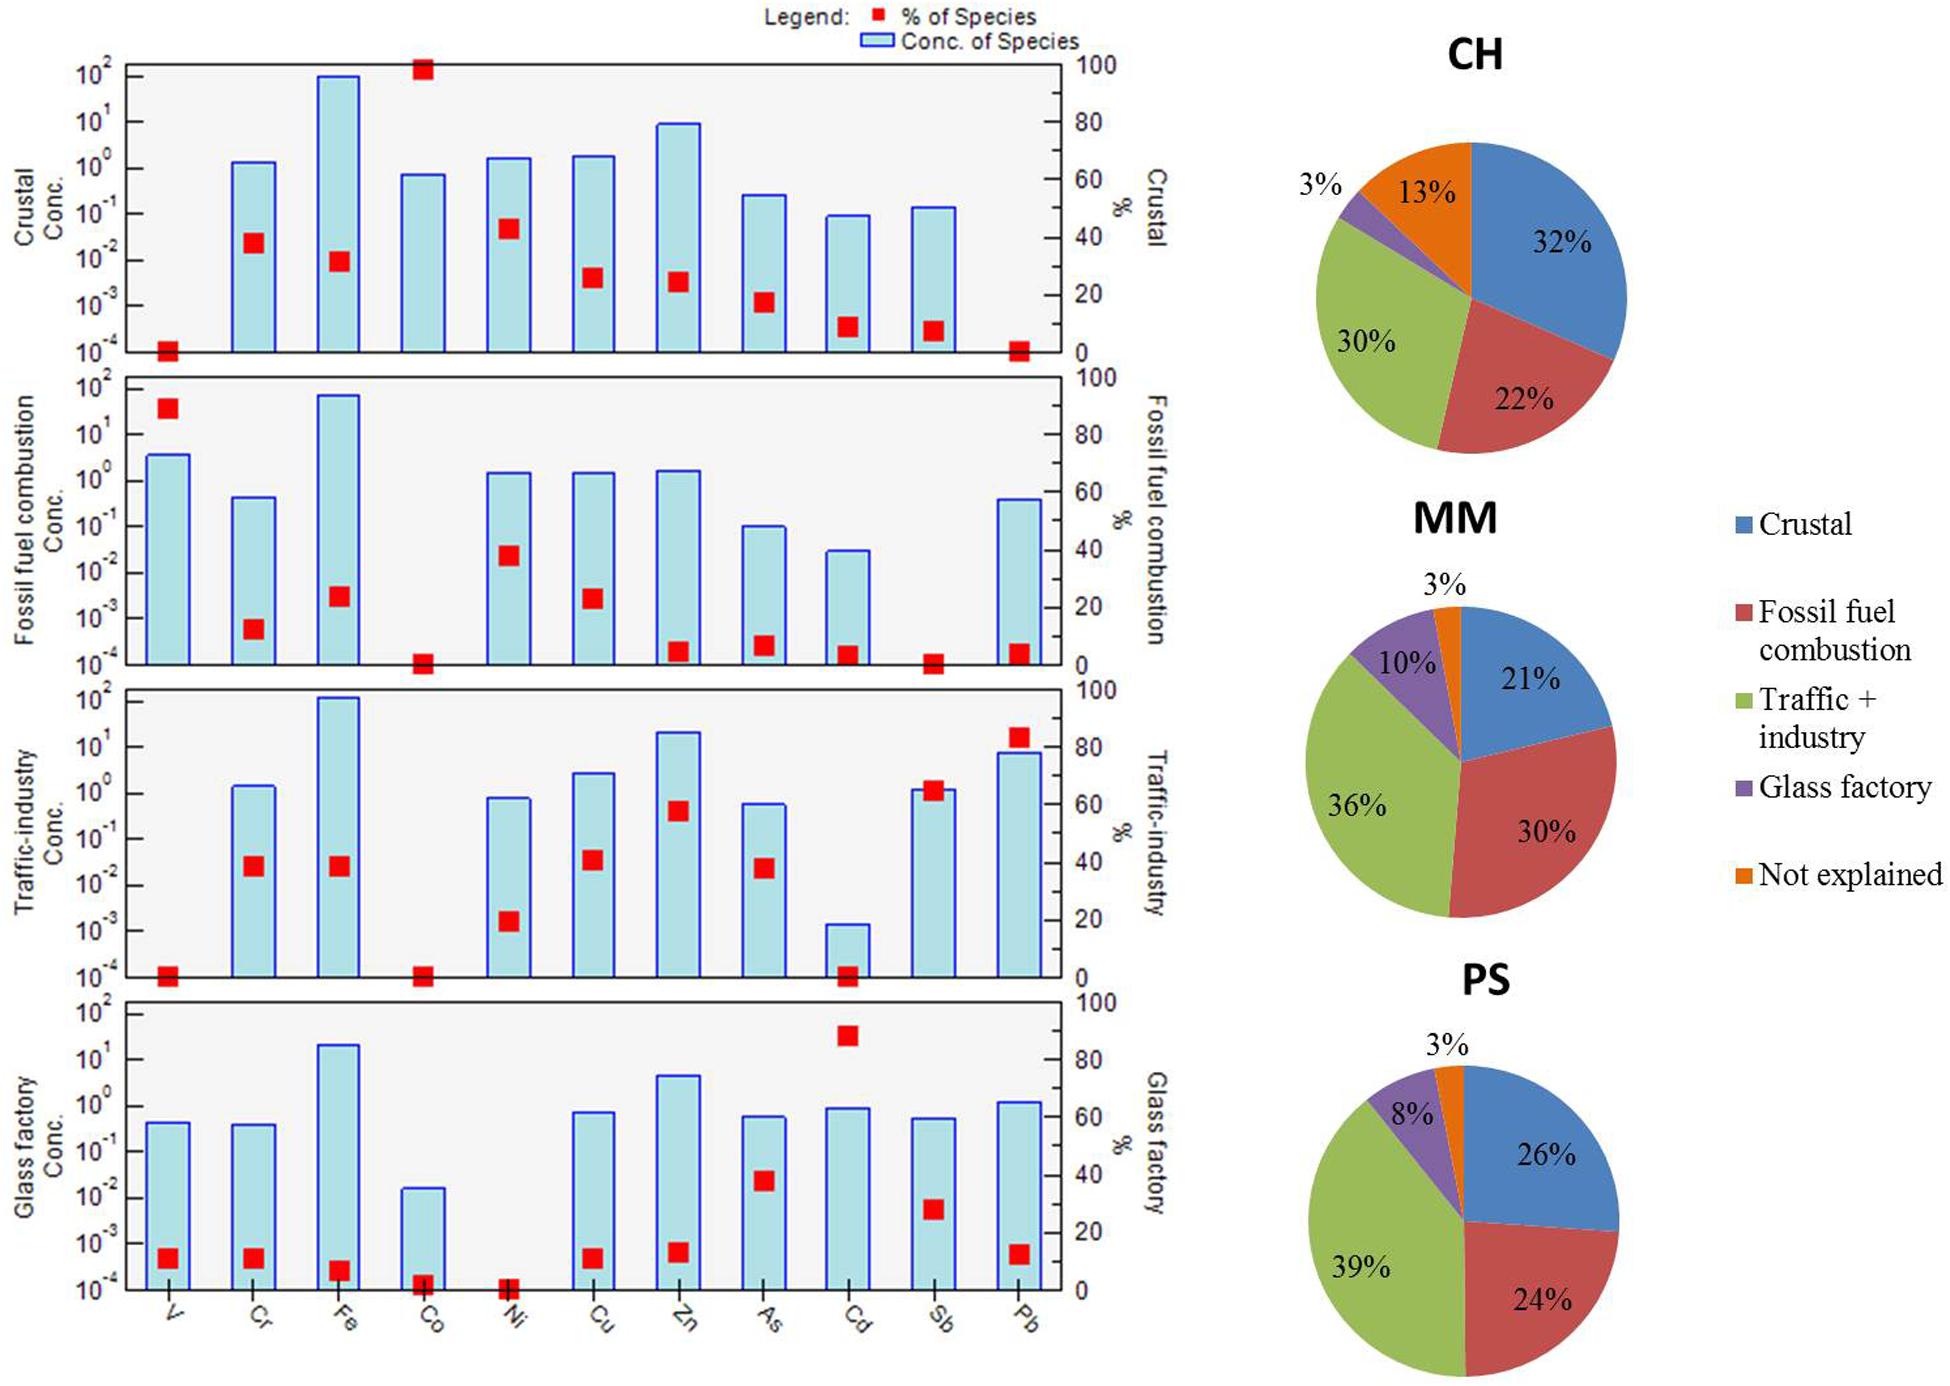
Figure 9. On the left, factor source profile identified by PMF. Concentration of species are expressed both as absolute (ng/m3, left vertical axis) and relative concentration (%, right vertical axis). On the right, contribution of the factors, including the fraction of not explained concentration, in the monitoring sites of Chioggia (CH), Malamocco (MM), and Punta Sabbioni (PS).
1. The first factor was characterized by the presence of Co, that contributes for about 98% to this source. In general, sources of environmental Co can be both natural and anthropogenic. The average EFs of Co calculated for the three sites were below or very close to 10 (see section “PM10 and its metal content”), suggesting an average crustal origin of Co for the area of Venice (Figure 3). The factor was also characterized by a lesser contribution of Ni, Cr and Fe: Fe is a typical crustal element; Ni and Cr could have both natural and anthropogenic origin in the area of Venice, confirmed by the EF ranging from 7 to 15 and from 14 to 27 for Cr and Ni, respectively, and they were both not entirely contributing to the first factor. Given that Co is naturally often associated to Ni, being present and usually extracted from nickel ores (Kim et al., 2006), the first factor was assigned to have crustal origin, despite some industrial emission contamination could be present. The contribution of the factor was higher in CH (32%) with respect to MM (21%) and PS (26%).
2. The second factor was associated to the fossil fuel combustion, because of the high contribution of V and Ni. The V/Ni ratio associated to this factor was 2.4, similar to that suggested by Viana et al. (2009) as valid tracer for ship emission in the Mediterranean harbors (2.5–3.0). For this reason, even maintaining this factor associated to fossil fuel combustion in general, an important contribution of ship traffic was expected. The higher contribution of this source was calculated for MM (30%), compatible with the relative position of the three sites, given that MM lies along the path of commercial shipping to and from Porto Marghera. The correlation between the contribution of the fossil fuel combustion factor extracted by PMF and the primary contribution of ship traffic based on atmospheric vanadium [see section “Polycyclic aromatic hydrocarbon (PAHs)”] on the same samples was significant (r = 0.69; p < 0.001).
3. Various elements contributed to the third factor. Pb, Zn, and Sb, main contributors of this factor, could be associated to vehicular traffic (Contini et al., 2012). A contribution of industrial emission is not excluded, due to the presence of Cr and As, characterizing this factor. In previous works conducted in the same monitoring site (Contini et al., 2012) a similar factor was associated to a mixed source including both traffic and industrial emission. The contribution of this factor was 39% in PS, 36% in MM and 30% in Chioggia. PS is a tourist destination and is characterized by an intense traffic.
4. Cd and As were associated to be originated by glass factory in the area of Venice in previous works (Rampazzo et al., 2008; Contini et al., 2012; Gregoris et al., 2016). The contribution of this factor is similar in MM and PS and higher with respect to CH, probably given to the proximity of MM and PS to the glass factories of the Murano island.
The identified sources are similar to those obtained in previous works in the same area (Contini et al., 2012; Gregoris et al., 2016), with the exception of the crustal source, identified for the first time in the area. Gregoris et al. (2016) conducted the source apportionment to metals in PM10 from 2007 to 2013, based on the same concentration data used in this work and collected in MM and PS, but they did not include Co, and Sb variables, for homogeneity reasons. Contini et al. (2012) investigated the sources of metals in the Venice area, based on concentration data collected from 2007 to 2010 in the three monitoring sites. They observed a lower concentration of Co, with respect of the current work, since Co concentration raised in this area only in the period 2012–2013 (Supplementary Figure SI 2). This change in the aerosol composition could explain the different sources identified in the two works. Fe concentration showed a similar trend of Co in the period 2010–2013, with an increased concentration from 2010 to 2013. The correlation between Fe and Co concentration were significant in the three sites (p < 0.001; CH r = 0.94; MM r = 0.47; and PS r = 0.39). Annual average EFs of Co were <10 in PS and MM until 2012 and in CH until 2011, reaching average values between 25 and 30 in the following years, given to the higher increase of Co concentration with respect to Fe concentration. Given the proximity of the monitoring sites to the construction works of the M.o.S.E. mobile dams and the absence of known Co sources in the area, the increase of crustal elements could be associated to the movement of soil in the area. Despite EFs suggested a mixed origin of Co in 2012 and 2013 in the area, we associated the first factor to the crustal source, with the hypothesis of the contribution of the construction works to the factor.
Source Estimation of PAHs
Generally, each PAHs source provides an individual profile fingerprint. Single congeners cannot be associated to a specific source, but DRs between specific congeners have been widely studied and used in order to estimate their possible sources (Ravindra et al., 2008; Lai et al., 2013; Gregoris et al., 2014; Gurkan Ayyildiz and Esen, 2020). In this work we used the congeners of molecular mass 178 to distinguish between combustion and petroleum sources: a ANT/(ANT + PHE) ratio < 0.10 is usually taken as an indicator of petroleum, while a ratio > 0.10 indicates a dominance of combustion sources (Yunker et al., 2002). Among the combustion of fossil fuels, the sources of gasoline and diesel can be separated using the FL/(FL + PYR) ratio, being a ratio < 0.50 representative of gasoline emissions and a ratio > 0.50 of diesel emissions (Ravindra et al., 2008). Since DRs only give an indication of the possible sources, without claiming to identify them in an absolute way, it is preferable investigate more indicators of the same sources, in order to improve the interpretation. For investigating the petrogenic/combustion sources we selected the additional ratio between the sum of FL, PYR, BaA, CHR, BbF, BkF, BaP, BghiP, and IcdP, typical PAHs from combustion (CPAHs), and the total concentration of PAHs: more the ratio approaches one, more important is the combustion source. Another indication for diesel emission is given by a BbF/BkF ratio higher than 0.5, while a ratio below 0.5 is an indication for gasoline emissions. The four chosen DRs were graphically represented in Figure 10 as follows: one graph (DR1) includes the ANT/(ANT + PHE) and FL/(FL + PYR) ratios, another graph (DR2) is composed of the BaA/(BaA + CHR), and IcdP/(IcdP + BghiP) ratios, for both sites.
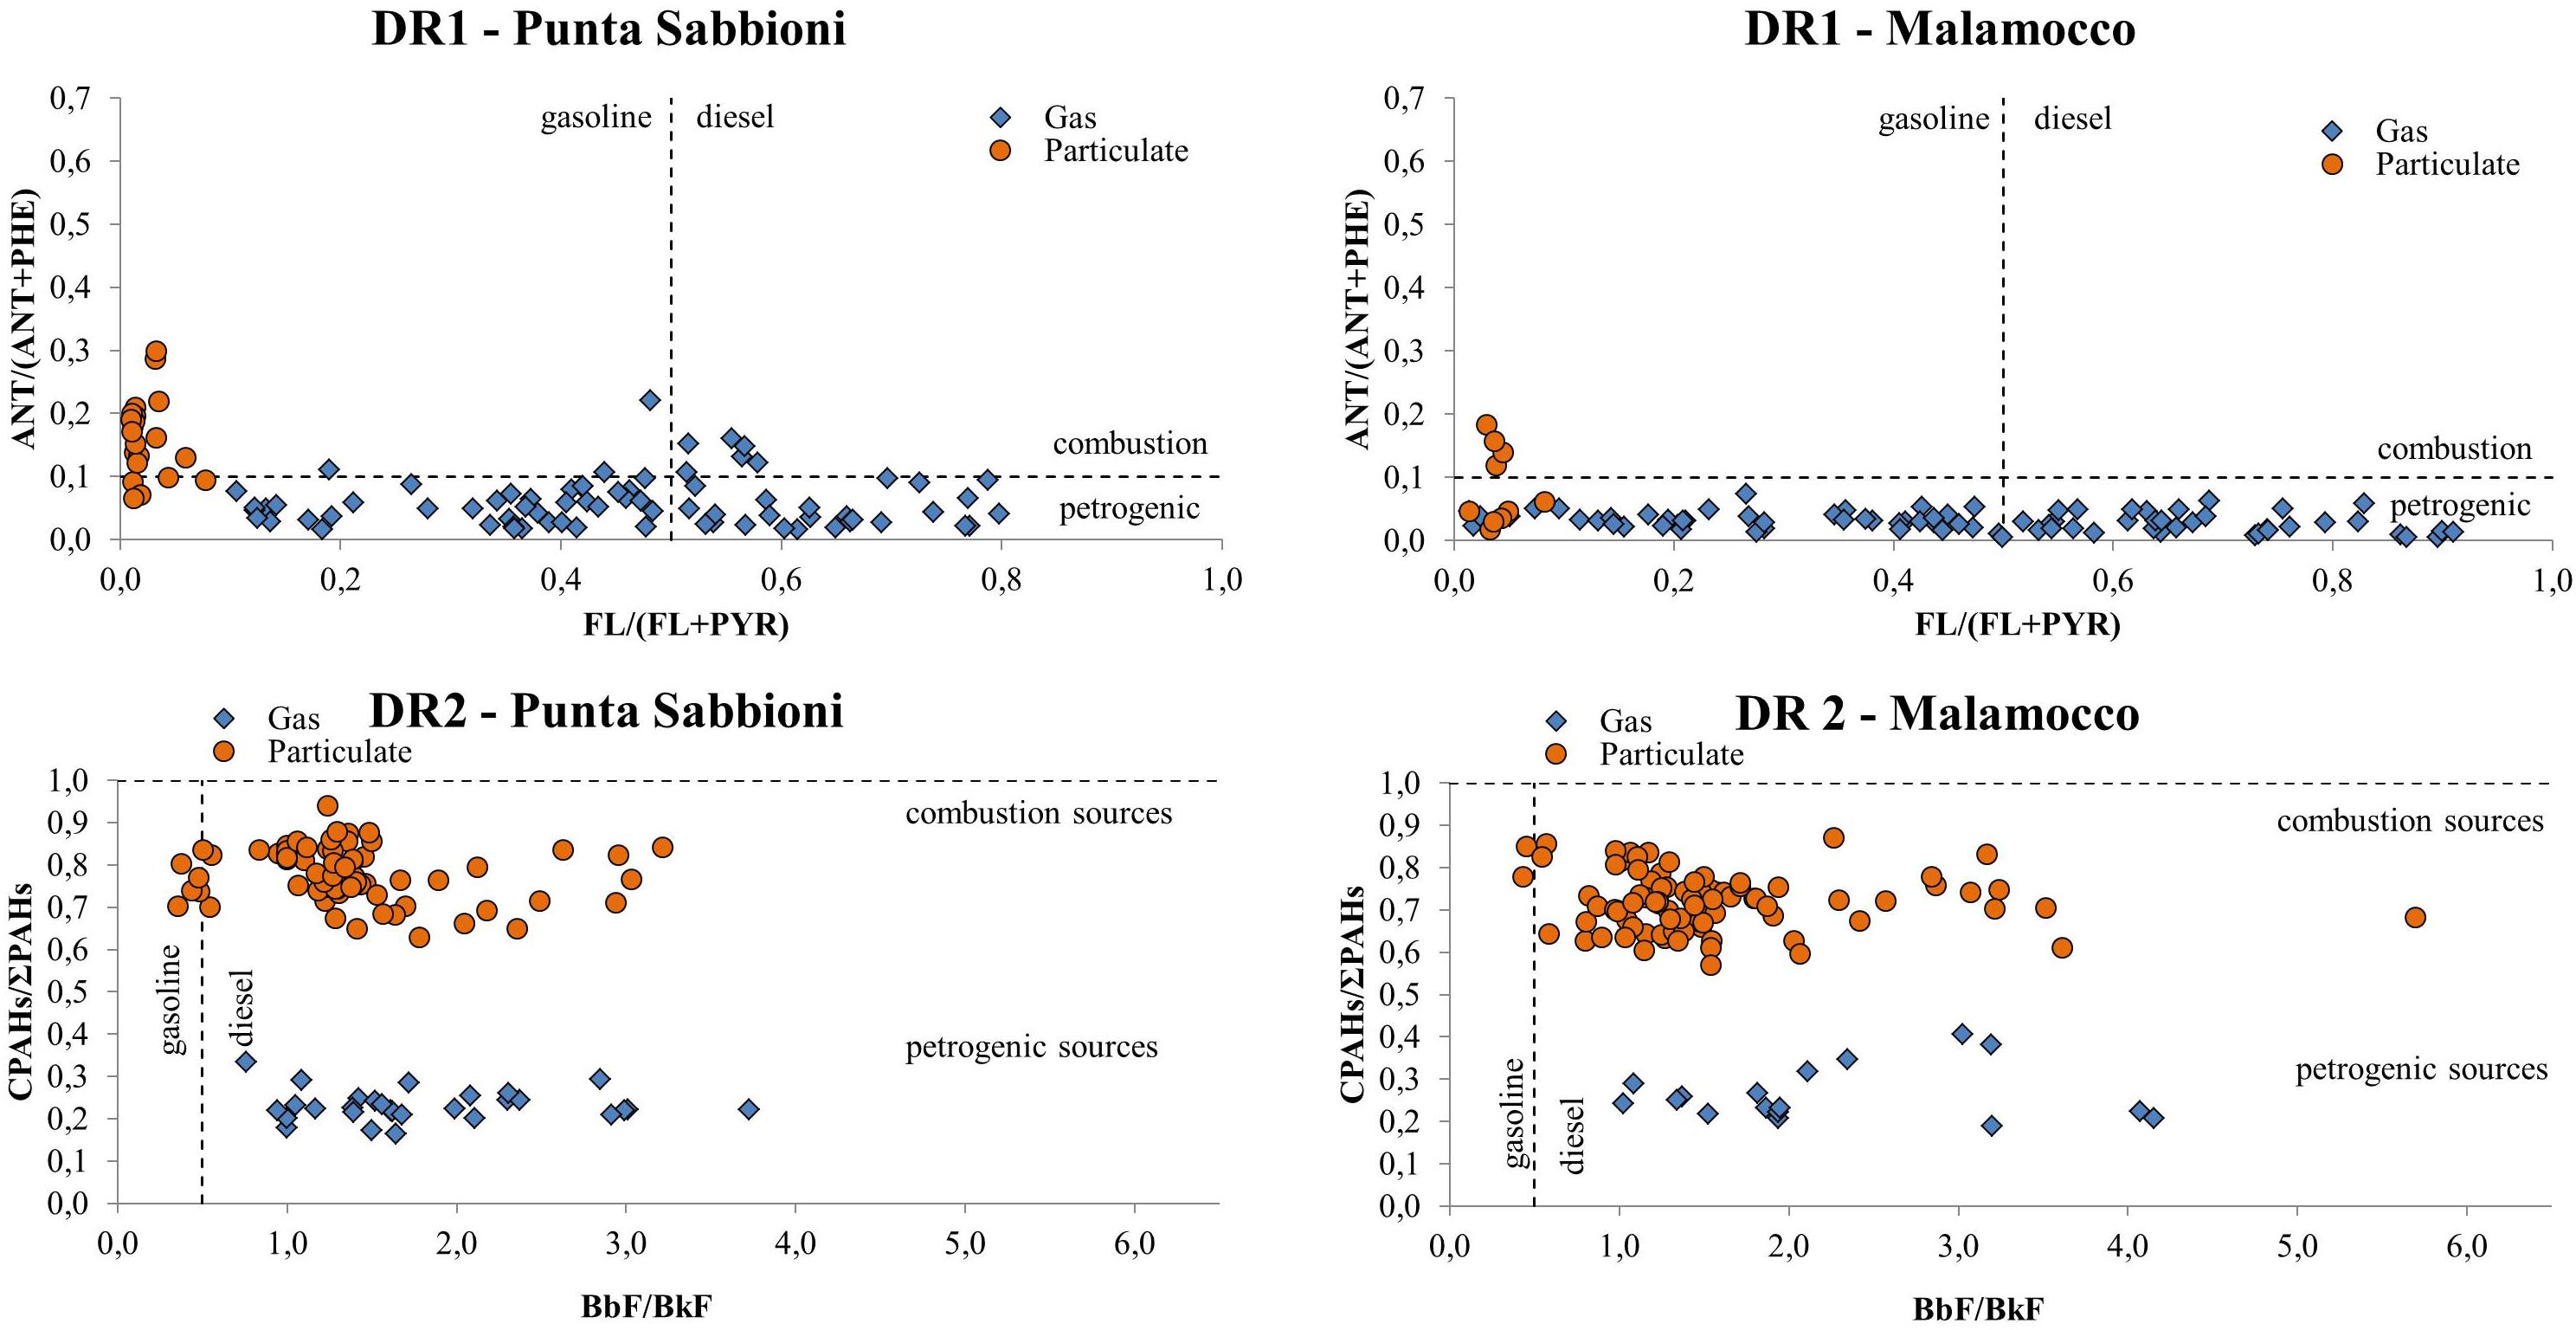
Figure 10. PAH plots of the diagnostic ratios ANT/(ANT + PHE) versus FLA/(FLA + PYR; DR1) and CPAHs/ΣPAHs versus BbF/BkF (DR2), in Punta Sabbioni and Malamocco sites.
The plots of DR1 (Figure 10) referred to the PS site shows that the calculated ANT/ANT + PHE ratio was equally distributed between values above and below 0.1, indicating both combustion and petrogenic origin of measured PAHs. In MM most of the values were below 0.1, with only 22% of values above 0.1, almost exclusively constituted of samples of particulate phase. This difference was not confirmed by DR2, that shows a comparable distribution of ratios between the two sites. The average CPAHs/ΣPAHs (±standard deviation) in particulate phase was 0.70 ± 0.08 in MM and 0.77 ± 0.08 in PS; in gaseous phase was 0.26 ± 0.09 in PS and 0.24 ± 0.04 in MM. The clear distinction between the two phases in DR2 is due to the gas/particle distribution of congeners: high molecular congeners, like PAHs generated by combustion, are mainly distributed in the particulate phase due to their lower vapor pressure, while low molecular weight congeners are the main constituents of PAHs in the gaseous phase (Figure 6). The scarcity of data for some ratios is due to concentration values below the limit of detection for one or more compounds involved in the ratio. Regarding the distinction between gasoline and diesel emissions, DR1 suggested a mixed origin of PAHs in the area, while DR2 suggested a predominance of the diesel emissions. Globally the Venice area seems to be influenced by mixed sources of PAHs, as reported in a previous work (Gregoris et al., 2014). The average ratios and the number of values above and below the threshold are reported in the Supplementary Information (Supplementary Table SI 5).
Conclusion
The comparison of the measurements taken at the different sites during the whole sampling period showed limited differences between the three sites, indicating a relatively homogeneous spatial distribution of metals in PM10 in the Venice Lagoon area. It has been confirmed by the coefficients of divergence which indicates similarity between PS and MM, and weak difference between MM and CH and between CH and PS. This general homogeneity was probably due to the presence of the specific meteorological circulation, which mixes air masses arriving from different directions, favoring the re-circulation and spread of pollutants in the lagoon area. Results of the non-parametric Mann-Kendall, carried out with integration of data from 2007 collected in the same three sites (Contini et al., 2012), showed a negative monotonic trend of the PM10 in PS and CH, for Pb, and Sb in all the three sites, and for Zn in PS. However, the study of the yearly average concentrations showed sharp increase of As in the last 2 years in all the three sites while, in the same years, the yearly average concentration of Pb has a sharp decrease. Cd yearly trend shows a “peak” during 2014 in MM, and during 2015 in CH. These behavior seem most probable to be due to a change in local sources’ emission. The PMF study and the indication emerged from COD between working days and holidays suggest that MM site is influenced more by the emission from construction activities and from ship traffic. From PMF other weak spatial differences have emerged between the sites which can be summarized up with a stronger contribution of emission from traffic and/or industry in PS from fossil fuel combustion in MM. The CH site is more characterized by crustal emission, which could be associated to the movement of soil in the construction area.
The evaluation of the crustal enrichment factors (EFs) indicated a specially important enrichment for Cd, Sb, and As, a significant enrichment for Pb, Zn, and Cu, while elements mainly of crustal origin were Co and V. Ni and Cr are slightly enriched but the values of EFs, in particular for Cr, are lower than the threshold of 20, so that it is not possible to exclude also a contribution of crustal nature. The EF of V is larger at Malamocco and this is compatible with a possible contribution of ship traffic emissions (characterized by V and Ni) at the Malamocco site, which is located near the path of commercial shipping.
As far as ΣPAHs is concerned, no monotonic trend have emerged for data collected in MM and a negative monotonic trend in PS, with 77% of confidence. During the whole period, the concentration of PAHs in gas phase was higher with respect to the TSP phase, with an average contribution of about 67–68% of the gaseous PAHs to the total concentration of PAHs. In both phases ΣPAHs concentration was higher in winter, decreasing moving toward the warm season, like in the classic seasonal trend due to the main sources of these contaminants, that are predominantly emissions from motor vehicles and domestic heating. Diagnostic Ratio for PAHs indicate both combustion and petrogenic origin, evidence that globally the Venice area may be influenced by mixed sources of PAHs, as enhanced by previous works carried out in the area.
The cumulative incremental carcinogenic risk for PM10 was 8.5 × 10⁻⁶ (about one on 118,000), 1.1 × 10⁻⁵ (about one on 92,000), and 1.2 × 10⁻⁵ (about one on 83,000) in PS, MM, and CH, respectively. Co and As are the most important contributors among metals, followed by Cd and Ni. The relative contribution varied among the monitoring sites: the contribution of Co increased passing from 34% in PS, to 40% in MM, and 53% in CH, while the contribution of As, on the opposite, was 47, 39, and 29% in PS, MM and CH, respectively.
As far as PAHs is concerned, the cumulative incremental carcinogenic risk for G + P was 8.3 × 10⁻⁷ (about one on 1,200,000) and 1.6 × 10⁻⁷ (about one on 6,200,000) for the residential exposure in PS and MM, respectively. In both cases, it was below the unconditionally acceptable risk of one on one million (1 × 10⁻⁶), corresponding to an ample margin of safety. The congeners that most contribute to the carcinogenic risk were benzo(a)pyrene and dibenzo(A,H)anthracene.
Data Availability Statement
The raw data supporting the conclusions of this article will be made available by the authors, without undue reservation.
Author Contributions
EM: sampling, metals data processing, data elaboration, and writing manuscript. EG: sampling, PAHs data processing, data elaboration, and writing manuscript. FB: coordination of sampling, review of manuscript, and of data elaboration. DCo: review of manuscript and of data elaboration. DCe: review of manuscript and of data elaboration. AG: coordination of sampling and data analysis, review of manuscript and of data elaboration. All authors contributed to the article and approved the submitted version.
Funding
This work was supported by the “Ministero delle Infrastrutture e dei Trasporti – Provveditorato Interregionale per le Opere Pubbliche del Veneto – Trentino Alto adige – Friuli Venezia Giulia” (Italian Ministry of Infrastructures and Transports) through its dealer Consorzio Venezia Nuova.
Conflict of Interest
The authors declare that the research was conducted in the absence of any commercial or financial relationships that could be construed as a potential conflict of interest.
Acknowledgments
The authors wish to thank the Venice Water Authority for permission to use the data and CORILA (Consortium for Managing the Research Activities Concerning the Venice Lagoon System) for the valuable assistance and logistic support during the sampling campaigns.
Supplementary Material
The Supplementary Material for this article can be found online at: https://www.frontiersin.org/articles/10.3389/fenvs.2020.00107/full#supplementary-material
References
Agrawal, H., Eden, R., Zhang, X., Fine, P., Katzenstein, A., Miller, J., et al. (2009). Primary particulate matter from ocean-going engines in the southern california air basin. Environ. Sci. Technol. 43, 5398–5402. doi: 10.1021/es8035016
Arden Pope, C., and Dockery, D. W. (1999). “31 - epidemiology of particle effects,” in Air Pollution and Health, eds T. H. Stephen, M. S. Jonathan, S. K. Hillel, J. M. S. H. S. K. Robert, L. MaynardA2 - Stephen, T. Holgate, et al. (London: Academic Press), 673–705. doi: 10.1016/b978-012352335-8/50106-x
ATSDR (2002). Toxicological Profile for Polycyclic Aromatic Hydrocarbons (PAHS). Atlanta, GA: ATSDR.
Bool, L., Senior, C., Huggins, F., Huffman, G., and Shah, N. (1996). Toxic Substances from Coal Combustion - A Comprehensive Assessment. Reston, VA: USGS Science for changing world, 64.
Capodaglio, G., Toscano, G., Scarponi, G., and Cescon, P. (1994). Copper complexation in the surface sea water of terra nova bay (ANTARCTICA). Int. J. Environ. Anal. Chem. 55, 129–148. doi: 10.1080/03067319408026213
Cesari, D., Genga, A., Ielpo, P., Siciliano, M., Mascolo, G., Grasso, F. M., et al. (2014). Source apportionment of PM2.5 in the harbour–industrial area of Brindisi (Italy): identification and estimation of the contribution of in-port ship emissions. Sci. Total Environ. 497–498, 392–400. doi: 10.1016/J.SCITOTENV.2014.08.007
Contini, D., Belosi, F., Gambaro, A., Cesari, D., Stortini, A. M., and Bove, M. C. (2012). Comparison of PM10 concentrations and metal content in three different sites of the Venice Lagoon: an analysis of possible aerosol sources. J. Environ. Sci. 24, 1954–1965. doi: 10.1016/s1001-0742(11)61027-9
Contini, D., Gambaro, A., Belosi, F., De Pieri, S., Cairns, W. R. L., Donateo, A., et al. (2011). The direct influence of ship traffic on atmospheric PM 2.5, PM 10 and PAH in Venice. J. Environ. Manag. 92, 2119–2129. doi: 10.1016/j.jenvman.2011.01.016
Degrendele, C., Fiedler, H., Koèan, A., Kukuèka, P., Pøibylová, P., Prokeš, R., et al. (2020). Multiyear levels of PCDD/Fs, dl-PCBs and PAHs in background air in central Europe and implications for deposition. Chemosphere 240:124852. doi: 10.1016/J.CHEMOSPHERE.2019.124852
Galindo, N., Yubero, E., Clemente, Á, Nicolás, J. F., Varea, M., and Crespo, J. (2020). PM events and changes in the chemical composition of urban aerosols: a case study in the western Mediterranean. Chemosphere 244:125520. doi: 10.1016/j.chemosphere.2019.125520
Gambaro, A., Radaelli, M., Piazza, R., Stortini, A. M., Contini, D., Belosi, F., et al. (2009). Organic micropollutants in wet and dry depositions in the Venice Lagoon. Chemosphere 76, 1017–1022. doi: 10.1016/J.CHEMOSPHERE.2009.04.063
Gregoris, E., Argiriadis, E., Vecchiato, M., Zambon, S., De Pieri, S., Donateo, A., et al. (2014). Gas-particle distributions, sources and health effects of polycyclic aromatic hydrocarbons (PAHs), polychlorinated biphenyls (PCBs) and polychlorinated naphthalenes (PCNs) in Venice aerosols. Sci. Total Environ. 476–477, 393–405. doi: 10.1016/J.SCITOTENV.2014.01.036
Gregoris, E., Barbaro, E., Morabito, E., Toscano, G., Donateo, A., Cesari, D., et al. (2016). Impact of maritime traffic on polycyclic aromatic hydrocarbons, metals and particulate matter in Venice air. Environ. Sci. Pollut. Res. 23, 951–959. doi: 10.1007/s11356-015-5811-x
Gurkan Ayyildiz, E., and Esen, F. (2020). Atmospheric polycyclic aromatic hydrocarbons (PAHs) at two sites, in bursa, turkey: determination of concentrations, gas–particle partitioning, sources, and health risk. Arch. Environ. Contam. Toxicol. 78, 350–366. doi: 10.1007/s00244-019-00698-7
Han, S., Youn, J.-S., and Jung, Y.-W. (2011). Characterization of PM10 and PM2.5 source profiles for resuspended road dust collected using mobile sampling methodology. Atmos. Environ. 45, 3343–3351. doi: 10.1016/J.ATMOSENV.2011.04.015
Hassan, S. K., and Khoder, M. I. (2012). Gas–particle concentration, distribution, and health risk assessment of polycyclic aromatic hydrocarbons at a traffic area of Giza, Egypt. Environ. Monit. Assess. 184, 3593–3612. doi: 10.1007/s10661-011-2210-8
Hayakawa, K., Tang, N., Nagato, E., Toriba, A., Lin, J.-M., Zhao, L., et al. (2020). Long-term trends in urban atmospheric polycyclic aromatic hydrocarbons and nitropolycyclic aromatic Hydrocarbons: China, Russia, and Korea from 1999 to 2014. Int. J. Environ. Res. Public Health 17:431. doi: 10.3390/ijerph17020431
Henry, R. C., Lewis, C. W., Hopke, P. K., and Williamson, H. J. (1984). Review of receptor model fundamentals. Atmos. Environ. 18, 1507–1515. doi: 10.1016/0004-6981(84)90375-5
ISPRA (2017). Guidelines for the Assessment of Ascending and Reversing Trends of Pollutants in Groundwater (Ministerial Decree, 6 July 2016) [Original title (Italian): Linee Guida Per la Valutazione Delle Tendenze Ascendenti e D’inversione Degli Inquinanti Nelle Acque. Available online at: http://www.isprambiente.gov.it/it/pubblicazioni/manuali-e-linee-guida/linee-guida-per-la-valutazione-delle-tendenze-ascendenti-e-dinversione-degli-inquinanti-nelle-acque-sotterranee-dm-6-luglio-2016 (accessed July 9, 2020).
Johnson, T., Guttikunda, S., Wells, G. J., Artaxo, P., Bond, T. C., Russell, A. G., et al. (2011). Tools for Improving Air Quality Management: A Review of Top-Down Source Apportionment Techniques and Their Application in Developing Countries. Report No 339/11. Washington, DE: ESMAP.
Kim, J. H., Gibb, H. J., Howe, P. D., World Health Organization. Chemical Safety Team, and International Programme on Chemical Safety (2006). Cobalt and inorganic cobalt compounds / prepared by James H. Kim, Herman J. Gibb, Paul D. Howe. Available online at: https://apps.who.int/iris/handle/10665/43426 (accessed July 9, 2020).
Kumar, A., Sankar, T. K., Sethi, S. S., and Ambade, B. (2020). Characteristics, toxicity, source identification and seasonal variation of atmospheric polycyclic aromatic hydrocarbons over East India. Environ. Sci. Pollut. Res. 27, 678–690. doi: 10.1007/s11356-019-06882-5
Lai, I. C., Chang, Y. C., Lee, C. L., Chiou, G. Y., and Huang, H. C. (2013). Source identification and characterization of atmospheric polycyclic aromatic hydrocarbons along the southwestern coastal area of Taiwan - with a GMDH approach. J. Environ. Manag. 115, 60–68. doi: 10.1016/j.jenvman.2012.11.018
Liu, B., Xue, Z., Zhu, X., and Jia, C. (2017). Long-term trends (1990–2014), health risks, and sources of atmospheric polycyclic aromatic hydrocarbons (PAHs) in the U.S. Environ. Pollut. 220, 1171–1179. doi: 10.1016/J.ENVPOL.2016.11.018
Liu, H., Tian, H., Zhang, K., Liu, S., Cheng, K., Yin, S., et al. (2019). Seasonal variation, formation mechanisms and potential sources of PM2.5 in two typical cities in the Central Plains Urban Agglomeration, China. Sci. Total Environ. 657, 657–670. doi: 10.1016/j.scitotenv.2018.12.068
Masiol, M., Rampazzo, G., Ceccato, D., Squizzato, S., and Pavoni, B. (2010). Characterization of PM10 sources in a coastal area near Venice (Italy): An application of factor-cluster analysis. Chemosphere 80, 771–778. doi: 10.1016/J.CHEMOSPHERE.2010.05.008
Masiol, M., Squizzato, S., Ceccato, D., and Pavoni, B. (2015). The size distribution of chemical elements of atmospheric aerosol at a semi-rural coastal site in Venice (Italy). The role of atmospheric circulation. Chemosphere 119, 400–406. doi: 10.1016/J.CHEMOSPHERE.2014.06.086
Masiol, M., Squizzato, S., Ceccato, D., Rampazzo, G., and Pavoni, B. (2012a). A chemometric approach to determine local and regional sources of PM10 and its geochemical composition in a coastal area. Atmos. Environ. 54, 127–133. doi: 10.1016/J.ATMOSENV.2012.02.089
Masiol, M., Squizzato, S., Ceccato, D., Rampazzo, G., and Pavoni, B. (2012b). Determining the influence of different atmospheric circulation patterns on PM10 chemical composition in a source apportionment study. Atmos. Environ. 63, 117–124. doi: 10.1016/J.ATMOSENV.2012.09.025
Mastral, A. M., and Callén, M. S. (2000). A Review on Polycyclic Aromatic Hydrocarbon (PAH) Emissions from Energy Generation. Environ. Sci. Technol. 34, 3051–3057. doi: 10.1021/es001028d
Morabito, E., Contini, D., Belosi, F., Stortini, A. M., Manodori, L., and Gambaro, A. (2014). Atmospheric deposition of inorganic elements and organic compounds at the inlets of the Venice lagoon. Adv. Meteorol. 2014, 1–10. doi: 10.1155/2014/158902
Prodi, F., Belosi, F., Contini, D., Santachiara, G., Di Matteo, L., Gambaro, A., et al. (2009). Aerosol fine fraction in the Venice Lagoon: particle composition and sources. Atmos. Res. 92, 141–150. doi: 10.1016/J.ATMOSRES.2008.09.020
Raaschou-Nielsen, O., Andersen, Z. J., Beelen, R., Samoli, E., Stafoggia, M., Weinmayr, G., et al. (2013). Air pollution and lung cancer incidence in 17 European cohorts: prospective analyses from the European Study of cohorts for air pollution effects (ESCAPE). Lancet Oncol. 14, 813–822. doi: 10.1016/S1470-2045(13)70279-1
Ramírez, O., Sánchez de la Campa, A. M., Amato, F., Moreno, T., Silva, L. F., and de la Rosa, J. D. (2019). Physicochemical characterization and sources of the thoracic fraction of road dust in a Latin American megacity. Sci. Total Environ. 652, 434–446. doi: 10.1016/j.scitotenv.2018.10.214
Rampazzo, G., Masiol, M., Visin, F., Rampado, E., and Pavoni, B. (2008). Geochemical characterization of PM10 emitted by glass factories in Murano. Venice (Italy). Chemosphere 71, 2068–2075. doi: 10.1016/J.CHEMOSPHERE.2008.01.039
Ravindra, K., Sokhi, R., and Van Grieken, R. (2008). Atmospheric polycyclic aromatic hydrocarbons: source attribution, emission factors and regulation. Atmos. Environ. 42, 2895–2921. doi: 10.1016/J.ATMOSENV.2007.12.010
Riva, G., Pedretti, E. F., Toscano, G., Duca, D., and Pizzi, A. (2011). Determination of polycyclic aromatic hydrocarbons in domestic pellet stove emissions. Biomass Bioenergy 35, 4261–4267. doi: 10.1016/J.BIOMBIOE.2011.07.014
Squizzato, S., and Masiol, M. (2015). Application of meteorology-based methods to determine local and external contributions to particulate matter pollution: a case study in Venice (Italy). Atmos. Environ. 119, 69–81. doi: 10.1016/j.atmosenv.2015.08.026
Squizzato, S., Masiol, M., Agostini, C., Visin, F., Formenton, G., Harrison, R. M., et al. (2016). Factors, origin and sources affecting PM1 concentrations and composition at an urban background site. Atmos. Res. 180, 262–273. doi: 10.1016/j.atmosres.2016.06.002
Stortini, A. M., Freda, A., Cesari, D., Cairns, W. R. L., Contini, D., Barbante, C., et al. (2009). An evaluation of the PM2.5 trace elemental composition in the Venice Lagoon area and an analysis of the possible sources. Atmos. Environ. 43, 6296–6304. doi: 10.1016/j.atmosenv.2009.09.033
Thurston, G. D., and Spengler, J. D. (1985). A quantitative assessment of source contributions to inhalable particulate matter pollution in metropolitan Boston. Atmos. Environ. 19, 9–25. doi: 10.1016/0004-6981(85)90132-5
Tomaz, S., Shahpoury, P., Jaffrezo, J.-L., Lammel, G., Perraudin, E., Villenave, E., et al. (2016). One-year study of polycyclic aromatic compounds at an urban site in Grenoble (France): seasonal variations, gas/particle partitioning and cancer risk estimation. Sci. Total Environ. 565, 1071–1083. doi: 10.1016/j.scitotenv.2016.05.137
Tositti, L., Brattich, E., Masiol, M., Baldacci, D., Ceccato, D., Parmeggiani, S., et al. (2014). Source apportionment of particulate matter in a large city of southeastern Po Valley (Bologna, Italy). Environ. Sci. Pollut. Res. Int. 21, 872–890. doi: 10.1007/s11356-013-1911-7
US-EPA (2014). EPA Positive Matrix Factorization (PMF) 5.0 Fundamentals and User Guide. Washington, DC: US-EPA.
United States Environmental Protection Agency (1981). Priority Pollutant List. Regulation No.: 40 CFR 423, Appendix A. Washington, DC: US. EPA.
United States Environmental Protection Agency (1998). Report on revisions to AP-42 Section 1.3 Fuel Oil Combustion. Citeseer, 5th Edn. Washington, DC: US. EPA.
United States Environmental Protection Agency (2009). Risk Assessment Guidance for Superfund Volume I: Human Health Evaluation Manual (Part F, Supplemental Guidance for Inhalation Risk Assessment). Washington, DC: US. EPA.
United States Environmental Protection Agency (2016). Regional Screening Levels (RSLs)–Generic Tables. Washington, DC: US. EPA.
Valotto, G., Squizzato, S., Masiol, M., Zannoni, D., Visin, F., and Rampazzo, G. (2014). Elemental characterization, sources and wind dependence of PM1 near Venice. Italy. Atmos. Res. 143, 371–379. doi: 10.1016/j.atmosres.2014.03.007
Viana, M., Amato, F., Alastuey, A., Querol, X., Moreno, T., Garcia Dos Santos-Alves, S., et al. (2009). Chemical tracers of particulate emissions from commercial shipping. Environ. Sci. Technol. 43, 7472–7477. doi: 10.1021/es901558t
Viana, M., Hammingh, P., Colette, A., Querol, X., Degraeuwe, B., de Vlieger, I., et al. (2014). Impact of maritime transport emissions on coastal air quality in Europe. Atmos. Environ. 90, 96–105. doi: 10.1016/J.ATMOSENV.2014.03.046
Wedepohl, H. K. (1995). The composition of the continental crust. Geochim. Cosmochim. Acta 59, 1217–1232. doi: 10.1016/0016-7037(95)00038-2
Wild, S. R., and Jones, K. C. (1995). Polynuclear aromatic hydrocarbons in the United Kingdom environment: a preliminary source inventory and budget. Environ. Pollut. 88, 91–108. doi: 10.1016/0269-7491(95)91052-M
Wongphatarakul, V., Friedlander, S. K., and Pinto, J. P. (1998). A comparative study of PM2.5 ambient aerosol chemical databases. Environ. Sci. Technol. 32, 3926–3934. doi: 10.1021/es9800582
Yunker, M. B., Macdonald, R. W., Vingarzan, R., Mitchell, R. H., Goyette, D., and Sylvestre, S. (2002). PAHs in the Fraser River basin: a critical appraisal of PAH ratios as indicators of PAH source and composition. Org. Geochem. 33, 489–515. doi: 10.1016/S0146-6380(02)00002-5
Zhao, M., Zhang, Y., Ma, W., Fu, Q., Yang, X., Li, C., et al. (2013). Characteristics and ship traffic source identification of air pollutants in China’s largest port. Atmos. Environ. 64, 277–286. doi: 10.1016/J.ATMOSENV.2012.10.007
Keywords: metals, PM10, aerosol, PAHs, Venice Lagoon
Citation: Morabito E, Gregoris E, Belosi F, Contini D, Cesari D and Gambaro A (2020) Multi-Year Concentrations, Health Risk, and Source Identification, of Air Toxics in the Venice Lagoon. Front. Environ. Sci. 8:107. doi: 10.3389/fenvs.2020.00107
Received: 04 May 2020; Accepted: 23 June 2020;
Published: 17 July 2020.
Edited by:
Dragana S. Ðorđević, University of Belgrade, SerbiaReviewed by:
Michael Edward Deary, Northumbria University, United KingdomJoanna Wragg, British Geological Survey (BGS), United Kingdom
Copyright © 2020 Morabito, Gregoris, Belosi, Contini, Cesari and Gambaro. This is an open-access article distributed under the terms of the Creative Commons Attribution License (CC BY). The use, distribution or reproduction in other forums is permitted, provided the original author(s) and the copyright owner(s) are credited and that the original publication in this journal is cited, in accordance with accepted academic practice. No use, distribution or reproduction is permitted which does not comply with these terms.
*Correspondence: Elisa Morabito, elisamora@unive.it