Improving Productivity in Integrated Fish-Vegetable Farming Systems with Recycled Fish Pond Sediments
by
 , , and
Chau Thi Da
1,2 ,
,
Phan Anh Tu
3,
John Livsey
4,*,
Van Tai Tang
2,
Håkan Berg
4 and
Stefano Manzoni
4 1
Environmental Engineering and Management Research Group, Ton Duc Thang University, 19 Nguyen Huu Tho Street, Tan Phong Ward, District 7, Ho Chi Minh 72915, Vietnam
2
Faculty of Environment and Labor Safety, Ton Duc Thang University, Ho Chi Minh 72915, Vietnam
3
Department of Crop Sciences, Loc Troi Groups of Vietnam, 23 Ha Hoang Ho Street, My Xuyen Ward, Long Xuyen 90108, Vietnam
4
Department of Physical Geography and Bolin Center for Climate Research, Stockholm University, 10691 Stockholm, Sweden
*
Author to whom correspondence should be addressed.
Agronomy 2020, 10(7), 1025; https://doi.org/10.3390/agronomy10071025
Submission received: 27 May 2020
/
Revised: 26 June 2020
/
Accepted: 14 July 2020
/
Published: 16 July 2020
(This article belongs to the Special Issue Smart Fertilizers and Innovative Organic Amendments for Sustainable Agricultural Systems)
Abstract
:The increasing intensification of aquaculture systems requires the development of strategies to reduce their environmental impacts such as pollution caused by the discharge of nutrient rich sediments into local water bodies. Recycling of fish pond sediments (FPS) as fertilizer has been proposed as a possible solution that may also reduce the reliance on synthetic fertilizers. With a case study in the Mekong Delta, Vietnam, we determined suitable mixtures of striped catfish (Pangasianodon hypophthalmus) pond sediment (PPS) and locally sourced organic amendments of rice straw (RS), or common water hyacinth (WH) to fertilize cucumber plants (Cucumis sativus L.) in an integrated cucumber–giant gourami fish (Osphronemus goramy) farming system. Highest nutrient concentrations were found when mixing 30% PPS with 70% RS or WH. When used in combination with chemical fertilizer, it was found that a 25% to 75% reduction in chemical fertilizer application could be achieved, while also increasing cucumber yields, with the highest yields found when RS was used in organic amendments. In combination with the additional income from fish production, integrated farming systems such as that demonstrated in this study, may increase both farm income and production diversity.
1. Introduction
Inland aquaculture is one of the fastest growing animal production sectors in the world, and provides a promising way to improve livelihoods and provide export revenues in Asian countries [1]. Production is predicted to continue increasing, by optimizing resource use and intensifying existing aquaculture practices [2,3]. In Vietnam, more than half of inland aquaculture fish are striped (also referred to as Pangasius) catfish (Pangasianodon hypophthalmus), which are produced in freshwater earthen ponds and are exported to over 130 countries [3,4]. The total area of ponds used for striped catfish aquaculture has increased approximately 8-fold over the last 20-year period, while total production has increased 64-fold, indicating a rapid and dramatic intensification. This is particularly evident in the Mekong Delta, where striped catfish account for almost 70% of total fish production [5,6,7]. As an important commodity, this equates to an export value of US $2.26 billion for Vietnam [4].
Whilst this development of industrial aquaculture generates large profit and income, it also creates risks stemming from negative environmental impacts [8,9]. These impacts include landscape modification and biodiversity loss [10,11], and eutrophication [12,13] caused by the discharge of nutrient rich sediments into local water bodies. Sediments and sludge from intensive aquaculture ponds are enriched with organic matter (OM), nitrogen (N), phosphorus (P), and macro and micronutrients that have accumulated in pond sediments [13,14,15,16,17]. The bulk of the dissolved and suspended inorganic and organic matter contained within the aquaculture pond effluents are derived from feed inputs, either directly in the form of the end-products of feed digestion and metabolism or from uneaten/wasted feed, or indirectly through eutrophication in the ponds. Oláh et al. [14] and Boyd [18] also reported that 30%–95% of the N and a high fraction of P compounds applied to fishponds accumulated in pond sediments.
Effluent and sediments from the bed of striped catfish ponds in the Mekong Delta are removed and disposed of approximately every two months during the fish farming cycle. As fish pond sediments (FPS) and sludge are enriched with OM and nutrients, they potentially represent a continuously available fertilizer supplement and soil conditioner, which could enhance the soil environment for crop production [2,13,19]. Nowadays, there are many research examples of integrated aquaculture‒agriculture farming systems that are economically and environmentally sustainable as well as practically applicable in a local context [17,20,21,22]. However, previous studies in Vietnam, Thailand, Bangladesh, and China have focused on reusing wastewater from striped catfish pond farming or fish pond sediments for rice, vegetable (green bean), fodder grass production, or Triticeae crops [12,13,17,23,24,25], whilst the recycling of sediments has mostly been neglected.
In recent years, the use of inorganic fertilizer in Vietnam has risen steadily and the country faces a large fertilizer deficit [26]. Using the nutrient rich sediments from Pangasius catfish ponds in crop production could reduce the reliance on inorganic fertilizer, and potentially decrease production costs while also reducing the negative impacts on aquaculture on the environment [13].
A lack of cost-effective technologies and inappropriate disposal for organic waste has caused environmental pollution from FPS [15,16,27,28,29]. Similarly, rice straw as a by-product of rice production is abundant in the Mekong Delta, but is not considered suitable for animal feed due to its low digestibility, low protein, high lignin, and high silica concentration [28,30]. Composting is an effective approach to reuse FPS and agricultural residues, thereby converting them into a relatively valuable agronomic resource for use as organic fertilizers [28,31,32]. Composting of FPS mixed with locally sourced organic residues can offer both a solution to mitigate pollution in the region and an opportunity to improve agricultural soils. To explore this potential, we combined—in different proportions—sediments from striped catfish ponds and agricultural residues such as rice straw and water hyacinth (Eichhornia crassipes), and assessed how these amendments affected cucumber (Cucumis sativus L.) vegetable growth and yield. Furthermore, we conducted the experiment in an integrated cucumber–fish production system, aiming to optimize the mutual benefits of growing fish and vegetables in such a system (Figure 1). Similar integrated fish–crop production systems have been shown to have both economic and environmental benefits greater than mono-production systems [17]. The hypothesis tested in the present study is that nutrients contained in organic fertilizers produced from Pangasius catfish pond sediment (PPS) and locally sourced organic amendments can replace the inorganic fertilizers for cucumber vegetable production.
2. Materials and Methods
Two linked experiments were conducted. One experiment focused on organic fertilizer production. This experiment was carried out in the laboratory of An Giang University, An Giang Province, Vietnam. The second experiment focused on cucumber growth performance with different organic and chemical fertilizer combinations, using compost from the first experiment as an organic amendment. The second experiment was implemented both in the September–December 2016 wet season, and the February–June 2017 dry season. The timeline and the work flow of experiments one and two are shown in Figure 2 and described in detail in the following sections.
2.1. Site Description
The cucumber experimental plots were established in the Truong Long A commune, Chau Thanh District, Hau Giang Province, Vietnam. This site is characterized by a marked seasonality in precipitation and an average annual temperature of 27 °C. The rainy season is from May to November, accounting for 92%–97% of the annual rainfall. Annual precipitation is between 1800 and 2500 mm. The wet season during 2016 was characterized by temperatures in the range of 26.7–33.2 °C and 2304 mm of rainfall; the dry season of 2017 was slightly warmer (30.2–37.3 °C), and much drier, with 54.3 mm of rainfall [6].
2.2. Experiment One: Organic Fertilizer Production
Experiment one was designed to determine a suitable mixture of Pangasius catfish (Pangasianodon hypophthalmus) pond sediment (PPS) and locally sourced organic amendments, from rice straw (RS) (Oryza sativa L.) or common water hyacinth (WH) (Eichhornia crassipes), to produce organic fertilizers for cucumber cultivation.
2.2.1. Collection of Rice Straw and Water Hyacinth Residues for Fertilizer Amendments
The RS and WH were collected to create organic amendments. Both RS and WH are common in the Mekong Delta, making them suitable for the production of organic amendments. RS was collected from rice farms during the harvest period and WH was collected from streams in Thoai Son, An Giang Province. Leaves and stems of water hyacinth were cleaned with freshwater and sun-dried for 2–3 days before use. All RS and WH samples were cut into approximately 5 cm-long segments and weighed before and after sun-drying. Three 1 kg (dry weight) samples of RS and WH were collected, homogenized, and stored in separately labeled plastic bags for chemical analysis. Results of the chemical analysis can be found in Table 1.
2.2.2. Collection of Pond Sediments for Fertilizer Amendments
PPS was obtained from the sludge and sediment of Pangasius catfish ponds. The farm ponds from which this material was collected are located in My Thanh Ward, Long Xuyen City, An Giang Province. The pond sediments were collected during the fourth month of Pangasius catfish growth using a pump. The obtained sediments were then sun-dried for 5–7 days and transported to An Giang University, where they were air-dried for three additional days. Once dry, the samples were thoroughly mixed and three 1 kg samples were collected and stored separately in labeled plastic bags for chemical analysis. The results of the chemical analysis are given in Table 1.
2.2.3. Selection of Optimal Rice Straw-Pond Sediment and Water Hyacinth-Pond Sediment Organic Fertilizer Combinations
Two types of organic fertilizer were produced (Figure 2 and Figure 3). One contained a mixture of PPS and RS (PPSRS), the other a mixture of PPS and WH (PPSWH). Both types of fertilizer were made by mixing sediments and residues in different proportions, so that they contained 10%, 30%, 50%, or 70% of either RS or WH mixed with 90%, 70%, 50%, and 30% PPS, respectively, creating eight organic fertilizer combinations (Figure 3). The PPSRS and PPSWH fertilizers were produced following the methods of Hein [33]. Briefly described, a measured quantity of the dried PPS was mixed with a measured quantity of RH or WH to achieve the mixing percentages noted above. The mixtures were turned regularly and then composted. A microbial fungal inoculum was added to each mixture. The inoculum used (TRICODHCT-LUA VON) contains a combination of Trichoderma asperellum spp. (80%, v/v) and Trichoderma atroviride Karsten (20%, v/v), with 5 g added, diluted in 3 liters of water, per 10 kg of compost. The inoculum was provided by the Department of Biotechnology at Can Tho University and was used to accelerate the composting process. The composting fertilizers were incubated in plastic incubator bags, which were turned over every 4–5 days during the first month to ensure homogeneity. The incubation temperature was 60 °C during 70 and 90 days for the treatments of rice straw and water hyacinth, respectively. The material was deemed ready for use when the color of the composting fertilizers in the incubation bags changed from brown to green [33]. To identify the PPSRS and PPSWH combination for use in the growth performance experiments, samples from each of the eight fertilizer combinations were collected for chemical analysis. The PPSRS and PPSWH combinations with the greatest nutrient concentrations were selected for the cucumber growing experiment.
2.2.4. Preparation of Organic Fertilizer for Wet Season and Dry Season Cucumber Production
The PPSRS and PPSWH combinations prepared and identified in the previous section were used in fertilizer applications for the 2016 wet season (Figure 2). To create organic fertilizer for the 2017 dry season, the methods above were repeated prior to the start of the dry season, but only for the two selected PPSRS and PPSWH combinations.
2.3. Experiment Two: Integrated Cucumber–Fish Cultivation with Organic–Chemical Fertilizer Combinations
2.3.1. Fertilizer Application
Experiment two tested the use of different organic–chemical fertilizer mixes, from entirely organic to entirely chemical nutrient sources, on cucumber production. The PPSRS and PPSWH identified as having the highest nutrient concentrations were used in combination with different quantities of chemical fertilizer to fertilize cucumbers in the wet and dry seasons. The PPSRS and PPSWH amendments used in experiment two were prepared in two batches, before the start of each cucumber growth season, based on the selected combinations from experiment one (Figure 2 and Figure 3). Five different treatment levels, T1–T5, which represent a gradient from 100% chemical fertilizer to 100% organic fertilizer were used:
- T1—control treatment with cucumbers grown using 100% chemical fertilizer at an average rate for Vietnam (220 N‒180 P2O5‒140 K2O) [34];
- T2—75% of chemical fertilizer input used within T1, and 25% of organic fertilizers (PPSRS or PPSWH) used in T5;
- T3—50% of chemical fertilizer input used within T1, and 50% of organic fertilizers (PPSRS or PPSWH) used in T5;
- T4—25% of chemical fertilizer input used within T1, and 75% of organic fertilizers (PPSRS or PPSWH) used in T5; and
- T5—100% of organic fertilizer input of PPSRS or PPSWH at 100 kg per plot.
2.3.2. Production Area Preparation
A series of raised beds, surrounded by canals, were used for experiment two (Figure 3). Each bed measured 3.5 × 45 × 0.4 m (width × length × height above water surface). The canals in between the raised beds measured 3 × 45 × 1 m (width × length × depth), and were connected by a channel at each end. The total experimental area was 1945 m2, of which 945 m2 were raised beds. Each 45 m long raised bed was divided into three 15 m long plots. These plots were then divided along their length to create sub-plots. In total, this resulted in 30 plots, on which the PPSRS and PPSWH fertilizers were added, in triplicate, at the five treatment levels. The layout of the experiment can be seen in Figure 3.
To prepare the plots for planting, they were first ploughed and allowed to dry for four days, and then covered by an agro-polymer plastic to maintain soil moisture and prevent weeds and pathogens before seedling establishment. The plot and agro-plastics were pierced to make a hole with a diameter of 5–6 cm and 7–8 cm depth to raise the cucumbers. The canals were prepared before the experiment by removing wastewater and surface sediments and left empty to dry for about two weeks. The bottom of the pond was treated with 20 kg of lime per 100 m2 and left to dry for an additional week. Water from the nearby river was then pumped into the canal to a depth of 2 m.
2.3.3. Cucumber and Fish Preparation
A high yielding cucumber (Cucumis sativus L.; seed variety: AG208) was obtained from the Loc Troi Group of My Xuyen Ward, Long Xuyen City, An Giang Province. This cucumber variety is recommended to local farmers by the Agricultural Extension Center, Department of Agriculture and Rural Development, An Giang Province. With a cultivation period of around 60 days, it is one of the most popular cucumber varieties in the province.
Fish fingerlings of the herbivore (Osphronemus goramy) were obtained from the Research Center for Aquaculture Seed Production of Can Tho City, Can Tho Province. All fish fingerlings were treated with a 3% NaCl solution for 15 min on arrival to eliminate ectoparasite infections. Approximately 1000 fingerlings were nursed together in a big hapa net (5 m × 7 m × 1.5 m) and fed commercial feed that contained 28%–35% crude protein (Proconco Cuu Long Aquafeed Corporation, Long Duc Industry Zone, Tra Vinh City, Tra Vinh Province, Vietnam) for two weeks before the experiment started. The fingerlings were then introduced into canals that lay between the cucumber beds and had a fish density of 2 fish m−2. At the beginning and end of the experiment, all fish were individually weighed using a digital scale. Except for a small amount of supplementary commercial feed, the fish relied only on the natural productivity of the canal ecosystem, fallen leaves, and discarded cucumber fruits as well as water spinach growing in the canal as a food source. The layout of the integrated fish–cucumber cultivation system can be seen in Figure 3.
2.3.4. Cucumber Planting and Growth Conditions
Cucumbers were grown in three replicated plots at each of the five fertilization treatments and during two consecutive cropping cycles (Figure 3). Cucumber vegetable seeds were soaked in warm water for 2‒3 h and then incubated in damp paper towels for 3–4 days. The individual sprouted seeds, with white papillary, were sown in soil pots and nursery trays. When the seedlings had two 5 cm-long leaves, they were transplanted in the experiment plots. Plants were spaced about 0.4 m apart, with about 37 plants in each experimental plot, resulting in a planting density of approximately 5700 plants ha−1 considering the integrated field setup. Cucumbers were grown on the raised beds between the canals, with pairs of melaleuca poles (2–2.5 m tall) tied diagonally over each canal and covered by ribbed mesh (10 cm of mesh size), providing the climbing-frame for cucumber plants (view A-A in Figure 3).
Where organic fertilizers were used, these were added into each plot just after the soil was plowed, while the chemical fertilizers were added at 5–10 days after sowing (DAS), 15–20 DAS, and 30–35 DAS. Cucumber plants were irrigated by pumping water from the fish canal near each plot.
2.3.5. Plot Soil Sampling
At the beginning and end of the cucumber growth experiment, soil from the top 5 cm in the cucumber plots was collected at five different locations in each plot. A single homogenized soil sample, combining the samples from all plots, was used to analyze pH, NH4+ (mg L−1), NO3− (mg L−1), TN, TP, soil organic carbon (SOC) and available phosphorus (mg kg−1). Soil pH was measured in a mixture of 20 g soil and 20 mL of distilled water with a glass electrode [35]. Analysis of TN followed the Kjeldahl method for soil analysis [36,37]. TP concentrations were determined by digesting soil with 60% perchloric acid [38] and measuring the available phosphorus in the digested fraction by the vanadomolybdophosphoric acid colorimetric method [39]. SOC was measured by the Walkley–Black dichromate oxidation technique [40]. Average soil properties at the beginning and end of the experiment can be seen in Table 1.
2.3.6. Data Collection and Calculation
During the cucumber growing period, plant length and vine length, width and number of leaves, and root length of six plants in each treatment were measured twice in each crop cycle at approximately 10 and 20 DAS. Cucumber fruits were harvested from all plots daily between 16:00–18:00. Harvested fruits were counted and weighted until the end of the growth season to estimate final yields in each treatment. At the beginning and end of the experiment, giant gourami fish were counted and individually weighed. The following parameters were calculated: survival rate SR% = TFf/TFi × 100, where TFf is the total number of fish at the final harvest and TFi is the initial number of fish; specific growth rate (SGR) (% day−1) = [ln(Wf) − ln(Wi)]/T × 100; daily weight gain (DWG) (g day−1) = (Wf − Wi)/T, where Wf and Wi refer to the mean final and initial weights, respectively, and T is the growth period in days; and fish yield (kg) = total Wf − total Wi, where totals are calculated by summing up the final and initial weights of all harvested fish.
2.3.7. Data Analysis
Samplings for growth performance and production of cucumber were conducted at fixed intervals, three times over one month during the experimental period. Differences in plant traits between individual treatments were analyzed using Duncan’s multiple range test, and deemed significant when p < 0.01. These statistical analyses were carried out using IBM SPSS Statistics (version 25). To present the changing effect of total nitrogen, phosphorous, and potassium inputs on yield between the five fertilizer mixtures, second order polynomial curves were fitted to cucumber yield data. Curves were fitted using the Curve Fitting toolbox within MATLAB, version R2017a (The Mathworks Inc., Natick, Massachusetts, USA).
3. Results
3.1. Experiment One: Organic Fertilizer Production
Chemical analysis of PPS, RS, and WH found that the pH ranged between 5.5–6.9. Concentrations of OM in RS and WH were over ten times higher than in PSS. The TN concentration was highest in WH and lowest in PPS. Moreover, the phosphate (PO43−) − Bray II (ppm), NH4+ (mg kg−1), and NO3− (mg kg−1) concentrations were highest in PPS (Table 1).
Analysis of the different PPS to RS or WH fertilizer combinations found that the highest nutrient concentrations at the end of the composting process were in the PPSRS and PPSWH that contained 30% PPS and 70% RS or WH (Table 2). These mixtures were therefore chosen to create the organic fertilizer used in the cucumber growth experiments.
3.2. Experiment Two: Integrated Cucumber–Fish Cultivation with Organic–Chemical Fertilizer Combinations
3.2.1. Fertilizer and Soil Properties
The chemical compositions of the experimental organic fertilizers (PPSRS-70 and PPSWH-70) obtained both before the wet season and before the dry season are reported in Table 3. The nutrient concentrations of organic fertilizers produced before the two growing seasons differed slightly, with concentrations of OM, P, and K in the dry season being higher than in the wet season (Table 3). Moreover, nutrient concentrations were slightly lower than the standard values for organic fertilizers (Table 3). The total nutrient inputs for each treatment in the wet and dry seasons, derived by combining different proportions of chemical fertilizer and PPSRS-70 or PPSWH-70 inputs can be found in Table 4. The pH, organic matter (OM%), total nitrogen TN (%N), total potassium TK (%K2O), and total phosphorus TP (%P2O5) in the soil of the experimental area did not differ markedly between the beginning and end of experiment two (although we could not test differences statistically as we reported concentrations from pooled samples). However, higher available phosphorus (PO43−), NH4+, and NO3− concentrations in soils were recorded at the end of experiment two (Table 1).
3.2.2. Growth Performance and Plant Traits
Growth performance and plant indices at 10 days after sowing (DAS) for the wet and dry season crops are given in Table S1. While not always significant, plant traits (plant length, leaf length, leaf width) were generally greater in the 100% chemical treatments (T1) compared to where 100% organic amendments were used (T5) in both the wet and dry seasons. Growth performance and plant indices of cucumber growth experiments recorded at 20 DAS for the crops during the dry season and wet season are given in Table S2. Almost all the plant indices at 20 DAS were smallest in the two treatments with the lowest quantity of chemical fertilizer applied (T4 and T5) in both seasons and with both types of residues used.
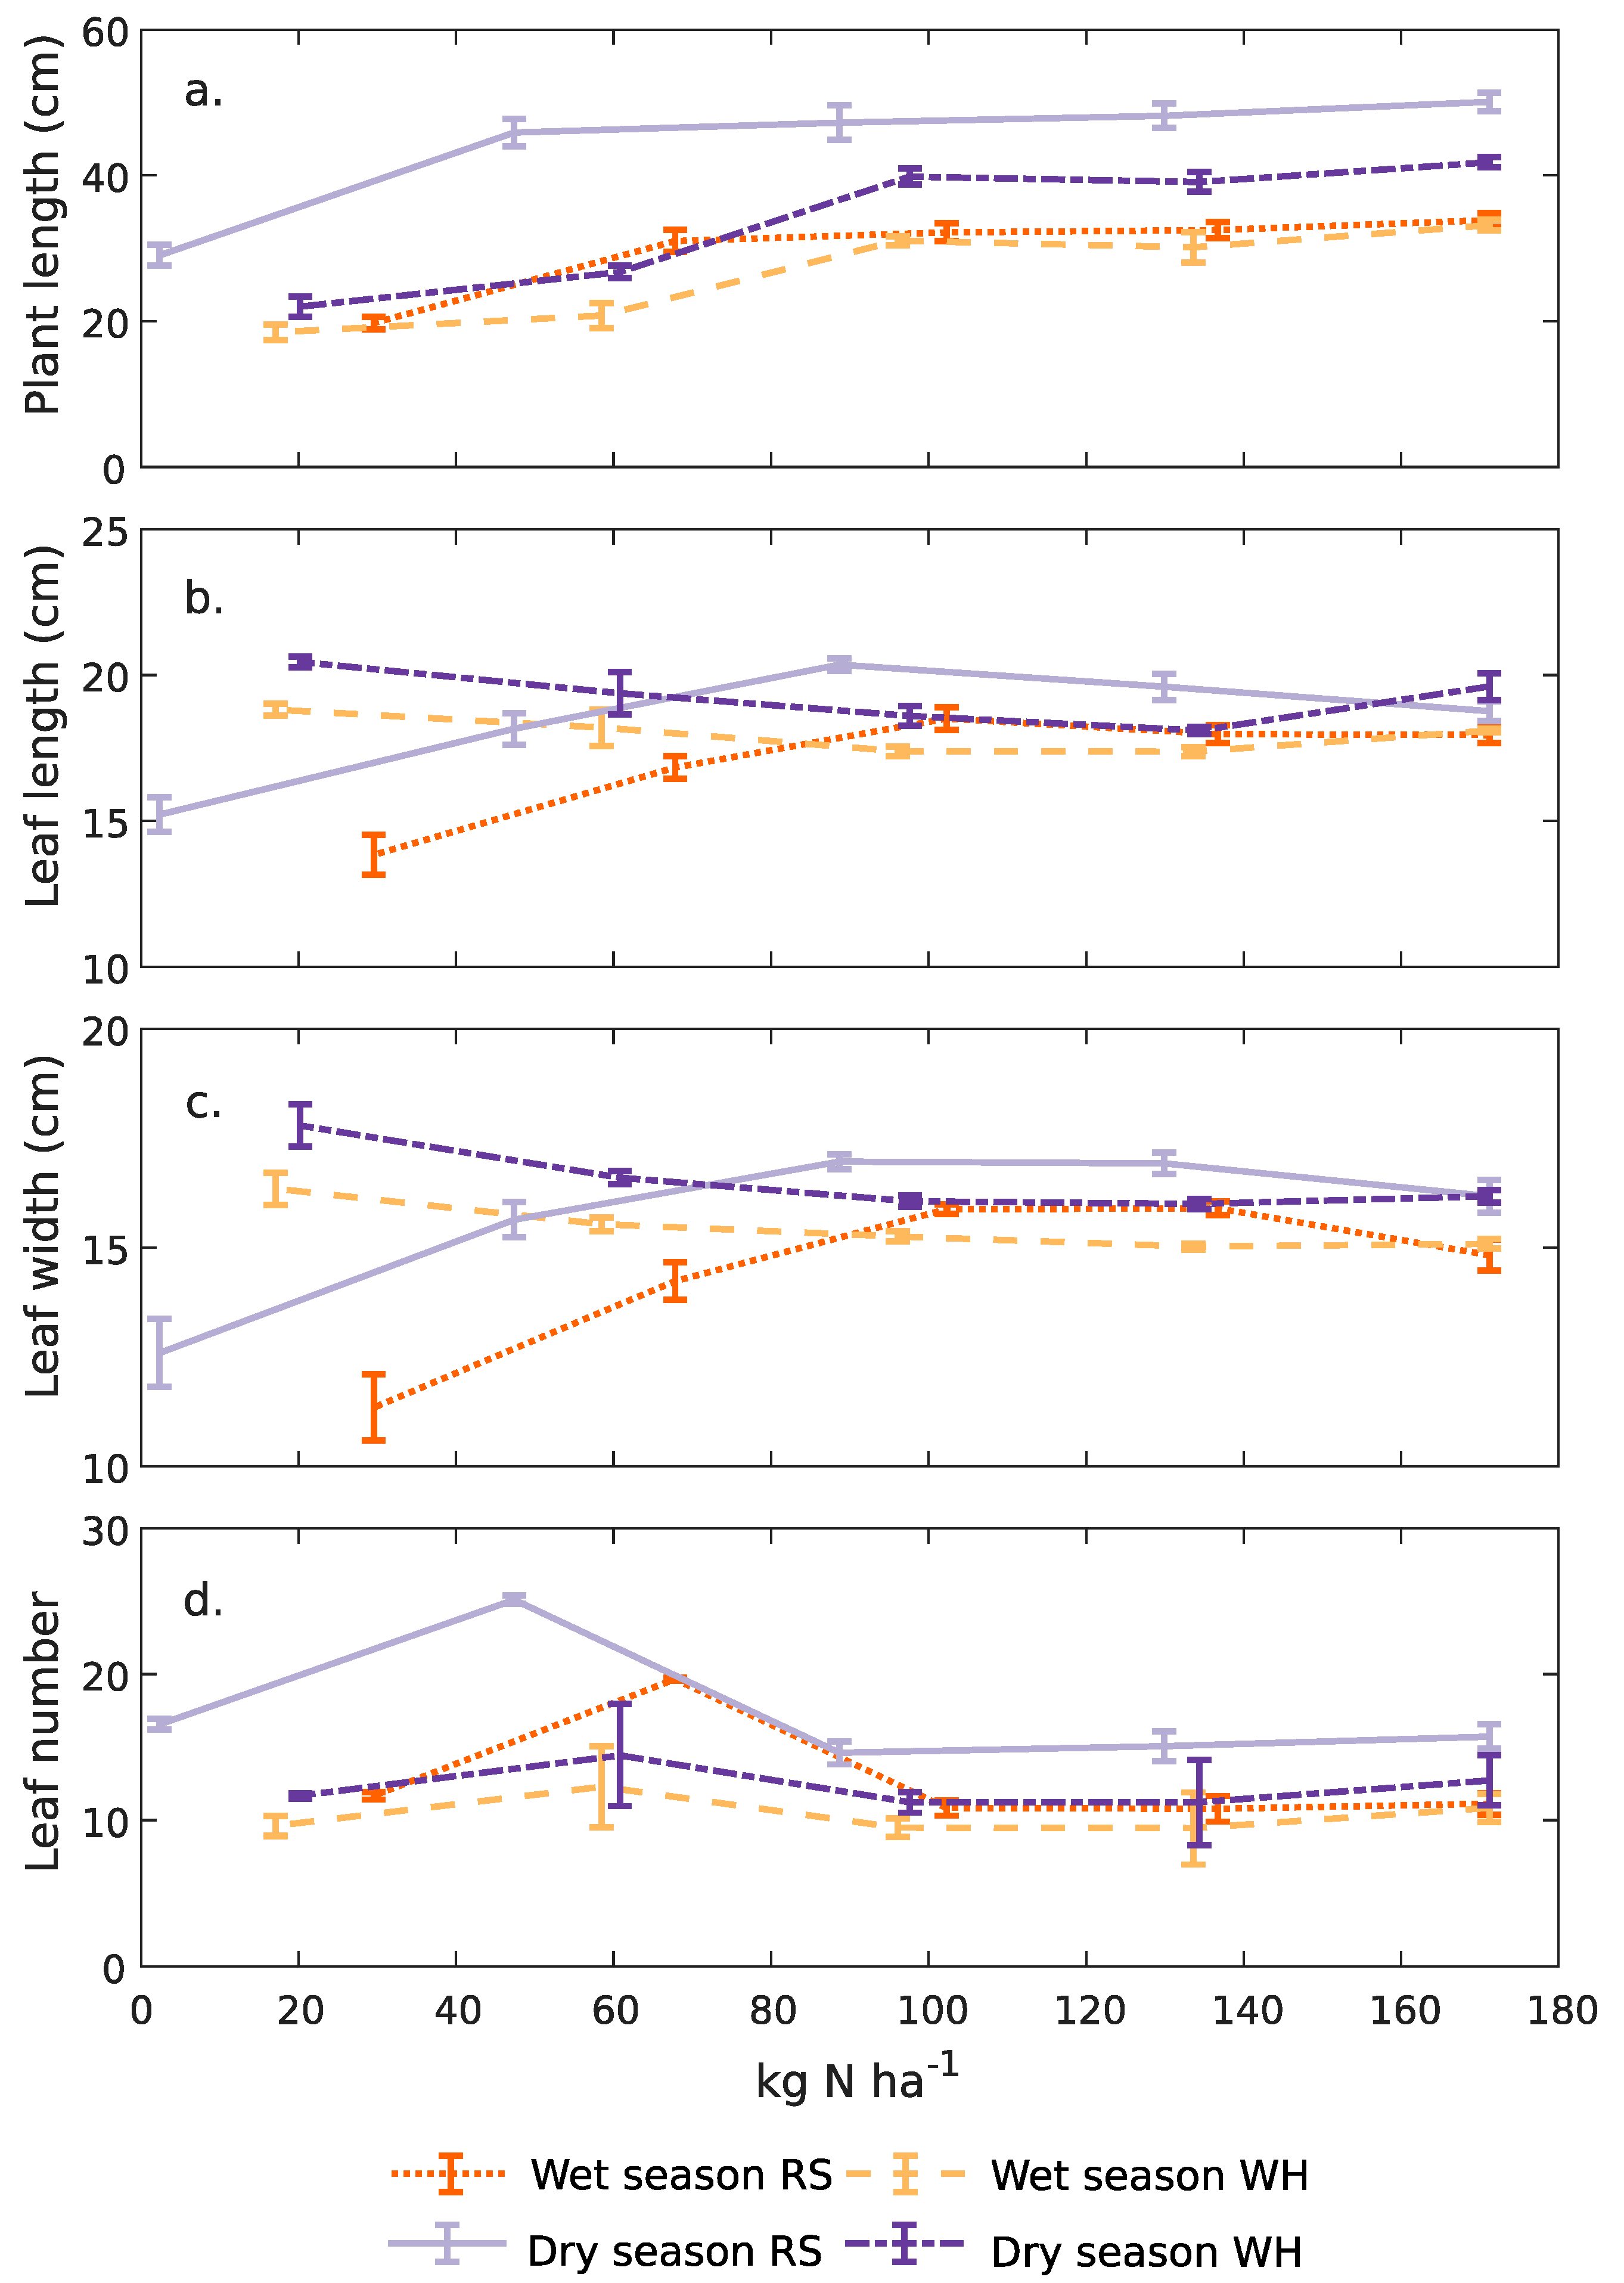
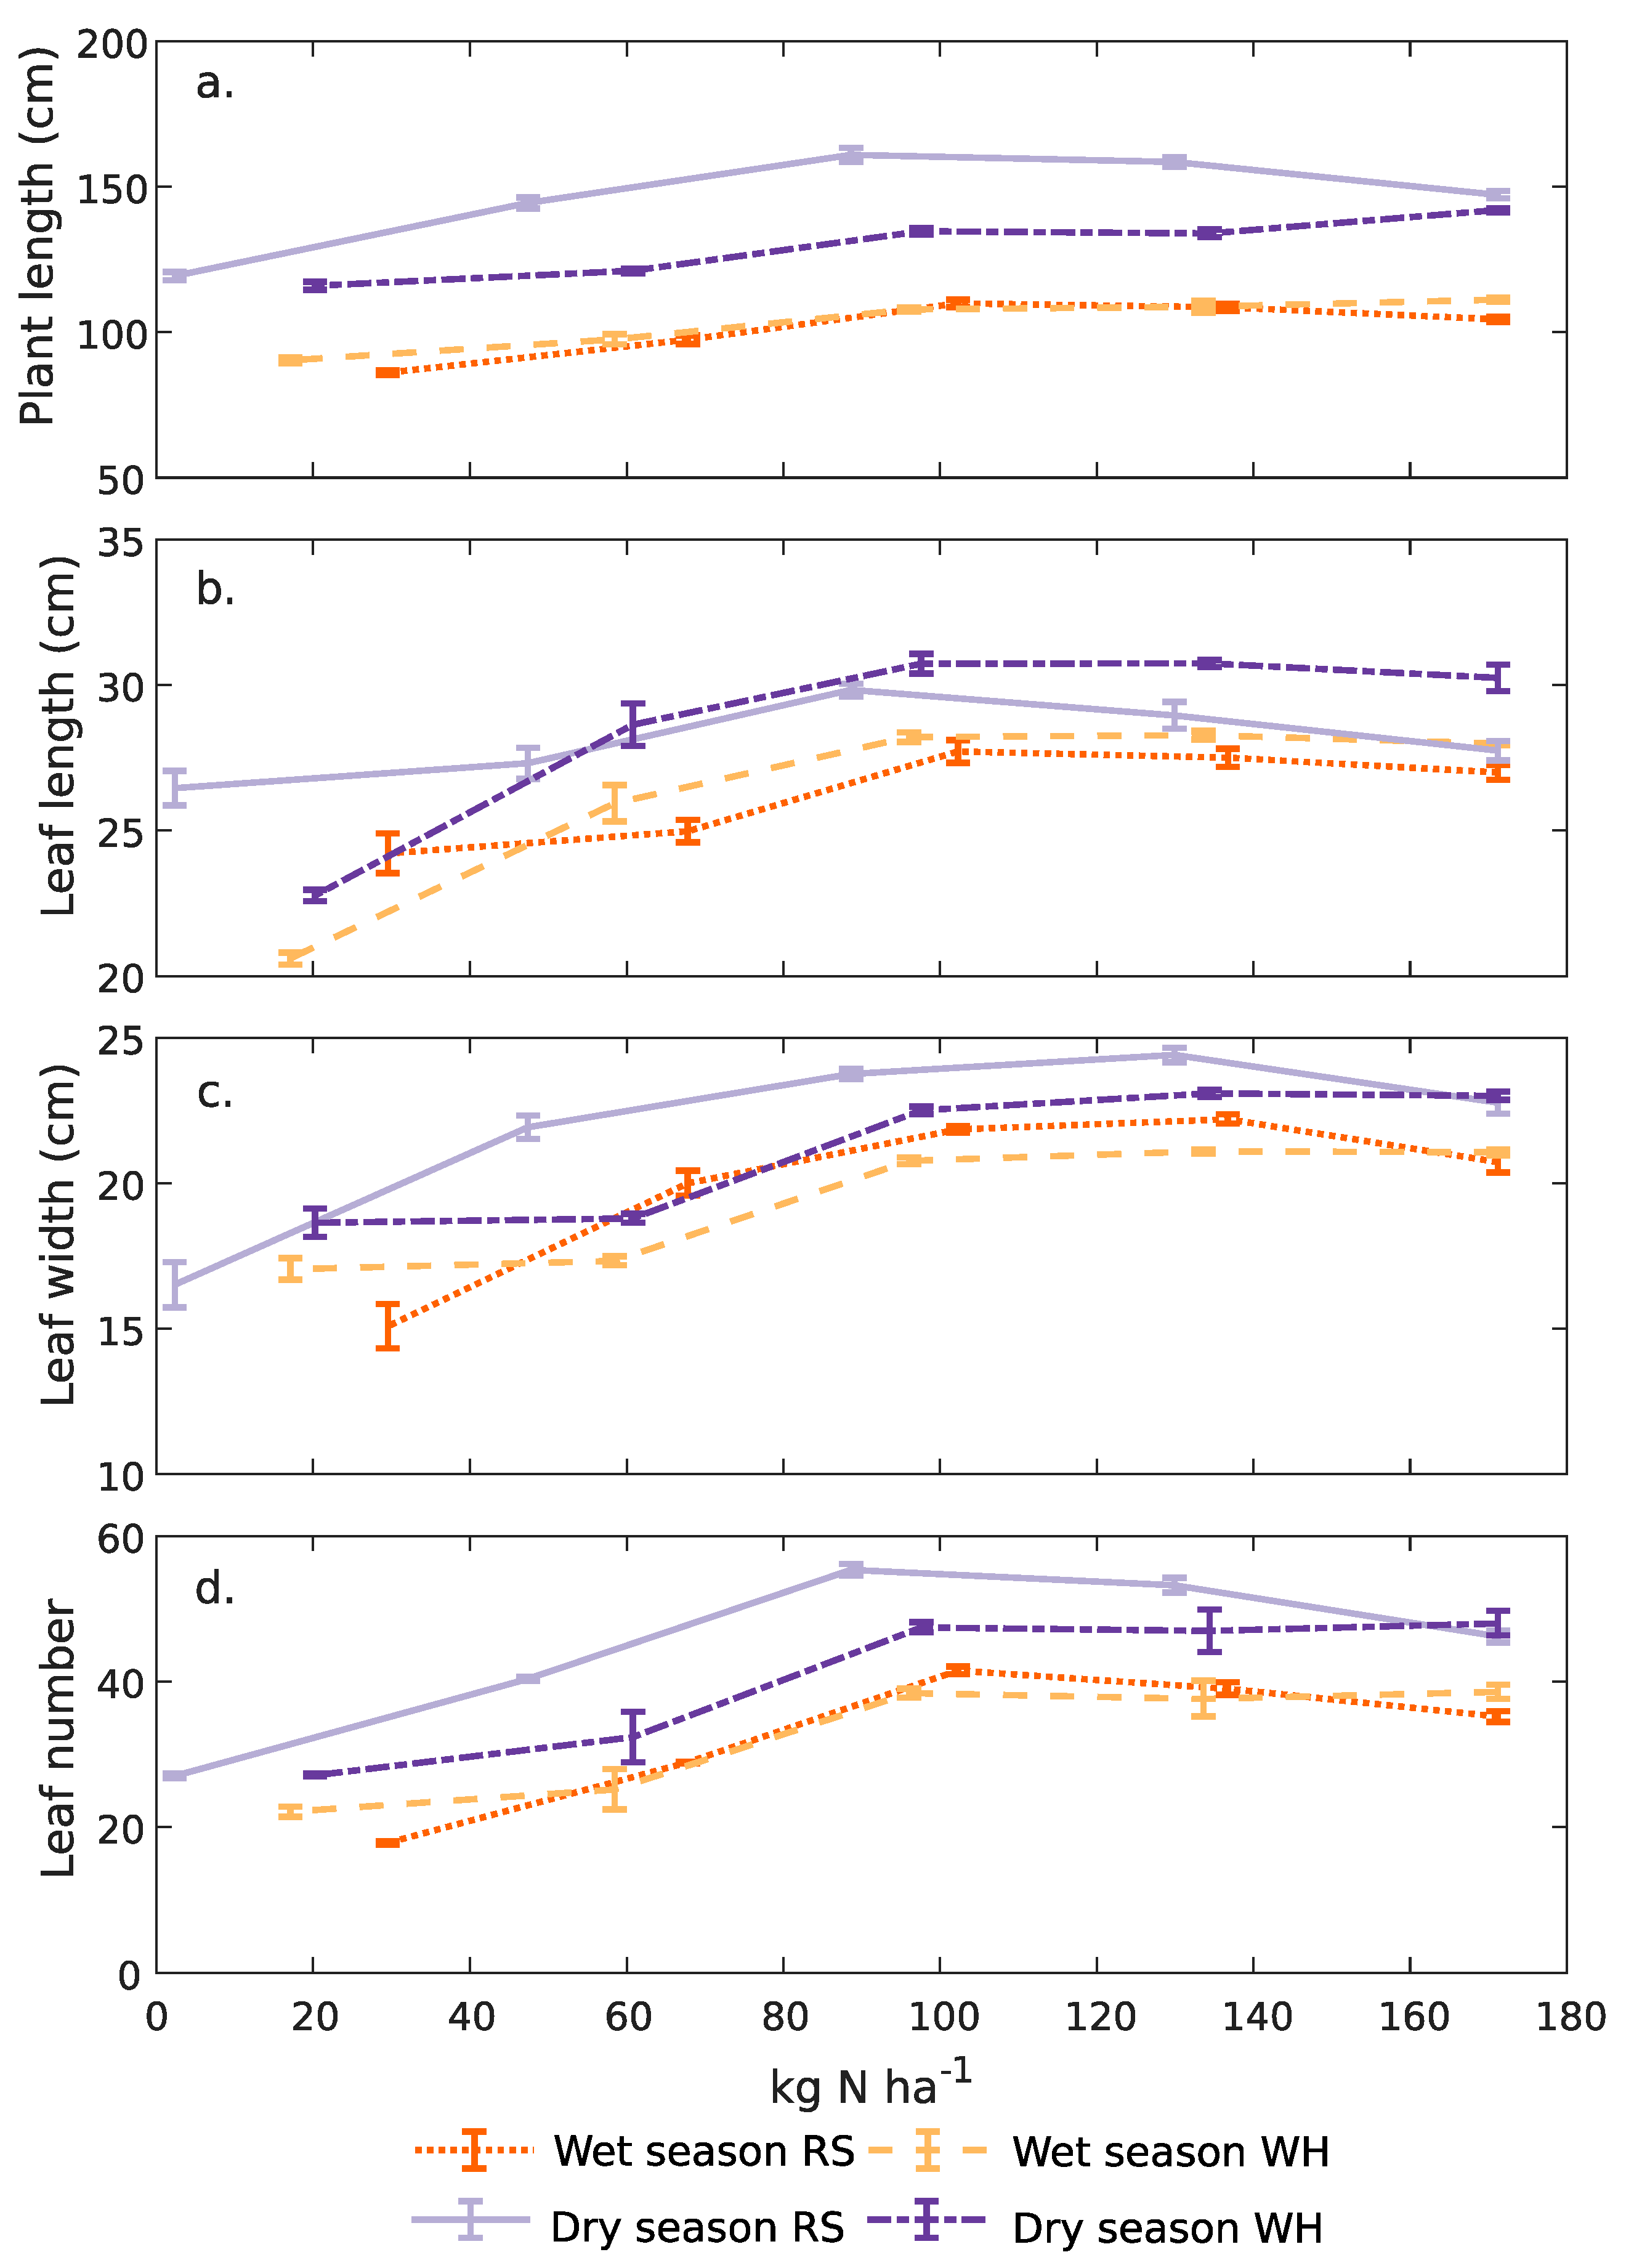
The trends in plant indices at 10 and 20 DAS as a function of the total nitrogen inputs including chemical and organic amendments are presented in Figure 4 and Figure 5. During the early plant development stages at 10 DAS, increasing the total additions of nutrient inputs appears to increase the plant length. Leaf length and leaf width indices showed opposing trends between the two types of residue used (Figure 4). Both leaf length and width were smallest when rice straw was used in the organic amendments and total nitrogen inputs were the smallest. Conversely, leaf length and width were greatest at the lowest total nitrogen addition levels when water hyacinth was used as an organic residue. Similarly, at 20 DAS (Figure 5), there was an increasing trend in plant indices as nutrient inputs increased. However, after the nitrogen inputs increased above approximately 100 kg ha−1, there was no additional benefit to increasing the nitrogen inputs on plant indices, and possibly a mild negative effect.
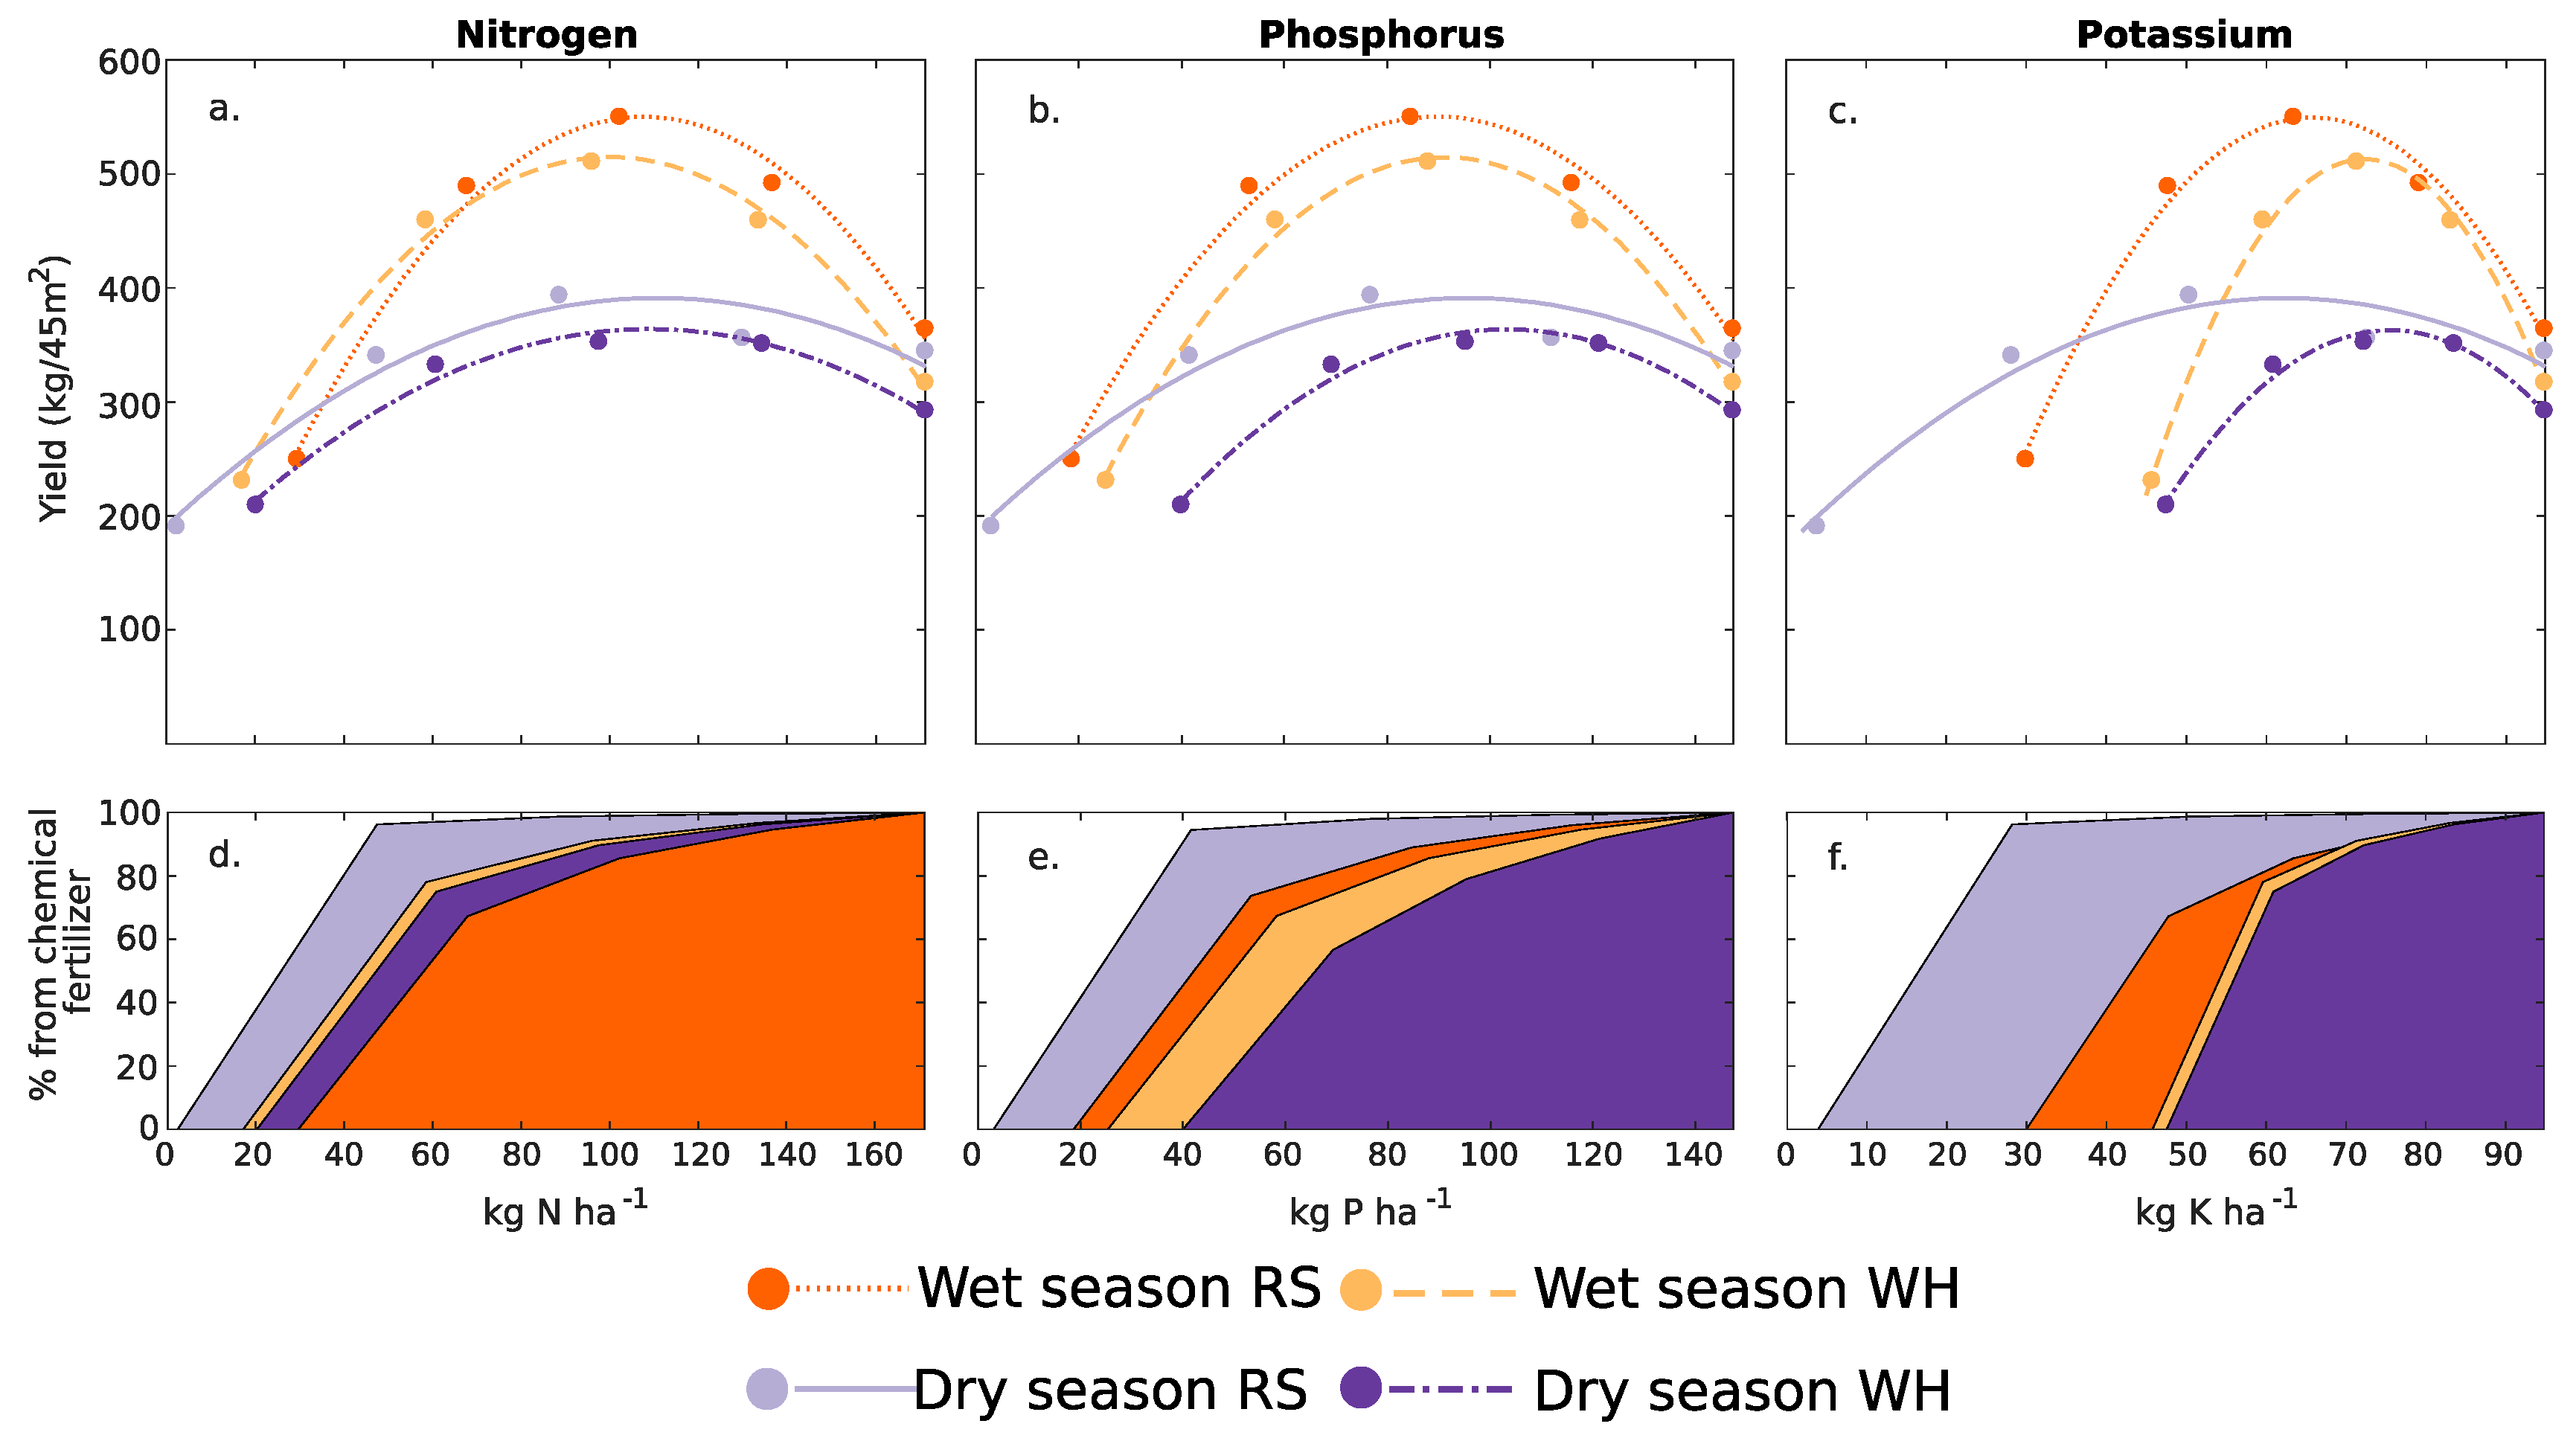
Figure 6 shows how fruit yields in experiment two varied with increasing total amount of added nutrient (N, P, and K) including chemical and organic amendments. Curves represent the fitted second-degree polynomials, all of which had high adjusted-R2 values (all > 0.88) to present the general trend in treatment effect. Lower plots (d, e, f) presented the fraction of nutrient inputs from chemical fertilizer compared to total inputs (chemical + organic addition nutrients). For all four experiments (two crops, two organic amendment type), the highest yields were produced at the medium chemical fertilizer input rates. At these rates, whilst there was a reduction in chemical fertilizer input, their input rates were still a relatively high fraction of the total nutrient inputs. However, the addition of nutrients as organic matter appears to have had a positive impact on crop yields compared to simply increasing the amount of chemical fertilizer added to the field.
3.2.3. Final Yield of Fish and Cucumber
The final body weight of the giant gourami grown for eight months in the canals surrounding the cucumber plots was 459.3 g per fish, with a total fish yield of 0.387 kg m−2 of water. There were at least an additional 20 kg of wild fish species in the canals, but this was not included in the final yield of fish in this study. The survival rate (%), specific growth rate (SGR), daily weight gain (DWG) of giant gourami were 70.2%, 0.69% day−1, and 1.3 g day−1, respectively.
For both seasons, considering both RS and WH mixtures, the greatest cucumber yields were found in T3 and the smallest were in T5 (Table 5), and the wet season yields were consistently higher than their comparative dry season yields. However, comparing the T1 in both the wet season and dry season, when plants were fertilized with only chemical fertilizer, yields from plots within the RS growing area were consistently (but marginally) higher than in the respective water hyacinth growing area.
4. Discussion
The development of integrated fish–vegetable farming systems are often considered as sustainable agricultural models for smallholders and provide opportunities for improved food security, economic liberalization, climate change adaptation, and additional income for the resources-poor in developing countries [23,41,42]. Thus, integrated farming systems have been shown to provide sustainable alternatives to less integrated systems, which are also often practically applicable in a local context [21]. However, there are limited studies on the effects of organic fertilizer produced from PPS and RS or WH on Brassica juncea and Ipomoea aquatica [31]. In contrast, there are many studies on compost from other agricultural wastes combined with fish pond sediment [28], sewage [43], sludge rock phosphate and ammonium sulfate [44], swine manure [45], rape cake, poultry manure [46], and dairy manure [39]. In this work, we assessed how chemical fertilizers and organic residues can be combined to reduce dependence on chemical additions while also increasing vegetable yields. Specifically, we tested whether this could be achieved in an integrated cucumber–fish production system, where the benefits of FPS and residue recycling were combined with those of fish farming (Figure 1).
4.1. Characteristics of Individual Organic Amendments
As summarized in Table 1, the total nitrogen concentration of RS and WH residues used in this study were higher than the earlier data published for RS, wheat straw (Triticum aestivum L.), potato plant residues (Solanum tuberosum L.), and mustard stover (Brassica juncea L.) [28]. However, carbon, nitrogen, and phosphate concentrations of RS and WH were slightly lower than the values measured in market crop waste [47].
Previous studies indicate that PPS amendments are rich in OM, N, and P, and have high water holding capacity. These properties make it suitable as a bulking agent to speed up the composting of agricultural residues [16,48,49]. As PPS is rich in macro- and micronutrients, it can serve as a potential organic fertilizer and soil conditioner, which could enhance the soil environment for crop production [2,50]. We showed that PPS contained higher levels of the major nutrients required for crop fertilization (N, P, K) than the initial soil in the experimental plots (Table 1). In general, the concentrations of major nutrients in PPS were comparable to values reported for Pangasius and other FPS used as organic fertilizer for rice, morning glory (Brachiaria mutica), chinese mustard (Brassica juncea), water spinach (Ipomoea aquatica), and fodder grass (Ipomoea reptans) grown in tropical regions [2,13,16,31,51,52,53]. Moreover, Boyd et al. [51] reported that the major nutrient concentrations of PPS were similar to or higher than those of manure from chicken, cattle, and horses.
These results suggest that combining RS or WH residues with PPS has the potential to provide a nutrient-rich organic amendment for vegetable cultivation. To use these organic amendments, however, they first need to be composted.
4.2. Characteristics of the Organic Fertilizer after Composting
The physico-chemical properties of the organic fertilizer are summarized in Table 3. The concentrations of some important nutrients (P, K) in the organic fertilizer were slightly higher in the dry season than in the wet season (Table 3). However, Saldarriaga et al. [32] stated that the physical and chemical properties of the composting products for organic fertilizer depend on the type of initial material, duration of the decomposition step, and conditions during the process (e.g., temperature, moisture content, degree of aeration, pH, and C/N ratio, and the physical structure of the raw materials), so it is not surprising to find some variation between our two batches of compost. The physico-chemical properties of our organic fertilizer were within the range reported in previous studies [28,31,49,54]. The pH (6.85–7.38) was in the range measured in the co-composting of green wastes [55], the composting of agricultural waste mixtures with and without FPS [28], organic fertilizer produced from sludge in combination with RS or WH [31], and market crop wastes [47]. However, our organic fertilizer was higher in TN, TP, and phosphate compared to compost from mixed agricultural wastes and PPS [28,31,54]. Moreover, the TN, ammonium, and nitrate concentrations in our organic fertilizer were higher than in the compost based on market crop wastes [40] and co-composting of fecal sludge and organic solid waste from agriculture [54].
The initial C/N ratio depends on the quality of the residues and affects the composting process and compost quality, while the final C/N depends on the degree of decomposition [56]. The final C/N ratios of our organic fertilizers ranged between 9.52–17.24 for organic fertilizer based on rice straw, and 14.19–14.82 in fertilizer based on water hyacinth (Table 3). A C/N ratio of around 16 is recommended for compost used in agriculture [54].
4.3. Organic Fertilizer Benefits to Soil and Plants
The indirect integration of aquaculture with agriculture through the reuse of FPS as organic fertilizer for green fodder, vegetables, and rice production has significant potential to contribute to sustainable intensification and nutrition security goals, reducing local environmental impacts associated with sediment disposal, and increasing agricultural production [13,15,17,52]. We hypothesized that organic fertilizer produced from PPS and locally sourced plant residues (RS, or WH) can offer an avenue for sustainable agricultural development in the Mekong Delta region and Southeast Asia. Our experimental results confirmed this expectation, showing higher OM, TN, TP, and available phosphorus, ammonium, and nitrate concentrations in soils at the end of experiment two compared to the initial soil plots (Table 1). However, these results should be treated with caution, since soil samples were pooled before chemical analysis, so we cannot quantify uncertainty around these average values. Similar improvements have been reported when fish pond sediments were used as fertilizer for fodder grass production and in rice fields in Bangladesh [13], China [57], and Palestine [58].
The trends in plant traits between each treatment and between growing seasons at 10 and 20 days are presented in Figure 2 and Figure 3, respectively. The measured parameters did not differ between treatments, except at high organic fertilizer application rates (Tables S1 and S2). In general, cucumber plant indices in the dry season were larger than in the wet season, possibly because of higher solar radiation in combination with abundant water from nearby canals in the dry season. These results thus suggest that organic amendments can promote the vegetative growth of cucumber plants in both wet and dry seasons.
4.4. Organic Fertilizer Benefits to Crop Yields
The highest fruit yield and fruit number were found when applying 50% of the maximum doses of inorganic and organic fertilizers for the crops both during the dry and wet seasons, whilst the lowest values were obtained when growing cucumbers with only organic fertilizer (Table 5). Therefore, the fertilizer combination in this treatment provided enough nutrients to satisfy the requirements of the cucumber plants and improved yields. The best performing treatment combination (T3) resulted in a per hectare equivalent yield in an integrated fish–cucumber system of 28.7 and 20.2 tons ha−1 for the wet season and dry season, respectively, using RS. These yields are approximately half of the yields commonly reported in Hau Giang Province (based on a survey of local cucumber production, results not shown), but approximately half of the experimental area was dedicated to fish farming and thus did not contribute to vegetable production. Therefore, considering only the effective growing area, yields were comparable to those found within the province when standard practices were used. However, caution is needed in assessing the benefit of RS over WH as an organic addition. While RS organic amendments performed better than WH amendments, T1 plots within the RS growing area also performed marginally better than T1 plots in the WH area. As these areas are fertilized with an identical amount of chemical fertilizer, this result suggests an inherent (albeit minor) benefit to plant growth within the RS production area, which occurred due to a lack of a fully randomized design.
The other half of the system was dedicated to fish production. The fish yield we obtained (387 kg) equated to approximately 2 tons of fish if the system was scaled up to one hectare. The fish provide a valuable second farm income, an additional protein source, and also have the potential to increase farmer resilience through diversified production (Figure 1).
5. Conclusions
We have demonstrated that the use of organic fertilizers can either replace or supplement chemical inputs and have an overall positive effect on yields. This can also be achieved in combination with fish production. Further work is needed to demonstrate the economic benefits to farmers, given the trade-offs between fish production and reduced area available for vegetable production, and between savings on chemical fertilizers and increased labor costs for the preparation of the organic amendments. However, the results demonstrate a system that may be economically beneficial for farmers over traditional cucumber production systems.
The study demonstrates that the nutrients in organic fertilizer from striped catfish pond sediments combined with rice straw or water hyacinth residues can replace 25%–50%, or even up to 75% of inorganic fertilizers as a nutrient source for cucumber plants. The organic amendments satisfied the nutritional requirements of the cucumber plants and increased yields compared to using only inorganic fertilizers. Moreover, we showed that organic amendments can be combined with integrated fish–vegetable farming to provide a more diversified production system with tangible environmental benefits and potentially improved farm income.
Supplementary Materials
The following are available online at https://www.mdpi.com/2073-4395/10/7/1025/s1, Table S1: Mean growth performance and the indices of cucumber vegetable plants at 10 days after sowing, for all organic fertilizer treatments in both the wet season and dry season (length in cm). Means with different letters within rows are significantly different (p < 0.01). Table S2: Mean growth performance and the indices of cucumber vegetable plants at 20 days after sowing, for all organic fertilizer treatments in both the wet season and dry season (length in cm). Means with different letters within rows are significantly different (p < 0.01).
Author Contributions
Conceptualization, C.T.D., P.A.T., and V.T.T.; Methodology, C.T.D., P.A.T., and V.T.T.; Formal analysis, C.T.D., P.A.T., J.L., and V.T.T.; Writing—original draft preparation, C.T.D., P.A.T., and V.T.T.; Writing—review and editing, C.T.D., P.A.T., V.T.T., H.B., S.M., and J.L. All authors have read and agreed to the published version of the manuscript.
Funding
This research was partially funded by the Swedish Research Council (Vetenskapsrådet), Formas, and Sida through the joint call “Sustainability and resilience—Tackling climate and environmental changes” (VR 2016–06313).
Acknowledgments
The authors wish to thank the farmers, staff, and students at the Crop Science Department of the Faculty of Agriculture and Natural Resources, An Giang University, and Laboratory of Can Tho University for their support and field and lab assistance. Two anonymous reviewers provided useful comments to the original manuscript.
Conflicts of Interest
The authors declare no conflict of interest.
References
- FAO. The State of World Fisheries and Aquaculture 2012; FAO—Food and Agriculture Organization of the United Nation: Rome, Italy, 2012; 230p. [Google Scholar]
- Rahman, M.M.; Yakupitiyage, A.; Ranamukhaarachchi, S.L. Agricultural use of fishpond sediment for environmental amelioration. Thammasat Inter. J. Sci. Tech. 2004, 9, 1–10. [Google Scholar]
- World Bank. Aquaculture Pollution: An Overview of Issues with a Focus on China, Vietnam, and the Philippines; The World Bank’s Agriculture and Environment and Natural Resources Global Practices; World Bank Regional Agricultural Pollution Study; Working Paper; World Bank: Washington, DC, USA, 2017; pp. 1–15. [Google Scholar]
- Vietnam Association of Seafood Exporters and Producers (VASEP). Vietnam’s Fisheries Industry Overview 2018 of Vietnam Association of Seafood Exporters and Producers; Ministry of Agriculture and Rural Development: Hanoi, Vietnam, 2019; Available online: http://vasep.com.vn/1192/OneContent/tong-quan-nganh.htm (accessed on 9 October 2019).
- The Ministry of Agriculture and Rural Development (MARD). Annual Reports of the Ministry of Agriculture and Rural Development; The Ministry of Agriculture and Rural Development (MARD): Hanoi, Vietnam, 2018. (In Vietnamese) [Google Scholar]
- General Statistics Office Vietnam (GSO). Production of Agriculture, Forestry and Fishing of Vietnam; Statistical Documentation and Service Centre, General Statistics Office of Vietnam: Hanoi, Vietnam, 2019. Available online: https://www.gso.gov.vn/default_en.aspx?tabid=778 (accessed on 18 February 2020).
- Halls, A.; Johns, M. Assessment of the Vulnerability of the Mekong Delta Pangasius Catfish Industry to Development and Climate Change in the Lower Mekong Basin; Report Prepared for the Sustainable Fisheries Partnership; Johns Associates Limited: Bath, UK, 2013; Available online: www.johnsassociates.co.uk (accessed on 20 November 2019).
- Tovar, A.C.; Moreno, M.P.; Manuel-Vez, M. Garcia-Vargas. Environmental impacts of intensive aquaculture in marine waters. Water. Res. 2000, 34, 334–342. [Google Scholar] [CrossRef]
- Lin, C.K.; Yi, Y. Minimizing environmental impacts of freshwater aquaculture and reuse of pond effluents and mud. Aquaculture 2003, 226, 57–68. [Google Scholar] [CrossRef]
- Crab, R.; Avnimelech, Y.; Defoirdt, T.; Bossier, P.; Verstraete, W. Nitrogen removal techniques in aquaculture for a sustainable production. Aquaculture 2007, 270, 1–14. [Google Scholar] [CrossRef] [Green Version]
- Anh, P.T.; Kroeze, C.; Bush, S.R.; Mol, A.P.J. Water pollution by Pangasius production in the Mekong Delta, Vietnam: Causes and options for control. Aqua. Res. 2010, 42, 108–128. [Google Scholar] [CrossRef]
- Feng, J.; Zhou, F.; Li, X.; Xu, C.; Fang, F. Nutrient removal ability and economical benefit of a rice-fish co-culture system in aquaculture pond. Ecol. Eng. 2016, 94, 315–319. [Google Scholar] [CrossRef]
- Haque, M.M.; Belton, B.; Alam, M.M.; Ahmed, A.G.; Alam, M.R. Reuse of fish pond sediments as fertilizer for fodder grass production in Bangladesh: Potential for sustainable intensification and improved nutrition. Agric. Ecosyst. Environ. 2016, 216, 226–236. [Google Scholar] [CrossRef]
- Oláh, J.; Pekár, F.; Szabó, P. Nitrogen cycling and retention in fish-cum-livestock ponds. J. Appl. Ichthyol. 1994, 10, 341–348. [Google Scholar] [CrossRef]
- Rahman, M.; Yakupitiyage, A. Use of fishpond sediment for sustainable aquaculture—Agriculture farming. Int. J. Sustain. Dev. Plan. 2006, 1, 192–202. [Google Scholar] [CrossRef] [Green Version]
- Muendo, P.N.; Verdegem, M.C.J.; Stoorvogel, J.J.; Milstein, A.; Gamal, E.; Duc, P.M.; Verreth, J.A.J. Sediment accumulation in fish ponds: Its potential for agricultural use. Int. J. Fisher. Aquat. Stud. 2014, 1, 228–241. [Google Scholar]
- Da, C.T.; Phuoc, L.H.; Duc, H.N.; Troell, M.; Berg, H. Use of wastewater from striped catfish (Pangasianodon hypophthalmus) pond culture for integrated rice–fish–vegetable farming systems in the Mekong Delta, Vietnam. Agroecol. Sustain. Food Syst. 2015, 39, 580–597. [Google Scholar] [CrossRef]
- Boyd, C.E. Bottom Soils, Sediment, and Pond Aquaculture; Chapman and Hall: New York, NY, USA, 1995; 348p. [Google Scholar]
- Phu, T.Q.; Tinh, T.K. Chemical compositions of sludge from intensive striped catfish (Pangasianodon hypophthalmus) culture pond. J. Sci. Can Tho Univ. 2012, 22, 290–299. (In Vietnamese) [Google Scholar]
- Berg, H. Rice monoculture and integrated rice-fish farming in the Mekong Delta, Vietnam—Economic and ecological considerations. Ecol. Econ. 2002, 41, 95–107. [Google Scholar] [CrossRef]
- Berg, H.; Nguyen, T.T. Integrated rice-fish farming: Safeguarding biodiversity and ecosystem services for sustainable food production in the Mekong Delta. J. Sustain. Agric. 2012, 36, 859–872. [Google Scholar] [CrossRef]
- Lemaire, G.; Franzluebbers, A.; Carvalho, P.C.D.F.; Dedieu, B. Integrated crop–livestock systems: Strategies to achieve synergy between agricultural production and environmental quality. Agric. Ecosyst. Environ. 2014, 190, 4–8. [Google Scholar] [CrossRef]
- Nhan, D.K.; Verdegem, M.C.J.; Milstein, A.J.; Verreth, A.V. Water and nutrient budgets of ponds in integrated agriculture–aquaculture systems in the Mekong Delta, Vietnam. Aqua. Res. 2008, 39, 1216–1228. [Google Scholar] [CrossRef]
- Snow, A.M.; Ghaly, A.E.; Snow, A. A comparative assessment of hydroponically grown cereal crops for the purification of aquaculture wastewater and the production of fish feed. Am. J. Agric. Biol. Sci. 2008, 3, 364–378. [Google Scholar] [CrossRef]
- Graber, A.; Junge, R. Aquaponic systems: Nutrient recycling from fish wastewater by vegetable production. Desalination 2009, 246, 147–156. [Google Scholar] [CrossRef]
- Quynh, H.T.; Kazuto, S. Organic fertilizers in Vietnam’s markets: Nutrient composition and efficacy of their application. Sustainability 2018, 10, 2437. [Google Scholar] [CrossRef] [Green Version]
- Li, X.; Zhang, R.; Pang, Y. Characteristics of dairy manure composting with rice straw. Bioresour. Technol. 2008, 99, 359–367. [Google Scholar] [CrossRef]
- Karak, T.; Bhattacharyya, P.; Paul, R.K.; Das, T.; Saha, S.K. Evaluation of composts from agricultural wastes with fish pond sediment as bulking agent to improve compost quality. CLEAN Soil Air Water 2013, 41, 711–723. [Google Scholar] [CrossRef]
- Pouil, S.; Samsudin, R.; Slembrouck, J.; Sihabuddin, A.; Sundari, G.; Khazaidan, K.; Kristanto, A.H.; Pantjara, B.; Caruso, D. Nutrient budgets in a small-scale freshwater fish pond system in Indonesia. Aquaculture 2019, 504, 267–274. [Google Scholar] [CrossRef]
- Tham, H.T. Water Hyacinth (Eichhornia Crassipes) Biomass Production, Ensilability and Feeding Value to Growing Cattle. Ph.D. Thesis, Swedish University of Agricultural Sciences, Uppsala, Sweden, 2012. [Google Scholar]
- Thanh, X.B.; Hien, V.T.M.; Cong, T.T.; Da, C.T.; Berg, H. Reuse of sediment from catfish pond through composting with water hyacinth and rice straw. Sustain. Environ. Res. 2015, 25, 1–5. [Google Scholar]
- Saldarriaga, J.F.; Gallego, J.L.; López, J.E.; Aguado, R.; Olazar, M. Selecting monitoring variables in the manual composting of municipal solid waste based on principal component analysis. Waste Biomass Valoriz. 2019, 10, 1811–1819. [Google Scholar] [CrossRef]
- Hien, N.T. Organic Fertilizer: Biofertilizer and Compost Fertilizer; Institute for Research and Universalization for Encyclopedic Knowledge (IREUK): Hanoi, Vietnam, 2003. [Google Scholar]
- Dung, P.T.; Huong, D.T. Effect of Compost and Micro-Organic Fertilizers on Growth Performances and Yield of Cucumber in Organic Farming System in Gia Lam—Hanoi, Vietnam; Vietnam National University of Agriculture: Hanoi, Vietnam, 2012. [Google Scholar]
- McLean, E.O. Soil pH and lime requirement. In Methods of Soil Analysis. Part 2. Chemical and Microbiological Properties; Page, A.L., Miller, R.H., Keeney, D.R., Eds.; American Society of Agricultural Engineers: Madison, WI, USA, 1982; pp. 199–224. [Google Scholar]
- Cochrane, K.; De Young, C.; Soto, D.; Bahri, T. Climate change implications for fisheries and aquaculture; FAO of the United Nations: Rome, Italy, 2009. [Google Scholar]
- Molle, F.; Foran, T.; Käkönen, M. Contested waterscapes in the Mekong region: Hydropower, livelihoods and governance; Earthscan: Sterling, VA, USA, 2009. [Google Scholar]
- Hanjra, M.A.; Qureshi, M.E. Global water crisis and future food security in an era of climate change. Food Policy 2010, 35, 365–377. [Google Scholar] [CrossRef]
- Stirling, H.P. Chemical and Biological Methods of Water Analysis for Aquaculturists; Institute of Aquaculture, University of Stirling: Stirling, NJ, USA, 1985; 117p. [Google Scholar]
- Tirado, M.C.; Clarke, R.L.; Jaykus, A.; McQuatters-Gollop, A.; Frank, J.M. Climate change and food safety: A review. Food Res. Int. 2010, 43, 1745–1765. [Google Scholar] [CrossRef]
- Edwards, P. Environmental issues in integrated agriculture—Aquaculture in wastewater-fed fish culture systems. In Environment and Aquaculture in Developing Countries; Pullin, R.S.V., Rosenthal, H., Maclean, J.L., Eds.; International Center for Living Aquatic Resources Management: Makati, Philippines, 1993; Volume 31, pp. 139–170. [Google Scholar]
- Prein, M. Integration of aquaculture into crop–animal systems in Asia. Agric. Syst. 2002, 71, 127–146. [Google Scholar] [CrossRef]
- Roca-Pérez, L.; Martínez, C.; Marcilla, P.; Boluda, R. Composting rice straw with sewage sludge and compost effects on the soil–plant system. Chemosphere 2009, 75, 781–787. [Google Scholar] [CrossRef]
- Zayed, G.; Abdel-Motaal, H. Bio-active composts from rice straw enriched with rock phosphate and their effect on the phosphorous nutrition and microbial community in rhizosphere of cowpea. Bioresour. Technol. 2005, 96, 929–935. [Google Scholar] [CrossRef]
- Zhu, N.; Deng, C.; Xiong, Y.; Qian, H.Q. Performance characteristics of three aeration systems in the swine manure composting. Bioresour. Technol. 2004, 95, 319–326. [Google Scholar] [CrossRef]
- Abdelhamid, M.T.; Horiuchi, T.; Oba, S. Composting of rice straw with oilseed rape cake and poultry manure and its effects on Faba bean (Vicia Faba L.) growth and soil properties. Bioresour. Technol. 2004, 93, 183–189. [Google Scholar] [CrossRef]
- Tumuhairwe, J.B.; Tenywa, J.S.; Otabbong, E.; Ledin, S. Comparison of four low-technology composting methods for market crop wastes. Waste Manag. 2009, 29, 2274–2281. [Google Scholar] [CrossRef]
- Thunjai, T.; Boyd, C.E.; Boonyaratpalin, M. Bottom soil quality in tilapia ponds of different age in Thailand. Aqua. Res. 2004, 35, 698–705. [Google Scholar] [CrossRef]
- Karak, T. Heavy metal accumulation in soil amended with roadside pond sediment and uptake by rice (Oryza sativa L.). Commun. Soil Sci. Plant Anal. 2010, 41, 2577–2594. [Google Scholar] [CrossRef]
- Boyd, B.C.E.; Rajts, F.; Firth, J. Sludge management at Pangasius farm cuts discharges. Environmental and Social Responsibility. Available online: https://www.aquaculturealliance.org/advocate/sludge-management-pangasius-farm-cuts-discharges (accessed on 18 February 2020).
- Phung, V.C.; Nguyen, B.P.; Hoang, T.K.; Bell, R.W. Recycling of fishpond waste from rice cultivation in Cuu Long Delta, Vietnam. In Technologies and Management for Sustainable Biosystems; Nair, J., Furedy, C., Hoysala, C., Doelle, H., Eds.; Nova Science Publishers: New York, NY, USA, 2009; pp. 85–97. [Google Scholar]
- Phu, T.Q.; Tinh, T.K.; Giang, H.T. Reuse ability of bottom sediment from intensive catfish (Pangasianodon hypophthalmus) ponds for rice cultivation. J. Sci. Can Tho Univ. 2012, 24, 135–143. (In Vietnamese) [Google Scholar]
- Nguyen, P.Q.; Be, N.V.; Cong, N.V. Quantifying and qualifying sediment load from intensive catfish (Pangasianodon hypophthalmus) ponds and sediment application for vegetable-cultured (in Vietnamese). J. Sci. Can Tho Univ. 2014, 35, 78–89. [Google Scholar]
- Cofie, O.; Kone, D.; Rothenberger, S.; Moser, D.; Zubruegg, C. Co-composting of faecal sludge and organic solid waste for agriculture: Process dynamics. Water. Res. 2009, 43, 4665–4675. [Google Scholar] [CrossRef]
- Sun, X.; Wang, S.; Wang, J.; Lu, W.; Wang, H. Co-composting of night soil and green wastes. Comp. Sci. Util. 2012, 20, 254–259. [Google Scholar] [CrossRef]
- Zhu, N. Effect of low initial C/N ratio on aerobic composting of swine manure with rice straw. Biotechnology 2007, 98, 9–13. [Google Scholar] [CrossRef]
- NACA. Integrated Fish Farming in China; NACA Technical Manual 7; A World Food Day Publication of the Network of Aquaculture Centres in Asia and the Pacific: Bangkok, Thailand, 1989; 278p, Available online: www.idl-bnc-idrc.dspacedirect.org (accessed on 15 October 2019).
- Ghasem, S.; Morteza, A.S.; Maryam, T. Effect of organic fertilizers on cucumber (Cucumis sativus) yield. Int. J. Agric. Crop Sci. 2014, 7, 808–814. [Google Scholar]
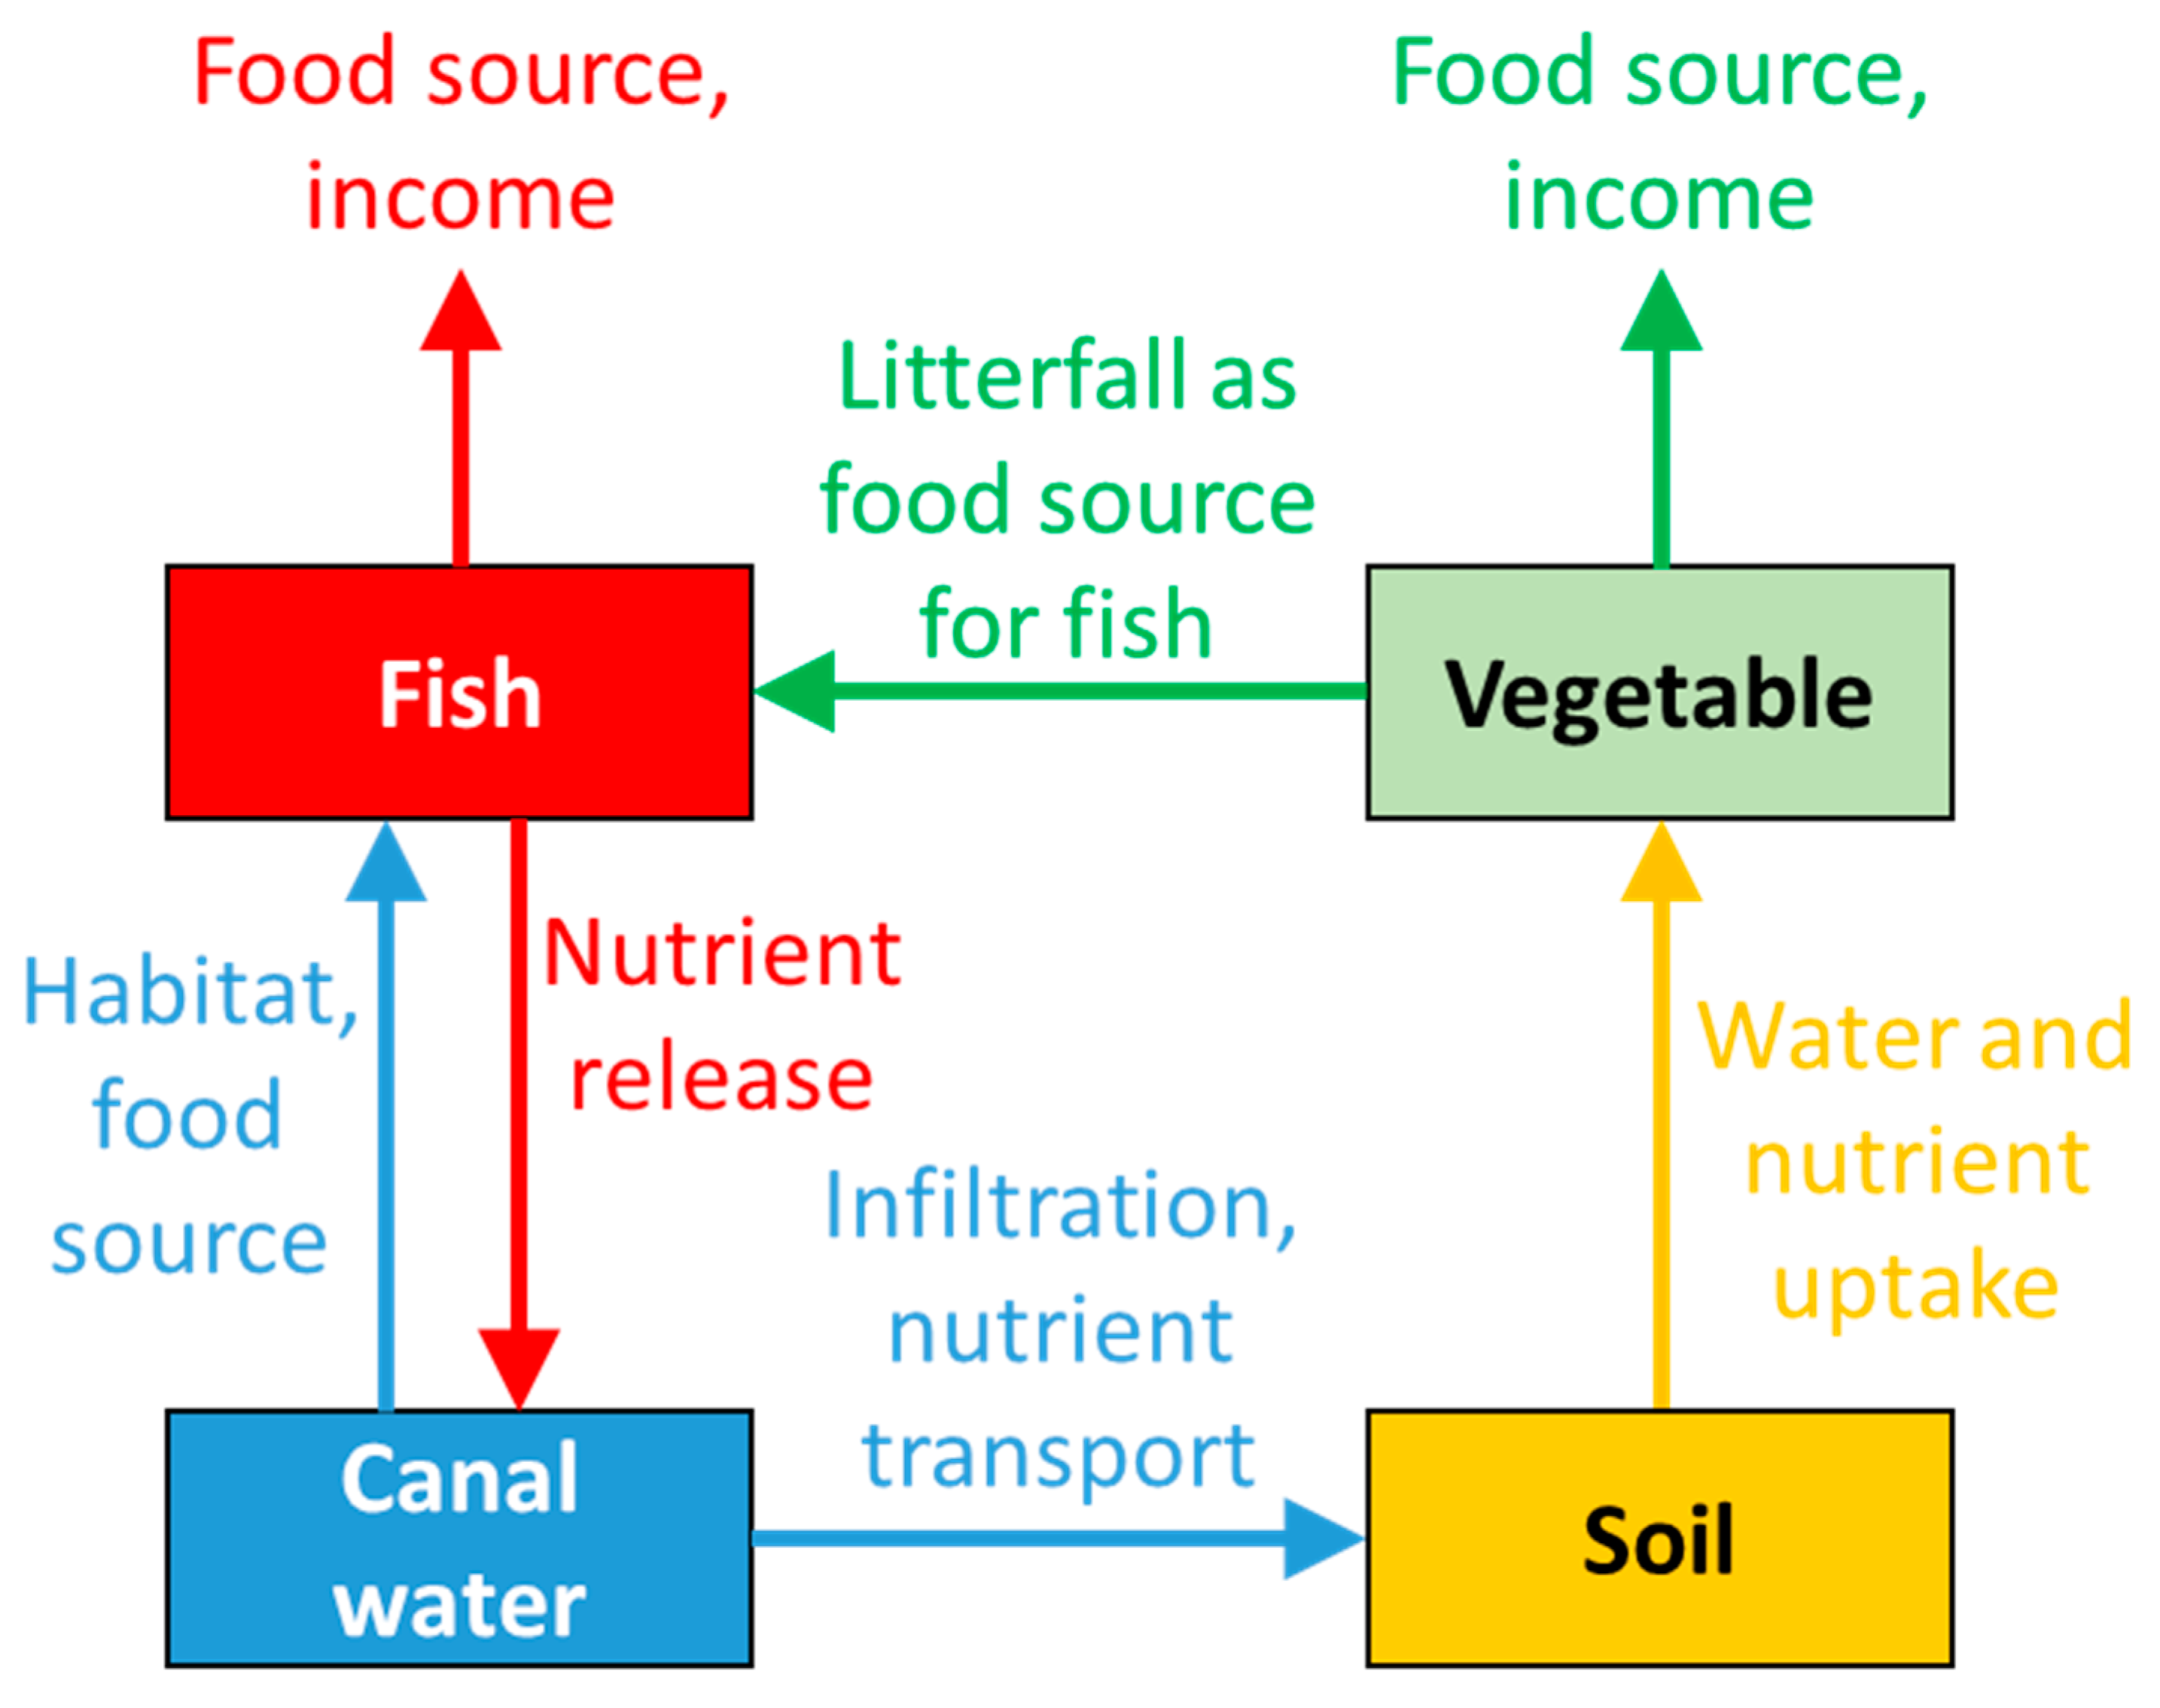
Figure 1.
Potential benefits of integrated fish and cucumber production.

Figure 2.
The work flow of experiments one and two. Light blue boxes represent activities included in experiment one; orange boxes are the activities of experiment two.
Figure 2.
The work flow of experiments one and two. Light blue boxes represent activities included in experiment one; orange boxes are the activities of experiment two.

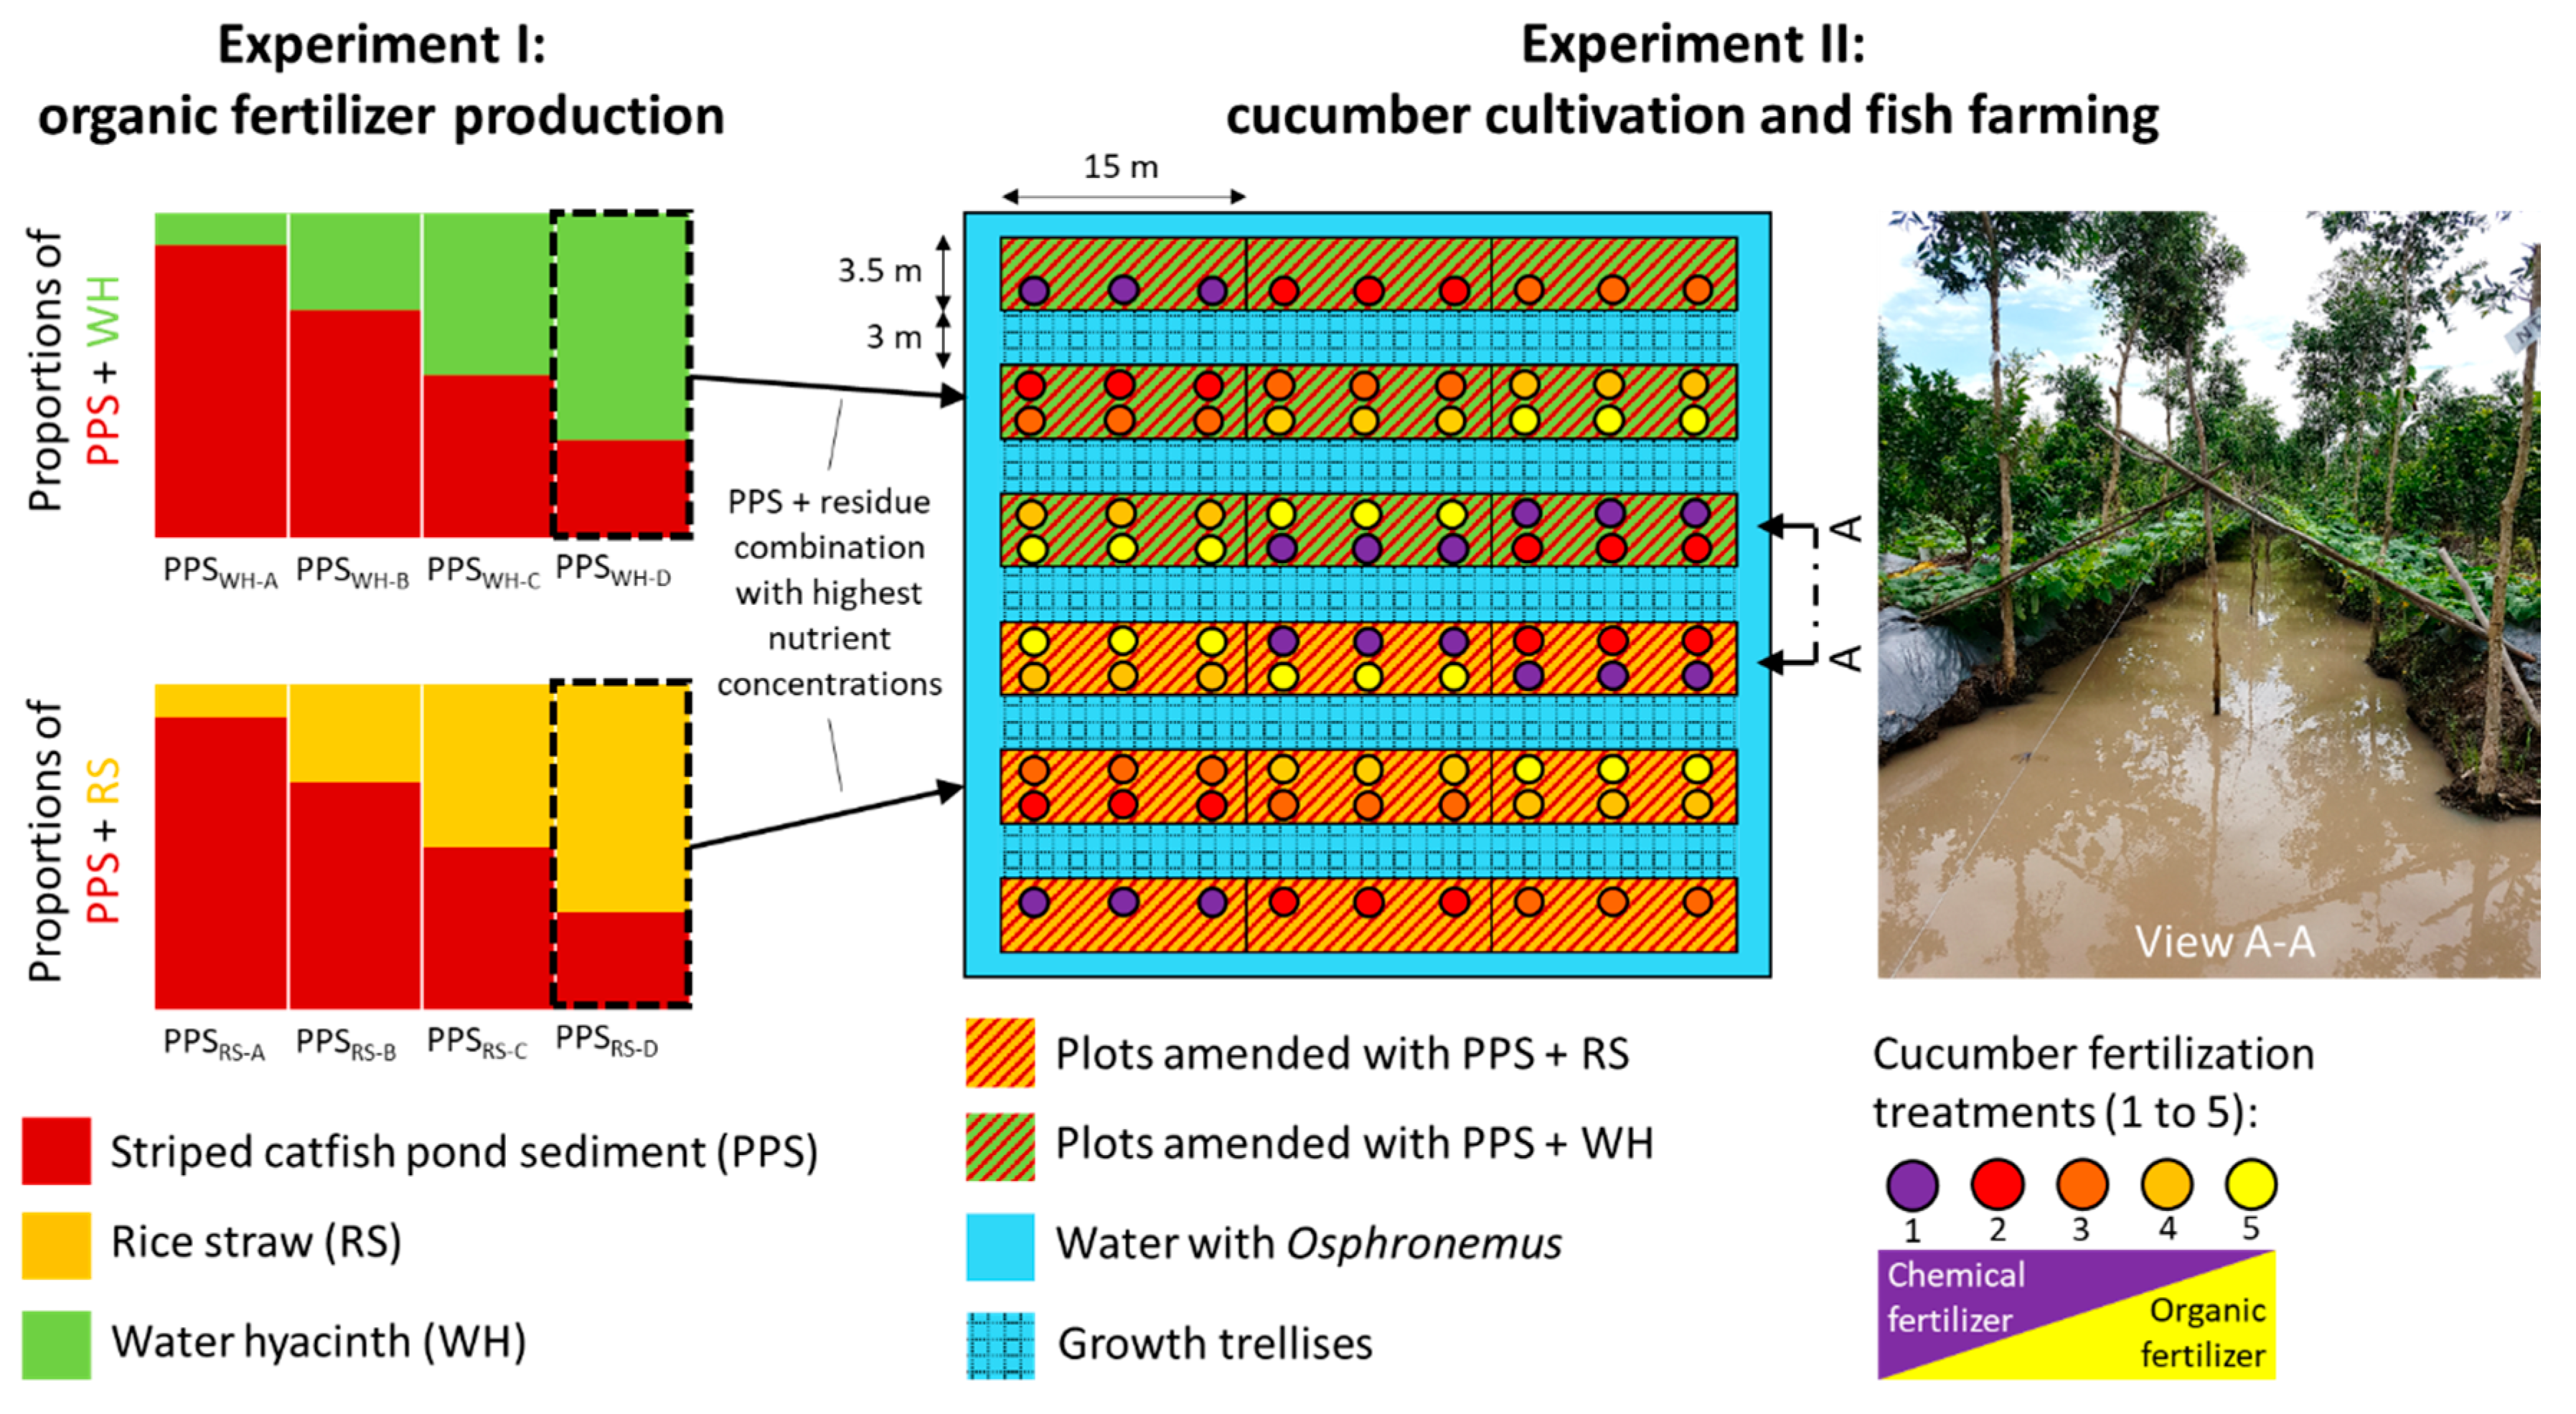
Figure 3.
Schematic of the organic fertilizer production in experiment one (left); and layout of the integrated cucumber–fish cultivation with the organic–chemical fertilizer combinations in experiment two (right). In the latter, three replicate plots were amended with different levels of fish pond sediments and water hyacinth (WH, green background) or rice straw (RS, orange background). The organic fertilizer levels are indicated by colored circles (increasing organic fertilizer amount from violet to yellow); note that circles do not indicate individual plants, which were planted at a higher density (40–45 cm apart). View A-A shows a canal with growth trellises.

Figure 4.
Plant traits as a function of total nitrogen input: (a) plant length, (b) leaf length, (c) leaf width, and (d) leaf number. Data were compared between each treatment (organic amendment made with rice straw (RS) or water hyacinth (WH)) and between growing seasons at 10 days after sowing. Vertical bars are standard errors (n = 3).

Figure 5.
Plant traits as a function of total nitrogen input: (a) plant length, (b) leaf length, (c) leaf width, and (d) leaf number. Data are compared between each treatment (organic amendment made with rice straw (RS) or water hyacinth (WH)) and between growing seasons at 20 days after sowing. Vertical bars are standard errors (n = 3).

Figure 6.
The top panels show the relationship between the total additions of (a) nitrogen; (b) phosphorus; and (c) potassium within the four treatments conducted within the study (organic amendment made with rice straw (RS) or water hyacinth (WH); wet or dry season). Second-degree polynomial curves were fitted to demonstrate the changing yield with increasing nutrient inputs and fractions derived from chemical and organic nutrient additions. Lower panels (d,e) present the percentage of nutrient inputs from the chemical fertilizer compared to the total nutrient additions for the nutrients in the corresponding upper plots.


Table 1.
Chemical composition of Pangasius pond sediments, rice straw, and common water hyacinth used in the first experiment, and soil where cucumber was grown before and after the second experiment.
Table 1.
Chemical composition of Pangasius pond sediments, rice straw, and common water hyacinth used in the first experiment, and soil where cucumber was grown before and after the second experiment.
| Parameters | Pond Sediments | Rice Straw | Water Hyacinth | Soil (Initial) | Soil (Final) |
|---|---|---|---|---|---|
| pH | 6.97 | - | - | 5.01 | 5.92 |
| Organic carbon (% C) | 4.51 | 47.31 | 40.19 | 5.17 | 5.24 |
| Total N (% N) | 0.35 | 0.81 | 2.32 | 0.28 | 0.30 |
| Total P (% P2O5) | 0.82 | - | 0.05 | 0.05 | 0.06 |
| Total K (% K2O) | 1.07 | 2.24 | 1.46 | 1.72 | 1.10 |
| Phosphate (Bray II) (PO43−, ppm) | 43.71 | - | - | 19.97 | 70.98 |
| Ammonium (NH4+, mg kg−1) | 37.16 | - | - | 13.76 | 325.0 |
| Nitrate (NO3−, mg kg−1) | 2.103 | - | - | 2.64 | 431.1 |
Note: All concentrations are expressed on a dry weight basis and all measurements refer to homogenized pooled samples.
Table 2.
Chemical composition of organic fertilizer produced from Pangasius pond sediments (PPS) mixed with rice straw (RS) or common water hyacinth (WH).
Table 2.
Chemical composition of organic fertilizer produced from Pangasius pond sediments (PPS) mixed with rice straw (RS) or common water hyacinth (WH).
| Parameters | PPS + RS (PPSRS) | PPS + WH (PPSWH) | ||||||
|---|---|---|---|---|---|---|---|---|
| PPSRS-10 | PPSRS-30 | PPSRS-50 | PPSRS-70 1 | PPSWH-10 | PPSWH-30 | PPSWH-50 | PPSWH-70 1 | |
| Plant residues (%) | 10 | 30 | 50 | 70 | 10 | 30 | 50 | 70 |
| Organic carbon (% C) | 6.03 | 11.70 | 11.39 | 16.68 | 6.53 | 10.11 | 9.94 | 16.54 |
| TN (% N) | 0.42 | 0.70 | 0.70 | 1.12 | 0.63 | 0.70 | 0.70 | 0.98 |
| TP (% P2O5) | 0.88 | 0.63 | 0.68 | 0.65 | 0.68 | 0.67 | 0.63 | 0.83 |
| TK (% K2O) | 22.75 | 26.63 | 25.98 | 24.90 | 25.46 | 26.39 | 26.53 | 24.58 |
| C/N | 14.36 | 16.71 | 16.27 | 14.89 | 10.41 | 14.44 | 14.20 | 16.88 |
Note: All concentrations are expressed as % on a dry weight basis and all measurements refer to homogenized pooled samples. 1 The organic fertilizer mixtures used in experiment two.
Table 3.
Chemical composition of the organic fertilizers obtained from Pangasius pond sediments mixed with rice straw (PPSRS) and with water hyacinth (PPSWH) that were used in the wet and dry season cucumber cultivation, as well as the national standards for organic fertilizer.
Table 3.
Chemical composition of the organic fertilizers obtained from Pangasius pond sediments mixed with rice straw (PPSRS) and with water hyacinth (PPSWH) that were used in the wet and dry season cucumber cultivation, as well as the national standards for organic fertilizer.
| Parameters | Wet Season | Dry Season | Standard for Organic Fertilizer 1 | ||
|---|---|---|---|---|---|
| PPSRS-70 | PPSWH-70 | PPSRS-70 | PPSWH-70 | ||
| pH | 6.85 | 7.38 | 7.35 | 7.26 | 6.0–8.0 |
| Organic carbon (% C) | 12.67 | 11.41 | 18.10 | 12.91 | >13 |
| TN (% N) | 1.33 | 0.77 | 1.05 | 0.91 | >2.5 |
| TP (% P2O5) | 0.84 | 1.14 | 1.36 | 1.80 | >2.5 |
| TK (% K2O) | 1.35 | 2.06 | 1.76 | 2.14 | >1.5 |
| C/N | 9.52 | 14.82 | 17.24 | 14.19 | - |
| Phosphate (Bray II) (PO43−, ppm) | 62.77 | 65.41 | 35.36 | 42.98 | - |
| Ammonium (NH4+, mg kg−1) | 34.49 | 7.12 | 50.42 | 12.10 | - |
Note: All concentrations are expressed on a dry weight basis and are obtained from pooled samples for each treatment. 1 Standard of organic fertilizer: industrial standard 10TCN 526: 2002 applied for microorganism organic fertilizer processing from domestic solid waste of Ministry of Agriculture and Rural Development, Vietnam (2002).
Table 4.
Composition and doses of chemical and organic fertilizers and total amount of nutrients (N−P−K) applied in the cucumber vegetable production during the wet and dry season growing periods.
Table 4.
Composition and doses of chemical and organic fertilizers and total amount of nutrients (N−P−K) applied in the cucumber vegetable production during the wet and dry season growing periods.
| Treatment | Fertilizer Composition (kg per Plot) | Total N-P-K from Chemical+PPSWH-70 Fertilizer Combinations (kg ha−1) | Total N-P-K from Chemical+PPSRS-70 Fertilizer Combinations (kg ha−1) | |||||||||||
|---|---|---|---|---|---|---|---|---|---|---|---|---|---|---|
| Wet Season | Dry Season | Wet Season | Dry Season | |||||||||||
| Chemical | Organic | N | P | K | N | P | K | N | P | K | N | P | K | |
| T1 | 4.5 | 0 | 171 | 147 | 95 | 171 | 147 | 95 | 171 | 147 | 95 | 171 | 147 | 95 |
| T2 | 3.4 | 25 | 137 | 116 | 79 | 130 | 112 | 73 | 134 | 118 | 83 | 134 | 121 | 84 |
| T3 | 2.3 | 50 | 102 | 85 | 64 | 89 | 77 | 50 | 96 | 88 | 71 | 98 | 95 | 72 |
| T4 | 1.2 | 75 | 68 | 53 | 48 | 47 | 42 | 28 | 59 | 58 | 61 | 61 | 69 | 61 |
| T5 | 0 | 100 | 30 | 19 | 30 | 23 | 30 | 39 | 17 | 25 | 46 | 20 | 40 | 48 |
Table 5.
Final yield (number of fruits or kg wet weight per treatment) of cucumber vegetable production in the integrated fish–farming system in each treatment and crop cycle.
Table 5.
Final yield (number of fruits or kg wet weight per treatment) of cucumber vegetable production in the integrated fish–farming system in each treatment and crop cycle.
| Crop | Fruit | RS | WH | ||||||||
|---|---|---|---|---|---|---|---|---|---|---|---|
| T1 | T2 | T3 | T4 | T5 | T1 | T2 | T3 | T4 | T5 | ||
| Wet Season | Tot No. of fruit | 4380 | 6001 | 6596 | 5826 | 3323 | 3517 | 5536 | 6091 | 5981 | 2992 |
| Tot fruit weight (kg) | 364 | 491.8 | 549.9 | 489.1 | 249.4 | 317 | 459.1 | 510.6 | 459.5 | 230.8 | |
| Dry Season | Tot No. of fruit | 3288 | 3425 | 3903 | 3248 | 2114 | 2935 | 3608 | 3359 | 3389 | 2311 |
| Tot fruit weight (kg) | 344.4 | 355.9 | 393.3 | 340.5 | 190.7 | 292.3 | 350.9 | 352.4 | 332.2 | 209.4 | |
© 2020 by the authors. Licensee MDPI, Basel, Switzerland. This article is an open access article distributed under the terms and conditions of the Creative Commons Attribution (CC BY) license (http://creativecommons.org/licenses/by/4.0/).
Share and Cite
MDPI and ACS Style
Thi Da, C.; Anh Tu, P.; Livsey, J.; Tang, V.T.; Berg, H.; Manzoni, S. Improving Productivity in Integrated Fish-Vegetable Farming Systems with Recycled Fish Pond Sediments. Agronomy 2020, 10, 1025. https://doi.org/10.3390/agronomy10071025
AMA Style
Thi Da C, Anh Tu P, Livsey J, Tang VT, Berg H, Manzoni S. Improving Productivity in Integrated Fish-Vegetable Farming Systems with Recycled Fish Pond Sediments. Agronomy. 2020; 10(7):1025. https://doi.org/10.3390/agronomy10071025
Chicago/Turabian StyleThi Da, Chau, Phan Anh Tu, John Livsey, Van Tai Tang, Håkan Berg, and Stefano Manzoni. 2020. "Improving Productivity in Integrated Fish-Vegetable Farming Systems with Recycled Fish Pond Sediments" Agronomy 10, no. 7: 1025. https://doi.org/10.3390/agronomy10071025
Note that from the first issue of 2016, this journal uses article numbers instead of page numbers. See further details here.