High-Resolution Temperature Variability Reconstructed from Black Pine Tree Ring Densities in Southern Spain

 ,
,  , , and
Abstract
:1. Introduction
2. Materials and Methods
2.1. Tree-Ring Data and Detrending
2.2. Climate Data, Calibration and Transfer
3. Results and Discussion
3.1. Cazorla MXD Chronologies and Effects of Data Truncation
3.2. MXD Climate Signals and Uncertainties
3.3. Outlier Effects on Proxy Calibration
3.4. Temperature Reconstruction and Benchmarking
4. Conclusions
Supplementary Materials
Author Contributions
Funding
Acknowledgments
Conflicts of Interest
References
- Rohde, R.; Muller, R.; Jacobsen, R.; Perlmutter, S.; Rosenfeld, A.; Wurtele, J.; Curry, J.; Wickham, C.; Mosher, S. Berkeley earth temperature averaging process. Geoinform. Geostat. Overv. 2013, 1, 1–13. [Google Scholar] [CrossRef]
- Ruiz Sinoga, J.D.; Garcia Marin, R.; Martinez Murillo, J.F.; Gabarron Galeote, M.A. Precipitation dynamics in southern Spain: Trends and cycles. Int. J. Climatol. 2011, 31, 2281–2289. [Google Scholar] [CrossRef]
- Li, W.; Li, L.; Ting, M.; Liu, Y. Intensification of Northern Hemisphere subtropical highs in a warming climate. Nat. Geosci. 2012, 5, 830–834. [Google Scholar] [CrossRef]
- Gao, X.; Giorgi, F. Increased aridity in the Mediterranean region under greenhouse gas forcing estimated from high resolution simulations with a regional climate model. Glob. Planet. Chang. 2008, 62, 195–209. [Google Scholar] [CrossRef]
- Hertig, E.; Jacobeit, J. Downscaling future climate change: Temperature scenarios for the Mediterranean area. Glob. Planet. Chang. 2008, 63, 127–131. [Google Scholar] [CrossRef]
- Sánchez, E.; Gallardo, C.; Gaertner, M.A.; Arribas, A.; Castro, M. Future climate extreme events in the Mediterranean simulated by a regional climate model: A first approach. Glob. Planet. Chang. 2004, 44, 163–180. [Google Scholar] [CrossRef]
- Büntgen, U.; Frank, D.; Grudd, H.; Esper, J. Long-term summer temperature variations in the Pyrenees. Clim. Dyn. 2008, 31, 615–631. [Google Scholar] [CrossRef] [Green Version]
- Esper, J.; Großjean, J.; Camarero, J.J.; García-Cervigón, A.I.; Olano, J.M.; González-Rouco, J.F.; Domínquez-Castro, F.; Büntgen, U. Atlantic and Mediterranean synoptic drivers of central Spanish juniper growth. Theor. Appl. Climatol. 2015, 121, 571–579. [Google Scholar] [CrossRef]
- Galván, J.D.; Camarero, J.J.; Gutiérrez, E. Seeing the trees for the forest: Drivers of individual growth responses to climate in Pinus uncinata mountain forests. J. Ecol. 2014, 102, 1244–1257. [Google Scholar] [CrossRef]
- Barriendos, M. Climatic variations in the Iberian Peninsula during the late Maunder Minimum (AD 1675–1715): An analysis of data from rogation ceremonies. Holocene 1997, 7, 105–111. [Google Scholar] [CrossRef]
- Barriendos, M.; Rodrigo, F.S. Study of historical flood events on Spanish rivers using documentary data Study of historical flood events on Spanish rivers using documentary data. Hydrol. Sci. J. 2006, 51, 765–783. [Google Scholar] [CrossRef] [Green Version]
- Tejedor, E.; De Luis, M.; Barriendos, M.; Cuadrat, J.M.; Luterbacher, J.; Saz, M.Á. Rogation ceremonies: A key to understanding past drought variability in northeastern Spain since 1650. Clim. Past. 2019, 15, 1647–1664. [Google Scholar] [CrossRef] [Green Version]
- Benito, G.; Díez-Herrero, A.; De Villalta, M.F. Magnitude and frequency of flooding in the Tagus basin (Central Spain) over the last millennium. Clim. Chang. 2003, 58, 171–192. [Google Scholar] [CrossRef]
- Rodrigo, F.S.; Barriendos, M. Reconstruction of seasonal and annual rainfall variability in the Iberian peninsula (16th–20th centuries) from documentary data. Glob. Plan. Chang. 2008, 63, 243–257. [Google Scholar] [CrossRef]
- Barriendos, M.; Guirado, S.G.; Gonzalez, D.P.; Tuset, J.; Morales, A.P.; Alberola, A.; Costa, J.; Balasch, J.C.; Castelltort, X.; Bueso, J.M.; et al. Climatic and social factors behind the Spanish Mediterranean flood event chronologies from documentary sources (14th–20th centuries). Glob. Planet. Chang. 2019, 182, 102997. [Google Scholar] [CrossRef]
- Büntgen, U.; Frank, D.; Trouet, V.; Esper, J. Diverse climate sensitivity of Mediterranean tree-ring width and density. Trees 2010, 24, 261–273. [Google Scholar] [CrossRef] [Green Version]
- Tejedor, E.; de Luis, M.; Cuadrat, J.M.; Esper, J.; Saz, M.Á. Tree-ring-based drought reconstruction in the Iberian Range (east of Spain) since 1694. Int. J. Biometeor. 2016, 60, 361–372. [Google Scholar] [CrossRef] [Green Version]
- Esper, J.; Schneider, L.; Smerdon, J.; Schöne, B.; Büntgen, U. Signals and memory in tree-ring width and density data. Dendrochronologia 2015, 35, 62–70. [Google Scholar] [CrossRef] [Green Version]
- Büntgen, U.; Krusic, P.J.; Verstege, A.; Sangüesa-Barreda, G.; Wagner, S.; Camarero, J.J.; Ljungqvist, F.C.; Zorita, E.; Oppenheimer, C.; Konter, O.; et al. New tree-ring evidence from the Pyrenees reveals Western Mediterranean climate variability since medieval times. J. Clim. 2017, 30, 5295–5318. [Google Scholar] [CrossRef]
- Dorado-Liñán, I.; Büntgen, U.; González-Rouco, J.F.; Zorita, E.; Montavez, J.P.; Gómez-Navarro, J.J.; Brunet, M.; Heinrich, I.; Helle, G.; Gutiérrez, E. Estimating 750 years of temperature variations and uncertainties in the Pyrenees by tree-ring reconstructions and climate simulations. Clim. Past 2012, 8, 919–933. [Google Scholar] [CrossRef] [Green Version]
- Esper, J.; Konter, O.; Krusic, P.J.; Saurer, M.; Holzkämper, S.; Büntgen, U. Long-term summer temperature variations in the Pyrenees from detrended stable carbon isotopes. Geochronometria 2015, 42, 53–59. [Google Scholar] [CrossRef] [Green Version]
- Sangüesa-Barreda, G.; Camarero, J.J.; Esper, J.; Galvan, J.D.; Büntgen, U. A millennium-long perspective on high-elevation pine recruitment in the Spanish central Pyrenees. Can. J. For. Res. 2018, 48, 1108–1113. [Google Scholar] [CrossRef]
- Tejedor, E.; Saz, M.A.; Esper, J.; Cuadrat, J.M.; de Luis, M. Summer drought reconstruction in northeastern Spain inferred from a tree ring latewood network since 1734. Geophys. Res. Lett. 2017, 44, 8492–8500. [Google Scholar] [CrossRef] [Green Version]
- Linares, J.C.; Tíscar, P.A. Climate change impacts and vulnerability of the southern populations of Pinus nigra subsp. salzmannii. Tree Physiol. 2010, 30, 795–806. [Google Scholar] [CrossRef] [PubMed] [Green Version]
- Domínguez-Delmás, M.; Alejano-Monge, R.; Wazny, T.; González, I.G. Radial growth variations of black pine along an elevation gradient in the Cazorla Mountains (South of Spain) and their relevance for historical and environmental studies. Eur. J. For. Res. 2013, 132, 635–652. [Google Scholar] [CrossRef]
- Dorado Liñán, I.; Gutiérrez, E.; Andreu-Hayles, L.; Heinrich, I.; Helle, G. Potential to explain climate from tree rings in the south of the Iberian Peninsula. Clim. Res. 2012, 55, 119–134. [Google Scholar] [CrossRef] [Green Version]
- Dorado Liñán, I.; Zorita, E.; González-Rouco, J.F.; Heinrich, I.; Campello, F.; Muntán, E.; Andreu-Hayles, L.; Gutiérrez, E. Eight-hundred years of summer temperature variations in the southeast of the Iberian Peninsula reconstructed from tree rings. Clim. Dyn. 2015, 44, 75–93. [Google Scholar] [CrossRef]
- Glueck, M.F.; Stockton, C.W. Reconstruction of the North Atlantic Oscillation, 1429–1983. Int. J. Climatol. 2001, 21, 1453–1465. [Google Scholar] [CrossRef]
- Esper, J.; Büntgen, U.; Frank, D.C.; Nievergelt, D.; Treydte, K.; Verstege, A. Multiple tree-ring parameters from Atlas cedar (Morocco) and their climatic signal. Trace 2006, 4, 46–55. [Google Scholar]
- Esper, J.; Frank, D.C.; Büntgen, U.; Verstege, A.; Luterbacher, J.; Xoplaki, E. Long-term drought severity variations in Morocco. Geophys. Res. Lett. 2007, 34, L17702. [Google Scholar] [CrossRef] [Green Version]
- Björklund, J.; Von Arx, G.; Nievergelt, D.; Wilson, R.; Bulcke, J.V.D.; Günther, B.; Loader, N.J.; Rydval, M.; Fonti, P.; Scharnweber, T.; et al. Scientific merits and analytical challenges of tree-ring densitometry. Rev. Geophys. 2019, 57, 1224–1264. [Google Scholar] [CrossRef] [Green Version]
- Eschbach, W.; Nogler, P.; Schär, E.; Schweingruber, F.H. Technical advances in the radiodensitometrical determination of wood density. Dendrochronologia 1995, 13, 155–168. [Google Scholar]
- Schweingruber, F.H.; Fritts, H.C.; Bräker, O.U.; Drew, L.G.; Schär, E. The X-ray technique as applied to dendroclimatology. Tree-Ring Bull. 1978, 38, 61–91. [Google Scholar]
- Fang, K.; Gou, X.; Peters, K.; Li, J.; Zhang, F. Removing biological trends from tree-ring series: Testing modified Hugershoff curves. Tree-Ring Res. 2010, 66, 51–59. [Google Scholar] [CrossRef] [Green Version]
- Esper, J.; Frank, D.C.; Timonen, M.; Zorita, E.; Wilson, R.; Luterbacher, J.; Holzkämper, S.; Fischer, N.; Wagner, S.; Nievergelt, D.; et al. Orbital forcing of tree-ring data. Nat. Clim. Chang. 2012, 2, 862–866. [Google Scholar] [CrossRef]
- Esper, J.; Düthorn, E.; Krusic, P.; Timonen, M.; Büntgen, U. Northern European summer temperature variations over the Common Era from integrated tree-ring density records. J. Quat. Sci. 2014, 29, 487–494. [Google Scholar] [CrossRef]
- Briffa, K.R.; Jones, P.D.; Bartholin, T.S.; Eckstein, D.; Schweingruber, F.H.; Karlén, W.; Zetterberg, P.; Eronen, M. Fennoscandian summers from AD 500: Temperature changes on short and long timescales. Clim. Dyn. 1992, 7, 111–119. [Google Scholar] [CrossRef]
- Esper, J.; Cook, E.R.; Krusic, P.J.; Peters, K.; Schweingruber, F.H. Tests of the RCS method for preserving low-frequency variability in long tree-ring chronologies. Tree-Ring Res. 2003, 59, 81–98. [Google Scholar]
- Esper, J.; Krusic, P.J.; Ljungqvist, F.C.; Luterbacher, J.; Carrer, M.; Cook, E.; Davi, N.K.; Hartl, C.; Kirdyanov, A.; Konter, O.; et al. Ranking of tree-ring based temperature reconstructions of the past millennium. Quat. Sci. Rev. 2016, 145, 134–151. [Google Scholar] [CrossRef] [Green Version]
- Briffa, K.R.; Osborn, T.J.; Schweingruber, F.H.; Harris, I.C.; Jones, P.D.; Shiyatov, S.G.; Vaganov, E.A. Low-frequency temperature variations from a northern tree ring density network. J. Geophys. Res. Atmos. 2001, 106, 2929–2941. [Google Scholar] [CrossRef]
- Cook, E.R.; Kairiukstis, L.A. Methods of Dendrochronology. Applications in the Environmental Science, 1st ed.; Kluwer: Dordrecht, The Netherlands, 1990. [Google Scholar]
- Wigley, T.M.L.; Briffa, K.R.; Jones, P.D. On the average of correlated time series, with applications in dendroclimatology and hydrometeorology. J. Clim. Appl. Meteorol. 1984, 23, 201–213. [Google Scholar] [CrossRef]
- Trouet, V.; Van Oldenborgh, G.J. KNMI Climate Explorer: A web-based research tool for high-resolution paleoclimatology. Tree-Ring Res. 2013, 69, 3–13. [Google Scholar] [CrossRef] [Green Version]
- Hansen, J.; Ruedy, R.; Sato, M.; Lo, K. Global surface temperature change. Rev. Geophys. 2010, 48, 4. [Google Scholar] [CrossRef] [Green Version]
- Harris, I.; Jones, P.D.; Osborn, T.J.; Lister, D.H. Updated high-resolution grids of monthly climatic observations–the CRU TS3.10 dataset. Int. J. Climatol. 2014, 34, 623–642. [Google Scholar] [CrossRef] [Green Version]
- Cook, E.R.; Briffa, K.R.; Jones, P.D. Spatial regression methods in dendroclimatology: A review and comparison of two techniques. Int. J. Climatol. 1994, 14, 379–402. [Google Scholar] [CrossRef]
- Durbin, J.; Watson, G.S. Testing for serial correlation in least squares regression. II. Biometrika 1951, 38, 159–178. [Google Scholar] [CrossRef]
- Anchukaitis, K.J.; Breitenmoser, P.; Briffa, K.R.; Buchwal, A.; Büntgen, U.; Cook, E.R.; D’Arrigo, R.D.; Esper, J.; Evans, M.N.; Frank, D.; et al. Tree rings and volcanic cooling. Nat. Geosci. 2012, 5, 836–837. [Google Scholar] [CrossRef] [Green Version]
- Esper, J.; Büntgen, U.; Luterbacher, J.; Krusic, P. Testing the hypothesis of post-volcanic missing rings in temperature sensitive dendrochronological data. Dendrochronologia 2013, 31, 216–222. [Google Scholar] [CrossRef]
- Esper, J.; Schneider, L.; Krusic, P.J.; Luterbacher, J.; Büntgen, U.; Timonen, M.; Sirocko, F.; Zorita, E. European summer temperature response to annually dated volcanic eruptions over the past nine centuries. Bull. Volcanol. 2013, 75, 736. [Google Scholar] [CrossRef] [Green Version]
- Sigl, M.; Winstrup, M.; Mcconnell, J.R.; Welten, K.C.; Plunkett, G.; Ludlow, F.; Büntgen, U.; Caffee, M.W.; Chellman, N.; Dahl-Jensen, D.; et al. Timing and climate forcing of volcanic eruptions for the past 2500 years. Nature 2015, 523, 543–549. [Google Scholar] [CrossRef] [Green Version]
- Toohey, M.; Sigl, M. Volcanic stratospheric sulfur injections and aerosol optical depth from 500 BCE to 1900 CE. Earth Syst. Sci. Data 2017, 9, 809–831. [Google Scholar] [CrossRef] [Green Version]
- Ljungqvist, F.C.; Piermattei, A.; Seim, A.; Krusic, P.J.; Büntgen, U.; He, M.; Kirdyanov, V.A.; Luterbacher, J.; Schneider, L.; Seftigen, K.; et al. Ranking of tree-ring based hydroclimate reconstructions of the past millennium. Quat. Sci. Rev. 2020, 230, 106074. [Google Scholar] [CrossRef]
- Esper, J.; Krusic, P.; Peters, K.; Frank, D. Exploration of long-term growth changes using the tree-ring detrending program Spotty. Dendrochronologia 2009, 27, 75–82. [Google Scholar] [CrossRef]
- Melvin, T.M.; Briffa, K.R. A “signal-free” approach to dendroclimatic standardisation. Dendrochronologia 2008, 26, 71–86. [Google Scholar] [CrossRef]
- Büntgen, U.; Raible, C.C.; Frank, D.; Helama, S.; Cunningham, L.; Hofer, D.; Nievergelt, D.; Verstege, A.; Timonen, M.; Stenseth, N.C.; et al. Causes and consequences of past and projected Scandinavian summer temperatures, 500–2100 AD. PLoS ONE 2011, 6, 9. [Google Scholar] [CrossRef] [Green Version]
- Briffa, K.R.; Schweingruber, F.H.; Jones, P.D.; Osborn, T.J.; Shiyatov, S.G.; Vaganov, E.A. Reduced sensitivity of recent tree-growth to temperature at high northern latitudes. Nature 1998, 391, 678–682. [Google Scholar] [CrossRef]
- Frank, D.; Esper, J. Characterization and climate response patterns of a high-elevation, multi-species tree-ring network in the European Alps. Dendrochronologia 2005, 22, 107–121. [Google Scholar] [CrossRef]
- Esper, J.; Klippel, L.; Krusic, P.J.; Konter, O.; Raible, C.; Xoplaki, E.; Luterbacher, J.; Büntgen, U. Eastern Mediterranean summer temperatures since 730 CE from Mt. Smolikas tree-ring densities. Clim. Dyn. 2020, 54, 1367–1382. [Google Scholar] [CrossRef]
- Büntgen, U.; Frank, D.C.; Nievergelt, D.; Esper, J. Summer temperature variations in the European Alps, A.D. 755–2004. J. Clim. 2006, 19, 5606–5623. [Google Scholar]
- Schweingruber, F.H.; Bartholin, T.; Schär, E.; Briffa, K.R. Radiodensitometric-dendroclimatological conifer chronologies from Lapland (Scandinavia) and the Alps (Switzerland). Boreas 1988, 17, 559–566. [Google Scholar] [CrossRef]
- Schneider, L.; Esper, J.; Timonen, M.; Büntgen, U. Detection and evaluation of an early divergence problem in Northern Fennoscandian tree-ring data. Oikos 2013, 123, 559–566. [Google Scholar] [CrossRef]
- Böhm, R.; Auer, I.; Brunetti, M.; Maugeri, M.; Nanni, T.; Schöner, W. Regional temperature variability in the European Alps: 1760–1998 from homogenized instrumental time series. Int. J. Climatol. 2001, 21, 1779–1801. [Google Scholar] [CrossRef]
- Böhm, R.; Jones, P.D.; Hiebl, J.; Frank, D.; Brunetti, M.; Maugeri, M. The early instrumental warm-bias: A solution for long central European temperature series 1760–2007. Clim. Chang. 2010, 101, 41–67. [Google Scholar] [CrossRef]
- Dienst, M.; Lindén, J.; Engström, E.; Esper, J. Removing the relocation bias from the 155-year Haparanda temperature record in Northern Europe. Int. J. Climatol. 2017, 37, 4015–4026. [Google Scholar] [CrossRef]
- Dienst, M.; Linden, J.; Esper, J. Determination of the urban heat island intensity in villages and its connection to land cover in three European climate zones. Clim. Res. 2018, 76, 1–15. [Google Scholar] [CrossRef]
- Dienst, M.; Lindén, J.; Saladié, O.; Esper, J. Detection and elimination of UHI effects in long temperature records from villages – A case study from Tivissa, Spain. Urban Clim. 2019, 27, 372–383. [Google Scholar] [CrossRef]
- Hansen, J.; Ruedy, R.; Sato, M.; Imhoff, M.; Lawrence, W.; Easterling, D.; Peterson, T.; Karl, T. A closer look at United States and global surface temperature change. J. Geophys. Res. Atmos. 2001, 106, 23947–23963. [Google Scholar] [CrossRef] [Green Version]
- Sr., R.A.P.; Davey, C.A.; Niyogi, D.; Fall, S.; Steinweg-Woods, J.; Hubbard, K.; Lin, X.; Cai, M.; Lim, Y.-K.; Li, H.; et al. Unresolved issues with the assessment of multidecadal global land surface temperature trends. J. Geophys. Res. Atmos. 2007, 112, D24. [Google Scholar]
- Rizwan, A.M.; Dennis, L.Y.C.; Liu, C. A review on the generation, determination and mitigation of Urban Heat Island. J. Environ. Sci. 2008, 20, 120–128. [Google Scholar] [CrossRef]
- Smith, T.M.; Reynolds, R.W.; Peterson, T.C.; Lawrimore, J. Improvements to NOAA’s historical merged land–ocean surface temperature analysis (1880–2006). J. Clim. 2008, 21, 2283–2296. [Google Scholar] [CrossRef]
- Menne, M.J.; Durre, I.; Vose, R.S.; Gleason, B.E.; Houston, T.G. An overview of the global historical climatology network-daily database. J. Atmos. Ocean Technol. 2012, 29, 897–910. [Google Scholar] [CrossRef]
- Esper, J.; Frank, D.C.; Wilson, R.J.S.; Briffa, K.R. Effect of scaling and regression on reconstructed temperature amplitude for the past millennium. Geophys. Res. Lett. 2005, 32, 7. [Google Scholar] [CrossRef] [Green Version]
- Luterbacher, J.; Pfister, C. The year without a summer. Nat. Geosci. 2015, 8, 246–248. [Google Scholar] [CrossRef]
- Hartl-Meier, C.; Büntgen, U.; Smerdon, J.E.; Zorita, E.; Krusic, P.J.; Ljungqvist, F.C.; Schneider, L.; Esper, J. Temperature covariance in tree-ring reconstructions and climate model simulations over the past millennium. Geophys. Res. Lett. 2017, 44, 9458–9469. [Google Scholar] [CrossRef] [Green Version]
- Usoskin, I.G.; Mursula, K.; Kovaltsov, G.A. Lost sunspot cycle in the beginning of Dalton minimum: New evidence and consequences. Geophys. Res. Lett. 2002, 29, 36-1–36-4. [Google Scholar] [CrossRef] [Green Version]
- Esper, J.; Büntgen, U.; Hartl-Meier, C.; Oppenheimer, C.; Schneider, L. Northern Hemisphere temperature anomalies during the 1450s period of ambiguous volcanic forcing. Bull. Volcanol. 2017, 79, 41. [Google Scholar] [CrossRef]
- Frank, D.; Esper, J.; Cook, E.R. Adjustment for proxy number and coherence in a large-scale temperature reconstruction. Geophys. Res. Lett. 2007, 34, 16. [Google Scholar] [CrossRef] [Green Version]


| CNP MXD Data | |||
|---|---|---|---|
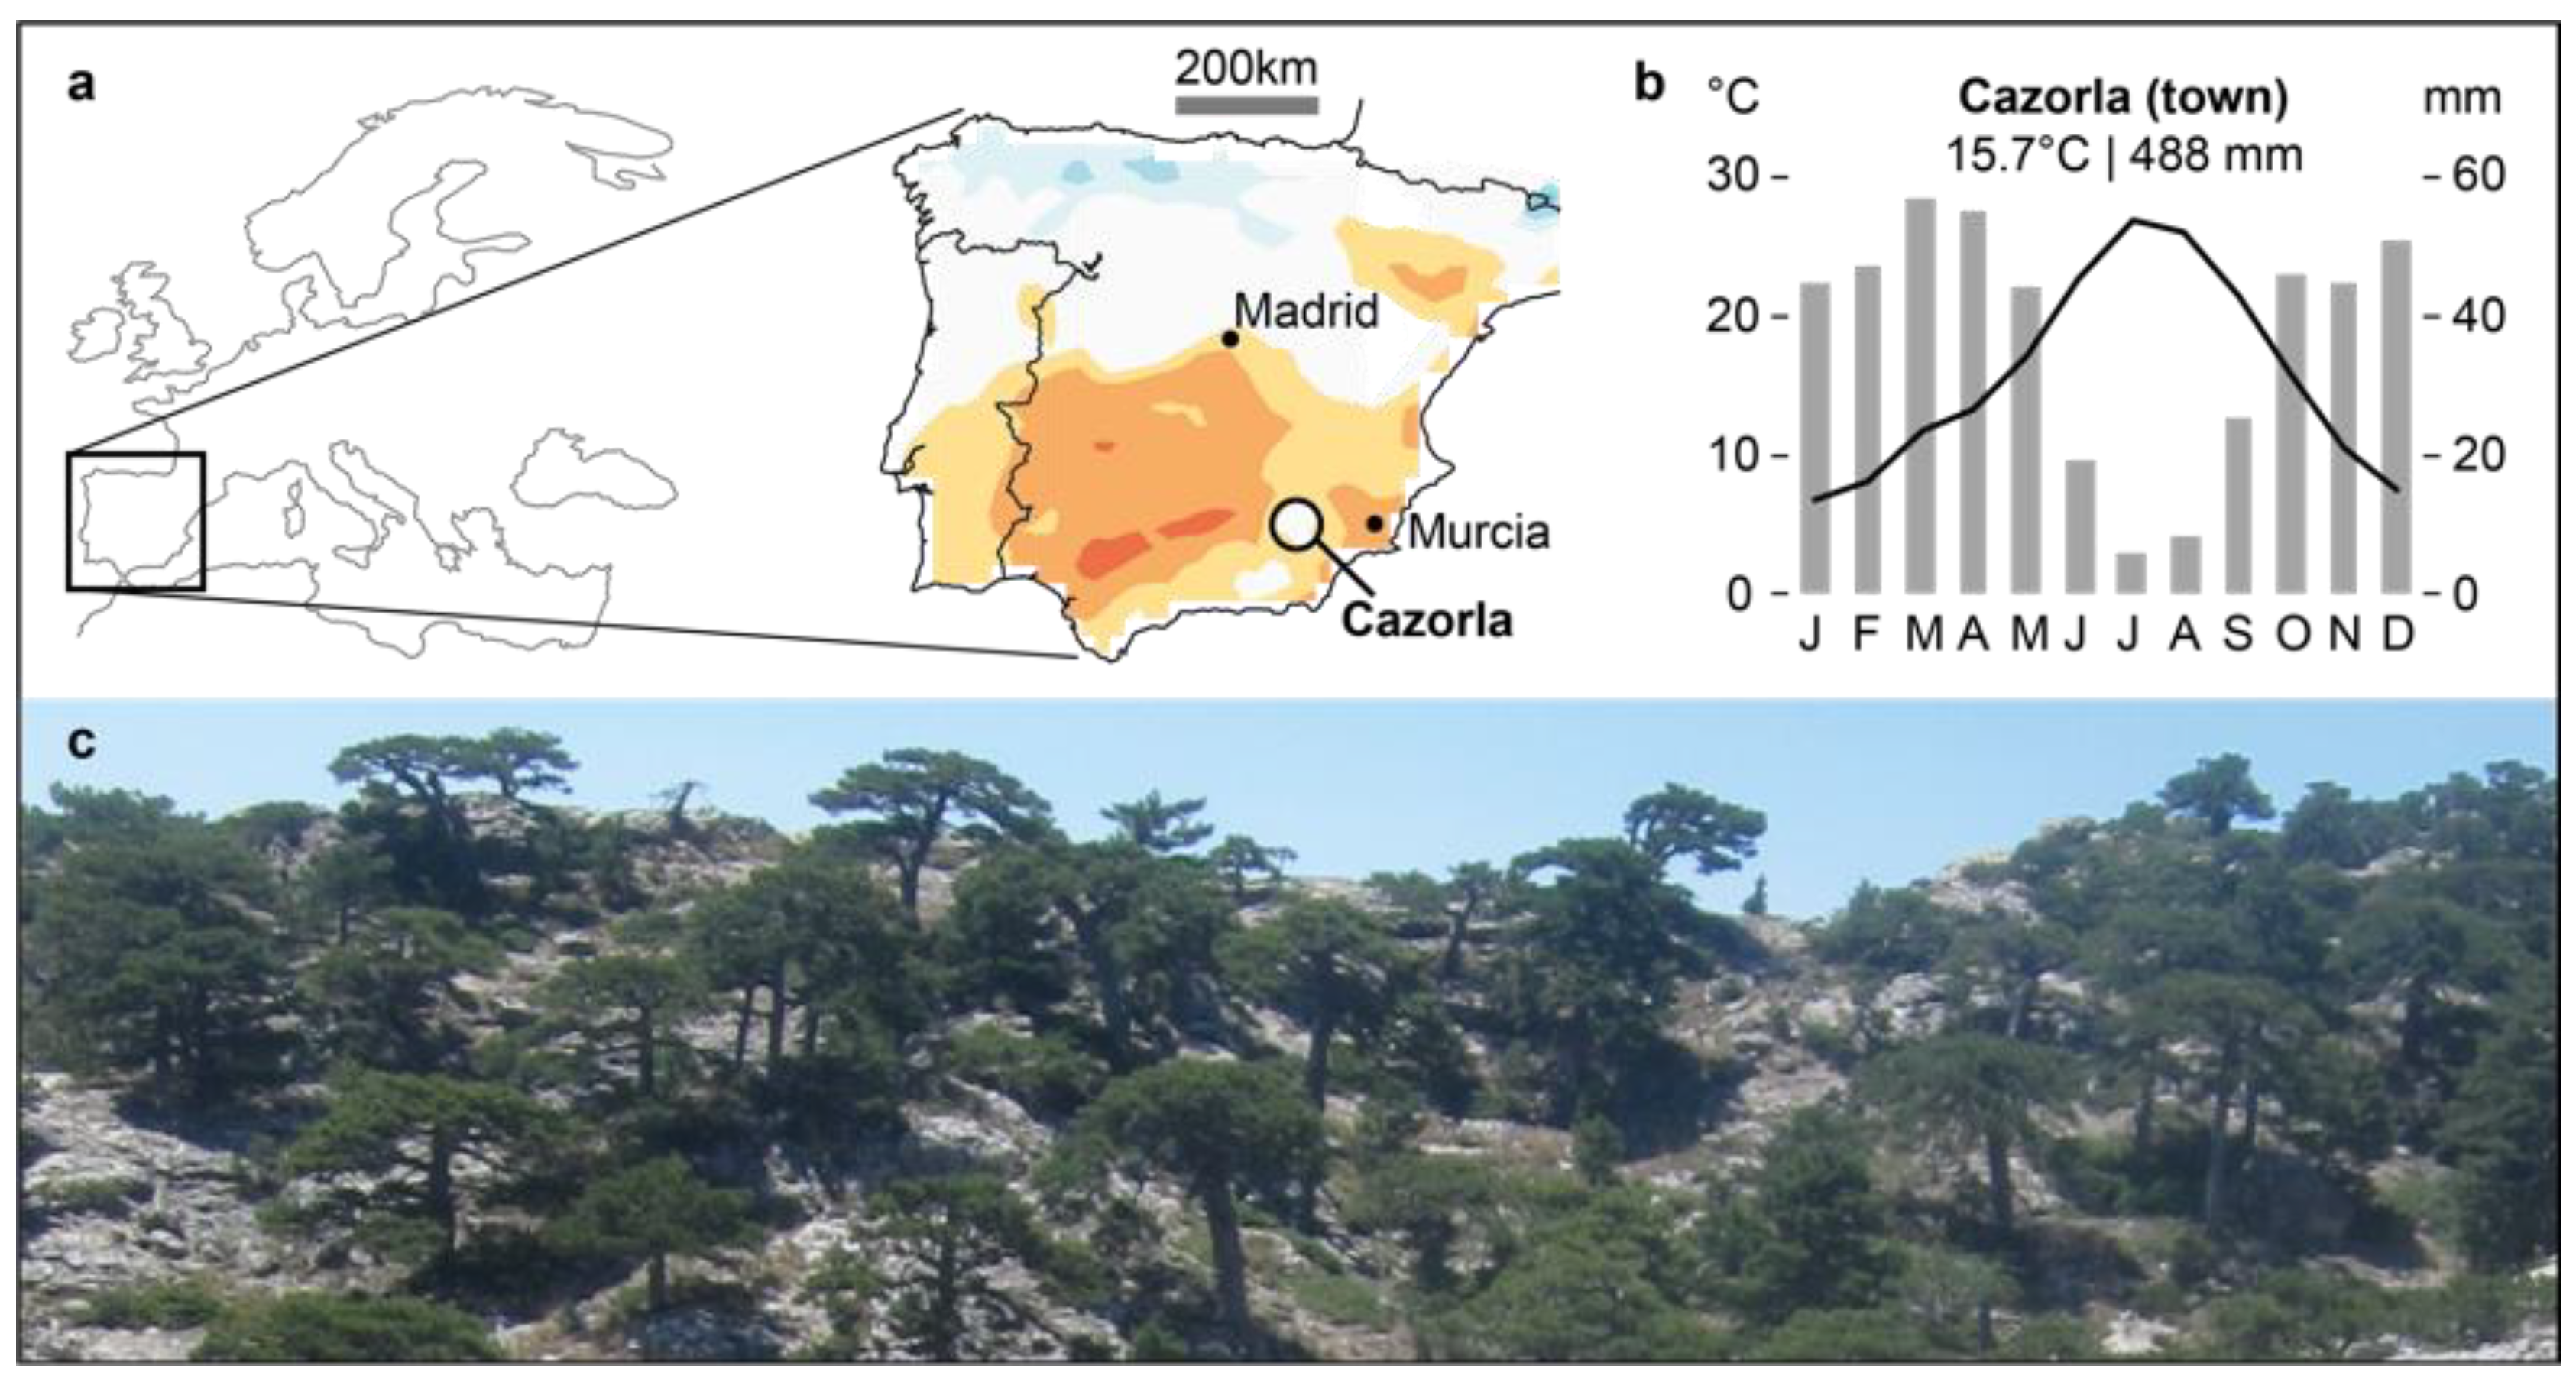
| 37°48’ N, 2°57’ W | |||
| 1800–2000 m a.s.l. | |||
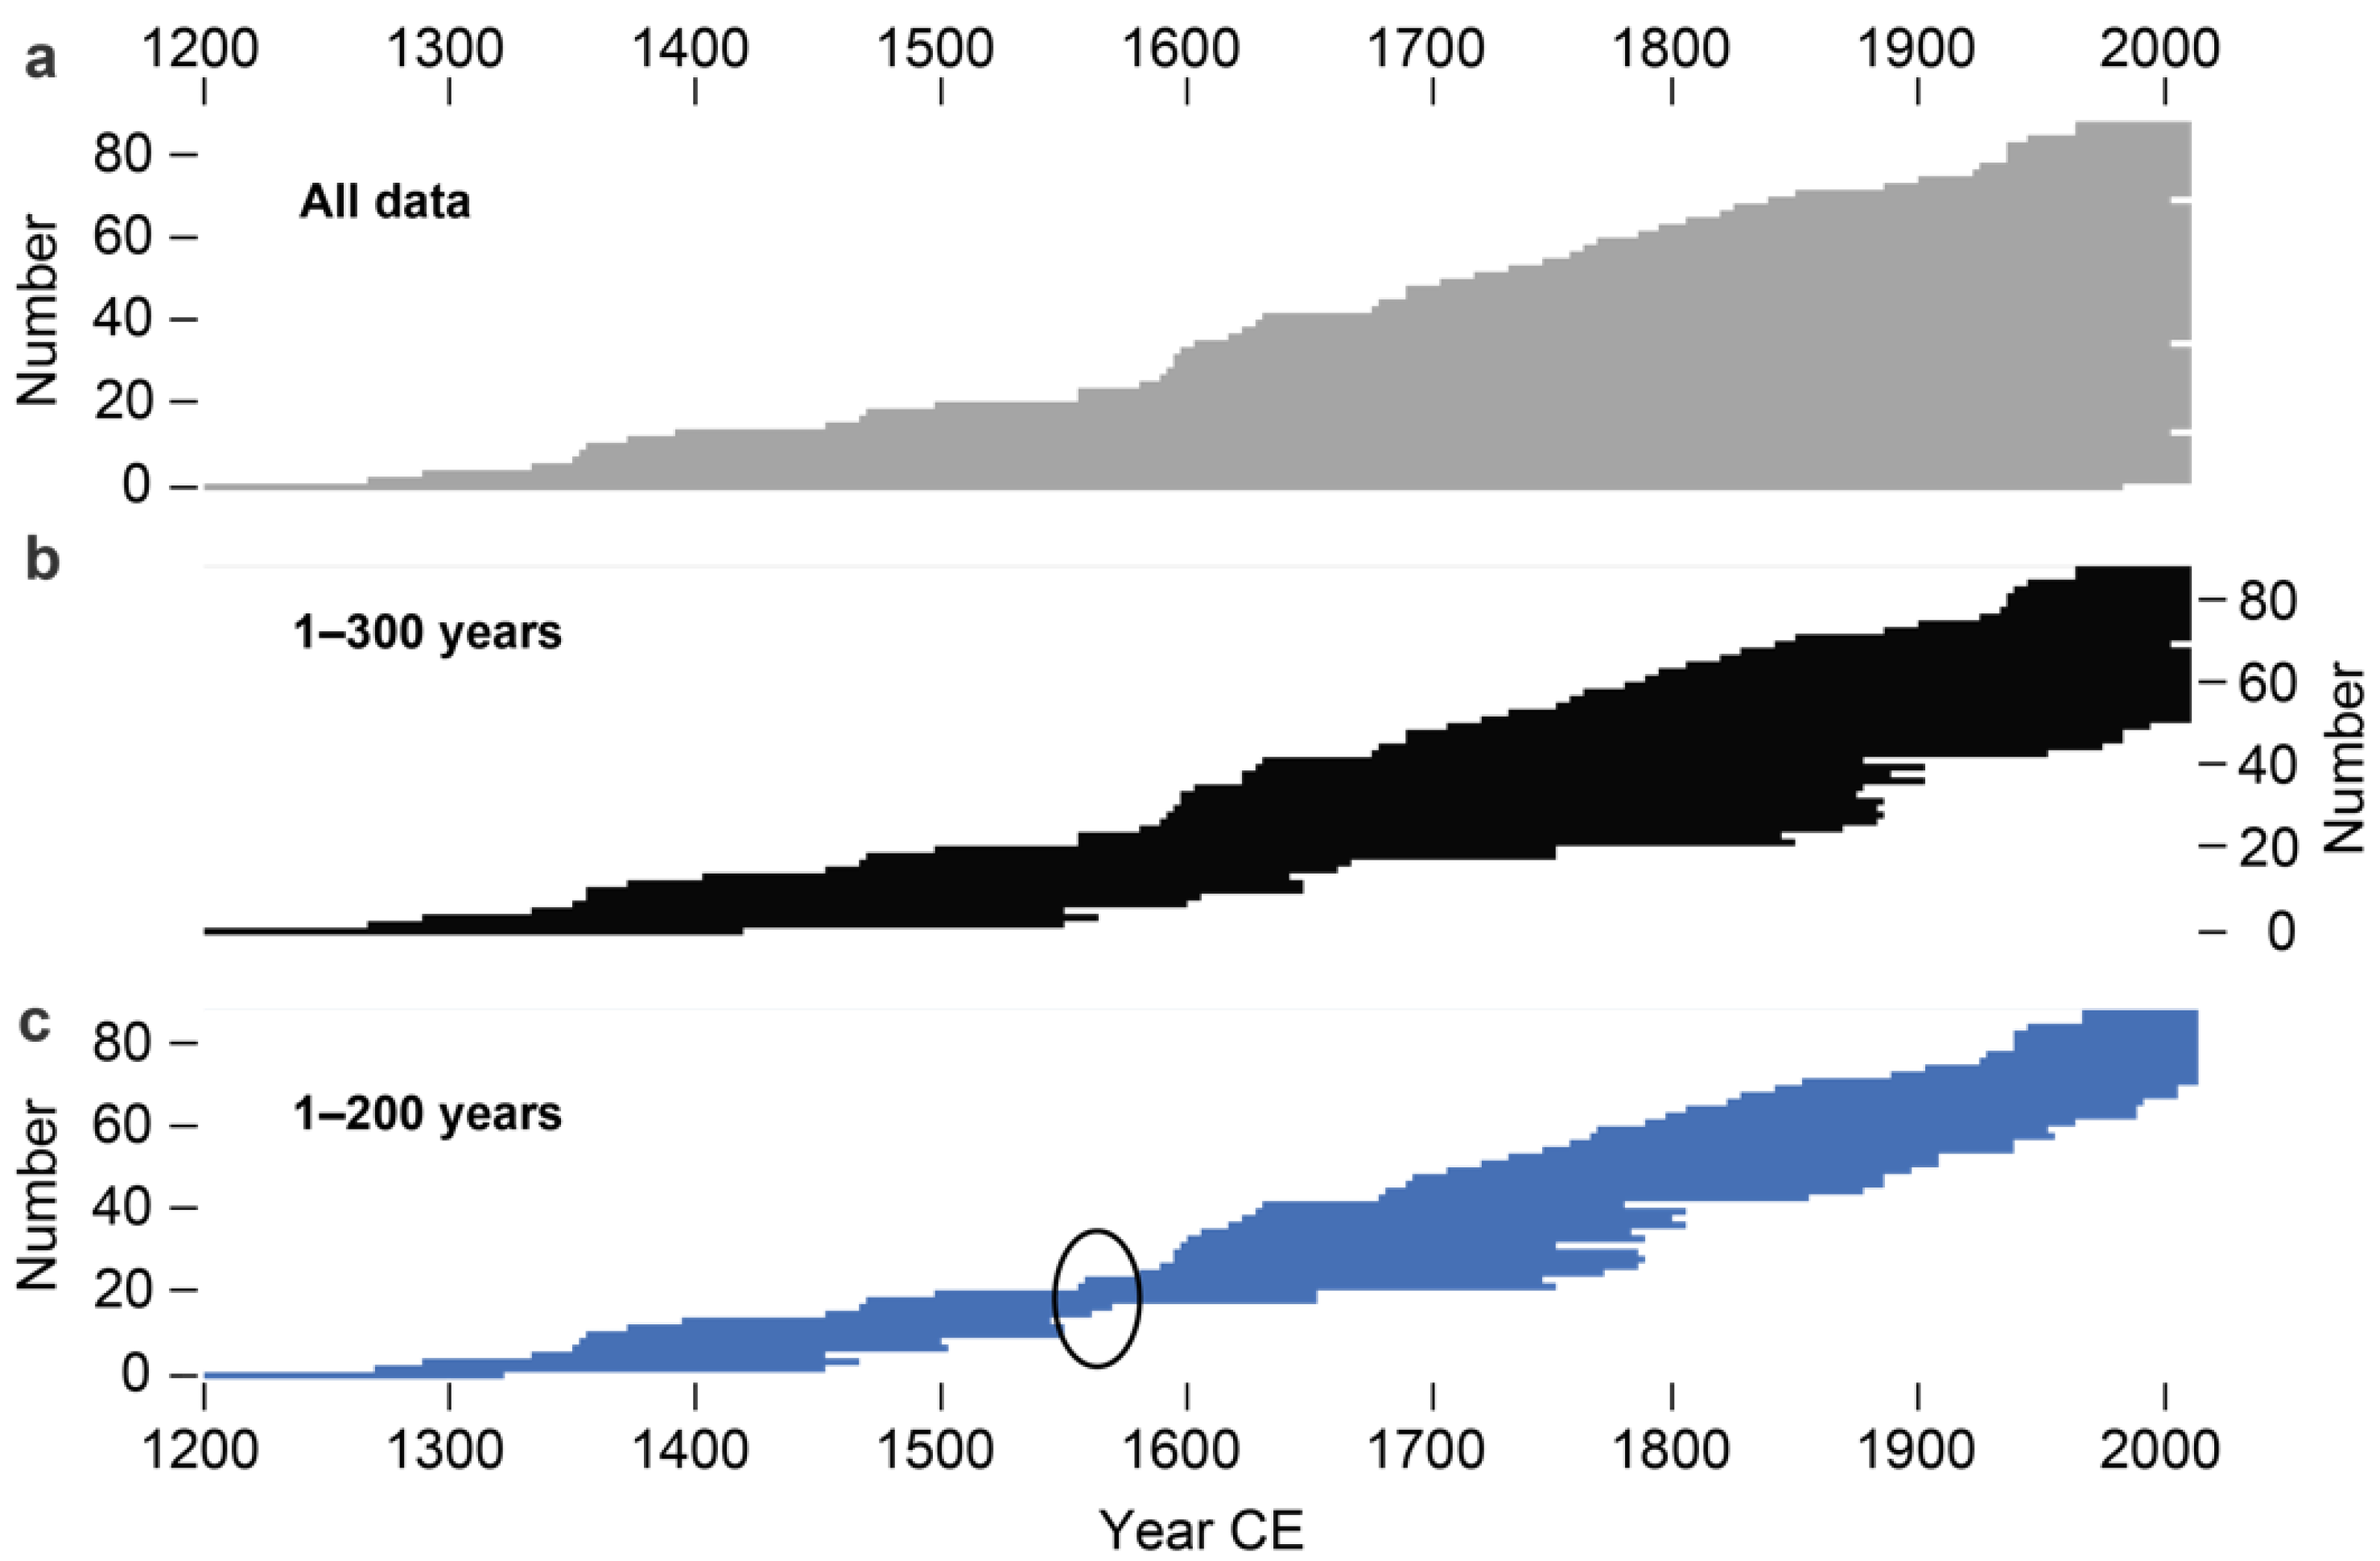
| 1196–2014 CE | |||
| 88 radii from 51 trees | |||
| Chronology variants | |||
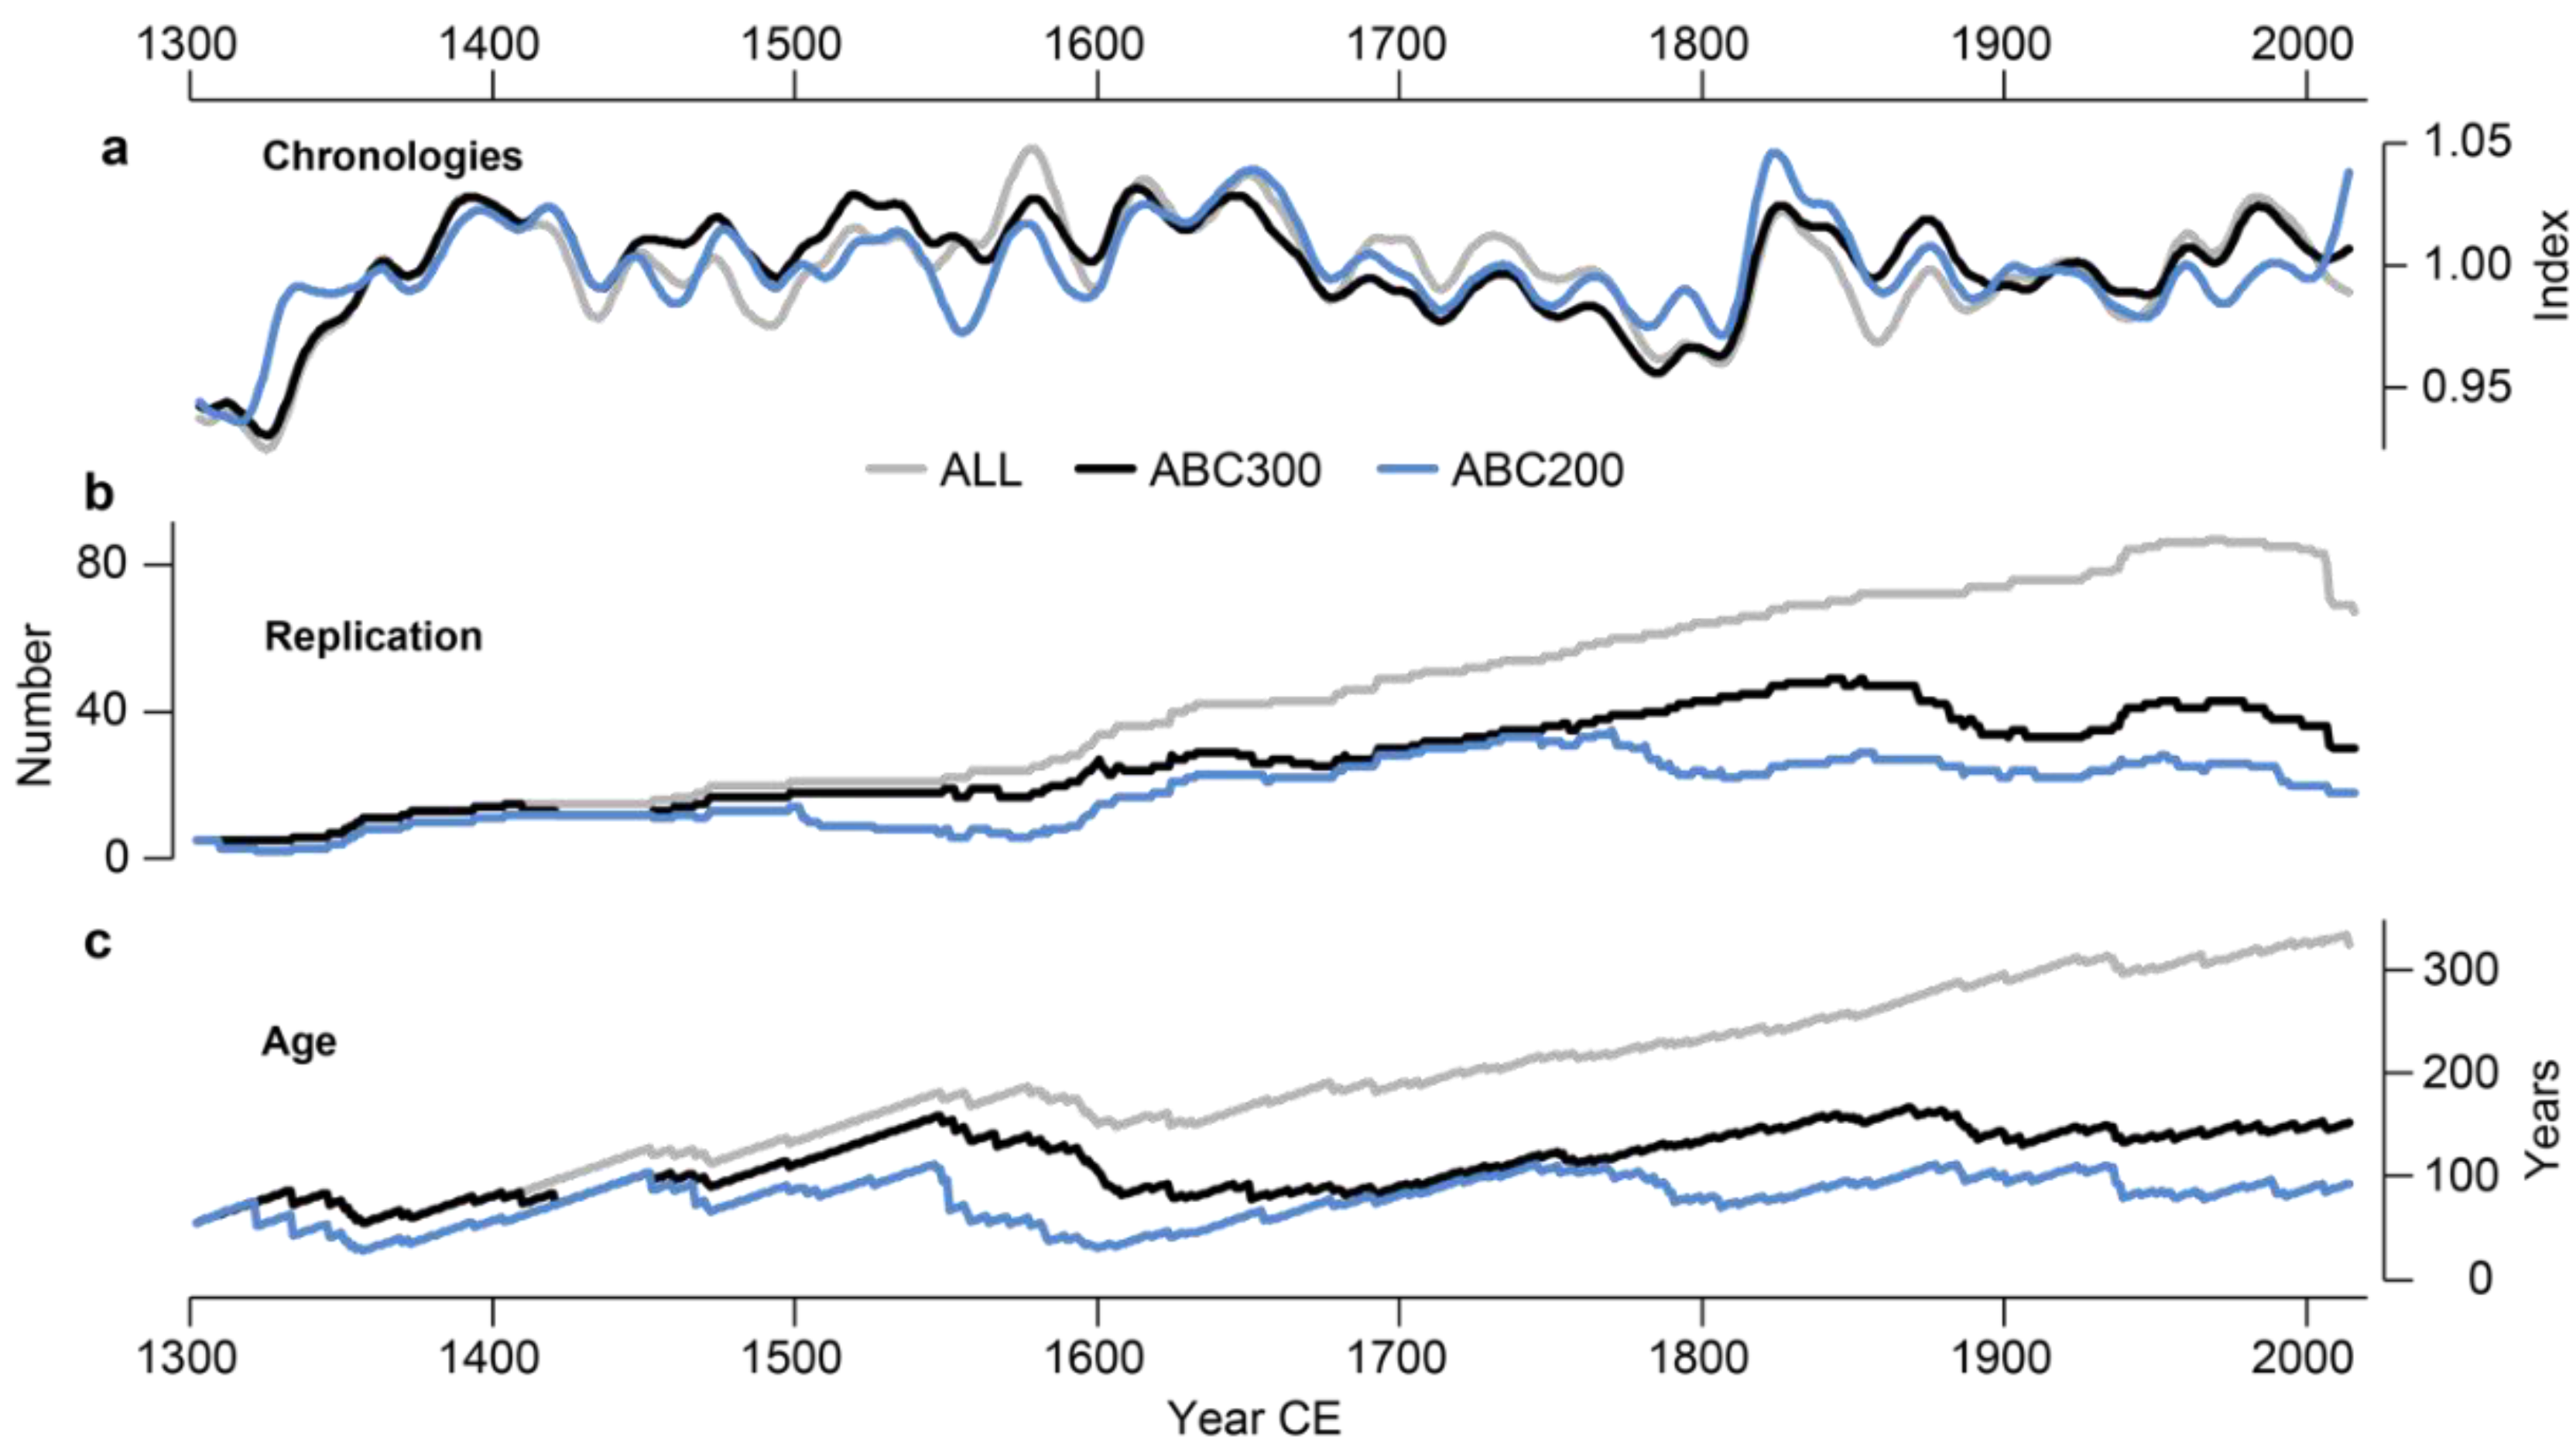
| ALL | ABC300 | ABC200 | |
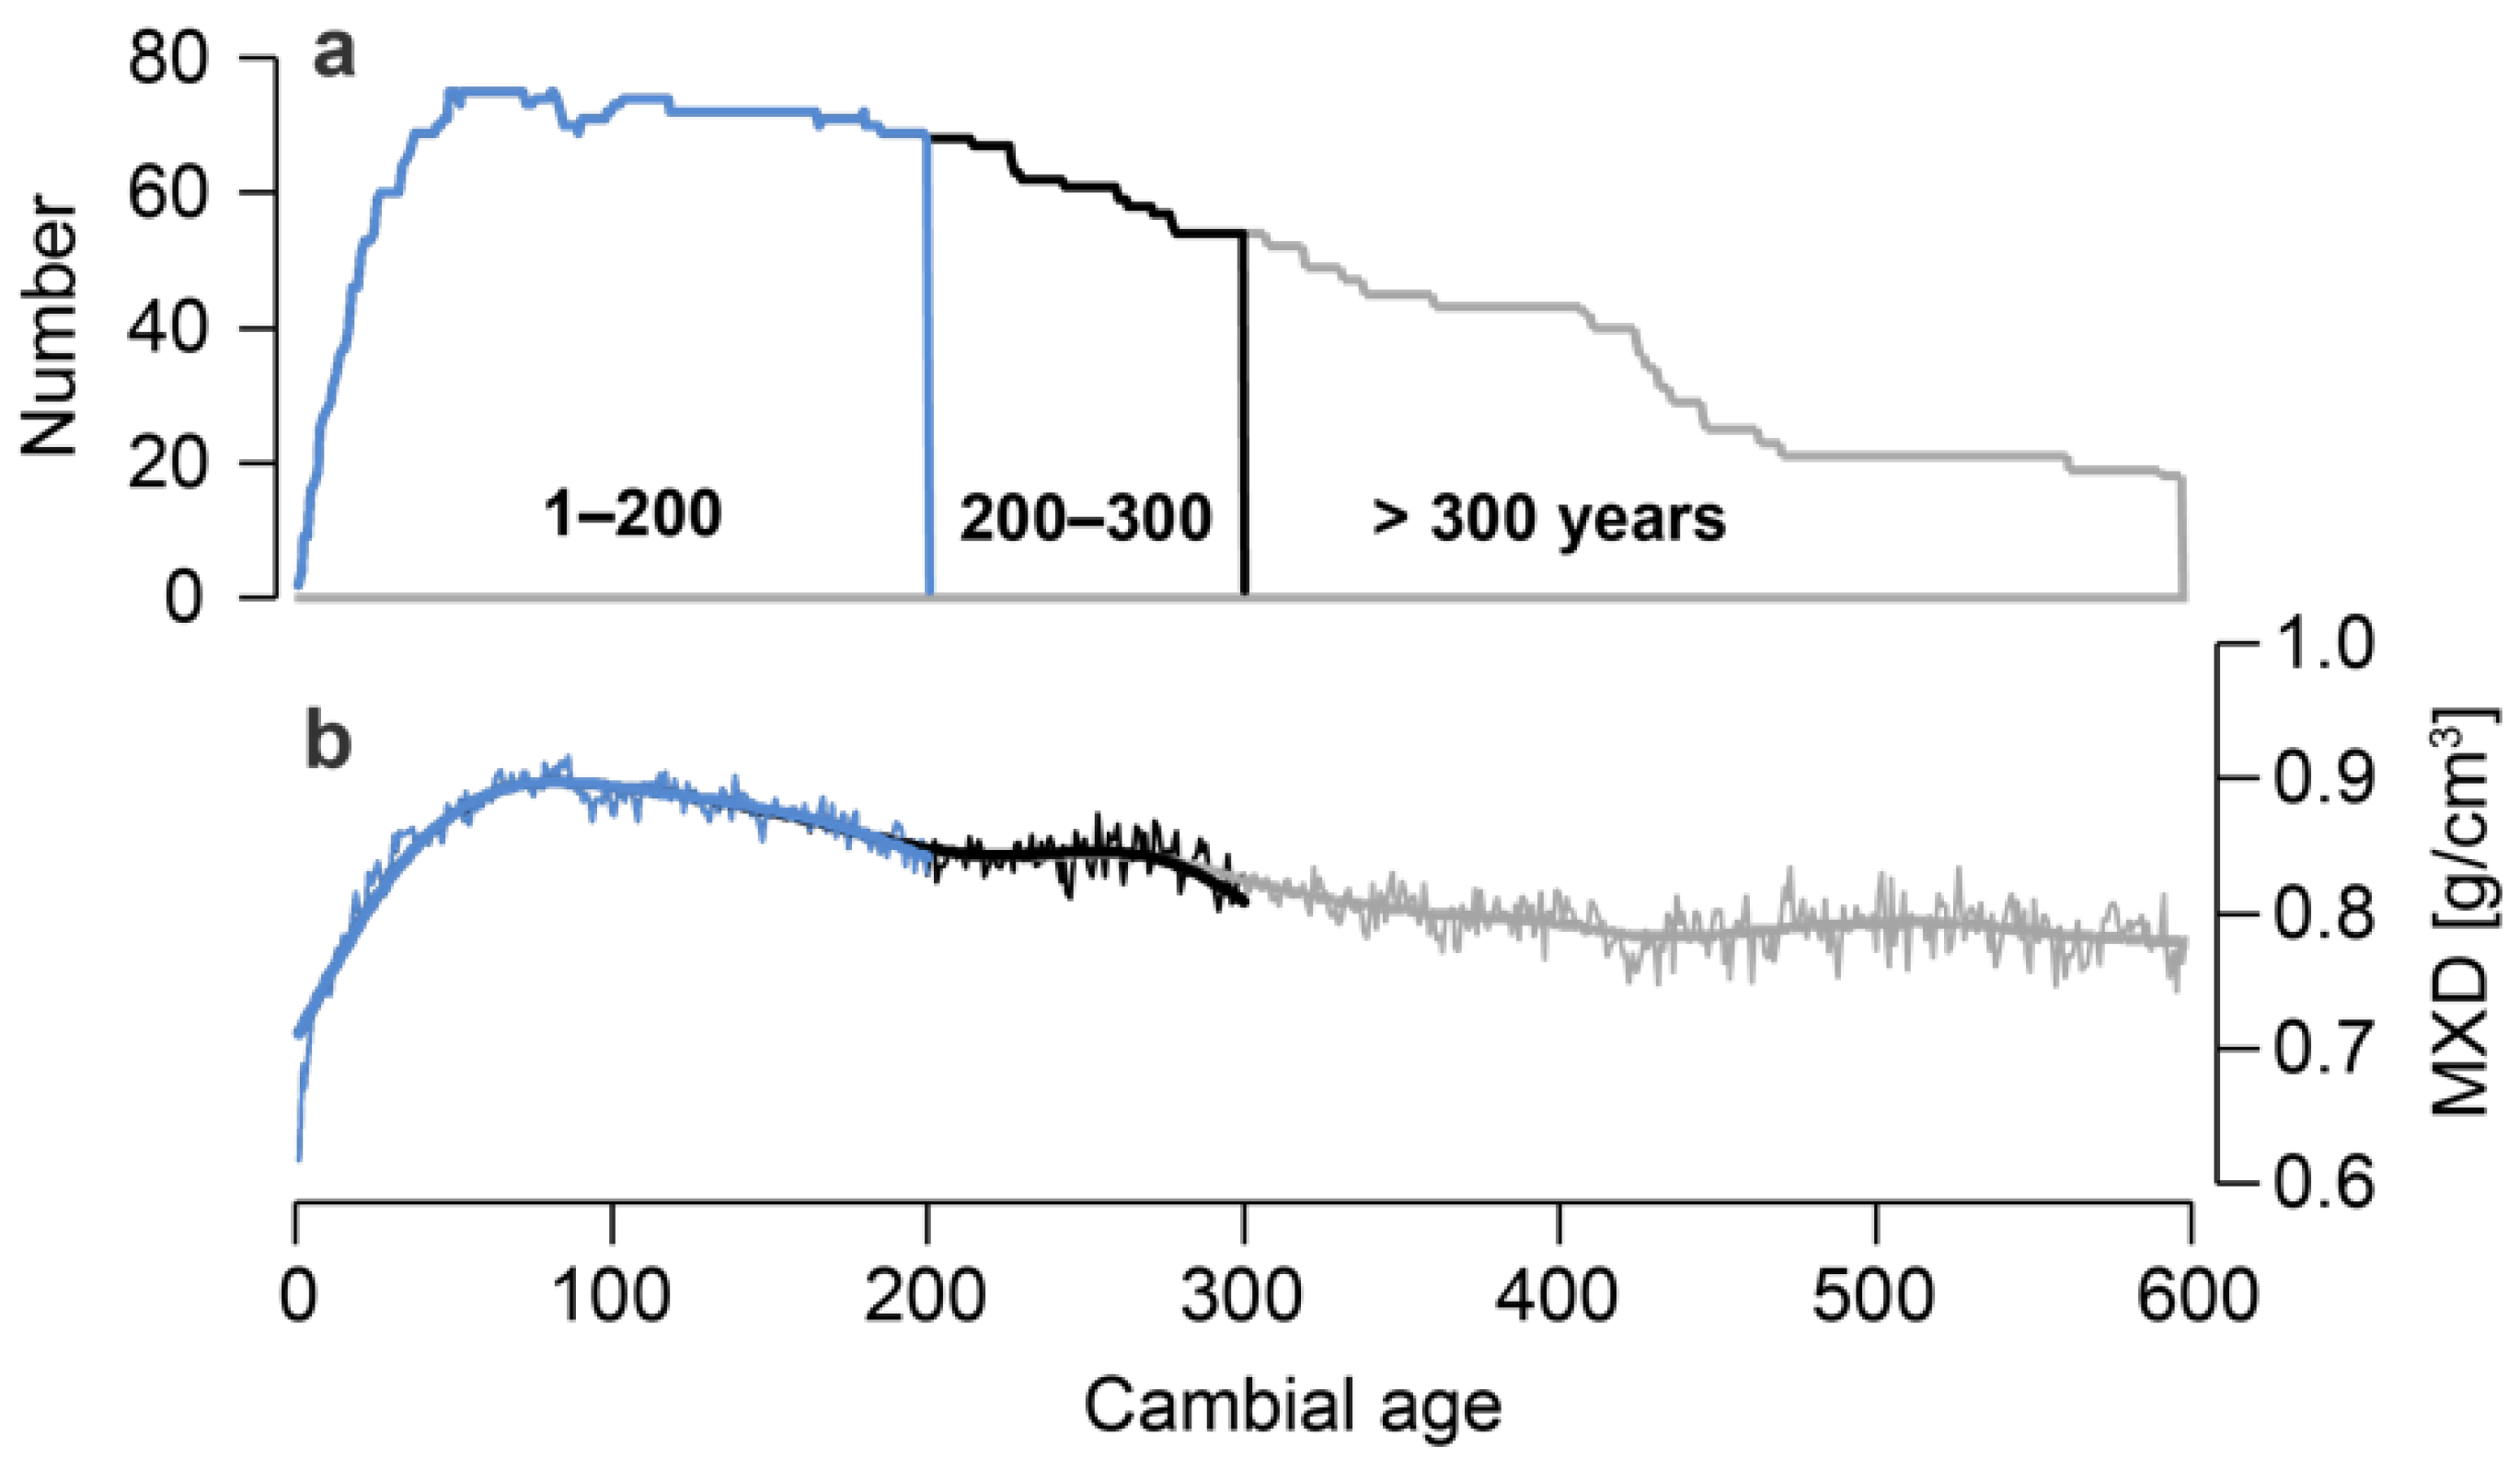
| Mean series length | 355 years | 221 years | 152 years |
| Average MXD | 0.84 g/cm3 | 0.85 g/cm3 | 0.86 g/cm3 |
| Interseries correlation | 0.18 | 0.16 | 0.14 |
| Age trend per 100 years | −0.033 g/cm3 | −0.031 g/cm3 | −0.046 g/cm3 |
| Age range (years) | 101–400 | 101–300 | 101–200 |
| Inhabitants | Distance to Tree Site | Period | Missing Values | Correlation | |||
|---|---|---|---|---|---|---|---|
| horizontal | vertical | with stations | with ABC300 | ||||
| Cazorla | 7000 | 10 km | 1100 m | 1911–2012 | 39 (3%) | 0.49 | 0.32 |
| Jaen* | 113,000 | 75 km | 1350 m | 1922–2014 | 263 (24%) | 0.57 | 0.44 |
| Ciudad Real | 75,000 | 145 km | 1270 m | 1905–2014 | 55 (4%) | 0.66 | 0.46 |
| Albacete* | 173,000 | 150 km | 1210 m | 1905–2014 | 108 (8%) | 0.71 | 0.43 |
| Murcia* | 453,000 | 165 km | 1830 m | 1905–2014 | 33 (3%) | 0.66 | 0.40 |
© 2020 by the authors. Licensee MDPI, Basel, Switzerland. This article is an open access article distributed under the terms and conditions of the Creative Commons Attribution (CC BY) license (http://creativecommons.org/licenses/by/4.0/).
Share and Cite
Esper, J.; Hartl, C.; Tejedor, E.; de Luis, M.; Günther, B.; Büntgen, U. High-Resolution Temperature Variability Reconstructed from Black Pine Tree Ring Densities in Southern Spain. Atmosphere 2020, 11, 748. https://doi.org/10.3390/atmos11070748
Esper J, Hartl C, Tejedor E, de Luis M, Günther B, Büntgen U. High-Resolution Temperature Variability Reconstructed from Black Pine Tree Ring Densities in Southern Spain. Atmosphere. 2020; 11(7):748. https://doi.org/10.3390/atmos11070748
Chicago/Turabian StyleEsper, Jan, Claudia Hartl, Ernesto Tejedor, Martin de Luis, Björn Günther, and Ulf Büntgen. 2020. "High-Resolution Temperature Variability Reconstructed from Black Pine Tree Ring Densities in Southern Spain" Atmosphere 11, no. 7: 748. https://doi.org/10.3390/atmos11070748